A Spatial Assessment of Wildfire Risk for Transmission-Line Corridor Based on a Weighted Naïve Bayes Model
 Kunxuan Xiang
 You Zhou
 Enze Zhou
 Junhan Lu
 Hui Liu
 Yu Huang
- 1School of Electrical and Information Engineering, Changsha University of Science and Technology, Changsha, China
- 2Electric Power Research Institute, Guangdong Power Grid, Guangzhou, China
In order to improve the wildfire prevention capacity of transmission lines, a wildfire risk assessment method for transmission-line corridors based on Weighted Naïve Bayes (WNB) is proposed in this paper. Firstly, the importance of 14 collected types of wildfire-related factors is analyzed based on the information gain ratio. Then, the optimal factors set and the most accurate sampling table are constructed by deleting the factors in the lowest order of importance one by one. Finally, the performance of the WNB model is compared to that of NB and BNW models according to the ROC curve and visualization. A total of 76.36% of fire events in 2020 fell in high-risk and very-high-risk regions, indicating the acceptable accuracy of the proposed assessment method of wildfire risk.
Introduction
The continuously growing economy has brought a higher demand for electricity in China in recent years. Under the background of “power transmission from west to east”, cross-regional high-voltage transmission lines achieve the demand for long-distance power transmission. However, transmission-line corridors have to extend to and/or through areas suffering from high risks of wildfires (Song et al., 2012; Zeng, 2009). Once a wildfire is ignited near a transmission line, the burning of vegetation produces high temperatures and a high concentration of soot cover, which causes the dramatic decrease of air insulation under the transmission line. Undere these conditions, breakdowns are prone to happen between phase-to-phase or phase-to-ground and cause a tripping failure in the transmission line (Huang et al., 2015). Under the effect of wildfire combustion, the automatic reclosing is difficult to operate successfully, and may even cause multiple trips of transmission lines to induce a cascading grid failure (Hu et al., 2014; Wu et al., 2012).
To reduce the effect of wildfire on transmission lines, a series of wildfire prevention measures have been proposed and carried out domestically and abroad, such as quantitative forecasting, wide-area real-time satellite monitoring, fire-fighting measures, and so on (Lu et al., 2017; Ye et al., 2014). Compared to passive prevention methods, the assessment of the wildfires risk level can effectively improve the implementation efficiency of key wildfire preventions in high-risk areas and reduce the hazards and economic losses caused by wildfires (Wang and Fan, 2016; Liu et al., 2016).
The outbreak of wildfire generally stems from the combined effects of multiple wildfire-related factors. Scholars have formulated a series of quantitative risk assessments based on wildfire-related factors. Early forest fire risk assessments in China are only focused on meteorological factors. The temperature, humidity, precipitation, and wind speed are used to predict the weather and wildfire behaviors (Xu et al., 2016). However, besides the meteorological factors, other wildfire-related factors, such as vegetation types, land-usage types, and fire-spot density also contribute significantly to assessing fire risk. State Grid Corporation of China has issued drawing guidelines for regional distribution maps of wildfires near overhead transmission lines. In this guideline, fire-spot density factors combined with vegetation burning hazard levels are used to assess and classify the risk level of wildfires in the transmission-line corridors (QGDW11643, 2016). However, these three wildfire-related factors are considered to have the same contribution to the risk assessment of wildfires. The Analytic Hierarchy Process is widely used to differentiate the importance of factors, but it relies too heavily on the subjective experiences gathered by questionnaires (Wang and Wang, 2016; Zhu et al., 2016). BP neural network can improve the accuracy of the model by continuously correcting the weight of factors. Liu et al. proposed a wildfire risk assessment method based on the BP neural network (Liu C. X. et al., 2017), but this method requires a huge amount of data as the basis for modeling. The Bayesian Network (BNW) can effectively integrate prior knowledge and objective evidence to solve the uncertainty of wildfire risk assessments based on mathematical statistics and graph theory. However, its complex network structure also easily leads to a reduction in computational efficiency (Dlamini, 2010). The use of Naïve Bayes (NB) based on conditional independence has the advantage of promoting computational efficiency, but neglecting the relationship between the wildfire-related factors could bring the curse of dimensionality and reduce the evaluation accuracy (Chen et al., 2021).
In this paper, a method is established based on Weighted Naïve Bayes (WNB) for assessing the wildfire risk of transmission-line corridors. First, 14 types of wildfire-related factors are screened out. The data of wildfire-related factors is collected and pre-processed in the four southern provinces of China (Yunnan, Guizhou, Guangxi, Guangdong) with grids of 1 km × 1 km. Then the weights of factors are obtained based on the entropy method to weaken the independence assumption of Naïve Bayes (NB). Combining with the most accurate sampling table (MAST), an optimal WNB model is constructed to calculate the wildfire risk probability of the grids in the research area. For visualization, the wildfire risks are graded based on the geometric interval classification. Finally, the performance of WNB is compared to that of BNW and NB models.
Study Area and Data Collection
Study Area
Four provinces in the south of China, Yunnan, Guizhou, Guangxi, and Guangdong, were selected as the study area. They all belong to subtropical and tropical monsoon climates, being generally rainy with high temperatures which, are suitable climatic conditions for the growth of multiple forests. Specifically, the Yunnan-Guizhou plateau has high vegetation coverage and extensive karst landforms with a sparse population. From January to December in 2020 a total of 825 fire-spots were monitored. Once a fire is ignited, it is difficult to put it out quickly and is prone to spread.
Wildfire-Related Factors
Wildfire ignition requires three preconditions: a fire source, sufficient combustibles, and a suitable environment for fire. Fire sources are generally divided into artificial and natural fire sources. Statistics show that more than 90% of wildfires are caused by human activities, both intentionally and unintentionally. Therefore, this paper chooses five factors to represent the impact of human activities, including Distance from Settlements (DS), Distance from Roads (DR), fire-spot density, Gross Domestic Product (GDP), and population density. Combustibles means vegetation types and their coverage on the underlying surface. This paper selects four factors, land-usage type, vegetation type, fuel load, and Normalized Difference Vegetation Index (NDVI), to represent the influence of the underlying surface. Fire-environment mainly refers to weather conditions and topography. Annual precipitation and annual temperature are selected. And elevation, slope and aspect are used to represent the topographic factors. The chosen factors are listed in Figure 1.
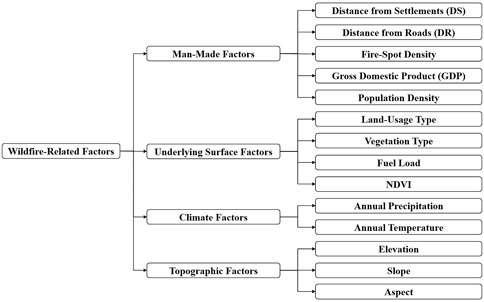
FIGURE 1. Wildfire-related factors classification.
Data Pre-Processing and Discrete Classification
The study area is first divided into 1 km × 1 km grids. The data of wildfire-related factors are provided by the Resource and Environmental Science and Data Center and the National Meteorological Center, which are extracted by using ArcGIS software. Among them, land-usage type and vegetation type are discrete variables, and the remaining factors are continuous variables. The sample set of fire spots is formed by the latitude and longitude of monitored fire-spots from 2010 to 2019, which are provided by the National Meteorological Center. The sample set of non-fire-spots is constructed by random sampling within the study area. To avoid the overlap of fire-spot and non-fire-spot samples, only grids at least 3 km away from fire-spot samples can be used as non-fire-spot samples.
During the factor collection procedure, the data of DS, DR, elevation, slope, and aspect are calculated by using Digital Elevation Model (DEM). And the data of fire-spot density needs further calculation (Chen et al., 2021), as follows.
step 1 The study area is meshed with 0.25 km × 0.25 km precision. The area of a single grid is calculated based on its longitude and latitude, as shown in formula (1–3).
where
Step 2 The number of fire spots falling on each grid is counted as
where the
Step 3 To meet the requirement of spatial resolution, the fire-spot density to a resolution of 1 km × 1 km by using the Kriging interpolation algorithm.
To accelerate the calculation efficiency of Bayes models, the data of all wildfire-related factors for both fire-spot and non-fire-spot samples are graded into four classes. The grading standard is to maximize the difference between the groups of samples. Taking the data of elevation as an example, the frequency distributions of wildfire-related factors are firstly calculated and compared for the two groups of samples, as shown in Figure 2. Secondly, all intersections of the distribution curves were found. These intersections can divide data distribution into several intervals, which means the change of probability for wildfire occurrence. For example, when the elevation is lower than 605 m, or between 1,105 m and 1,745 m, there is a greater probability of wildfire occurrence. Thirdly, for the factors of which the number of intersections is more than three, the adjacent intervals are then combined to reduce the final classes number into four.
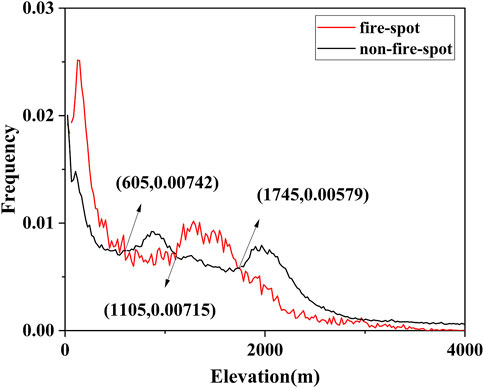
FIGURE 2. The frequency distribution of elevation.
For the wildfire-related factors with discrete data, the classes are simply formed by their natural property or their attribution to wildfire occurrence. The specific grading standards are summarized in Supplementary Tables S1, S2, S3.
Importance of Wildfire-Related Factors
Among the selected 14 wildfire-related factors, some of the factors may contribute little to the risk assessment and cause data redundancy, which increases the model complexity and decrease the accuracy. Thus, the factors are ranked by contribution importance based on the information gain ratio. By deleting the lowest factors of the rank singly, the optimal factor set is selected according to the accuracy results of the model.
Information Entropy and Information Gain Entropy
In 1948, the mathematician C. E. Shannon first proposed the concept of Information Entropy. The larger the information entropy is, the larger the uncertainty of the information source it represents. However, the size of information entropy often cannot reflect the importance of the information contained in the system.
In order to reflect the degree of characteristic information brought to the system, the Information Gain Entropy, which is the difference between the entropy of the set to be classified and the conditional entropy of a selected feature, was used.
Information Entropy
To calculate information entropy, the fire-spot samples, as well as the same amount of non-fire-spot samples are selected. And the information entropy of wildfires is calculated by formula (5):
where
Information Gain Entropy
In a wildfire event, the information gain entropy represents the reduced uncertainty degree of the factor information, which is recorded as
where
Information Gain Ratio
When the number of factor samples data is large, the information gain entropy is also larger. In order to eliminate the influence of the number of samples, the information gain ratio is proposed (Xiong et al., 2014). It avoids the overfitting of factor data by offsetting the complexity of factor variables.
where
Importance Rank of Wildfire-Related Factors
The calculated information gain entropy and information gain ratio of factors are listed in Table 1.
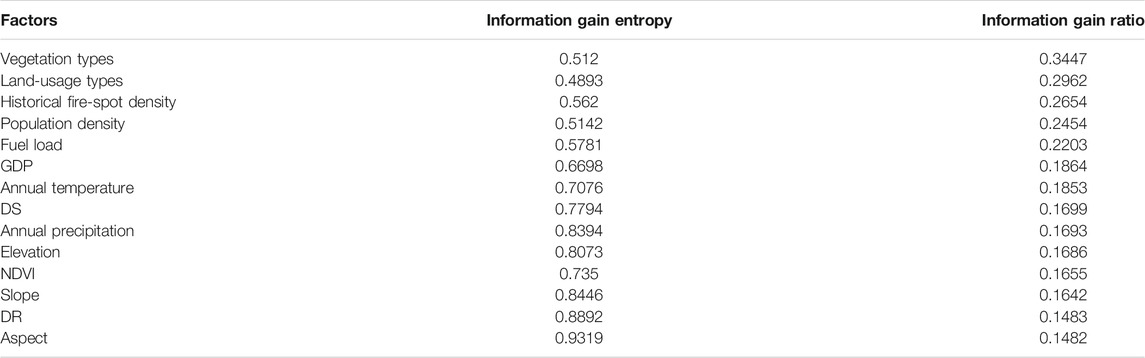
TABLE 1. Importance of wildfire-related factors.
Vegetation type, land-usage type, and historical fire-spot density are the three most important factors in affecting the occurrence risk of wildfire. It is because that the vegetation type and land-usage type can indicate the degree of fuel whereas the historical fire-spot density represents the high incidence of wildfires. The DR and the aspect are the factors with the least influence on the wildfire occurrence.
Methodology
Weighted Naïve Bayes
Bayes theorem calculates the posterior probability of events by combining the prior probability and conditional probability, as follows (Qu et al., 2016; Zhao et al., 2013; Ma et al., 2013).
where
Due to the conditional independence, the NB model has advantages of higher operating efficiency, faster speed, and a simple structure compared to BNW. But absolute independence does not exist in reality. The WNB model assigns different weights to nodes to strengthen the connections between nodes. In this way, the assumption of the independence of NB can be weakened (Huang et al., 2015; Lee, 2015; Liu R. et al., 2017; Tang et al., 2018; Ji et al., 2019). The structures of BNW, NB, and WNB models are shown in Figure 3.

FIGURE 3. WNB, NB, and WNB classifier structure.
The posterior probability in WNB is defined as the weighted product of the conditional probabilities of factors, as shown in formula (10).
According to the wildfire risk assessment of the transmission corridor based on NB [16], the conditional probability of factors under fire or non-fire conditions is obtained.
where
Finally, the weighted Bayesian posterior probability of wildfire occurrence
Weight Calculation
The weights are often obtained by subjective or objective methods. With subjective methods, the value of weights is strongly affected by the knowledge and experience of surveyed experts, which may introduce larger errors to the model. Therefore, the entropy method is used to objectively evaluate and weight the factors in the WNB model.
In the information entropy theory, a smaller information entropy indicates a larger variation of the factor value with more information. Based on the information entropy theory, the weight is determined by the information entropy of the factor.
Step 1 The data of factors is normalized by
where
Step 2 The entropy value
where
Step 3 According to the information entropy
The entropy weight
Framework Conceptualization
The framework of the WNB-based wildfire risk assessment model is as shown in Figure 4.
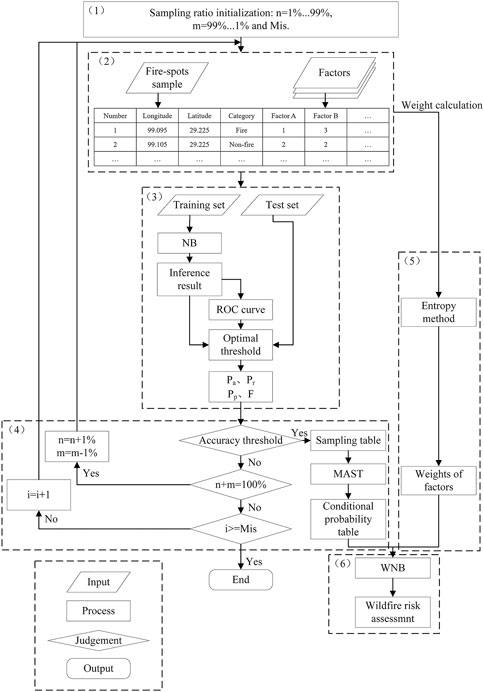
FIGURE 4. The wildfire risk assessment model framework on WNB.
1) Initialize the sample table, that is the proportion
2) Extract the fire-spot samples and non-fire-spot samples, and the value of wildfire-related factors in 1 km × 1 km grids by using ArcGIS 10.4.
3) Establish a training set and a test set for the model. The training set is formed by randomly selecting 75% of the fire-spot and non-fire-spot samples. The test set is formed by the remaining 25% of the samples. Naïve Bayes conditional probability is estimated based on the training set. And the optimal threshold is determined by observing the Receiver Operating Characteristic (ROC) curve to establish the confusion matrix, as shown in Supplementary Table S4.
The accuracy
Considering the higher tolerance of the fake wildfire events for power grids,
4) Set the thresholds of
5) Calculate the factor weights by using the entropy method.
6) Establish the WNB-based wildfire risk assessment model, by combining the conditional probability and factor weight.
Results and Discussion
According to the importance rank of information gain ratio, some factors contribute little to the wildfire risk assessment. Therefore, the factor with the lowest information gain ratio is deleted one by one to obtain the Optimal Factor Set (OFS). The optimal WNB model is then established by the OFS. At the same time, an NB model, as well as a BNW model with the same factors, are established for comparison.
The Optimal Factors Set and the Most Accurate Sampling Table
The entropy weights of wildfire-related factors during the formation of OFS are shown in Table 2.
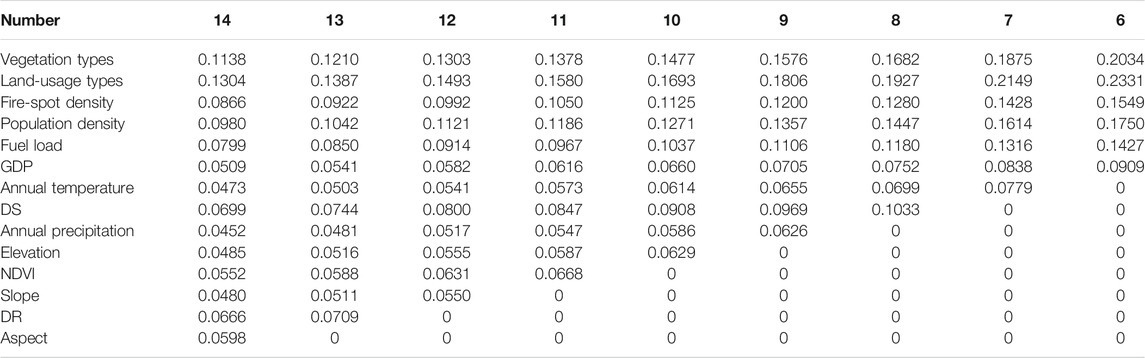
TABLE 2. Entropy weight under different factors.
The performance of the WNB models under different factor sets is compared by using the 825 new fire-spot samples and an equal number of non-fire-spot samples in 2020. With the optimal threshold, the performance measures of the model under different factor sets are shown in Figure 5.
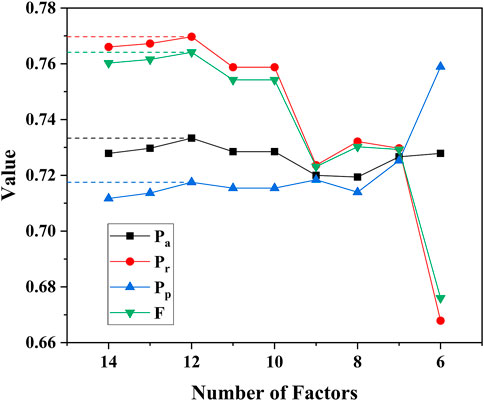
FIGURE 5. The accuracy
As can be seen from Figure 5, the two factors of aspect and DR have been deleted, and the
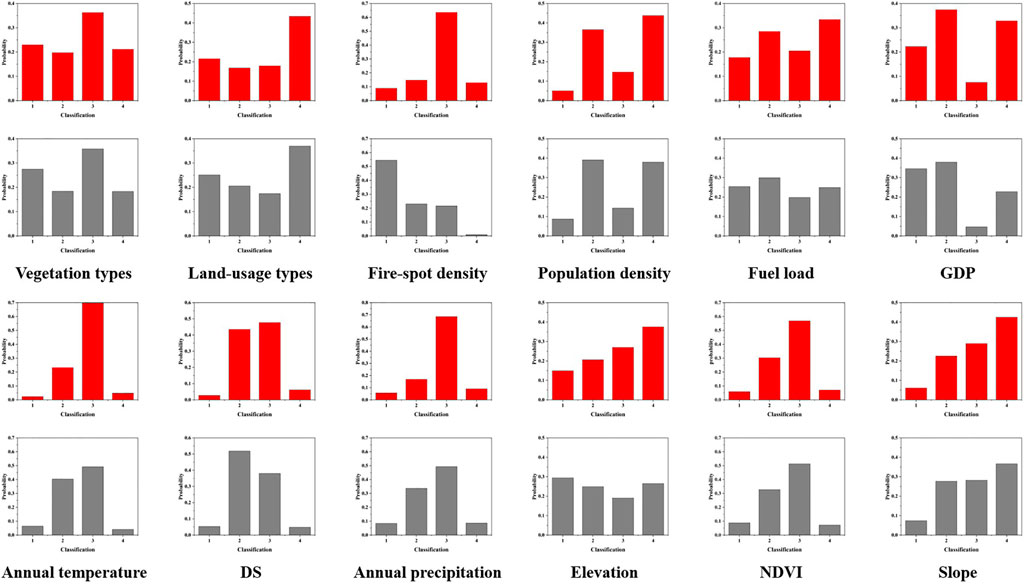
FIGURE 6. The conditional probability table of fire and non-fire (Red is fire and gray is non-fire).
The conditional probabilities of factors under fire and non-fire conditions differ from each other, indicating different effects on the wildfire. Therefore, these 12 types of wildfire-related factors can be used to evaluate the wildfire risk of the research area.
Comparison of BWN, NB, and WNB
The BNW can solve the uncertainty of evaluating wildfires by combining the prior conditional probability and the relationship between factors (Jiang et al., 2016; Albuquerque et al., 2017; Bates et al., 2021). However, the network complexity may be time-consuming and storage-consuming of the model. The NB, based on the assumption of conditional independence, can improve computational efficiency but sacrifices the predicting accuracy. By adding the different weights into factors, the WNB could compensate for the influence of different factors on the results and form a budget method with both plausibility and efficiency. In order to compare the assessment performance of the proposed WNB model, a BWN model and an NB model are also established based on OFS.
Wildfire Risk Assessment Model Based on BNW and NB
To build a BNW-based wildfire risk assessment model, the appropriate BNW structure should be established firstly (Sevinc et al., 2020; Penman et al., 2020; Wu et al., 2018). The BNW structure consists of factor nodes, connecting lines, and arrows. The data of factor nodes are provided by the most accurate sampling table, which guarantees the optimal state of nodes. The connection line and arrow are determined by the causal correlation of two nodes. The relationship between wildfire-related factors is obtained by Pearson correlation analysis (Supplementary Table S5). When the absolute value of a Pearson coefficient is higher than 0.1, it is considered to have a certain relationship between two factors. For example, the Pearson coefficient between GDP and population density is 0.719, indicating a strong positive correlation between the two factors. According to the literature, population density affects the distribution of GDP, so the arrow points from population density to GDP. The connecting lines and arrows between the factors in BNW, as well as the prior probability between factor nodes, are obtained, shown in Figure 7.
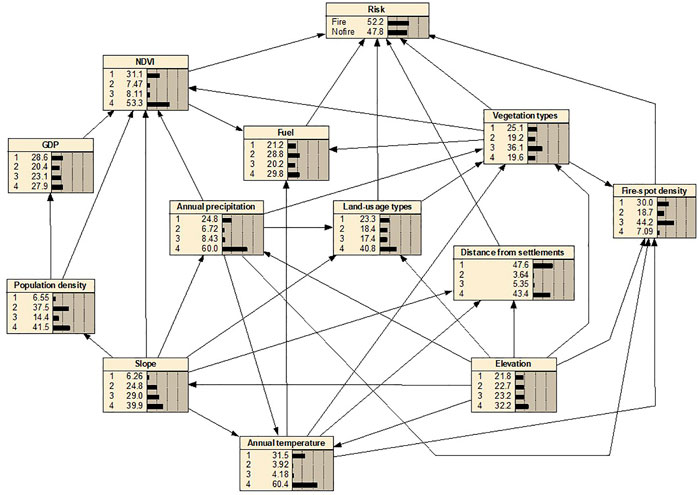
FIGURE 7. The model framework based on BNW.
The structure of the NB model is much simpler, in which all factor nodes only points to fire events node, as shown in Figure 8.

FIGURE 8. The model framework based on NB.
Receiver Operating Characteristic Curve
The Receiver Operating Characteristic (ROC) curve is drawn based on a series of binary classification results. In the ROC curve, the True Positive Rate (TPR) is the ordinate whereas the False Positive Rate (FPR) is the abscissa. The Area Under ROC Curve (AUC) can be used to represent the classification performance of the model. The performance of the classifier is better when the AUC is larger. The TPR and FPR are calculated as:
In order to compare the performance of three Bayesian models, fire-spots from 2010 to 2019 and non-fire-spots are randomly extracted in equal proportions to calculate the probability of wildfire. According to the threshold of fire and non-fire, the ROC curves are constructed, as shown in Figure 9.
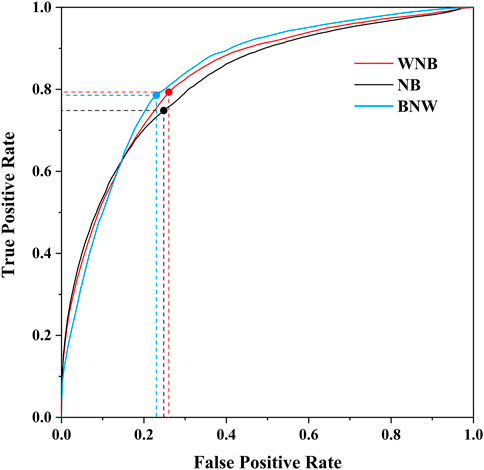
FIGURE 9. The ROC curve of WNB, NB, and BNW.
It can be clearly seen that the AUC of the NB model is the smallest, indicating the worst classification effect. The AUC of the BNW, NB, and WNB classifiers are 0.8446, 0.7973, and 0.8383 respectively. The points marked in curves are the Optimal Division Threshold (ODT). Under the ODT, the TPR of the WNB model and BNW model is nearly identical and is higher than that of the NB model. The FPRs of WNB, NB, and BNW are relatively similar.
According to the analysis of the ROC curves, both WNB and BNW models have a good performance in classifying the fire and non-fire events. But the intercoupling of factors, the establishment, and calculation processes of the BNW analysis is complicated and time-consuming, andthe classification performance of the model strongly depends on the reasonability of structure. The WBN strengthens the effects of important factors and weakens the influence of redundant relationships on model performance by assigning different weights to the factors. It not only considers the interrelationship of factors but also reduces the complexity of calculation. Therefore, the classification performance of the WNB model is similar to that of BNW but has a simple structure and shortened calculation speed.
Wildfire Risk Assessment
By using the established WNB, NB, and BNW models, the posterior probabilities of wildfire risk of the grids in the research area are estimated. And the statistics of probability results are shown in Supplementary Table S6.
The distribution of estimated probabilities by different models is very different in the research area, indicating that the grading method may have an important impact on wildfire risk assessment. Therefore, four different grading methods, that is equal interval, quantile, natural breaks, and geometric interval, are compared. Among them, the equal interval method divides the probability distribution of wildfire risk into four equal sub-ranges. The quantile method allocates division intervals into an equal proportion. The natural breaks method, which was proposed by Jenks (Anchang et al., 2016, suggests that the distribution can be divided into groups with similar nature by the natural turning points or breakpoints between any series of populations. It collects the greatest similarities inside the groups, and used the greatest difference to separate the groups. The principle of the geometric interval method is to establish segmentation hyperplanes by maximizing the distance between the hyperplane and the nearest sample (Peng and Wang, 2009).
By using the grading methods, the wildfire risk of grids is then classified into four levels, Low-risk, Medium-risk, High-risk, and Very-high-risk, based on the results of poster probability. For comparison, the fire spots in 2020 are used as the criterion to identify whether they fall into a region with high-risk or very-high-risk levels. The accuracy of the four grading methods is shown in Figure 10.
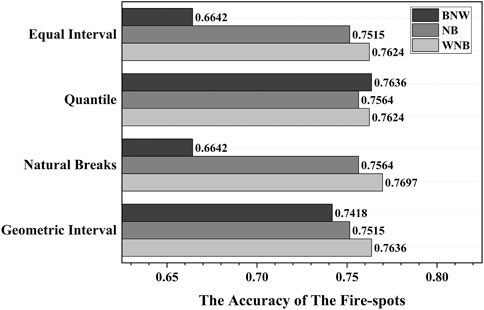
FIGURE 10. The accuracy comparison of the four grading methods.
With the four grading methods, the accuracy of the BNW model differs remarkably. The accuracy reaches the highest (0.7636) by using the quantile method, whereas it is only 0.6642 using the grading methods of equal intervals and natural breaks. This means the predicting performance of the BNW-based wildfire risk assessment model is sensitive to the grading method. On the other hand, the accuracy results of the NB and WNB models are relatively stable with different grading methods. Specifically, the accuracy of the WNB model is all above 0.76 with either grading method, indicating that the WNB model is stable and adaptable.
Compared to the other three grading methods, the geometric interval method ensures an approximate same number of values in each grading range and a consistent variation between intervals. It is believed to be a compromise between the equal interval method, the quantile method, and the natural breaks method. Therefore, the geometric interval method is selected as the grading standard for visualizing the wildfire risks of the research area. By using the geometric interval method, the accuracy of the three Bayesian models is 0.7418, 0.7515, and 0.7636, respectively.
The Visualization of Wildfire Risk Assessment Models
Based on the grading results of the geometric interval method, the distribution of wildfire risk levels based on BNW, NB, and WNB models are visualized by using ArcGIS Software, as shown in Figure 11.
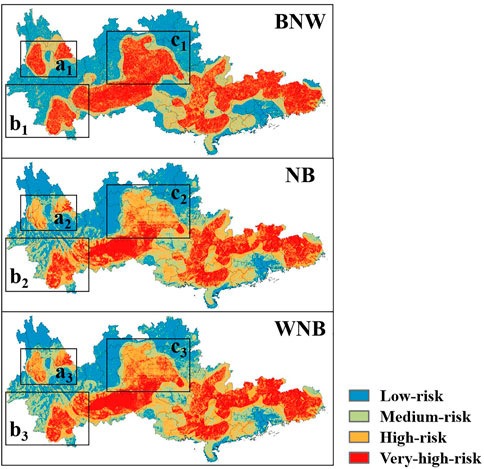
FIGURE 11. The distributions of wildfire risk levels based on BNW, NB, and WNB.
It can be found that no matter which Bayesian model is adopted, the overall risk distribution of the study area is roughly similar. This is mainly because the three kinds of Bayesian networks all use the same OFS and MAST and the sampling results objectively reflect the actual situation of the study area. The High-risk and Very-high-risk regions are generally distributed at the south and southeast of the study area. However, in some local areas, the assessment results of different models differ. For instance, in the result of the BNW model, the regions of a, b, and c have a larger area that is assessed to be the Very-high-risk. The Very-high-risk areas in NB and WNB models are much more scattered in the local regions, as shown in Figure 12. This may be caused by the mutual coupling of factors considered in the BNW model. Most factors have spatial continuity and surrounding relevance, so when the BNW model is used for assessment, the results would be smoothed. The NB model treats the factors independently, so the results are more scattered. Since WNB emphasizes some wildfire-related factors, the dispersion of the results lies between the NB model and the BNW model.
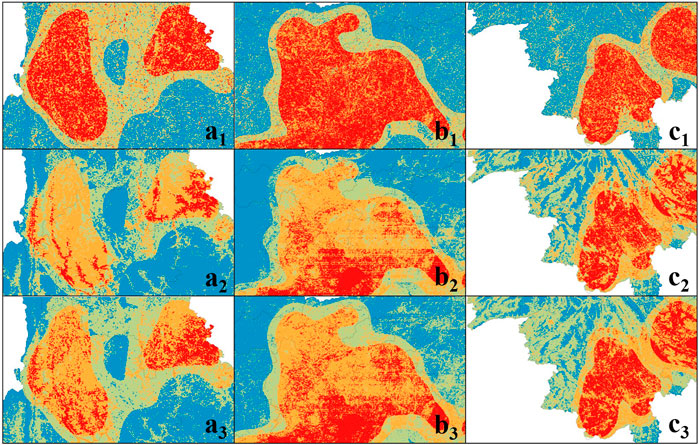
FIGURE 12. The distribution of wildfire risk levels in local regions (a, b, and c).
The proportions of grid areas and the fire spots from 2015 to 2021 under the four levels are summarized in Table 3. When using the geometric interval method for grading the poster probabilities of risk assessment, the low-risk and very high-risk occupy a larger proportion than the rest two risk level in the BNW model. The total area of these two risk levels accounts for 60.36% of the whole region. The area proportions of the four risk levels are more evenly distributed in the results of the NB and WNB models. In WNB-based risk assessment, 86.28% of the fire-spots fall in the high-risk and very high-risk region, which is much higher than that of BNW (76.43%) and NB (82.78%).
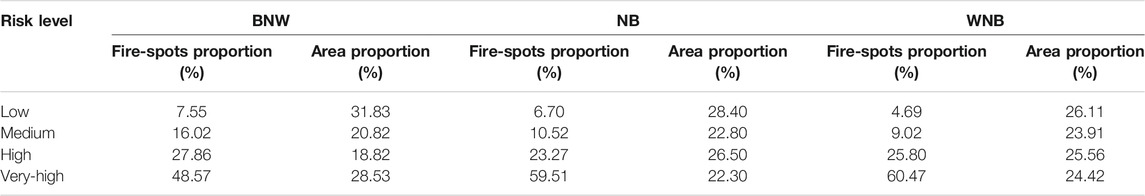
TABLE 3. The proportions of the grids under the four levels.
Considering the area and accuracy at the same time, the assessment performance of the BNW model is the worst. In total, 48.57% of fire spots falls in the High-risk and Very-high-risk area, which accounts for 47.35% of the total research region. By defining the predicting efficiency as the ratio of accuracy and the area proportion of the High-risk and Very-high-risk area, the predicting efficiencies for BNW, NB, and WNB models are 1.61, 1.69, and 1.73, separately. The WNB model exhibits the highest efficiencies for wildfire risk assessment, which is very helpful for the monitoring, inspection, and prevention of wildfires by relevant departments.
Conclusion
1) The importance of 14 types of wildfire-related factors is ranked through the information gain ratio. The vegetation type, land-usage type, and fire-spot density are the three most important factors that affect the occurrence of wildfires. The aspect and DR have few effects on the risk assessment of wildfire occurrence.
2) The deletion of less important factors and establishment of a Most Accurate Sampling Table can improve the assessment performance of the WNB model. The best accuracy of the WNB model is 0.7566 by deleting the aspect and DR factors.
3) Compared to the BNW and NB model, the WNB model has the best predicting efficiency for fire-spots assessment. By using the geometric interval grading method, a total of 86.44% of the fire-spots fall in the high-risk and very high-risk regions, and the predicting efficiency is 1.72.
Data Availability Statement
The original contributions presented in the study are included in the article/Supplementary Materials, further inquiries can be directed to the corresponding author.
Author Contributions
Funding acquisition, JL; Investigation, EZ; Methodology, HL; Project administration, YZ; Software, HL; Supervision, JL; Writing—original draft, KX; Writing—review and editing, KX and YH. All authors have read and agreed to the published version of the manuscript. And all authors agree to be accountable for the content of the work.
Funding
The research was funded by the Science and technology projects funded by China Southern Power Grid Corporation for supporting this research under Contract No. GDKJXM20198386, by the Scientific Research Foundation of Hunan Education Department under Grant No.20B007 for scientific research, by the Changsha University of Science and Technology Professional Master’s Innovation Project SJCX202045, by the Changsha University of Science and Technology Academic Master’s Research and Innovation Project CX2020SS56, by the Changsha University of Science and Technology Academic Master’s Research and Innovation Project CX2021SS47.
Conflict of Interest
The author EZ is employed by the company Guangdong Power Grid.
The remaining authors declare that the research was conducted in the absence of any commercial or financial relationships that could be construed as a potential conflict of interest.
This study received funding from China Southern Power Grid Corporation under Contract No. GDKJXM20198386. The funder had the following involvement with the study: Data Calculation of Fire-spot Density.
Publisher’s Note
All claims expressed in this article are solely those of the authors and do not necessarily represent those of their affiliated organizations, or those of the publisher, the editors and the reviewers. Any product that may be evaluated in this article, or claim that may be made by its manufacturer, is not guaranteed or endorsed by the publisher.
Acknowledgments
The authors would like to thank Weijie Chen from the Changsha University of Science and Technology for his helpful suggestions. The authors also would like to thank the reviewers for their constructive suggestions and comments.
Supplementary Material
The Supplementary Material for this article can be found online at: https://www.frontiersin.org/articles/10.3389/fenrg.2022.829934/full#supplementary-material
References
Albuquerque, M. T. D., Gerassis, S., Sierra, C., Taboada, J., Martín, J. E., Antunes, I. M. H. R., et al. (2017). Developing a New Bayesian Risk Index for Risk Evaluation of Soil Contamination. Sci. Total Environ. 603-604, 167–177. doi:10.1016/j.scitotenv.2017.06.068
Anchang, J. Y., Ananga, E. O., and Pu, R. (2016). An Efficient Unsupervised index Based Approach for Mapping Urban Vegetation from IKONOS Imagery. Int. J. Appl. Earth Observation Geoinformation 50, 211–220. doi:10.1016/j.jag.2016.04.001
Bates, B. C., Dowdy, A. J., and McCaw, L. (2021). A Bayesian Approach to Exploring the Influence of Climate Variability Modes on Fire Weather Conditions and Lightning-Ignited Wildfires. Clim. Dyn. 57, 1207–1225. doi:10.1007/s00382-021-05764-2
Chen, W., Zhou, Y., Zhou, E., Xiang, Z., Zhou, W., and Lu, J. (2021). Wildfire Risk Assessment of Transmission-Line Corridors Based on Naïve Bayes Network and Remote Sensing Data. Sensors 21 (2), 634. doi:10.3390/s21020634
Dlamini, W. M. (2010). A Bayesian Belief Network Analysis of Factors Influencing Wildfire Occurrence in Swaziland. Environ. Model. Softw. 25, 199–208. doi:10.1016/j.envsoft.2009.08.002
Hu, Y., Liu, K., and Wu, T. (2014). Analysis of Influential Factors on Operation Safety of Transmission Line and Countermeasures. High Voltage Eng. 40 (11), 3491–3499.
Huang, D. C., Li, P., Ruan, J. J., Zhang, Y., and Wu, T. (2015). Review on Discharge Mechanism and Breakdown Characteristics of Transmission Line Gap under Forest Fire Condition. High Voltage Eng. 41 (2), 622–632. doi:10.13336/j.1003-6520.hve.2015.02.040
Ji, H., Huang, S., Wu, Y., Hui, Z., and Zheng, C. (2019). A New Weighted Naive Bayes Method Based on Information Diffusion for Software Defect Prediction. Softw. Qual J 27 (3), 923–968. doi:10.1007/s11219-018-9436-4
Jiang, L., Li, C., Wang, S., and Zhang, L. (2016). Deep Feature Weighting for Naive Bayes and its Application to Text Classification. Eng. Appl. Artif. Intelligence 52, 26–39. doi:10.1016/j.engappai.2016.02.002
Lee, C.-H. (2015). A Gradient Approach for Value Weighted Classification Learning in Naive Bayes. Knowledge-Based Syst. 85, 71–79. doi:10.1016/j.knosys.2015.04.020
Liu, C. X., Fan, P., Wang, H. T., and Guo, J. (2017). Modeling forest Fire Risk Assessment Based on BP Neural Network of Transmission Line. Power Syst. Prot. Control. 45 (17), 100–105. doi:10.7667/PSPC161228
Liu, M. J., Shao, Z. C., and Shangguan, T. (2016). Study on Models and Methods of Risk Assessment of Transmission Line Fault Caused by Fire. Power Syst. Prot. Control. 44 (6), 82–89. doi:10.7667/PSPC150844
Liu, R., Chen, Y., Wu, J., Gao, L., Barrett, D., Xu, T., et al. (2017). Integrating Entropy-Based Naïve Bayes and GIS for Spatial Evaluation of Flood Hazard. Risk Anal. 37 (4), 756–773. doi:10.1111/risa.12698
Lu, J. Z., Liu, Y., Xu, X. J., and Yang, L. (2017). Prediction and Early Warning Technology of Wildfire Nearby Overhead Transmission Lines. High Voltage Eng. 43 (1), 314–320. doi:10.13336/j.1003-6520.hve.20161227041
Ma, D. Z., Ding, W. F., and Liu, S. N. (2013). Risk Assessment Method for Fire in Underground Space Based on Bayesian Network. China Saf. Sci. J. 23 (11), 151–156. doi:10.16265/j.cnki.issn1003-3033.2013.11.027
Peng, X. J., and Wang, Y. F. (2009). Total Margin V-Support Vector Machine and its Geometric Problem. Pattern Recognition Artif. Intelligence 22 (1), 8–16. doi:10.16451/j.cnki.issn1003-6059.2009.01.021
Penman, T. D., Cirulis, B., and Marcot, B. G. (2020). Bayesian Decision Network Modeling for Environmental Risk Management: A Wildfire Case Study. J. Environ. Manage. 270, 110735. doi:10.1016/j.jenvman.2020.110735
QGDW11643 (2016). Guidelines for Drawing Wildfire Distribution on Overhead Transmission Lines. Beijing: State Grid Corporation.
Qu, Z. Y., Yang, Q., and Yang, J. M. (2016). Risk Association Model of Smart Substation Based on Bayesian Network. Automation Electric Power Syst. 40 (2), 95–99. doi:10.7500/AEPS20150518003
Sevinc, V., Kucuk, O., and Goltas, M. (2020). A Bayesian Network Model for Prediction and Analysis of Possible forest Fire Causes. For. Ecol. Manag. 457, 117723. doi:10.1016/j.foreco.2019.117723
Song, G. B., Cai, X. L., Gao, S. P., and Zhang, J-K. (2012). Survey of Fault Location Research for HVDC Transmission Lines. Power Syst. Prot. Control. 40 (5), 133–137. doi:10.3969/j.issn.1674-3415.2012.05.026
Tang, X., Shu, Y., Lian, Y., Zhao, Y., and Fu, Y. (2018). A Spatial Assessment of Urban Waterlogging Risk Based on a Weighted Naïve Bayes Classifier. Sci. Total Environ. 630, 264–274. doi:10.1016/j.scitotenv.2018.02.172
Wang, K., and Fan, C. (2016). Electric Transmission Lines Fire Risk Impact Factor Weighting Analysis Based on Analytic Hierarchy Process. Geomatics Spat. Inf. Tech. 39 (12), 116–119. doi:10.3969/j.issn.1672-5867.2016.12.035
Wang, S., and Wang, F. (2016). Research of Forest Fire Risk Distribution of Transmission Line and its Application. Hubei Electric Power 40 (2), 23–27+32. doi:10.19308/j.hep.2016.02.005
Wu, J., Hu, Z., Chen, J., and Li, Z. (2018). Risk Assessment of Underground Subway Stations to Fire Disasters Using Bayesian Network. Sustainability 10 (10), 3810. doi:10.3390/su10103810
Wu, T., Ruan, J. J., and Zhang, Y. (2012). Study on the Statistic Characteristics and Identification of AC Transmission Line Trips Induced by forest Fires. Power Syst. Prot. Control. 40 (10), 138–143+148. doi:10.3969/j.issn.1674-3415.2012.10.025
Xiong, P., Zhu, T. Q., and Gu, X. (2014). Data Anonymization Based on Restriction of Information Gain Ratio: Method and Evaluation. Appl. Res. Comput. 31 (3), 819–824. doi:10.3969/j.issn.1001-3695.2014.03.044
Xu, K., Zhang, X., Chen, Z., Wu, W., and Li, T. (2016). Risk Assessment for Wildfire Occurrence in High-Voltage Power Line Corridors by Using Remote-Sensing Techniques: a Case Study in Hubei Province, China. Int. J. Remote Sensing 37 (20), 4818–4837. doi:10.1080/01431161.2016.1220032
Ye, L. P., Chen, X. Y., He, Z. L., and Xie, C-Z. (2014). Present Situation of forest Fire Early Warning Technology Used for Transmission Line. Power Syst. Prot. Control. 42 (6), 145–153.
Zeng, Q. F. (2009). The Spatial Distribution Characteristics and Cluster Analysis of forest Fires in Guangdong Province. For. Fire Prev. 4, 29–32. doi:10.3969/j.issn.1002-2511.2009.04.009
Zhao, Y., Li, H. Q., and Wang, Y. M. (2013). A Complex Network Theory and Conditional Probability Based Risk Assessment Method for Disastrous Accidents. Power Syst. Tech. 37 (11), 3190–3196. doi:10.13335/j.1000-3673.pst.2013.11.035
Keywords: wildfire, risk assessment, weighted naïve bayes, transmission-line corridors, risk visualization
Citation: Xiang K, Zhou Y, Zhou E, Lu J, Liu H and Huang Y (2022) A Spatial Assessment of Wildfire Risk for Transmission-Line Corridor Based on a Weighted Naïve Bayes Model. Front. Energy Res. 10:829934. doi: 10.3389/fenrg.2022.829934
Received: 06 December 2021; Accepted: 03 January 2022;
Published: 04 February 2022.
Edited by:
Yan Xu, Nanyang Technological University, SingaporeReviewed by:
Wu Lu, Shanghai University of Electric Power, ChinaLujia Wang, China University of Mining and Technology, China
Copyright © 2022 Xiang, Zhou, Zhou, Lu, Liu and Huang. This is an open-access article distributed under the terms of the Creative Commons Attribution License (CC BY). The use, distribution or reproduction in other forums is permitted, provided the original author(s) and the copyright owner(s) are credited and that the original publication in this journal is cited, in accordance with accepted academic practice. No use, distribution or reproduction is permitted which does not comply with these terms.
*Correspondence: You Zhou, zhouyou243@csust.edu.cn