Ignition and Combustion Characteristics of N-Butanol and FPBO/N-Butanol Blends With Addition of Ignition Improver
 Yu Wang
 Jinlin Han
 Noud Maes
 Michel Cuijpers
  Bart Somers
- Department of Mechanical Engineering, Eindhoven University of Technology, Eindhoven, Netherlands
In this study, the ignition and combustion characteristics of fast pyrolysis bio-oil (FPBO) are investigated in a combustion research unit (CRU), which mainly consists of a constant-volume combustion chamber. To fuel the CRU with FPBO, n-butanol and 2-ethylhexyl nitrate (EHN) are used to improve the atomization and ignition properties of the fuel blends, respectively. In the first part of this study, an appropriate proportion of EHN additive into n-butanol is determined based on the balance between the ignition improvement and the amount of EHN addition. Then, the effects of FPBO content (up to 30%) in FPBO/n-butanol blends with the same EHN addition are investigated. The effects of chamber wall temperature on the combustion are also studied. Finally, the different definitions of indicators are determined from the chamber pressure traces to quantitatively depict fuel ignition and combustion characteristics including ignition delay, combustion phasing, end of combustion and burn duration. Experimental results show that a distinct two-stage ignition process can be observed for all cases. For n-butanol with added EHN, the increase of EHN proportion could effectively advance both the low- and high-temperature reaction phases. However, this gain is obviously reduced when the percentage of EHN becomes higher than 8%. For FPBO/n-butanol blends with an addition of EHN, higher FPBO proportions have little effect on the low-temperature reaction phase, while they delay the high-temperature reaction phase. Chamber wall temperature have a significant influence on the ignition and combustion processes of the tested FPBO/n-butanol blends. With these blends, negative temperature coefficient behavior was observed in a chamber wall temperature range of 535–565°C.
1 Introduction
Using biomass-derived fuels to replace fossil-based fuels is a promising way to contribute to net-zero carbon dioxide emissions. Fast pyrolysis is an efficient process to convert biomass with lower energy densities to liquid biofuel with higher energy densities. In the process of fast pyrolysis, the organic materials are heated rapidly to 450–600°C in the absence of oxygen. After a short residence time of several seconds, the vapor is quickly condensed to a liquid called fast pyrolysis bio-oil (FPBO) (Bridgwater, 2012; Broumand et al., 2020). Typical feedstock includes forestry residues such as sawdust, agricultural byproducts such as corn stover, and organic waste from the paper industry.
Amongst others, FPBO is studied to fuel stationary diesel engines for combined heat and power generation (SmartCHP, 2019). However, its special physical and chemical properties limit the direct application in conventional diesel engines (Hossain and Davies, 2013; Mueller, 2013). Several comprehensive reviews on properties of FPBO are available (Mueller, 2013; Lehto et al., 2014; Broumand et al., 2020), all showing how the fuel properties of FPBO highly depend on the type of feedstock and the production process. Generally, FPBO has a high water content (15–30 wt%) and a high oxygen content (30–50 wt%). Besides, it also contains some solids (polymer and char) and ash particles (metal and salts). Compared to the ignition delay of commercial diesel fuels, the high-temperature reactions of FPBO in a compression ignition engine are delayed. This is a result caused by both the degraded atomization from the higher viscosity, and the lower chemical reactivity (van de Beld et al., 2013; van de Beld et al., 2018). Other properties of FPBO to consider are its acidity and its tendency to polymerize. The high acidity (pH 2–3) of FPBO may lead to corrosion in metal and elastomeric materials of the fuel supply and injection system (Kass et al., 2015; Kass et al., 2020). Its tendency to polymerize at elevated temperatures may lead to nozzle clogging and coking (Broumand et al., 2020; Wang and Ben, 2020).
Blending the FPBO with a higher-quality base-fuel is a common solution to fuel an unmodified diesel engine with FPBO. Alcohol fuels have been widely used to blend both normal diesel and biofuels (Zheng et al., 2015; Atmanli and Yilmaz, 2018; Atmanli and Yilmaz, 2020; Liu et al., 2020) Due to the polar properties of FPBO, it is common practice in fuel blending to mix FPBO with polar solvents such as ethanol (Lee et al., 2013; Lee and Kim, 2015) or butanol (Lee et al., 2013; Lee et al., 2020). Blending FPBO with alcohols could effectively reduce the viscosity as well as the surface tension, increase its volatility, and curb polymerization. All these effects could improve the blend’s stability and atomization characteristics. However, the ignition characteristics of both FPBO and alcohols are inferior than diesel. Therefore, additional ignition improver should be added into the fuel blends to achieve timely autoignition and appropriate combustion properties in a compression-ignition engine (Alcala and Bridgwater, 2013; Atmanli, 2016).
The objective of this work is to explore the ignition and combustion characteristics of FPBO. N-butanol is chosen as the blending component because of its higher reactivity when compared to ethanol. A modest amount of the commercial ignition improver 2-ethylhexyl nitrate (EHN) is added into the fuel blends to improve the ignitability. A constant-volume combustion chamber (CVCC) is employed in this study to provide well-defined and quiescent boundary conditions for the investigation of ignition and combustion characteristics. The present work is structured as follows. Section 2 introduces the experimental setup, tested conditions, and data process method. Then in Section 3 the definitions of indicators to evaluate ignition and combustion characteristics are described. After that, the results are analyzed and discussed in Section 4. The general conclusions are detailed in the last section of this paper.
2 Methodology
2.1 Combustion Research Unit
The combustion research unit (CRU) from Fueltech Solutions AS is used to measure the ignition and combustion characteristics of fuel blends. Figure 1 shows a schematic of the constant-volume combustion chamber (CVCC) in the CRU. The ambient gas is admitted to the chamber by external high-pressure gas cylinders which contain compressed synthetic air and nitrogen. Electric heaters are used to heat up the combustion chamber to the desired temperature. Table 1 shows the basic parameters of the CRU. Two thermocouples are installed at two different locations in the inner wall surface to ensure a uniform and accurate chamber temperature (<1°C difference).
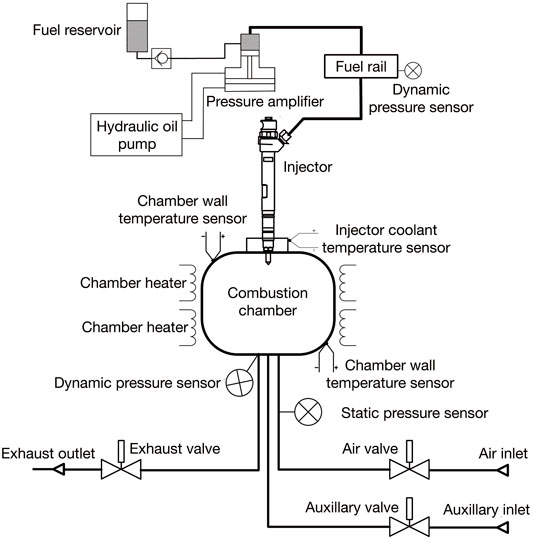
FIGURE 1. Schematic overview of the Combustion Research Unit (CRU).
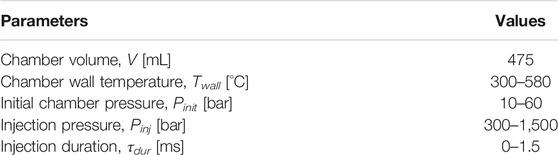
TABLE 1. CRU basic parameters.
In the fuel supply and injection system of the CRU, a pressure amplifier is driven by the hydraulic oil pump, providing a fuel pressure of between 300 and 1,500 bar to the injector (Bosch CRIP2, seven orifices with diameter of 0.16 mm, umbrella angle of 158°, part no. 0445110157). A water-cooling system is installed to avoid excessive temperatures around the injector nozzle. Two dynamic pressure sensors (Kistler) are installed in the fuel rail, and in the combustion chamber, respectively. They monitor the fuel injection pressure and chamber pressure variation during the injection and combustion process at a rate of 50 kHz. More information about the experimental setup can be found in previous studies (Han et al., 2021; Han and Somers, 2021; Wang et al., 2021).
2.2 Tested Fuels and Operating Conditions
In this study, n-butanol (CAS 71-36-3) and EHN (CAS 27247-96-7) are used as solvent and ignition improver, respectively, for testing FPBO in the CRU. The FPBO sample is provided by BTG Biomass Technology Group BV. Previous studies showed that addition of ignition improver to low-cetane number fuels significantly improves their ignition properties. However, the effectiveness decreases when increasing the amount of ignition improver (van de Beld et al., 2013).
The present study first tests five different additive amounts of EHN from 2% to 10% in n-butanol (in this work, all blend ratios in percentage refer to mass fraction), to determine an appropriate dosage of ignition improver. Based on the results, EHN mass fraction is subsequently fixed at 5% and mixed with FPBO/n-butanol blends containing seven different FPBO mass fractions from 0% to 30%. Table 2 lists the name abbreviations of the tested fuel blends and their compositions. Table 3 compares the main properties among diesel, n-butanol, FPBO and EHN.
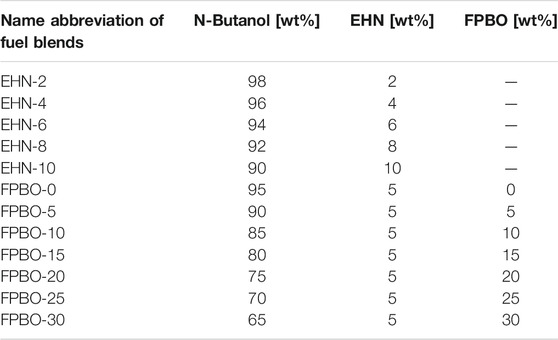
TABLE 2. Compositions of tested fuel blends (1,000 ppm of lubricity enhancer, Infineum R655, is added in all the blended fuels).
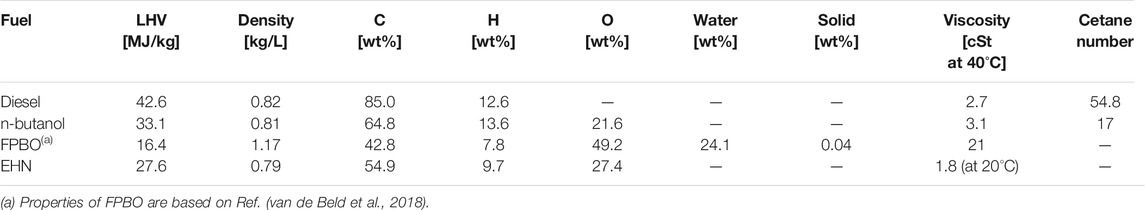
TABLE 3. Fuel properties of diesel, n-butanol, FPBO and EHN.
To investigate the effects of chamber wall temperature, sweeps of chamber temperature (Twall) are performed from 490 to 580°C in steps of 15°C. Other CRU operation conditions are kept constant to an initial chamber pressure (Pinit) of 30 bar, an injection pressure (Pinj) of 1,500 bar, and injection duration (τdur) of 1.5 ms. It is noteworthy that in CRU output data, the hydraulic delay of 0.340 ms is already corrected to show the chamber pressure after the start of injection (ASOI). During the test, each measurement includes eight injections, where only the final five injections are recorded and ensemble averaged.
2.3 Data Processing
The chamber pressure data is used to calculate the total heat release rate (HRR) and mass fraction burned (MFB) with appropriate corrections, as shown in Figure 2. First, a speed of sound correction is applied on the raw chamber pressure (Lillo et al., 2012). The dynamic pressure sensor is installed in the bottom of the chamber at a distance of 90 mm from the injector nozzle tip. Due to the limited propagation velocity of pressure wave (i.e., speed of sound), there is a delay between start of ignition and pressure increase detected by dynamic pressure sensor. The distance between the dynamic pressure sensor and the spray axis is used to determine the signal delay in chamber pressure and the speed of sound is calculated from the following equation,
where
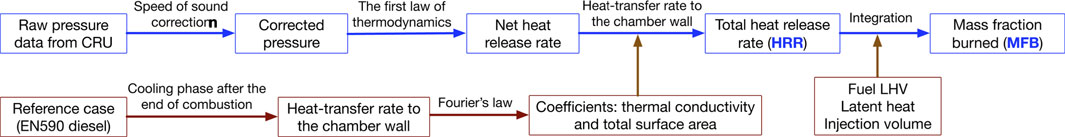
FIGURE 2. Flow chart of data processing.
The corrected pressure data can be used to calculate the total heat release rate. According to the first law of thermodynamic, in a CVCC system, the total heat release rate, i.e., chemical energy release rate,
where
where
where
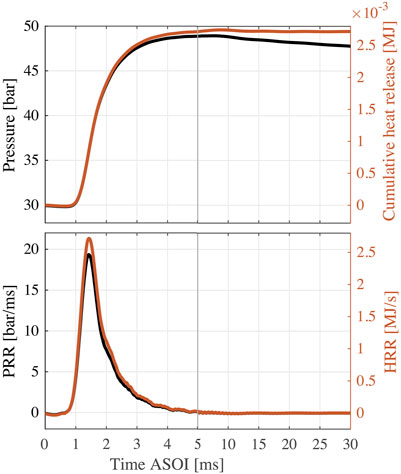
FIGURE 3. Results of EN590 diesel as a function of time ASOI (two different scales are used to show results in 0–5,5–30 ms, respectively). Top: pressure and cumulative heat release profiles. Bottom: PRR and HRR profiles. Test conditions: Twall = 580°C, Pinit = 30 bar, Pinj = 1,500 bar, τdur = 1.5 ms.
Figure 3 also shows the cumulative heat release (top) and HRR (bottom) profiles. The cumulative heat release is the integration of
Finally, mass fraction burned (MFB) is calculated from the integration of HRR divided by the total chemical energy of the injected fuel (Heywood, 2018; Li et al., 2019). In the cumulative heat release profile, the initial negative value is caused by evaporative cooling, and the lowest value is used to evaluate the total heat absorption for the total heat release calculation. The injection volume is determined by dividing the calculated total chemical energy of EN590 diesel by its LHV at the benchmark condition. The calculated injection volume is likely to be smaller than the actual value because of the local heat losses due to spray flame/wall interaction. It is worth noting that injection volume is also slightly influenced by the physical properties of fuel, like viscosity and volatility, while in this study the same injection volume is applied to all tested fuel blends as a constant.
3 Definitions of Indicators to Evaluate Fuel Ignition and Combustion Characteristics
Figure 4 shows a typical set of pressure, HRR, dHRR/dt, and MFB profiles for a single test case (EHN-4 at
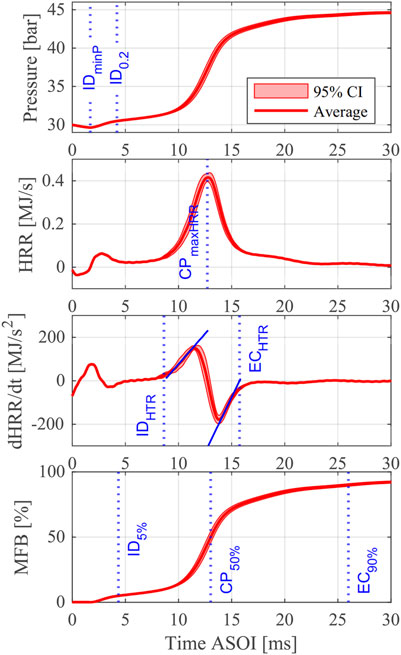
FIGURE 4. Pressure, HRR, dHRR/dt, and MFB results of EHN-4 for
To quantitatively evaluate fuel ignition and combustion characteristics, some indicators are generally introduced. Examples of these indicators include the ignition delay (ID), combustion phasing (CP), end of combustion (EC), and the burn duration (BD). However, there are many different definitions for these indicators in combustion studies using pressure-based analysis. Table 4 lists the definitions of indicators used in this study, and they are explained and discussed in this section.
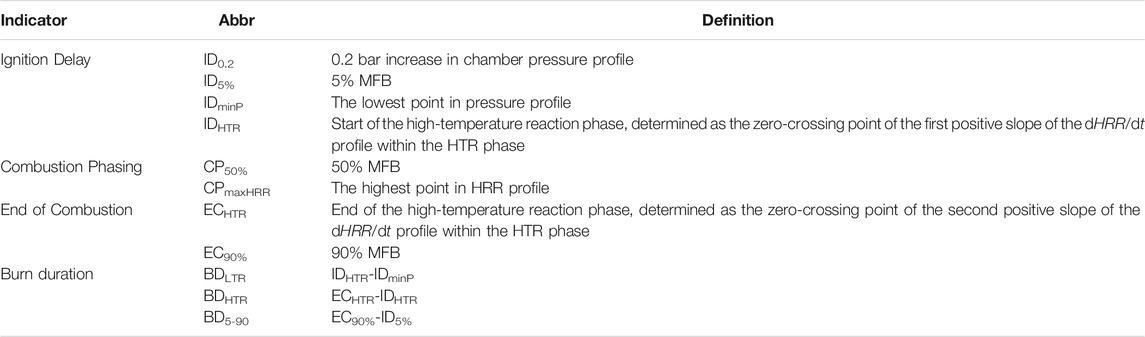
TABLE 4. Definitions of indicators.
3.1 Ignition Delay
The ignition delay is the most important indicator to evaluate fuel ignitability. As shown in Table 4, four definitions of ignition delay are employed in this study: ID0.2, ID5%, IDminP, and IDHTR. The first three definitions have been widely used to investigate diesel-like fuels. However, the last one is specifically adopted for the fuels with two-state ignition phenomenon since in a real engine, the timing of the HTR is a crucial factor for engine efficiency and emission.
ID0.2 sets a fixed pressure change to define ID, which was adopted in ASTM D7668 (ASTM, 2017), and by many researches subsequently (Kuszewski, 2018; Liang et al., 2019; Oliva and Fernández-Rodríguez, 2020).
Another ASTM standard, ASTM D6890 (ASTM, 2021) and several other studies (Somers et al., 2018; Zhang et al., 2021) employed the pressure recovery point to define ID as IDminP, which also falls within the definition of a fixed pressure change, similar to ID0.2. At the minimum pressure, the heat release rate from the exothermic reactions exceeds the heat absorption rate caused by liquid evaporation and endothermic reactions (Somers et al., 2018). Therefore, it is a good indicator to identify the start of the low-temperature reaction phase, while its application is sometimes restricted due to the unobvious absolute changes for different cases.
ID5% is the moment where 5% of fuel chemical energy is released. ID5% adapts to the change of total energy input when varying injector mass flow (different orifices), injection pressure, injection duration, or fuel components, so that ID5% is more robust than ID0.2 in these cases (Joshi et al., 2015; Rabl et al., 2015; Krivopolianskii et al., 2019; Li et al., 2019).
IDHTR is determined as the horizontal intercept of the linear fit of the first positive slope of the dHRR/dt profile within the HTR phase. As shown in Figure 4, there is a long period between the two peaks in the HRR profile. All the fixed-value ignition delay definitions (ID0.2, ID5%, and IDminP) are located near the first peak caused by the LTR. Within HTR phase, the change of HRR can be determined using dHRR/dt profile, so that the zero-crossing point of the first positive slope of dHRR/dt, IDHTR, represents a more realistic result for the start of intense high-temperature heat release without using a fixed-value definition. Similar methods such as the IDHRT definition described here were adopted in some studies as well (Joshi et al., 2015; Zhang et al., 2021). Therefore, the IDHTR is employed in this study to characterize the HTR phase while all definitions will be shown while analyzing the results.
3.2 Combustion Phasing
Combustion phasing (CP) is crucial for thermal efficiency in engine work, and it is often defined as the moment where 50% of fuel chemical energy is released in engine experiments (Caton, 2014). Therefore, in this study, CP50% is defined as the moment for 50% MFB. Similar CP definitions were also used in ASTM D7668 (ASTM, 2017), and in some recent studies (Kuszewski, 2018; Krivopolianskii et al., 2019). CPmaxHRR is defined as the moment for the peak HRR. The similar definitions were adopted in IP 541 standard (IP, 2006) and some studies (Prak et al., 2013). It should be noted that for cases with significant mixing-controlled burn, i.e. diesel combustion at a relatively long injection duration, the maximum HRR is produced by the early premixed burn, making this CP definition not sufficient to estimate engine efficiency. Hence, CPmaxHRR is generally employed in cases where the injection and combustion processes are sufficiently decoupled.
3.3 End of Combustion
Two definitions of the end of combustion are employed in this study. EC90%, the moment for 90% MFB, is used to label the timing when most of the fuel’s chemical energy is released by combustion reactions. In addition, just like IDHTR, ECHTR is determined as the horizontal intercept of the linear fit of the second positive slope of the dHRR/dt profile within the HTR phase, to characterize the end of the high-temperature reactions.
3.4 Burn Duration
Based on the indicators defined above, three definitions of burn duration are calculated:
1 burn duration of low-temperature reaction (BDLTR) is the period between IDminP and IDHTR;
2 burn duration of high-temperature reaction (BDHTR) is the period between IDHTR and ECHTR;
3 burn duration (BD5-90) is the period between ID5% and EC90%.
As shown in Figure 4, the BDLTR could be quite long if the fuel reactivity or the chamber wall temperature is low, while the BDHTR is quasi-symmetrically distributed on both sides of the high-temperature heat release peak in the HRR profile. This is quite different from the HRR profile in conventional diesel combustion (CDC), but more like the HRR profile in homogeneous reactor where heat release process is dominated by chemical kinetics rather than fuel/air mixing rate.
4 Results and Discussion
4.1 Effects of EHN Addition on N-Butanol Combustion
In this section, different amounts of the ignition improver (EHN) are added into n-butanol and effects of the fuel blends on ignition and combustion characteristics are analyzed. Figure 5 shows the heat release rate (HRR) and mass fraction burned (MFB) profiles of five fuel blends with different EHN additions (from 2% to 10% at the chamber wall temperature of 580°C). According to the HRR profiles, higher proportions of EHN result in more and earlier low-temperature heat release, and hence, the high-temperature heat release is obviously advanced and the HRR peak is elevated. The MFB profiles show that n-butanol with 4%–10% EHN addition can realize a relatively high combustion efficiency (the MFB profile exceeds 90% and eventually flattens out), while the combustion efficiency for n-butanol with 2% EHN addition is slightly lower. The combustion efficiency of EHN-10 reaches 96.8% at 16 ms ASOI, which is a little lower than the expected value. Besides the possibility of incomplete combustion, the deviation of the calculated injection volume is also likely to lead to this result.
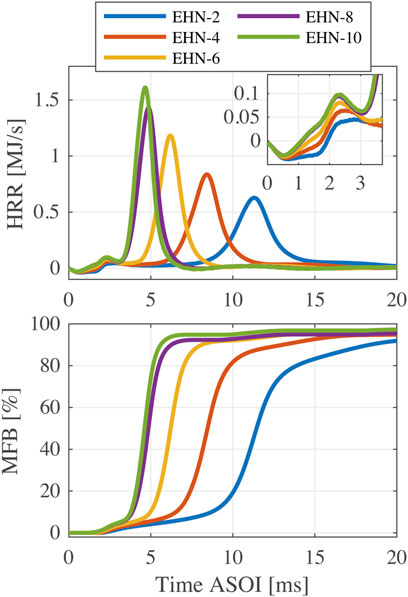
FIGURE 5. HRR and MFB profiles of n-butanol and EHN blends with EHN mass fractions of 2%–10% (
Figure 6 shows the indicators of ignition and combustion characteristics for n-butanol with addition of 2%–10% EHN at three different chamber wall temperatures (520, 550, and 580°C). As mentioned before, the shown results are ensemble averages of five injections. The error bars in Figure 6 show the corresponding 95% confidence intervals. The three panels in the top row present the ignition delay results. Generally, higher amounts of EHN could effectively shorten the ignition delay, but this effect is obviously reduced when the percentage of EHN exceeds 8%. As expected, IDHTR gives the highest value among four definitions of ignition delay, while IDminP is always the lowest. It is noteworthy that the measured ignition delays for almost all cases are longer than the injection duration (fixed at 1.5 ms), meaning that the ignition and combustion processes for tested fuels are decoupled from the fuel injection. Opposed to the diesel combustion process shown in Figure 3, there is no overlap between injection and main combustion for the tested fuels. Therefore, a two-stage ignition phenomenon (LTR and HTR) can be distinctly identified in Figure 6. ID5% and ID0.2 show good consistency at 520 and 550°C, while at 580°C ID5% gradually deviates from ID0.2 and approaches IDHTR with increase of EHN proportion.
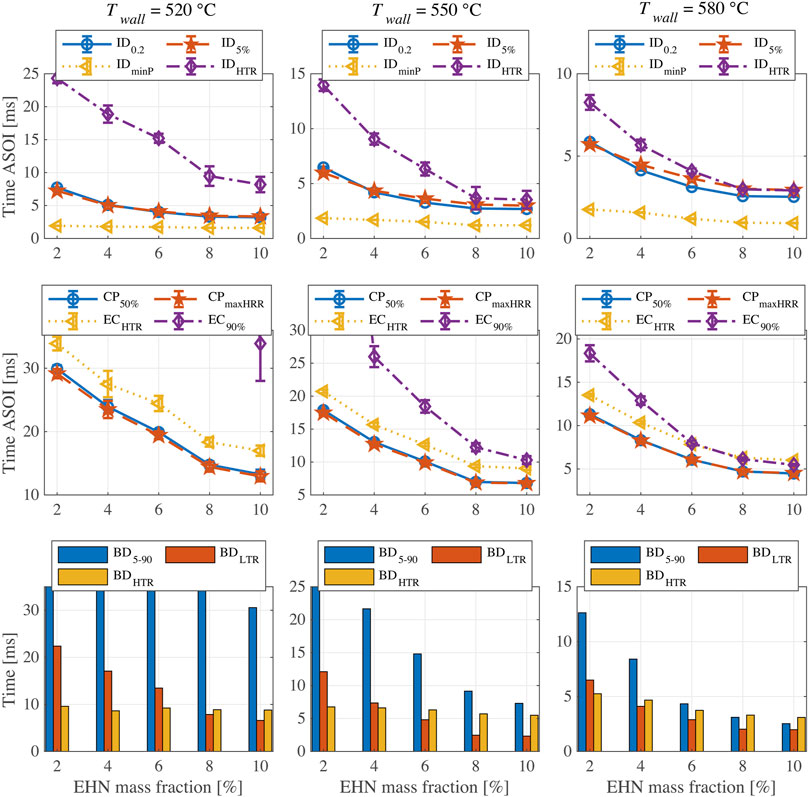
FIGURE 6. Results of ignition and combustion indicators for n-butanol with addition of 2%–10% EHN at different chamber wall temperatures.
The two most widely used ID definitions, ID0.2 and ID5%, can capture the fuel ignition tendency when changing fuel composition or chamber wall temperature, and both have good repeatability. Compared to other ID definitions, IDHTR has the largest value and shows a higher uncertainty, especially at a lower chamber wall temperature. However, it is extremely relevant for fuel blends at conditions where due to a long ignition delay two-stage ignition becomes prominent. On the one hand, IDHTR is more significant to characterize the effect of chamber wall temperature on fuel ignition process. On the other hand, it also shows the significant influence of EHN addition on advancing HTR, especially at the lowest chamber temperature of 520°C. In fact, the other ID definitions only show a limited effect of EHN addition. IDminP is not adequate to depict ignition properties since its relative change is quite small and it is insensitive to the different chamber wall temperatures.
Combustion phasing and end-of-combustion results are shown in the three panels in the second row of Figure 6. The two definitions of combustion phasing, CP50% and CPmaxHRR, give nearly the same results with good repeatability. The increase of EHN proportion leads to an advanced CP, but consistent with ID results, this effect becomes less obvious when the EHN content is higher than 8%. The ECHTR profile shows a similar trend as the CP, but its uncertainty at 520°C is relatively high. At 580°C, the EC90% and ECHTR are almost the same for EHN percentages of 6–10%. However, for the cases with lower EHN addition or lower chamber temperature, the final fuel conversion rates cannot reach 90% and thus EC90% cannot be determined. Nevertheless, if we reduce the MFB threshold for EC definition, e.g., to 80%, significant heat release can be observed after EC80% for the fuels with high EHN content at 580°C, as shown in Figure 5. Consequently, the applicability of EC defined by the fixed MFB is restricted when changing temperature or testing fuels with quite different reactivity.
Burn duration (BD5-90, BDLTR and BDHTR) results are shown in the third row of Figure 6. At 520°C, the undetermined EC90% also prevents meaningful BD5-90 values for most cases. In addition, BDLTR decreases substantially with the rising of EHN content, while interestingly, the BDHTR remains practically unchanged. However, at 580°C, the increase of EHN percentage leads to a significant decrease in BDLTR as well as a moderate decrease in BDHTR. This is because at lower temperature, the two peaks in HRR profiles are detached, and hence the small change in EHN content (2%–10%) could mainly shorten the LTR phase but has little influence on HTR phase. However, at higher temperature, the two peaks in the HRR profiles overlap to some degree, as shown in Figure 5. Therefore, the reduced BDLTR as a result of the increased EHN content also leads to the shorter BDHTR.
According to the above discussion, it is decided that EHN addition into n-butanol with a mass fraction of 5% provides a good balance between the improvement of ignitability and the dosage of ignition improver. This EHN dosage is used in the next section to study the ignition properties of FPBO/n-butanol blends.
4.2 Effects of FPBO Content on FPBO/N-Butanol Blends Combustion
In this section, FPBO/n-butanol blends with a 5% EHN addition are studied. First, Figure 7 shows the HRR and MFB profiles of FPBO-30 at different chamber wall temperatures. It can be seen that FPBO-30 fails to initiate high-temperature reactions at 490°C, and that combustion is not complete within 45 ms at 505°C. With the increase of temperature, both of LTR and HTR phases are advanced, and the apparent combustion efficiency increases. However, in most of cases, the final fuel conversion rate does not reach 90% which is substantially less than the combustion efficiency found for the n-butanol/EHN blends. FPBO is the condensate of organic vapors at temperatures higher than 450°C, meaning that it contains some high boiling point components that are difficult to evaporate after injection. Even worse, FPBO has a tendency to polymerize when temperatures are higher than 80°C (CEN, 2017; Broumand et al., 2020), so some even heavier components are likely to be formed when the fuel is heated before injection. The fuel temperature in the sac of the injector nozzle can reach around 100°C in a pre-burn CVCC (Malbec et al., 2013). For an electronically heated CVCC like the CRU, temperatures in the sac of the injector are expected to be even much higher. These heavier components may precipitate from the fuel and form solid particles, which are difficult to oxidize completely during the fuel combustion process and have a large effect on the combustion efficiency.
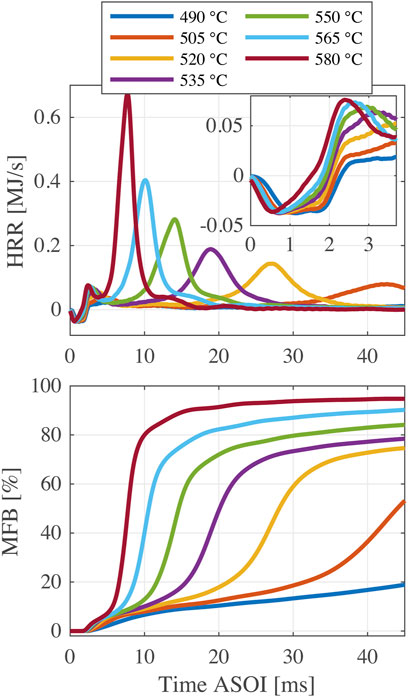
FIGURE 7. HRR and MFB profiles of FPBO-30 at different chamber wall temperatures (490–580°C).
Figure 8 shows the indicators of FPBO-30 as a function of chamber wall temperature. Generally, the higher chamber wall temperature results in a shorter ignition delay. However, the behavior of ID0.2 and ID5% in the chamber wall temperature range of 535–565°C imply that a so-called negative temperature coefficient (NTC) phenomenon probably happens (i.e., a further temperature rise leading to a slower chemical reaction rate within a certain temperature range). For alkanes like n-heptane, the synergy effect of three elementary reactions (RH + O2 = R + HO2, HO2 + HO2 = H2O2 + O2, H2O2 = 2OH), results first in a decrease in reactivity, followed by a subsequent increase when the temperature rises in a certain range (Curran et al., 1998). These observations generally hold for experiments and simulations in homogeneous reactor systems. In this study, however, the mixing time of injected fuel and ambient air is different for the changed chamber wall temperatures. Hence, more chemical kinetic analysis should be performed to further investigate the NTC phenomenon for n-butanol with addition of EHN. In addition, CP50%, CPmaxHRR, and ECHTR have the same trend: they are significantly advanced with the increased temperature. Both BDLTR and BDHTR are shortened at higher temperature, but as mentioned in the previous section, the BDLTR is more sensitive to a change of temperature than the BDHTR.
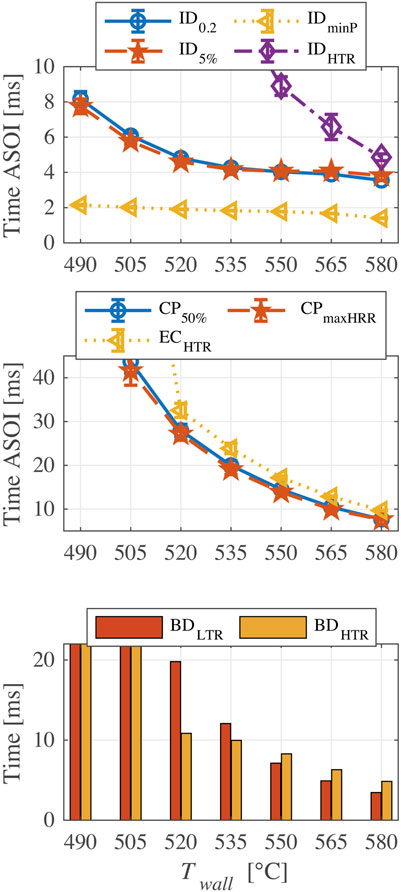
FIGURE 8. Results of ignition and combustion indicators for FPBO-30 at different chamber wall temperatures (490–580°C).
Figure 9 compares the effects of FPBO proportion on HRR and MFB profiles at 550°C. As shown in the figure, HRR profiles of fuel blends with various FPBO proportions are almost the same during the LTR phase, while substantial differences exist in the HTR phase. Generally, the increase of FPBO content results in a delayed HTR phase, a declined peak value of HRR, and a reduced final fuel conversion rate. This is because the chemical reactivity of FPBO is lower than n-butanol, and its heavier components experience the slow evaporation and combustion processes, prolonging the burn duration.
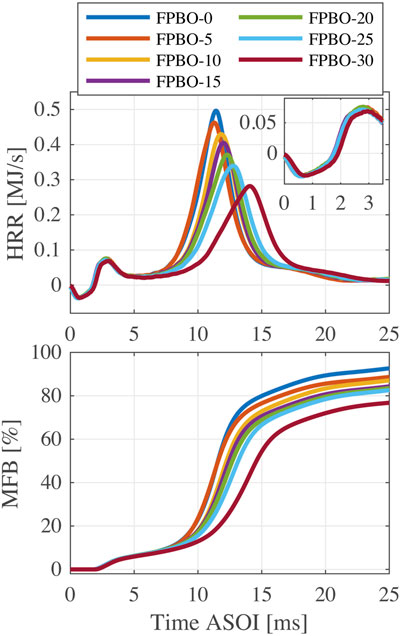
FIGURE 9. HRR and MFB profiles of FPBO and n-butanol blends with FPBO mass fractions of 0%–30% (5% EHN,
Figure 10 shows the results of indicators as a function of FPBO mass fraction at three chamber wall temperatures. The flat profiles of IDminP, ID0.2 and ID5% indicate that the effect of FPBO content on the LTR phase is negligible. FPBO content has little influence on IDHTR except for larger blend ratios (>20%), where FPBO worsens the ignitability of the mixture. This effect is only marginal at higher temperatures.
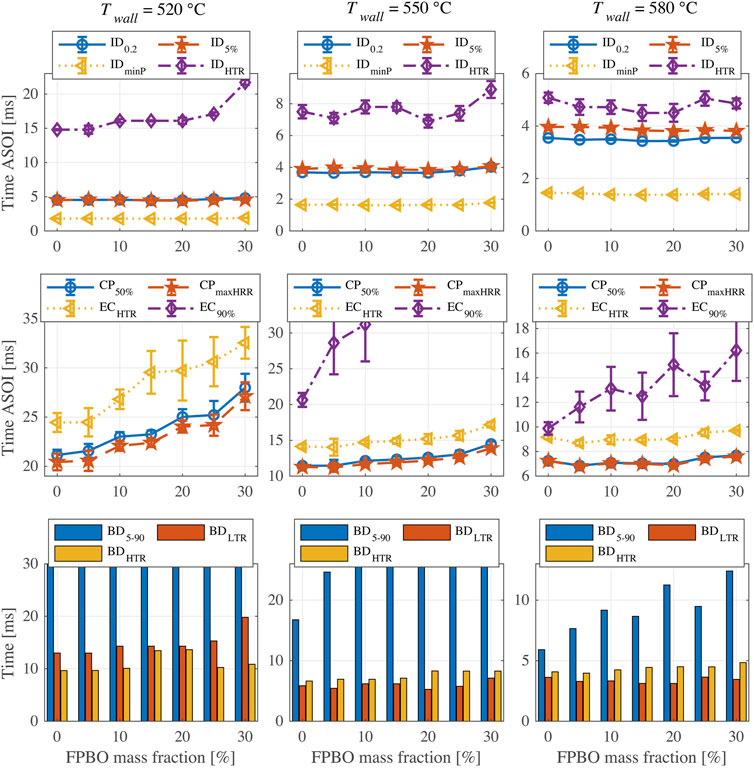
FIGURE 10. Results of ignition and combustion indicators for FPBO and n-butanol blends (5% EHN) at different chamber wall temperatures.
Also for these blends (like for n-butanol/EHN blends), the combustion phasing CP50% remains similar to CPmaxHRR. At 520°C, a higher FPBO proportion results in a delayed CP, but this effect becomes less obvious at higher temperatures, indicating that elevated temperatures improve the evaporation and combustion processes of FPBO. In real engine applications, increasing in-cylinder temperatures at the end of the compression stroke could improve the applicability for fuels with different FPBO proportion. The end-of-combustion metric ECHTR shows similar trends to the CP but has large uncertainty at 520°C. This uncertainty increases with FPBO content. This indicates that an increased FPBO proportion may increase the cyclic variability in an engine, especially under low load conditions in which the in-cylinder temperature is relatively low. EC90% can only be determined at higher temperatures, and it again increases with FPBO proportion.
With respect to the BDLTR and BDHTR, results show that the increase of FPBO prolongs BDHTR at 550 and 580°C, but it has little effect on the BDLTR. However, at 520°C, higher FPBO content leads to an increased BDLTR. These can be explained by the trend of IDHTR as mentioned above. As ECHTR was hard to determine due to the large uncertainty, the BDHTR results could not be evaluated at 520°C.
5 Summary and Conclusion
The ignition and combustion characteristics of n-butanol and FPBO/n-butanol blends are experimentally investigated in a combustion research unit with addition of EHN as an ignition improver. Based on the chamber pressure traces during fuel injection and combustion process, different definitions of combustion indicators are adopted and compared to quantitatively describe the fuel ignition and combustion characteristics. These include ignition delay, combustion phasing, end of combustion, and reaction time. Their applicability and effectiveness for various fuel blends at different chamber wall temperature are analyzed. EHN of 5 wt% is found to provide a good balance between the enhanced ignitability and the dosage of ignition improver. Therefore, this dosage of EHN is used to improve the ignition property of FPBO/n-butanol blends. The fuel blends with different FPBO mass fractions from 0% to 30% are tested and the effects of chamber wall temperature are studied.
The main findings from this study are listed as follows.
1 For n-butanol with EHN addition of 2%–8%, two-stage ignition can be observed for all cases. Adding more EHN into n-butanol results in more and earlier low-temperature heat release. The high-temperature heat release is clearly advanced and its peak becomes higher. However, the effects of EHN levels off at a percentage higher than 8%.
2 Four definitions of ignition delay are discussed. IDminP is not adequate to depict fuel ignition, because it is insensitive to the different chamber wall temperatures. ID0.2 and ID5% show good consistency. They are both able to capture the differences in ignition delay when changing the EHN percentage or chamber wall temperature.
3 EHN also has an effect on the main combustion. IDHTR performs better to capture the huge differences in start of main combustion, but this comes at the cost of a slightly larger uncertainty compared to the other ID definitions.
4 Two definitions of combustion phasing, CP50% and CPmaxHRR, give nearly identical results. This however may be an artefact of the combination of short injection and long ignition delay. When there is significant mixing-controlled phase this is probably not valid.
5 The applicability of two definitions of end of combustion differs: ECHTR depicts the end of high-temperature reaction and shows the similar trend with combustion phasing; however, EC90% has a larger uncertainty and can only be determined at higher chamber wall temperature, owing to the relatively low chemical reactivity of the tested fuels.
6 Three definitions of burn duration are discussed. Similar to EC90%, BD5-90 cannot be determined when the MFB does not exceed 90%. BDLTR and BDHTR are used to depict the burn durations of low-, and high-temperature reactions, respectively. They provide quantitative information for the tested fuels which has an obvious two-stage ignition phenomenon.
7 Higher FPBO content shows little effect on the low-temperature reaction phase, while it delays the HRR peak of the high-temperature reaction phase. This is since generally, the chemical reactivity of FPBO is lower than that of n-butanol. The heavier components in FPBO are difficult to evaporate and burn, leading to the reduced fuel conversion rate and the further delayed EC90%. At high chamber wall temperatures, the increase of FPBO proportions has a less pronounced influence on the BDLTR, while it prolongs the BDHTR. At lower temperatures, higher FPBO proportions worsen the ignitability of the mixture, delaying the IDHTR and prolonging the BDLTR.
8 Chamber wall temperature has a significant influence on the ignition and combustion processes of FPBO/n-butanol blends with 5% EHN. A negative temperature coefficient phenomenon was observed in a chamber wall temperature range of 535–565°C.
Data Availability Statement
The original contributions presented in the study are publicly available. This data can be found here: https://doi.org/10.5281/zenodo.5841988.
Author Contributions
YW, NM, and BS contributed to the conception and design of the research. YW, JH, and MC performed the experimental tests. YW, NM, and MC investigated and implemented the definitions of indicators. BS is the project director. YW wrote the first draft of the manuscript. All authors contributed to manuscript revision.
Funding
This research is supported by the European Union’s Horizon 2020 Research and Innovation programme (SmartCHP project, Grant Agreement No. 815259).
Conflict of Interest
BTG Biomass Technology Group BV provided FPBO samples.
The authors declare that the research was conducted in the absence of any commercial or financial relationships that could be construed as a potential conflict of interest.
Publisher’s Note
All claims expressed in this article are solely those of the authors and do not necessarily represent those of their affiliated organizations, or those of the publisher, the editors and the reviewers. Any product that may be evaluated in this article, or claim that may be made by its manufacturer, is not guaranteed or endorsed by the publisher.
Acknowledgments
The authors would like to thank Robert Coolen, MSc, in the Power and Flow Group of Eindhoven University of Technology for his valuable contribution in CRU data processing. BTG Biomass Technology Group BV is gratefully acknowledged for the FPBO samples.
Abbreviations
BD, Burn duration; CDC, Conventional diesel combustion; CI, Confidence interval; CP, Combustion phasing; CP, Combustion phasing; CVCC, Constant-volume combustion vessel; EC, End of combustion; EHN, 2-ethylhexyl nitrate; FPBO, Fast-pyrolysis bio-oil; HRR, Hear release rate; HTR, High-temperature reaction; ID, Ignition delay; LTR, Low-temperature reaction; MFB, Mass fraction burned; NTC, Negative temperature coefficient; PRR, Pressure rise rate.
References
Alcala, A., and Bridgwater, A. V. (2013). Upgrading Fast Pyrolysis Liquids: Blends of Biodiesel and Pyrolysis Oil. Fuel 109, 417–426. doi:10.1016/j.fuel.2013.02.058
ASTM (2017). ASTM D7668-17, Standard Test Method for Determination of Derived Cetane Number (DCN) of Diesel Fuel Oils—Ignition Delay and Combustion Delay Using a Constant Volume Combustion Chamber Method. West Conshohocken, PA: ASTM International. doi:10.1520/D7668-17
ASTM (2021). ASTM D6890-21, Standard Test Method for Determination of Ignition Delay and Derived Cetane Number (DCN) of Diesel Fuel Oils by Combustion in a Constant Volume Chamber. West Conshohocken, PA: ASTM International.
Atmanli, A., and Yilmaz, N. (2018). A Comparative Analysis of N-Butanol/diesel and 1-pentanol/diesel Blends in a Compression Ignition Engine. Fuel 234, 161–169. doi:10.1016/j.fuel.2018.07.015
Atmanli, A., and Yilmaz, N. (2020). An Experimental Assessment on Semi-low Temperature Combustion Using Waste Oil biodiesel/C3-C5 Alcohol Blends in a Diesel Engine. Fuel 260, 116357. doi:10.1016/j.fuel.2019.116357
Atmanli, A. (2016). Effects of a Cetane Improver on Fuel Properties and Engine Characteristics of a Diesel Engine Fueled with the Blends of Diesel, Hazelnut Oil and Higher Carbon Alcohol. Fuel 172, 209–217. doi:10.1016/j.fuel.2016.01.013
Bridgwater, A. V. (2012). Review of Fast Pyrolysis of Biomass and Product Upgrading. Biomass Bioenergy 38, 68–94. doi:10.1016/j.biombioe.2011.01.048
Broumand, M., Albert-Green, S., Yun, S., Hong, Z., and Thomson, M. J. (2020). Spray Combustion of Fast Pyrolysis Bio-Oils: Applications, Challenges, and Potential Solutions. Prog. Energ. Combust. Sci. 79, 100834. doi:10.1016/j.pecs.2020.100834
Caton, J. A. (2014). Combustion Phasing for Maximum Efficiency for Conventional and High Efficiency Engines. Energ. Convers. Manag. 77, 564–576. doi:10.1016/j.enconman.2013.09.060
CEN (2017). CEN/TR 17103 Fast Pyrolysis Bio-Oil for Stationary Internal Combustion Engines - Quality Determination. Bruxelles, Belgium: European Committee for Standardization.
Curran, H. J., Gaffuri, P., Pitz, W. J., and Westbrook, C. K. (1998). A Comprehensive Modeling Study of N-Heptane Oxidation. Combust. Flame 114, 149–177. doi:10.1016/S0010-2180(97)00282-4
Han, J., and Somers, L. M. T. (2021). Comparative Investigation of Ignition Behavior of Butanol Isomers Using Constant Volume Combustion Chamber under Diesel-Engine like Conditions. Fuel 304, 121347. doi:10.1016/j.fuel.2021.121347
Han, J., Wang, Y., and Somers, B. (2021). Experimental Investigation of Viscosity and Combustion Characteristics of N-Butanol/Diesel Blends. SAE Technical Paper 2021-01-0555, 1–11. doi:10.4271/2021-01-0555
Heywood, J. B. (2018). Internal Combustion Engine Fundamentals. 2nd. Edn. New York: McGraw-Hill Education.
Hossain, A. K., and Davies, P. A. (2013). Pyrolysis Liquids and Gases as Alternative Fuels in Internal Combustion Engines - A Review. Renew. Sust. Energ. Rev. 21, 165–189. doi:10.1016/j.rser.2012.12.031
IP (2006). IP 541: Determination of Ignition and Combustion Characteristics of Residual Fuels – Constant Volume Combustion Chamber Method. London, United Kingdom: Energy Institute.
Joshi, U., Zheng, Z., Shrestha, A., Henein, N., and Sattler, E. (2015). An Investigation on Sensitivity of Ignition Delay and Activation Energy in Diesel Combustion. J. Eng. Gas Turbines Power 137 (9), 091506. doi:10.1115/1.4029777
Kass, M. D., Janke, C., Connatser, R., Lewis, S., Keiser, J., and Theiss, T. (2015). Compatibility Assessment of Elastomeric Infrastructure Materials with Neat Diesel and a Diesel Blend Containing 20 Percent Fast Pyrolysis Bio-Oil. SAE Int. J. Fuels Lubr. 8, 50–61. doi:10.4271/2015-01-0888
Kass, M. D., Armstrong, B. L., Kaul, B. C., Connatser, R. M., Lewis, S., Keiser, J. R., et al. (2020). Stability, Combustion, and Compatibility of High-Viscosity Heavy Fuel Oil Blends with a Fast Pyrolysis Bio-Oil. Energy Fuels 34, 8403–8413. doi:10.1021/acs.energyfuels.0c00721
Krivopolianskii, V., Bjørgen, K. O. P., Emberson, D., Ushakov, S., Æsøy, V., and Løvås, T. (2019). Experimental Study of Ignition Delay, Combustion, and NO Emission Characteristics of Hydrogenated Vegetable Oil. SAE Int. J. Fuels Lubr. 12, 29–42. doi:10.4271/04-12-01-0002
Kuszewski, H. (2018). Effect of Adding 2-ethylhexyl Nitrate Cetane Improver on the Autoignition Properties of Ethanol-Diesel Fuel Blend - Investigation at Various Ambient Gas Temperatures. Fuel 224, 57–67. doi:10.1016/j.fuel.2018.03.084
Lee, S., and Kim, T. Y. (2015). Feasibility Study of Using wood Pyrolysis Oil-Ethanol Blended Fuel with Diesel Pilot Injection in a Diesel Engine. Fuel 162, 65–73. doi:10.1016/j.fuel.2015.08.049
Lee, S., Jang, Y., Kim, T. Y., Kang, K.-Y., Kim, H., and Lim, J. (2013). Performance and Emission Characteristics of a Diesel Engine Fueled with Pyrolysis Oil-Ethanol Blend with Diesel and Biodiesel Pilot Injection. SAE Int. J. Fuels Lubr. 6, 785–793. doi:10.4271/2013-01-2671
Lee, S., Woo, S. H., Kim, Y., Choi, Y., and Kang, K. (2020). Combustion and Emission Characteristics of a Diesel-Powered Generator Running with N-Butanol/coffee Ground Pyrolysis Oil/diesel Blended Fuel. Energy 206, 118201. doi:10.1016/j.energy.2020.118201
Lehto, J., Oasmaa, A., Solantausta, Y., Kytö, M., and Chiaramonti, D. (2014). Review of Fuel Oil Quality and Combustion of Fast Pyrolysis Bio-Oils from Lignocellulosic Biomass. Appl. Energ. 116, 178–190. doi:10.1016/j.apenergy.2013.11.040
Li, Y., Xu, H., Cracknell, R., Head, R., and Shuai, S. (2019). An Experimental Investigation into Combustion Characteristics of HVO Compared with TME and ULSD at Varied Blend Ratios. Fuel 255, 115757. doi:10.1016/j.fuel.2019.115757
Liang, X., Zhong, A., Sun, Z., and Han, D. (2019). Autoignition of N-Heptane and Butanol Isomers Blends in a Constant Volume Combustion Chamber. Fuel 254, 115638. doi:10.1016/j.fuel.2019.115638
Lillo, P. M., Pickett, L. M., Persson, H., Andersson, O., and Kook, S. (2012). Diesel Spray Ignition Detection and Spatial/Temporal Correction. SAE Int. J. Engines 5, 1330–1346. doi:10.4271/2012-01-1239
Liu, H. F., Wen, M. S., Cui, Y. Q., Zhang, C. Q., Zheng, Z. Q., and Yao, M. F. (2020). Effect of Blending N-Butanol in Diesel on Flame Development and Spectrum. Spectrosc. Spectr. Anal. 40 (7), 1998–2004. doi:10.3964/j.issn.1000-0593(2020)07-1998-07
Maes, N., Hooglugt, M., Dam, N., Somers, B., and Hardy, G. (2020). On the Influence of wall Distance and Geometry for High-Pressure N-Dodecane spray Flames in a Constant-Volume Chamber. Int. J. Engine Res. 21, 406–417. doi:10.1177/1468087419875242
Malbec, L.-M., Egúsquiza, J., Bruneaux, G., and Meijer, M. (2013). Characterization of a Set of ECN Spray A Injectors: Nozzle to Nozzle Variations and Effect on Spray Characteristics. SAE Int. J. Engines 6, 1642–1660. doi:10.4271/2013-24-0037
Mueller, C. J. (2013). The Feasibility of Using Raw Liquids from Fast Pyrolysis of Woody Biomass as Fuels for Compression-Ignition Engines: A Literature Review. SAE Int. J. Fuels Lubr. 6, 251–262. doi:10.4271/2013-01-1691
Oliva, F., and Fernández-Rodríguez, D. (2020). Autoignition Study of LPG Blends with Diesel and HVO in a Constant-Volume Combustion Chamber. Fuel 267, 117173. doi:10.1016/j.fuel.2020.117173
Poferl, D. J., and Svehla, R. A. (1973). Thermodynamic and Transport Properties of Air and its Products of Combustion with ASTMA-A-1 Fuel and Natural Gas at 20, 30, and 40 Atmospheres. Washington, DC: NASA.
Prak, D. J. L., Cowart, J. S., Hamilton, L. J., Hoang, D. T., Brown, E. K., and Trulove, P. C. (2013). Development of a Surrogate Mixture for Algal-Based Hydrotreated Renewable Diesel. Energy Fuels 27, 954–961. doi:10.1021/ef301879g
Rabl, S., Davies, T. J., McDougall, A. P., and Cracknell, R. F. (2015). Understanding the Relationship between Ignition Delay and Burn Duration in a Constant Volume Vessel at Diesel Engine Conditions. Proc. Combust. Inst. 35, 2967–2974. doi:10.1016/j.proci.2014.05.054
SmartCHP (2019). SmartCHP: Cogenerating a Renewable Future. Available at: https://www.smartchp.eu/ (Accessed November 10, 2021).
Somers, K. P., Curran, H. J., Burke, U., Banyon, C., Hakka, H. M., Battin-Leclerc, F., et al. (2018). The Importance of Endothermic Pyrolysis Reactions in the Understanding of Diesel spray Combustion. Fuel 224, 302–310. doi:10.1016/j.fuel.2018.02.173
van de Beld, B., Holle, E., and Florijn, J. (2013). The Use of Pyrolysis Oil and Pyrolysis Oil Derived Fuels in Diesel Engines for CHP Applications. Appl. Energ. 102, 190–197. doi:10.1016/j.apenergy.2012.05.047
van de Beld, B., Holle, E., and Florijn, J. (2018). The Use of a Fast Pyrolysis Oil - Ethanol Blend in Diesel Engines for Chp Applications. Biomass Bioenergy 110, 114–122. doi:10.1016/j.biombioe.2018.01.023
Wang, R., and Ben, H. (2020). Accelerated Aging Process of Bio-Oil Model Compounds: A Mechanism Study. Front. Energ. Res. 8, 79. doi:10.3389/fenrg.2020.00079
Wang, Y., Han, J., Maes, N., and Somers, B. (2021). “Ignition and Combustion Characteristics of N-Butanol and FPBO/n-butanol Blends with Addition of Ignition Improver,” in 10th European Combustion Meeting (ECM 2021), Naples, Italy, April 14–15, 2021.
Zhang, Y., Kook, S., Kim, K. S., and Kweon, C.-B. (2021). Assessments of Pressure-Based Ignition Delay Measurements of Various Cetane Number Fuels in a Small-Bore Compression Ignition Engine. SAE Int. J. Engines 14, 683–695. doi:10.4271/03-14-05-0041
Zheng, Z., Yue, L., Liu, H., Zhu, Y., Zhong, X., and Yao, M. (2015). Effect of Two-Stage Injection on Combustion and Emissions under High EGR Rate on a Diesel Engine by Fueling Blends of Diesel/gasoline, Diesel/n-Butanol, Diesel/gasoline/n-Butanol and Pure Diesel. Energ. Convers. Manag. 90, 1–11. doi:10.1016/j.enconman.2014.11.011
Keywords: n-butanol, fast-pyrolysis bio-oil, ignition, combustion, 2-ethyl-hexyl nitrate, combustion research unit, constant-volume combustion chamber
Citation: Wang Y, Han J, Maes N, Cuijpers M and Somers B (2022) Ignition and Combustion Characteristics of N-Butanol and FPBO/N-Butanol Blends With Addition of Ignition Improver. Front. Energy Res. 10:832509. doi: 10.3389/fenrg.2022.832509
Received: 09 December 2021; Accepted: 12 January 2022;
Published: 04 February 2022.
Edited by:
Mario Commodo, CNR—Istituto di Scienze e Tecnologie per l’Energia e la Mobilità Sostenibili (STEMS), ItalyReviewed by:
Haifeng Liu, Tianjin University, ChinaAlpaslan Atmanli, National Defense University, Turkey
Copyright © 2022 Wang, Han, Maes, Cuijpers and Somers. This is an open-access article distributed under the terms of the Creative Commons Attribution License (CC BY). The use, distribution or reproduction in other forums is permitted, provided the original author(s) and the copyright owner(s) are credited and that the original publication in this journal is cited, in accordance with accepted academic practice. No use, distribution or reproduction is permitted which does not comply with these terms.
*Correspondence: Yu Wang, y.wang14@tue.nl