Modeling Yield, Biogenic Emissions, and Carbon Sequestration in Southeastern Cropping Systems With Winter Carinata
 John L. Field1,2*
  Yao Zhang2
  Ernie Marx2
  Kenneth J. Boote3 Mark Easter2† Sheeja George4 Nahal Hoghooghi5 Glenn Johnston6
  Farhad Hossain Masum7
  Michael J. Mulvaney8
  Keith Paustian2,9
  Ramdeo Seepaul4
  Amy Swan2 Steve Williams2 David Wright4
  Puneet Dwivedi7
- 1Bioresource Science & Engineering Group, Environmental Sciences Division, Oak Ridge National Laboratory, Oak Ridge, TN, United States
- 2Natural Resource Ecology Laboratory, Colorado State University, Fort Collins, CO, United States
- 3Department of Agricultural and Biological Engineering, University of Florida, Gainesville, FL, United States
- 4North Florida Research and Education Center, University of Florida, Quincy, FL, United States
- 5School of Environmental, Civil, Agricultural, and Mechanical Engineering, University of Georgia, Athens, GA, United States
- 6Nuseed, West Sacramento, CA, United States
- 7Warnell School of Forestry and Natural Resources, University of Georgia, Athens, GA, United States
- 8Department of Plant and Soil Sciences, Mississippi State University, Starkville, MS, United States
- 9Department of Soil and Crop Sciences, Colorado State University, Fort Collins, CO, United States
Sustainable aviation fuel (SAF) production from lipids is a technologically mature approach for replacing conventional fossil fuel use in the aviation sector, and there is increasing demand for such feedstocks. The oilseed Brassica carinata (known as Ethiopian mustard or simply carinata) is a promising SAF feedstock that can be grown as a supplemental cash crop over the winter fallow season of various annual crop rotations in the Southeast US, avoiding land use changes and potentially achieving some of the soil carbon sequestration and ecosystem service benefits of winter cover crops. However, carinata may require more intensive management than traditional cover crops, potentially leading to additional soil greenhouse gas (GHG) emissions through increased carbon losses from soil tillage and nitrous oxide (N2O) emissions from nitrogen fertilizer application. In this work, the 2017 version of the process-based DayCent ecosystem model was used to establish initial expectations for the total regional SAF production potential and associated soil GHG emissions when carinata is integrated as a winter crop into the existing crop rotations across its current suitability range in southern Alabama, southern Georgia, and northern Florida. Using data from academic and industry carinata field trials in the region, DayCent was calibrated to reproduce carinata yield, nitrogen response, harvest index, and biomass carbon-to-nitrogen ratio. The resulting model was then used to simulate the integration of carinata every third winter across all 2.1 Mha of actively cultivated cropland in the study area. The model predicted regional average yields of 2.9–3.0 Mg carinata seed per hectare depending on crop management assumptions. That results in the production of more than two million Mg of carinata seed annually across the study area, enough to supply approximately one billion liters of SAF. Conventional management of carinata led to only modest increases in soil carbon storage that were largely offset by additional N2O emissions. Climate-smart management via adopting no-till carinata establishment or using poultry litter as a nitrogen source resulted in a substantial net soil GHG sink (0.23–0.31 Mg CO2e ha−1 y−1, or 0.24–0.32 Mg CO2e per Mg of seed produced) at the farms where carinata is cultivated.
Introduction
Of the different measures proposed to reduce fossil fuel use in aviation, shipping, and long-haul transport, biofuels are seen as one of the most technologically mature and cost-effective approaches (Fulton et al., 2015; Davis et al., 2018). Many decarbonization scenarios project a significant role for advanced liquid biofuels, working in conjunction with demand management and other low-carbon fuel alternatives (Williams et al., 2021). Sustainable aviation fuels (SAF) are the central element of many aviation sector decarbonization plans, which anticipate a substantial build-out of biofuel production facilities (Chiaramonti, 2019). Most SAF production today involves converting waste oils from the food sector to hydrogenated esters and fatty acids (HEFA), the cheapest and most technologically mature SAF production pathway (O’Malley et al., 2021). Waste oil supplies are limited, but the cultivation of purpose-grown oilseed crops offers an alternative more scalable feedstock option (Zemanek et al., 2020; O’Malley et al., 2021).
In addition to the transportation sector, urgent measures are also needed to reduce emissions from the agricultural sector consistent with climate stabilization targets (Clark et al., 2020). Priorities include increasing soil organic carbon (SOC) storage and reducing emissions of nitrous oxide (N2O) associated with nitrogen (N) fertilizer use (Paustian et al., 2016; Rockström et al., 2016; Minasny et al., 2017). Winter cover crops are a means to improve both SOC levels and N management. Replacing winter fallow periods with vegetation cover may contribute to increased annual net primary production and soil carbon. Meta-analyses report SOC increase rates of 0.2–0.6 Mg C ha−1 y−1 from the addition of cover crops, with the largest SOC benefits observed under non-legume cover crops in temperate climates and on fine-textured soils (Poeplau and Don, 2015; Abdalla et al., 2019; Jian et al., 2020; McClelland et al., 2021). Winter cover crops can also immobilize soil mineral N and potentially improve system N use efficiency through reduced nitrate leaching (Tonitto et al., 2006; Abdalla et al., 2019), though cover crop effects on N2O vary depending on how residues are managed and whether legume species are included (Muhammad et al., 2019).
Winter oilseed cash crops present an opportunity for temporal intensification to produce SAF feedstock without displacing existing summer crop production or requiring land use change (Heaton et al., 2013), while potentially achieving some of the same soil health benefits as winter cover cropping. Options for oilseed cultivation include pennycress integrated into corn–soybean rotations in the US Corn Belt (Markel et al., 2018; Cubins et al., 2019) and camelina integrated into winter wheat–fallow rotations in the Great Plains (Resurreccion et al., 2021). In the relatively mild climate of the Southeast US, Brassica carinata can achieve greater yields than other oilseed species. Carinata seed contains a large proportion (∼40% by mass) of high-quality oil that is readily converted to SAF with existing technologies (George et al., 2021). The carinata seed meal remaining after oil extraction is protein-rich and has value as animal feed (Schulmeister et al., 2019b; Schulmeister et al., 2019a; Schulmeister et al., 2021). Carinata stems, leaves, and roots remain in the field after seed harvest, where they can contribute to SOC. The Southeast Partnership for Advanced Renewables from Carinata (SPARC) is a public–private partnership funded by the US Department of Agriculture to advance carinata for these multiple applications, in collaboration with relevant stakeholders (George et al., 2021).
As with the introduction of any new crop, much is unknown regarding the best management practices, likely yields, environmental consequences, and financial outcomes of growing carinata in the Southeast. While there have been limited measurements of SOC, N2O, and other soil GHGs for carinata grown as a summer crop in the cooler and drier climate of the Northern Great Plains (Li et al., 2019; Bhattarai et al., 2021), the authors are aware of no comparable soil GHG measurements for carinata grown as a winter cover crop in the Southeast. Furthermore, best management practices are still being developed, and it is unknown to what extent the agronomy of this winter cash crop can be optimized to simultaneously achieve both high yields as well as the environmental and soil health benefits expected of a cover crop. While cover-cropping generally increases SOC levels, carinata may require additional tillage operations for establishment (Iboyi et al., 2021) that could undermine this effect due to soil disturbance and SOC destabilization (Bailey et al., 2019). Similarly, economically viable carinata seed production requires the application of substantial amounts of N fertilizer during the winter (Seepaul et al., 2019a; Bashyal et al., 2021) which may increase N2O emissions (Crutzen et al., 2008; Roth et al., 2015).
This work used a process-based ecosystem model to estimate carinata productivity and net soil GHG sink performance when carinata is integrated into annual crop rotations within a sub-region of the Southeast US. The model was calibrated and validated against data from carinata field trials in the region. The analysis assumed that carinata would be cultivated once every third winter (to limit disease and pest issues; Seepaul et al., 2019b) across all annual cropland in the region. In addition to a conventional carinata management scenario involving intensive field preparation and synthetic N fertilizer application, two alternative climate-smart management scenarios were also considered. This assessment focused on the biophysical dimensions of carinata production and local soil GHG emissions. Other supply chain sustainability considerations such as upstream emissions from fertilizer production and the alternate fate of poultry litter are left for future consequential life-cycle assessment studies.
Materials and Methods
Study Area
This analysis considered the integration of winter-grown carinata within existing agricultural rotations across a sub-region of the Southeastern US covering southern Alabama, southern Georgia, and northern Florida (Figure 1). These study area boundaries were selected based on prior analysis of weather and soil suitability for existing commercial carinata varieties (Alam and Dwivedi, 2019). The LANDSAT-derived 2016 Land Cover database (NLCD) (Homer et al., 2020) was used to identify cultivated cropland in this study area. Four counties around the periphery of the study area (Franklin County in Florida and Camden, Lincoln, and McIntosh Counties in Georgia) contained no cultivated cropland and were excluded from further analysis. The remaining 163 counties included 2.34 Mha of cultivated cropland as per NLCD, distributed as shown in Figure 1A. The majority of the cultivated cropland in this study area falls within the Southern Coastal Plain Major Land Resource Area (MLRA 133A), an area of deep, loamy Utisols, Entisols, and Incepticols (USDA NRCS, 2006). Other MLRAs included in the study area were the Alabama and Mississippi Blackland Prairie (135A); the Carolina and Georgia Sand Hills (137); the Eastern Gulf Coast (152A), Atlantic Coast (153A), and Southern Florida (155) Flatwoods; and the North-Central (138) and South-Central (154) Florida Ridge. Cultivated cropland in these areas supports various rotations of soybean, cotton, corn, wheat, and peanut. The remainder of the study area is dominated by woody wetlands and evergreen forest (Boryan et al., 2011).
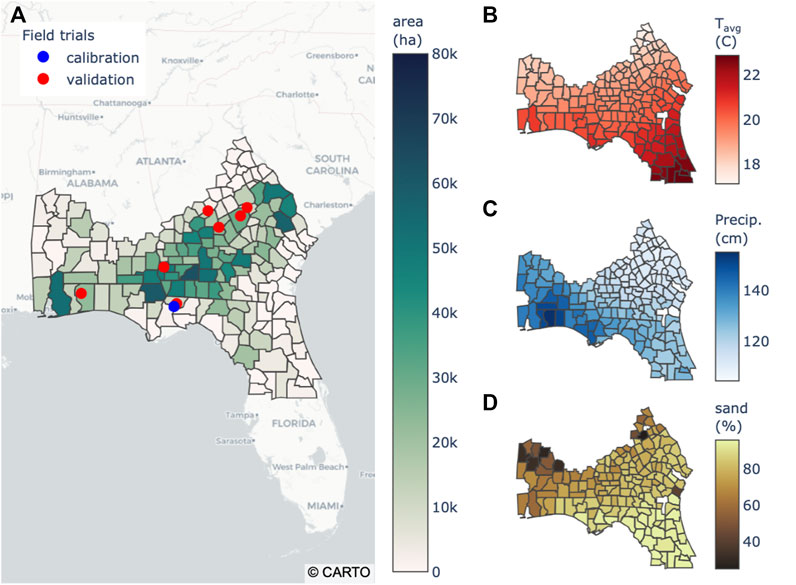
FIGURE 1. Study area characteristics based on spatial data inputs used with the DayCent model. (A) Cultivated cropland area as per NLCD, with locations of carinata trials used for calibration (blue marker) and validation (red markers). (B) Average air temperature and (C) annual total precipitation as per NARR. (D) Average sand content of the surface soil layer as per SSURGO, considering cropland areas only.
This region has a humid subtropical climate as per the Köppen Climate Classification system. Average annual air temperature varies from 17 to 23°C across a north–south gradient (Figure 1B), and average annual precipitation varies from 105 cm in eastern Georgia to more than 150 cm at the Alabama Gulf Coast (Figure 1C), as computed using data from the North American Regional Reanalysis (NARR; Mesinger et al., 2006). Surface soil textures cover a wide range as computed from the Soil Survey Geographic (SSURGO) database (Ernstrom and Lytle, 1993), from moderate-texture soils in the northern part of the study area to extremely coarse (>90% sand) soils in central Florida (Figure 1D).
Ecosystem Model Calibration
The DayCent ecosystem model was used to predict carinata seed yields and soil GHG effects in the region. DayCent is a process-based model that simulates carbon, N, and water cycling in natural and agricultural ecosystems on a daily timestep as a function of soils, climate, and management (Del Grosso et al., 2002). DayCent has previously been used to model a variety of other oilseed crops including canola (He et al., 2021), sunflower (Gryze et al., 2010), and soybean (Zhang et al., 2020a). It has also been used extensively in bioenergy assessments to predict energy crop yields and associated changes in SOC storage and N2O emissions (Field et al., 2018). DayCent estimates of crop production are sensitive to growing-season temperatures, as well as water and N stresses that reflect the balance of multiple input and loss mechanisms in addition to water and N movement vertically through the soil profile (Qian et al., 2019). These simulations utilized the DDcentEVI version of DayCent from May 2017.
Field data on carinata performance were collected by academic and industry collaborators at a variety of sites across the study area, as illustrated in Figure 1A and summarized in Table 1. Initial model calibration was based on data from plot-scale field trials conducted at the University of Florida North Florida Research and Education Center in Quincy, Florida over the winter of 2015/2016 (Seepaul et al., 2019a). The experimental site featured coarse-textured soil with 82% sand content. Carinata was grown as a winter crop following a fallow summer (i.e., outside of a standard regional crop rotation) under a range of N fertilizer application rates (0, 45, 90, and 135 kg N ha−1 y−1). This trial produced data on seed yield after mechanical harvest, harvest index, root:shoot ratio, and C:N ratio of aboveground biomass at the time of harvest, which were used for DayCent calibration. The study featured a randomized complete block design with four replications, and the average results across all four replications were used for model calibration purposes.
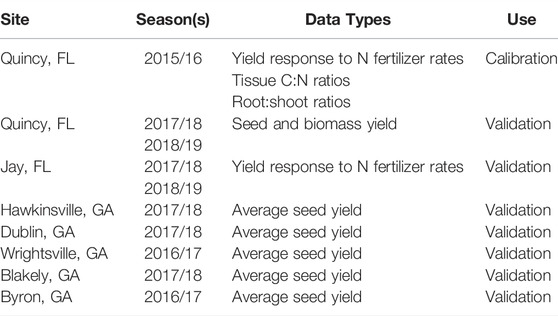
TABLE 1. Field data sources used for DayCent model calibration and validation.
A generalized carinata crop was created within DayCent by calibrating individual crop parameters manually with an iterative method for best fit against the calibration dataset, in a process similar to that described by Del Grosso et al. (2011) and Field et al. (2016). Carinata is photoperiod-sensitive, so crop phenology (i.e., emergence and physiological maturity) was set based on fixed calendar dates rather than as a function of growing degree day accumulation. Physiological maturity was set to occur on May 6 based on the average date observed in the field trials at Quincy FL and Jay FL listed in Table 1, plus additional trials at Quincy and in Shorter, Alabama. The 2017 version of DayCent does not explicitly represent the dynamics of annual crop physiological maturation and senescence, so crop growth was terminated on the physiological maturity date. Calibration results against the various measurements from the 2015/16 Quincy field trials are shown in Supplementary Figure S1. The calibrated model was generally able to reproduce key observations from the field trial, though with some tendency to under-estimate seed yield and aboveground biomass C:N ratios under lower N rates.
Following model calibration, seed yield data from multiple subsequent carinata field trials were used for independent model validation. Plot-scale, machine-harvested carinata yield data was collected during the 2017/2018 and 2018/2019 winter seasons under a single N fertilizer treatment at Quincy, Florida, and under a range of N application rates at the University of Florida West Florida Research and Education Center in Jay, Florida (Bashyal et al., 2021; Boote et al., 2021). Other aspects of the experimental design were consistent with the 2015/2016 Quincy experiment. In addition, the project commercial partner Agrisoma, Inc. (later acquired by Nuseed) provided field-scale yield data from trials conducted at five farms in Georgia, listed in Table 1 using the name of the nearest town to preserve landowner anonymity.
No measurements of SOC change or N2O emissions under carinata within the study area were available for model calibration or validation purposes at the time of this study.
Management Scenarios
Existing cropping patterns in this region include corn, cotton, peanut, soybean, wheat, and sorghum grown in various rotations. Research is ongoing to develop early maturing carinata varieties and determine their best integration into existing rotations to relieve disease and pest cycles while minimizing any delay in summer crop planting (Seepaul et al., 2019b; George et al., 2021). This study considered the integration of carinata into annual crop rotations across all cultivated cropland in the study area. For simplicity, all cropland is modeled as being under a 3-year cotton–cotton–peanut rotation. Carinata should be grown only once every 3 years to minimize pest and disease issues (Seepaul et al., 2019b), so this analysis considered the integration of a single winter carinata crop over the winter between the two cotton summer crops (with the remaining two winters left fallow). These simulations are meant to be broadly representative of carinata integration into a range of existing crop rotations practiced across this region.
Within that modified rotation, a conventional carinata management scenario was considered involving tilled field preparation and synthetic fertilizer use, as well as two “climate-smart” management scenarios that could lead to improved soil GHG outcomes. The management scenarios draw heavily from the experience of agronomic field trials supported by the SPARC project (George et al., 2021) and its predecessors (Seepaul et al., 2019a). In both cases, the new rotation with carinata was evaluated against the continued business-as-usual cotton–cotton–peanut rotation with winter fallow.
Conventional Management Scenario
The conventional management scenario included conventional tillage practices for field preparation and synthetic fertilizer application to meet the N needs of the carinata crop. Field preparation was simulated as two moderately heavy disking steps (DayCent CULT H events), and carinata was planted in mid-November with a seed drill. A total of 90 kg N ha−1 fertilizer was applied in the form of UAN-32 in a split application, with 20 kg N ha−1 applied at the time of planting and the remainder applied in mid-February. This rate is slightly lower than the economic optimum rate estimated for carinata in this region (103 kg N ha−1; Seepaul et al., 2020) to maximize the soil GHG and ecosystem service benefits of the crop. Carinata was simulated as reaching physiological maturity on May 6, and it was assumed that harvest would occur in late May following a 3-week dry-down period, and the following summer crop planted immediately afterward.
Climate-Smart Management Scenarios
In addition to the conventional management scenario, two alternative climate-smart management scenarios (Paustian et al., 2016) designed to improve the soil GHG balance of carinata production were considered, as highlighted in Table 2. The first scenario assumed no-till establishment of carinata in which the disking of the conventional management scenario is replaced with an herbicide “burn-down” step, followed by drilling of carinata seed into the stubble of the last crop. Initial agronomic field trials suggest this may be a viable establishment method in this region (Iboyi et al., 2021). DayCent simulates a number of potential feedbacks on crop productivity from the no-till establishment, including delayed germination from a surface litter mulching effect, and reduced rates of soil N mineralization.
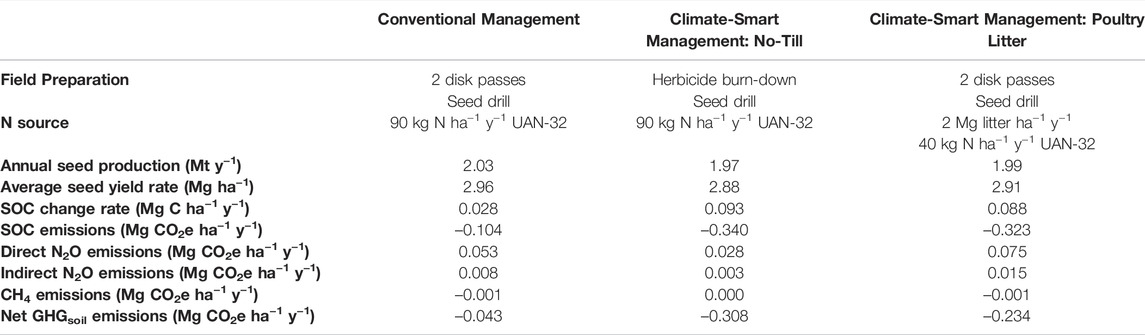
TABLE 2. Summary of regional-scale simulation results for different carinata management scenarios. All soil GHG values are evaluated relative to the continued business-as-usual cotton–cotton–peanut reference rotation.
The second climate-smart management scenario assumed that poultry litter is applied as an N-rich soil amendment and incorporated into the soil during disking, reducing the need for synthetic N fertilizer application (George et al., 2021). Data on poultry litter organic carbon (Corg) and N concentrations were gathered from literature studies where both values were explicitly reported so that litter C:N ratios could be calculated (Das et al., 2002; Sharpley et al., 2009; Lynch et al., 2013; Rogeri et al., 2016; Ashworth et al., 2020), as summarized in Supplementary Table S1. Based on this analysis, a poultry litter organic amendment was parameterized with a C:N ratio of 7.3 and assuming that only half of total litter N content is plant-available in the first year after application (Gaskin et al., 2013). In this climate-smart scenario approximately half of the carinata N requirement is met through application and incorporation of 2.0 Mg ha−1 poultry litter at the time of crop establishment, and an additional 40 kg N ha−1 is applied in the form of UAN-32 in mid-February.
Specifying and Executing Simulations
Specifying DayCent Simulations
DayCent is a one-dimensional model, and multiple point simulations must be run to capture the heterogeneity in soils, climate, and land use history across the study area (Field et al., 2016). DayCent simulation requires input data on soil texture throughout the soil profile, as well as representative daily air temperature and precipitation totals. These inputs were derived via a GIS intersect of the NLCD land cover, SSURGO soil, and Precipitation-elevation Regressions on Independent Slopes Model (PRISM; Daly et al., 1994) weather data layers. The principal soil component was used as representative of each SSURGO soil map unit. PRISM data is available on a 4 km grid, though a 3 × 3 nearest neighbor re-sampling (to a new effective grid size of 12 km) was performed to limit the number of simulations required. The simulations used 38 years of historic PRISM weather data (1981–2018) to represent past and future weather variability in this region.
Every unique combination of SSURGO soil component and re-sampled PRISM weather grid cell occurring on NLCD cultivated cropland represents a unique DayCent ‘strata’ requiring individual simulation. A total of 30,720 individual strata were identified in the study area. The density of strata was generally highest in counties with the greatest cropland area, as shown in Supplementary Figure S2.
Model Initialization and Batch Simulations
Model initialization was performed to estimate initial soil carbon and N levels in various model pools based on pre-cultivation land cover and region-specific dates of historic European settlement and associated cropping practices, aligned with the DayCent procedures used for the EPA Inventory of U.S. Greenhouse Gas Emissions and Sinks and farm-level GHG emissions accounting tools (Paustian et al., 2018; US EPA, 2020a). Next, 6 decades of cotton–cotton–peanut rotation was simulated on all cropland in the study area, so that soil carbon pools could approach new equilibrium values reflecting that management. Following that, a reference case of continued business-as-usual cotton–cotton–peanut rotation was simulated for 30 years into the future (starting in the year 2020), re-using historic PRISM weather data. In addition, carinata integration under each of the three different carinata management scenarios was also simulated for the future period. Each of these four forward scenarios was simulated for each DayCent strata (a total of 11.1 million new simulation-years) via batch execution on the Colorado State University Natural Resource Ecology Laboratory computing cluster.
Post-Processing and Analysis
Post-Processing Carinata Yield and Soil Greenhouse Gas Emissions
DayCent model output for each strata was converted to per-area carinata seed yield rates and the various components of the soil GHG balance. DayCent reports crop yield in carbon units (g C m−2), and this was converted to per-area yield of field-dry seed at 8% moisture content (Mg seed ha−1) assuming a seed carbon concentration of 45% (the same assumptions utilized during model calibration and validation). Total annual production per county was calculated by multiplying the carinata yield rate calculated for each stratum by the area of NLCD cultivated cropland covered by that stratum, summing those results across each county, and then dividing by three to reflect that the crop is only cultivated once every 3 years.
The soil GHG emissions balance associated with carinata production was calculated from a variety of raw DayCent model outputs including total SOC (simulated to a depth of 20 cm), the emissions rate of N in the form of N2O from soil nitrification and denitrification processes, the loss rates of N via volatilization and nitrate leaching, and the soil oxidation rate of methane (CH4). The rates of annual SOC change (Mg C ha−1 y−1), direct N2O emissions from nitrification and denitrification, and soil oxidation of CH4 were extracted directly from DayCent model output and averaged across the full length of the 30-years forward simulation. Indirect emissions of N2O were estimated based on the average DayCent-simulated annual rates of N volatilization and leaching, using the indirect N2O emissions factors recommended by the Intergovernmental Panel on Climate Change (IPCC) guidelines (Eggleston et al., 2006).
The average rates of SOC change, direct and indirect N2O emissions, and soil oxidation of CH4 under the business-as-usual reference rotation were then subtracted from the average rates calculated in each carinata scenario, to identify the relative changes attributable to carinata cultivation. Rates of soil carbon change were translated to a net flux of CO2 into or out of the soil profile, and N2O and CH4 fluxes were translated into CO2-equivalent terms based on their 100-year global warming potential as per IPCC guidelines (Stocker et al., 2014). The total net soil GHG balance of carinata production was calculated as the sum of these CO2-equivalent emissions from SOC change (with SOC loss producing a positive emission to the atmosphere and SOC gain producing a negative emission from the atmosphere), direct and indirect N2O emissions, and soil CH4 oxidation (with increased oxidation producing a negative emission from the atmosphere). Finally, direct N2O emissions rates were compared to the total additional (synthetic and organic) N inputs for carinata production, to calculate N2O-N emissions factors comparable to those used in IPCC emissions accounting (Eggleston et al., 2006).
Cropland Area Correction
The DayCent spatial modeling workflow required a remotely sensed land cover product like NLCD to identify specific cropland locations so that the underlying soils could be accurately represented. However, remotely-sensed land use products can differ significantly from one another, and from survey-based land-use estimates, in terms of the total cropland area quantified in each county (Johnson, 2013). The USDA Census of Agriculture (CoA; https://www.nass.usda.gov/AgCensus/) is generally considered the most accurate estimate of US cropland extent (Maxwell et al., 2008; Lark et al., 2020). Previous studies have shown that county cropland areas reported by NLCD and CoA agree well in agriculture-heavy areas of the US Corn Belt (Maxwell et al., 2008), but diverge significantly in regions with smaller farm size and lower agricultural land extent (Maxwell et al., 2008; Goslee, 2011), as is the case in the Southeast US.
To most accurately represent the true annual cropland extent in this region, DayCent results were re-scaled against the annual cropland area in each county as per the 2017 CoA. Actively utilized annual cropland was estimated from the sum of the “harvested”, “failed”, and “summer fallow” cropland sub-categories within CoA, avoiding areas classified as idle cropland or cropland–pasture (which are included in the top-level census “cropland” category, but are generally not representative of active annual crop rotations) (US EPA, 2018; Lark et al., 2020). Supplementary Figure S3 shows how the remotely-sensed NLCD product tends to over-estimate cropland area relative to CoA in the relatively crop-dense center of the study area, but underestimate it elsewhere. This re-scaling procedure revised the total cropland extent in the study area downward by 12% (from 2.34 Mha down to 2.05 Mha) and reduced the estimate of total regional carinata seed production by a similar amount. This procedure assumed that NLCD provides an unbiased estimate of which soils within a given county are cropped, i.e., there is minimal correlation between NLCD classification errors and underlying soil type.
Results in the Context of Sustainable Aviation Fuel Production
Simulated carinata seed yields and soil GHG emissions results were also interpreted in the context of SAF production. Total regional carinata–SAF production potential was calculated based on a prior estimate of 524 L of SAF yield per Mg of carinata seed from a HEFA conversion process (Alam and Dwivedi, 2019). Based on that conversion yield, and assuming an SAF energy density of 30.8 MJ per liter, soil GHG results were also expressed in terms of their potential contribution to the GHG footprint of carinata-derived SAF, i.e., in units of g CO2e (MJ fuel)−1. Such calculations must reflect that carinata seed crushing produces both carinata oil and a seed meal co-product (with value as a high-protein animal feed supplement), and that converting carinata oil to SAF via a HEFA process also yields propane and naphtha fuel fractions. Thus, SAF constitutes only 32% of the total mass, 62% of the total market value, and 49% of the total energy content of all products derived from carinata seed (Alam et al., 2021), and it should only be allocated a comparable amount of the total environmental burdens and benefits of carinata production.
Results
Model Validation
Figure 2 shows the results of validating the DayCent carinata model against an independent set of carinata seed yield data as described in Table 1. Only results for 90 kg N ha−1 fertilizer treatments are included, to focus on the model’s ability to capture site-to-site and year-to-year variability. The calibrated DayCent model was able to reproduce approximately 1/3 of the variability in carinata yield observed across site–years, with a normalized root mean square error of 0.26. Additional validation results that include the full range of N treatments at the Jay, FL field trial site are shown in Supplementary Figure S4.
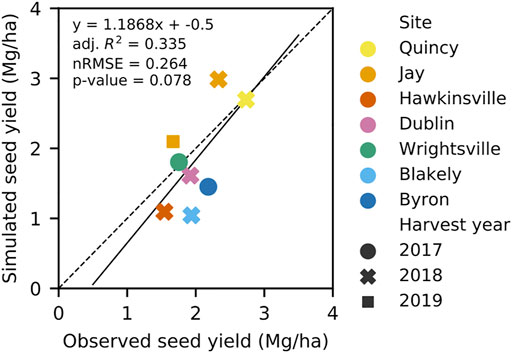
FIGURE 2. DayCent model validation results, using field observations described in Table 1.
Regional Seed Yield
Simulated yields were similar across all three carinata management scenarios. Representative results for the conventional carinata management scenario are shown in Figure 3. The average simulated carinata seed yield across the study area was 2.96 Mg ha−1 in that scenario, with maximum county-averaged values of approximately 3.2 Mg ha−1 achieved in southwestern Georgia (Figure 3A). The simulated yield was lower and more variable from year-to-year (Supplementary Figure S5) on the sandy soils of central Florida, likely attributable to N stress driven by nitrate leaching.
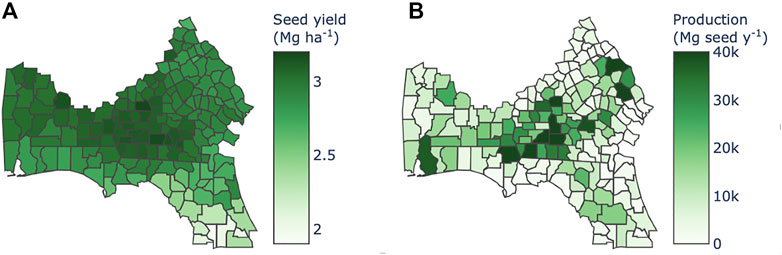
FIGURE 3. DayCent-simulated (A) carinata seed yield rates, and (B) corresponding annual seed production per county when carinata is integrated every third year into existing rotations across all active annual cropland, under the conventional carinata management scenario.
Figure 3B shows average annual seed production in each county when carinata was integrated every third year into existing rotations across all actively utilized annual cropland. Annual production of more than 40,000 Mg was achieved in multiple counties across Georgia, as well as counties on the Alabama Gulf Coast and Florida Panhandle with high yields and relatively large amounts of cropland (Supplementary Figure S3B). Total regional carinata seed production is summarized in Table 2 for the three different carinata management scenarios. This total production was relatively constant over the management scenarios analyzed, at approximately 2.0 million tonnes (Mt).
Soil Carbon
Figure 4 shows illustrative soil carbon results under the climate-smart no-till scenario for four randomly selected DayCent simulation strata (0.01% of the total), with the underlying soil surface texture indicated by color. In general, finer-textured soils with high clay and silt content were associated with higher overall SOC levels, and larger differences between the business-as-usual reference rotation (solid lines) and the carinata scenarios (in this case, the climate-smart no-till scenario; dashed lines). In DayCent, soil microbial carbon use efficiency is controlled by soil texture; finer-textured soils with high clay and silt content have lower respiration losses and stabilize more SOC per unit of carbon input. The jaggedness in the SOC lines was due to inter-annual variability in temperature and precipitation, which affect both simulated plant productivity (i.e., carbon inputs to the soil) and heterotrophic respiration rates (carbon losses from the soil).
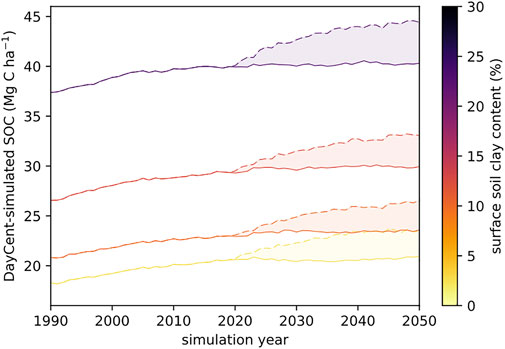
FIGURE 4. Representative soil carbon modeling results for the climate-smart no-till establishment scenario, showing four randomly selected simulation strata. The solid lines show SOC trends under the business-as-usual cotton–cotton–peanut reference rotation for each stratum, with the underlying soil texture indicated by color. Carinata integration starts in 2020 and results in an increasing SOC trend (dashed lines).
These simulations suggest that carinata integration would lead to soil carbon increases at average regional rates of 0.028, 0.093, and 0.088 Mg C ha−1 y−1 under the conventional, no-till, and poultry litter management scenario, respectively (Table 2). These rates are relatively low compared to the 0.2–0.6 Mg C ha−1 y−1 quantified in meta-analyses of winter cover crops. The lower rates simulated here are likely attributable to the assumption that carinata is grown only once every 3 years (compared to annual use of cover crops). Additionally, DayCent predicts higher rates of soil microbial activity in warm, wet climates and lower soil microbe carbon efficiency on sandy soils, which would all contribute to reduced soil organic carbon stabilization in this particular region (Figures 1B–D). SOC increase rates were lowest in the sandy soils of central Florida, and highest in the relatively fine-textured soils in the northwestern and northeastern edges of the study area (Figures 5A–C). This effect is consistent with a recent meta-analysis that found the highest rates of SOC sequestration under winter cover crops in temperate climates and on fine-textured soils (Jian et al., 2020). These simulated regional SOC increase rates are equivalent to a soil CO2 sink (i.e., a negative emission) of 0.10–0.34 Mg CO2 ha−1 y−1 (Table 2).
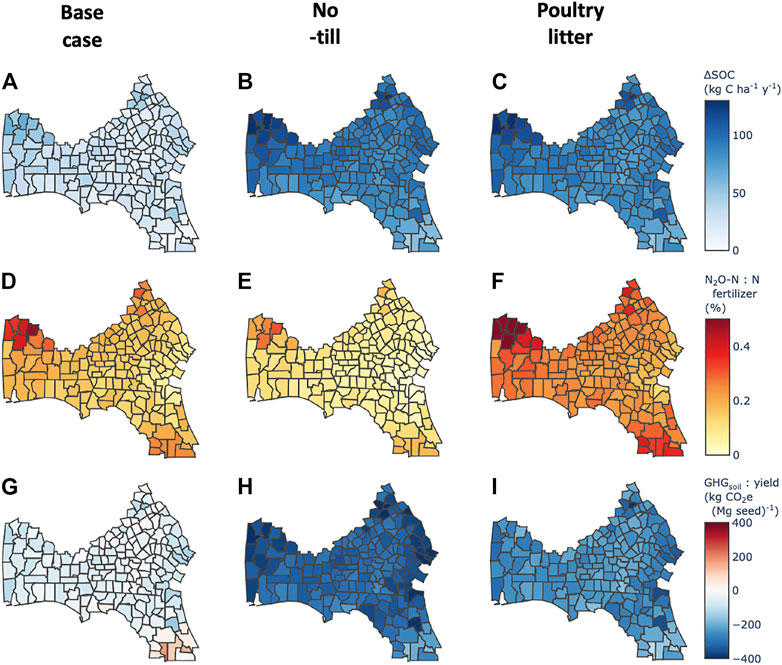
FIGURE 5. DayCent-simulated soil GHG fluxes under different carinata cultivation scenarios, relative to the continued business-as-usual reference rotation. (A–C) increase in soil organic carbon storage. (D–F) The fraction of new N applications lost in the form of direct nitrous oxide emissions. (G–I) The net soil GHG footprint of carinata seed production, which reflects the sum of positive CO2-equivalent emissions from additional N2O production, plus negative CO2-equivalent emissions associated with an increased soil sink of carbon and CH4.
N2O and Net Soil Greenhouse Gas Balance
Nitrous oxide emissions are often expressed in terms of emissions factors describing the fraction of applied N that is emitted in the form of N2O-N. DayCent predicted that 0.01–0.5% of N applied in the form of UAN-32 or poultry litter would be lost as direct N2O emissions from soil nitrification and denitrification processes (Figures 5D–F). This range falls largely below the IPCC default emissions factor range of 0.3–3% (Eggleston et al., 2006). This is likely a function of the coarse-textured soils in this region, which limits water-filled pore space and associated anoxic denitrification losses. The highest simulated N2O-N emissions factors occurred on the relatively fine-textured soils in the northwestern and northeastern edges of the study area and fall within the 0.3–3% IPCC default range. Average regional direct N2O emissions in CO2-equivalent units were 0.05–0.08 Mg CO2e ha−1 y−1 (Table 2). These new N2O emissions offset about half of the CO2-equivalent SOC sink in the conventional management scenario, but only 8% of the SOC sink in the climate-smart no-till management scenario.
Simulated indirect N2O emissions rates and changes in soil CH4 oxidation rates were very small in comparison (Table 2), so the total soil GHG balance (GHGsoil) of carinata production was dominated by the SOC and direct N2O terms. Figures 5G–I shows regional patterns in the GHGsoil footprint of carinata seed production (i.e., GHGsoil/annual seed yield). In the climate-smart management scenarios, the CO2-equivalent SOC sink exceeded N2O emissions across the entire study area, such that carinata seed production was always associated with a net soil GHG sink. In contrast, the SOC sink was relatively weak in the conventional management scenario, so many individual counties were approximately soil GHG-neutral or even a small net GHG source (e.g., counties in central Florida; Figure 5G).
Total Regional Seed and Sustainable Aviation Fuel Production
Total regional carinata SAF production potential was insensitive to the different management scenarios investigated. Cultivating carinata once every 3 years across the 2.05 Mha of active annual cropland in the study area would yield 1.97–2.03 Mt of carinata seed annually, enough feedstock to produce 1.03–1.06 billion liters (GL) of SAF (Figure 6A). However, the soil GHG footprint of carinata production is much more sensitive to management (Figure 6B). The net soil GHG balance was approximately neutral in the conventional management scenario, with a modest net SOC sink largely offset by new N2O emissions. The error bars in Figure 6B denote two standard deviations of field-to-field variability (i.e., the variability in different DayCent strata simulations), showing that farm-level soil GHG outcomes would range from a small net GHG source to a moderate net GHG sink. In contrast, the climate-smart management scenarios resulted in substantial and consistent net soil GHG sinks of 0.23–0.31 Mg CO2e ha−1 y−1. Since each hectare of land yields approximately 3 Mg of carinata seed when it is cultivated once every 3 years, this soil GHG sink is equivalent to 0.24–0.32 Mg CO2e per Mg of carinata seed produced.
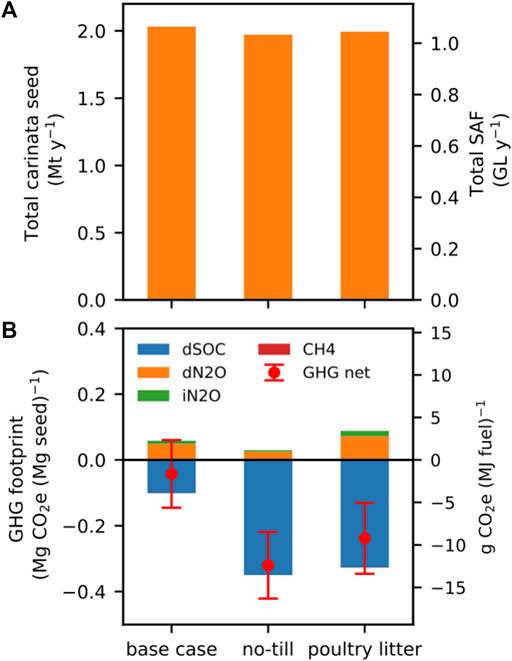
FIGURE 6. Performance of different carinata management scenarios in terms of (A) total annual seed yield and associated SAF potential from the study region, and (B) the associated soil GHG footprint per Mg of seed production, also expressed in units of global warming intensity (g CO2e (MJ fuel)−1) for the resulting carinata–SAF. Red error bars denote ±2SD of field-to-field variability. These results focus on the local soil GHG balance only; neither upstream emissions from nitrogen production and farm operations nor the alternate fate of poultry litter are included.
These soil GHG emissions results can also be expressed on the basis of SAF produced, for illustrative purposes. Using market-based allocation, 62% of the soil GHG benefits of carinata seed production should be allocated to SAF (with the remaining 38% allocated across the various other co-products derived from that seed). The soil GHG sinks in the climate-smart management scenarios correspond to a 9.2–12.4 g CO2e MJ−1 reduction in the overall GHG footprint of the resulting SAF. For comparison, that is equivalent to 10.4–13.9% of the GHG footprint of conventional aviation fuel (89 g CO2e MJ−1; Prussi et al., 2021). While this calculation helps to illustrate the magnitude of the soil GHG benefits in relation to the amount of SAF produced, note that it stops short of a full life-cycle accounting for upstream emissions associated with fertilizer production and spreading, the alternate fate of poultry litter, and more formal displacement method coproduct crediting.
Discussion
Carinata has been previously investigated as a feedstock for SAF or other biofuel production when grown as a summer crop integrated into existing winter wheat–fallow rotations in the US Great Plains (Bhattarai et al., 2021), or on marginal lands in the semi-arid climates of the Mediterranean Region (Cardone et al., 2003; Montemurro et al., 2016) and elsewhere (Hagos et al., 2020). This study suggests that winter carinata cultivation can contribute to the sustainable intensification of existing annual cropping systems in the Southeast US, producing a valuable SAF feedstock while simultaneously improving soil organic matter levels on the farm. Integrating carinata every third year into existing annual crop rotations across the ∼2 Mha of active annual cropland in this region (1.5% of total US cropland) results in enough feedstock to produce approximately one billion liters of SAF. This is complementary to other winter oilseeds such as pennycress that are more suitable in other climates (Markel et al., 2018; Cubins et al., 2019). All of the scenarios studied are expected to result in a net sink of soil GHG at the regional scale, and climate-smart management introduces a significant negative emissions term within the life cycle of carinata-derived SAF fuel. This effect would persist over the first several decades of production before soil carbon levels come to equilibrium at a higher level under the new management.
This study should be viewed as a first exploratory estimate of carinata production potential and soil GHG impacts in this region, though it is based on a limited amount of field data. The DayCent yield modeling has reasonable fidelity for this exercise (Figure 2), though it lacks the granularity necessary to reliably inform individual farmer management decisions. In particular, there is limited long-term data on the susceptibility of carinata to frost damage and no measurements of changes in SOC levels or N2O emissions under carinata available from this region for model validation purposes. Additionally, there are reasons for caution when estimating regional resource potentials using models that have been developed all or in part using data from small-scale plot trials. It has been suggested that yields measured in small-scale trials should be interpreted as representing “the highest potential range rather than an expected near-future performance at commercial level” (Mola-Yudego et al., 2015). However, all of the plot trials analyzed here were machine-harvested (eliminating that as a potential source of bias), and the final calibrated DayCent model under-estimates yield for four of the five larger field-scale trials (Hawkinsville, Dublin, Blakely, and Byron; Figure 2), so there is no evidence of potential scale-related bias in the regional projections at this time.
There are a number of other limitations to the modeling approach used here. The DayCent model focuses only on SOC dynamics in the surface layer of soil (to 20 cm depth). While there is a well-established SOC benefit from replacing winter fallow periods with crops, tillage effects on SOC are found to be smaller and much more uncertain when evaluated across the full depth of the soil profile (Ogle et al., 2019), and thus DayCent and many other process-based ecosystem models may over-estimate SOC differences between different tillage practices. In addition, the version of DayCent used for this analysis does not endogenously represent crop phenology, which likely limits the model performance observed in the independent validation (Figure 2). The model simulates a reduced rate of plant growth on cold days, but it does not represent plant mortality from frost damage in photoperiod-sensitive crops. While this study area was selected to minimize frost risk (Alam and Dwivedi, 2019), and the effects of frost can be mitigated using best management practices (Mulvaney et al., 2018; Seepaul et al., 2019b), this model limitation may still result in some overestimation of the production potential from this region. A newer version of DayCent that dynamically predicts crop phenology stages, explicitly simulates leaf area index, and represents crop mortality from frost is under testing (Zhang et al., 2018; Zhang et al., 2020b), but was not readily available at the time of this study.
Identifying the agricultural land base across the Southeast US on which winter oilseed crops might ultimately be viable is also challenging. Carinata requires careful integration into existing cropping systems so that its spring maturation and harvest do not clash with the planting of the subsequent summer cash crop (Nóia Júnior et al., 2022). Winter carinata can probably be grown before sorghum or soybean summer crops, but chemical desiccants may be required to expedite carinata harvest (Seepaul et al., 2018) before crops such as cotton and peanut that require relatively early spring planting to reach full maturity. This is an active area of research, though this study assumes the viability of the cotton–carinata–cotton–peanut rotation a priori. For simplicity, the current analysis treats all annual cropland in the region as being managed under a cotton–cotton–peanut rotation. Future work could use the USDA Cropland Data Layer (CDL) (Boryan et al., 2011) to identify specific crop rotations in the region, and more selectively model carinata integration into only the most viable rotations. However, like the NLCD used in this assessment, CDL also shows some divergence with CoA cropland area statistics (Lark et al., 2017), particularly in areas outside the agriculturally-dense Corn Belt (Larsen et al., 2015).
Finally, this study assesses the biophysical impacts of winter carinata cultivation but does not include a full life-cycle assessment. This modeling focuses on soil GHG emissions (the dominant source from the US agricultural sector; US EPA, 2020b) but ignores emissions from farm energy use and inputs such as nitrogen fertilizer. The climate-smart management scenarios include quantification of the local soil carbon benefits of poultry litter application, though the full environmental impacts of that practice depend on the alternative uses of that litter (Beausang et al., 2020). There are a variety of environmental issues associated with the indiscriminate surface application of poultry litter in agricultural fields (Bolan et al., 2010), and thus soil incorporation of poultry litter in carinata systems is likely an environmentally preferable disposal option. However, the resulting soil C sequestration may not be additional (i.e., it might have occurred anyways during business-as-usual management of poultry litter waste), so these poultry litter results should be interpreted as an estimate of local sequestration potential rather than a broad impact assessment meant to inform policy (Plevin et al., 2014). The yield and soil GHG data presented here can be used as an input to life-cycle assessment studies (e.g., Alam et al., 2021) for a more holistic view of the sustainability of carinata–SAF.
Conclusion
There is 2.05 Mha of active annual cropland across the region of southern Alabama, southern Georgia, and northern Florida suitable for growing current varieties of carinata as a winter cash crop with low frost risk. This modeling study estimates an average carinata seed yield of 2.9–3.0 Mg ha−1 across this study region, depending on crop management practices. Integrating carinata into existing annual crop rotations once every third winter would produce 2.0 Mt of carinata seed annually, which could be converted to over one billion liters of SAF, smaller fractions of other hydrocarbons, and a high-protein seed meal with value as a feed supplement.
The soil carbon and GHG emissions associated with carinata production are highly sensitive to management assumptions. Establishing carinata with conventional tillage and applying synthetic nitrogen fertilizer results in modest soil carbon gains (0.028 Mg C ha−1 y−1), the climate benefit of which is largely offset by new N2O emissions. In contrast, climate-smart management with no-till carinata establishment or using poultry litter as a synthetic N substitute results in more substantial soil carbon sinks at the farms where carinata is cultivated (0.093 and 0.088 Mg C ha−1 y−1, respectively), and a net negative total soil GHG footprint of cultivation (–0.308 and –0.234 Mg CO2e ha−1 y−1, respectively). This is equivalent to –0.24 to –0.32 Mg CO2e per Mg of carinata seed produced, or a 9.2–12.4 g CO2e MJ−1 reduction in the GHG footprint of the resulting carinata-derived SAF using market-based allocation. These results can be incorporated into full life-cycle assessment studies that consider the energy and material inputs to the rest of the carinata–SAF supply chain, e.g., Alam et al. (2021).
The potential for carinata scale-up in this region depends on minimizing frost damage and fitting well within existing crop rotations. Carinata breeding efforts are currently working towards more frost-tolerant and earlier-maturing varieties that can be harvested before interfering with the planting of the next summer crop in the rotation. There are also management options that can limit vulnerability to damage during frost events, and speed up drying (Seepaul et al., 2018). This study suggests that carinata cultivation can create a net soil GHG sink, leading to a modest reduction in the life-cycle GHG footprint of carinata–SAF, and improvements in soil organic matter levels. These results support carinata as a potential win–win–win for generating SAF feedstocks, creating new farm revenue streams, and improving soil quality in the Southeast US.
Data Availability Statement
Data and code supporting the conclusion of this article are available at https://doi.org/10.6084/m9.figshare.19372454. Additional modeling resources supporting the conclusion of this article will be made available by the authors, without undue reservation.
Author Contributions
JF conducted the modeling analysis and produced the first draft of the paper. GJ, MJM and RS provided field trial data and developed the crop management scenarios. KB scaled the plant-level yield data observed in field trials to per-hectare yields for modeling purposes. YZ, ME, AS and SW performed the initial model calibration, and YZ performed subsequent model validation. NH, GJ, MJM, RS and PD contributed to the development of baseline crop rotation assumptions. MFHM contributed to land use analysis. KP, SG and DW contributed to funding acquisition and project management. PD also contributed to research management. All authors contributed to the final editing of the paper.
Funding
This work was supported by U.S. Department of Agriculture National Institute of Food and Agriculture (USDA/NIFA) through the Southeast Partnership for Advanced Renewables from Carinata (SPARC; award number 2016-11231), through USDA/NIFA award number 2017-67019-26,327, and through ORNL Laboratory Directed Research and Development Project #10681.
Conflict of Interest
GJ was employed by Nuseed, West Sacramento, CA, United States.
The remaining authors declare that the research was conducted in the absence of any commercial or financial relationships that could be construed as a potential conflict of interest.
Publisher’s Note
All claims expressed in this article are solely those of the authors and do not necessarily represent those of their affiliated organizations, or those of the publisher, the editors and the reviewers. Any product that may be evaluated in this article, or claim that may be made by its manufacturer, is not guaranteed or endorsed by the publisher.
Acknowledgments
We thank Jeff Kent for his advice on modeling specific tillage practices in DayCent, and Tyler Lark and Seth Spawn for their advice on cropland area corrections.
Supplementary Material
The Supplementary Material for this article can be found online at: https://www.frontiersin.org/articles/10.3389/fenrg.2022.837883/full#supplementary-material
References
Abdalla, M., Hastings, A., Cheng, K., Yue, Q., Chadwick, D., Espenberg, M., et al. (2019). A Critical Review of the Impacts of Cover Crops on Nitrogen Leaching, Net Greenhouse Gas Balance and Crop Productivity. Glob. Change Biol. 25, 2530–2543. doi:10.1111/gcb.14644
Alam, A., and Dwivedi, P. (2019). Modeling Site Suitability and Production Potential of Carinata-Based Sustainable Jet Fuel in the southeastern United States. J. Clean. Prod. 239, 117817. doi:10.1016/j.jclepro.2019.117817
Alam, A., Masum, M. F. H., and Dwivedi, P. (2021). Break‐even price and Carbon Emissions of Carinata‐based Sustainable Aviation Fuel Production in the Southeastern United States. GCB Bioenergy 13, 1800–1813. doi:10.1111/gcbb.12888
Ashworth, A. J., Chastain, J. P., and Moore, P. A. (2020). “Nutrient Characteristics of Poultry Manure and Litter,” in Animal Manure (Madison, WI: John Wiley & Sons), 63–87. Available at: http://acsess.onlinelibrary.wiley.com/doi/abs/10.2134/asaspecpub67.c5 (Accessed February 15, 2021). doi:10.2134/asaspecpub67.c5
Bailey, V. L., Pries, C. H., and Lajtha, K. (2019). What Do We Know about Soil Carbon Destabilization? Environ. Res. Lett. 14, 083004. doi:10.1088/1748-9326/ab2c11
Bashyal, M., Mulvaney, M. J., Lee, D., Wilson, C., Iboyi, J. E., Leon, R. G., et al. (2021). Brassica Carinata Biomass, Yield, and Seed Chemical Composition Response to Nitrogen Rates and Timing on Southern Coastal Plain Soils in the United States. GCB Bioenergy 13, 1275–1289. doi:10.1111/gcbb.12846
Beausang, C., McDonnell, K., and Murphy, F. (2020). Anaerobic Digestion of Poultry Litter - A Consequential Life Cycle Assessment. Sci. Total Environ. 735, 139494. doi:10.1016/j.scitotenv.2020.139494
Bhattarai, D., Abagandura, G. O., Nleya, T., and Kumar, S. (2021). Responses of Soil Surface Greenhouse Gas Emissions to Nitrogen and Sulfur Fertilizer Rates to Brassica Carinata Grown as a Bio‐jet Fuel. GCB Bioenergy 13, 627–639. doi:10.1111/gcbb.12784
Bolan, N. S., Szogi, A. A., Chuasavathi, T., Seshadri, B., Rothrock, M. J., and Panneerselvam, P. (2010). Uses and Management of Poultry Litter. World's Poult. Sci. J. 66, 673–698. doi:10.1017/s0043933910000656
Boote, K. J., Seepaul, R., Mulvaney, M. J., Hagan, A. K., Bashyal, M., George, S., et al. (2021). Adapting the CROPGRO Model to Simulate Growth and Production of Brassica Carinata , a Bio‐fuel Crop. GCB Bioenergy 13, 1134–1148. doi:10.1111/gcbb.12838
Boryan, C., Yang, Z., Mueller, R., and Craig, M. (2011). Monitoring US Agriculture: the US Department of Agriculture, National Agricultural Statistics Service, Cropland Data Layer Program. Geocarto Int. 26, 341–358. doi:10.1080/10106049.2011.562309
Cardone, M., Mazzoncini, M., Menini, S., Rocco, V., Senatore, A., Seggiani, M., et al. (2003). Brassica Carinata as an Alternative Oil Crop for the Production of Biodiesel in Italy: Agronomic Evaluation, Fuel Production by Transesterification and Characterization. Biomass and Bioenergy 25, 623–636. doi:10.1016/s0961-9534(03)00058-8
Chiaramonti, D. (2019). Sustainable Aviation Fuels: the challenge of Decarbonization. Energ. Proced. 158, 1202–1207. doi:10.1016/j.egypro.2019.01.308
Clark, M. A., Domingo, N. G. G., Colgan, K., Thakrar, S. K., Tilman, D., Lynch, J., et al. (2020). Global Food System Emissions Could Preclude Achieving the 1.5° and 2°C Climate Change Targets. Science 370, 705–708. doi:10.1126/science.aba7357
Crutzen, P. J., Mosier, A. R., Smith, K. A., and Winiwarter, W. (2008). N2O Release from Agro-Biofuel Production Negates Global Warming Reduction by Replacing Fossil Fuels. Atmos. Chem. Phys. 8, 389–395. doi:10.5194/acp-8-389-2008
Cubins, J. A., Wells, M. S., Frels, K., Ott, M. A., Forcella, F., Johnson, G. A., et al. (2019). Management of Pennycress as a winter Annual Cash Cover Crop. A Review. Agron. Sustain. Dev. 39, 46. doi:10.1007/s13593-019-0592-0
Daly, C., Neilson, R. P., and Phillips, D. L. (1994). A Statistical-Topographic Model for Mapping Climatological Precipitation over Mountainous Terrain. J. Appl. Meteorol. 33, 140–158. doi:10.1175/1520-0450(1994)033<0140:astmfm>2.0.co;2
Das, K. C., Minkara, M. Y., Melear, N. D., and Tollner, E. W. (2002). Effect of Poultry Litter Amendment on Hatchery Waste Composting. J. Appl. Poult. Res. 11, 282–290. doi:10.1093/japr/11.3.282
Davis, S. J., Lewis, N. S., Shaner, M., Aggarwal, S., Arent, D., Azevedo, I. L., et al. (2018). Net-zero Emissions Energy Systems. Science 360, eaas9793. doi:10.1126/science.aas9793
Del Grosso, S. J., Parton, W. J., Keough, C. A., and Reyes-Fox, M. (2011). “Special Features of the DayCent Modeling Package and Additional Procedures for Parameterization, Calibration, Validation, and Applications,” in Advances in Agricultural Systems Modeling Methods of Introducing System Models into Agricultural Research. Editors L. R. Ahuja, and L. Ma (Madison, WI: American Society of Agronomy, Crop Science Society of America, Soil Science Society of America), 155–176. Available at: https://dl.sciencesocieties.org/publications/books/abstracts/advancesinagric/methodsofintrod/155 (Accessed February 3, 2014).
Del Grosso, S., Ojima, D., Parton, W., Mosier, A., Peterson, G., and Schimel, D. (2002). Simulated Effects of Dryland Cropping Intensification on Soil Organic Matter and Greenhouse Gas Exchanges Using the DAYCENT Ecosystem Model. Environ. Pollut. 116, S75–S83. doi:10.1016/s0269-7491(01)00260-3
Ernstrom, D. J., and Lytle, D. (1993). Enhanced Soils Information Systems from Advances in Computer Technology. Geoderma 60, 327–341. doi:10.1016/0016-7061(93)90034-i
Field, J. L., Evans, S. G., Marx, E., Easter, M., Adler, P. R., Dinh, T., et al. (2018). High-resolution Techno-Ecological Modelling of a Bioenergy Landscape to Identify Climate Mitigation Opportunities in Cellulosic Ethanol Production. Nat. Energ. 3, 211–219. doi:10.1038/s41560-018-0088-1
Field, J. L., Marx, E., Easter, M., Adler, P. R., and Paustian, K. (2016). Ecosystem Model Parameterization and Adaptation for Sustainable Cellulosic Biofuel Landscape Design. GCB Bioenergy 8, 1106–1123. doi:10.1111/gcbb.12316
Fulton, L. M., Lynd, L. R., Körner, A., Greene, N., and Tonachel, L. R. (2015). The Need for Biofuels as Part of a Low Carbon Energy Future. Biofuels, Bioprod. Bioref. 9, 476–483. doi:10.1002/bbb.1559
Gaskin, J. W., Harris, G. H., Franzluebbers, A., and Andrae, J. (2013). Poultry Litter Application on Pastures and Hayfields. Athens, GA: The University of Georgia Cooperative Extension.
George, S., Seepaul, R., Geller, D., Dwivedi, P., DiLorenzo, N., Altman, R., et al. (2021). A Regional Inter‐disciplinary Partnership Focusing on the Development of a Carinata‐centered Bioeconomy. GCB Bioenergy 13, 1018–1029. doi:10.1111/gcbb.12828
Goslee, S. C. (2011). National Land-Cover Data and Census of Agriculture Estimates of Agricultural Land-Use Area Differ in the Northeastern United States. Photogramm Eng. Remote Sensing 77, 141–147. doi:10.14358/pers.77.2.141
Gryze, S. D., Wolf, A., Kaffka, S. R., Mitchell, J., Rolston, D. E., Temple, S. R., et al. (2010). Simulating Greenhouse Gas Budgets of Four California Cropping Systems under Conventional and Alternative Management. Ecol. Appl. 20, 1805–1819. doi:10.1890/09-0772.1
Hagos, R., Shaibu, A. S., Zhang, L., Cai, X., Liang, J., Wu, J., et al. (2020). Ethiopian Mustard (Brassica Carinata A. Braun) as an Alternative Energy Source and Sustainable Crop. Sustainability 12, 7492. doi:10.3390/su12187492
He, W., Grant, B. B., Jing, Q., Lemke, R., St. Luce, M., Jiang, R., et al. (2021). Measuring and Modeling Soil Carbon Sequestration under Diverse Cropping Systems in the Semiarid Prairies of Western Canada. J. Clean. Prod. 328, 129614. doi:10.1016/j.jclepro.2021.129614
Heaton, E. A., Schulte, L. A., Berti, M., Langeveld, H., Zegada-Lizarazu, W., Parrish, D., et al. (2013). Managing a Second-Generation Crop Portfolio through Sustainable Intensification: Examples from the USA and the EU. Biofuels, Bioprod. Bioref 7, 702–714. doi:10.1002/bbb.1429
Homer, C., Dewitz, J., Jin, S., Xian, G., Costello, C., Danielson, P., et al. (2020). Conterminous United States Land Cover Change Patterns 2001-2016 from the 2016 National Land Cover Database. ISPRS J. Photogrammetry Remote Sensing 162, 184–199. doi:10.1016/j.isprsjprs.2020.02.019
H. S. Eggleston, L. Buendia, K. Miwa, T. Ngara, and K. Tanabe (Editors) (2006). Agriculture, Forestry and Other Land Use,” in 2006 IPCC Guidelines for National Greenhouse Gas Inventories (Japan: Institute for Global Environmental Strategies IGES), 4.
Iboyi, J. E., Mulvaney, M. J., Balkcom, K. S., Seepaul, R., Bashyal, M., Perondi, D., et al. (2021). Tillage System and Seeding Rate Effects on the Performance of Brassica Carinata. GCB Bioenergy 13, 600–617. doi:10.1111/gcbb.12809
Jian, J., Du, X., Reiter, M. S., and Stewart, R. D. (2020). A Meta-Analysis of Global Cropland Soil Carbon Changes Due to Cover Cropping. Soil Biol. Biochem. 143, 107735. doi:10.1016/j.soilbio.2020.107735
Johnson, D. M. (2013). A 2010 Map Estimate of Annually Tilled Cropland within the Conterminous United States. Agric. Syst. 114, 95–105. doi:10.1016/j.agsy.2012.08.004
Lark, T. J., Mueller, R. M., Johnson, D. M., and Gibbs, H. K. (2017). Measuring Land-Use and Land-Cover Change Using the U.S. Department of Agriculture's Cropland Data Layer: Cautions and Recommendations. Int. J. Appl. Earth Observation Geoinformation 62, 224–235. doi:10.1016/j.jag.2017.06.007
Lark, T. J., Spawn, S. A., Bougie, M., and Gibbs, H. K. (2020). Cropland Expansion in the United States Produces Marginal Yields at High Costs to Wildlife. Nat. Commun. 11, 4295. doi:10.1038/s41467-020-18045-z
Larsen, A. E., Hendrickson, B. T., Dedeic, N., and MacDonald, A. J. (2015). Taken as a Given: Evaluating the Accuracy of Remotely Sensed Crop Data in the USA. Agric. Syst. 141, 121–125. doi:10.1016/j.agsy.2015.10.008
Li, N., Kumar, P., Lai, L., Abagandura, G. O., Kumar, S., Nleya, T., et al. (2019). Response of Soil Greenhouse Gas Fluxes and Soil Properties to Nitrogen Fertilizer Rates under Camelina and Carinata Nonfood Oilseed Crops. Bioenerg. Res. 12, 524–535. doi:10.1007/s12155-019-09987-4
Lynch, D., Henihan, A. M., Bowen, B., Lynch, D., McDonnell, K., Kwapinski, W., et al. (2013). Utilisation of Poultry Litter as an Energy Feedstock. Biomass and Bioenergy 49, 197–204. doi:10.1016/j.biombioe.2012.12.009
Markel, E., English, B. C., Hellwinckel, C., Menard, R. J., et al. United States. Federal Aviation AdministrationCenter of Excellence for Alternative Jet Fuels and Environment (2018). Potential for Pennycress to Support a Renewable Jet Fuel Industry. Available at: https://rosap.ntl.bts.gov/view/dot/57458 (Accessed November 5, 2021).
Maxwell, S. K., Wood, E. C., and Janus, A. (2008). Comparison of the USGS 2001 NLCD to the 2002 USDA Census of Agriculture for the Upper Midwest United States. Agric. Ecosyst. Environ. 127, 141–145. doi:10.1016/j.agee.2008.03.012
McClelland, S. C., Paustian, K., and Schipanski, M. E. (2021). Management of Cover Crops in Temperate Climates Influences Soil Organic Carbon Stocks: a Meta-Analysis. Ecol. Appl. 31, e02278. doi:10.1002/eap.2278
Mesinger, F., DiMego, G., Kalnay, E., Mitchell, K., Shafran, P. C., Ebisuzaki, W., et al. (2006). North American Regional Reanalysis. Bull. Amer. Meteorol. Soc. 87, 343–360. doi:10.1175/bams-87-3-343
Minasny, B., Malone, B. P., McBratney, A. B., Angers, D. A., Arrouays, D., Chambers, A., et al. (2017). Soil Carbon 4 Per Mille. Geoderma 292, 59–86. doi:10.1016/j.geoderma.2017.01.002
Mola-Yudego, B., Díaz-Yáñez, O., and Dimitriou, I. (2015). How Much Yield Should We Expect from Fast-Growing Plantations for Energy? Divergences between Experiments and Commercial Willow Plantations. Bioenerg. Res. 8, 1769–1777. doi:10.1007/s12155-015-9630-1
Montemurro, F., Diacono, M., Scarcella, M., D'Andrea, L., Boari, F., Santino, A., et al. (2016). Agronomic Performance for Biodiesel Production Potential of Brassica Carinata A. Braun in Mediterranean Marginal Areas. Ital. J. Agron. 10, 57–64. doi:10.4081/ija.2016.684
Muhammad, I., Sainju, U. M., Zhao, F., Khan, A., Ghimire, R., Fu, X., et al. (2019). Regulation of Soil CO2 and N2O Emissions by Cover Crops: A Meta-Analysis. Soil Tillage Res. 192, 103–112. doi:10.1016/j.still.2019.04.020
Mulvaney, M. J., Seepaul, R., Small, I. M., Wright, D. L., Paula-Moraes, S. V., Crozier, C., et al. (2018). Frost Damage of Carinata Grown in the Southeastern US: SS-AGR-420/ag420, 5/2018. EDIS 2018. Available at: https://journals.flvc.org/edis/article/view/105892 (Accessed February 26, 2022), 5. doi:10.32473/edis-ag420-2018
Nóia Júnior, R. de. S., Fraisse, C. W., Bashyal, M., Mulvaney, M. J., Seepaul, R., Zientarski Karrei, M. A., et al. (2022). Brassica Carinata as an Off-Season Crop in the southeastern USA: Determining Optimum Sowing Dates Based on Climate Risks and Potential Effects on Summer Crop Yield. Agric. Syst. 196, 103344. doi:10.1016/j.agsy.2021.103344
Ogle, S. M., Alsaker, C., Baldock, J., Bernoux, M., Breidt, F. J., McConkey, B., et al. (2019). Climate and Soil Characteristics Determine where No-Till Management Can Store Carbon in Soils and Mitigate Greenhouse Gas Emissions. Sci. Rep. 9, 11665. doi:10.1038/s41598-019-47861-7
O’Malley, J., Pavlenko, N., and Searle, S. (2021). Estimating Sustainable Aviation Fuel Feedstock Availability to Meet Growing European Union Demand. Washington, DC: International Council on Clean Transportation.
Paustian, K., Easter, M., Brown, K., Chambers, A., Eve, M., Huber, A., et al. (2018). Field- and Farm-Scale Assessment of Soil Greenhouse Gas Mitigation Using COMET-Farm. Precision Conservation: Geospatial Tech. Agric. Nat. Resour. Conservation Agron. Monogr. 59, 341–359. Available at: http://dl.sciencesocieties.org/publications/books/abstracts/agronomymonogra/agronmonogr59/agronmonogr59.2013.0033 (Accessed May 15, 2019). doi:10.2134/agronmonogr59.c16
Paustian, K., Lehmann, J., Ogle, S., Reay, D., Robertson, G. P., and Smith, P. (2016). Climate-smart Soils. Nature 532, 49–57. doi:10.1038/nature17174
Plevin, R. J., Delucchi, M. A., and Creutzig, F. (2014). Using Attributional Life Cycle Assessment to Estimate Climate-Change Mitigation Benefits Misleads Policy Makers. J. Ind. Ecol. 18, 73–83. doi:10.1111/jiec.12074
Poeplau, C., and Don, A. (2015). Carbon Sequestration in Agricultural Soils via Cultivation of Cover Crops - A Meta-Analysis. Agric. Ecosyst. Environ. 200, 33–41. doi:10.1016/j.agee.2014.10.024
Prussi, M., Lee, U., Wang, M., Malina, R., Valin, H., Taheripour, F., et al. (2021). CORSIA: The First Internationally Adopted Approach to Calculate Life-Cycle GHG Emissions for Aviation Fuels. Renew. Sustain. Energ. Rev. 150, 111398. doi:10.1016/j.rser.2021.111398
Qian, B., Zhang, X., Smith, W., Grant, B., Jing, Q., Cannon, A. J., et al. (2019). Climate Change Impacts on Canadian Yields of spring Wheat, Canola and maize for Global Warming Levels of 1.5°C, 2.0°C, 2.5°C and 3.0°C. Environ. Res. Lett. 14, 074005. doi:10.1088/1748-9326/ab17fb
Resurreccion, E. P., Roostaei, J., Martin, M. J., Maglinao, R. L., Zhang, Y., and Kumar, S. (2021). The Case for Camelina-Derived Aviation Biofuel: Sustainability Underpinnings from a Holistic Assessment Approach. Ind. Crops Prod. 170, 113777. doi:10.1016/j.indcrop.2021.113777
Rockström, J., Schellnhuber, H. J., Hoskins, B., Ramanathan, V., Schlosser, P., Brasseur, G. P., et al. (2016). The World’s Biggest Gamble. Earth’s Future 4, 465–470. doi:10.1002/2016EF000392
Rogeri, D. A., Ernani, P. R., Mantovani, A., and Lourenço, K. S. (2016). Composition of Poultry Litter in Southern Brazil. Revista Brasileira de Ciência Do Solo 40. Available at: http://www.scielo.br/scielo.php?script=sci_abstract&pid=S0100-06832016000100525&lng=en&nrm=iso&tlng=en (Accessed February 15, 2021).
Roth, B., Finnan, J. M., Jones, M. B., Burke, J. I., and Williams, M. L. (2015). Are the Benefits of Yield Responses to Nitrogen Fertilizer Application in the Bioenergy cropMiscanthus × Giganteusoffset by Increased Soil Emissions of Nitrous Oxide? GCB Bioenergy 7, 145–152. doi:10.1111/gcbb.12125
Schulmeister, T. M., Ruiz-Moreno, M., Silva, G. M., Garcia-Ascolani, M., Ciriaco, F. M., Henry, D. D., et al. (2021). Characterization of Dietary Protein in Brassica Carinata Meal when Used as a Protein Supplement for Beef Cattle Consuming a Forage-Based Diet. J. Anim. Sci. 99, skaa383. doi:10.1093/jas/skaa383
Schulmeister, T. M., Ruiz-Moreno, M., Silva, G. M., Garcia-Ascolani, M., Ciriaco, F. M., Henry, D. D., et al. (2019b). Evaluation ofBrassica Carinatameal on Ruminant Metabolism and Apparent Total Tract Digestibility of Nutrients in Beef Steers1,2. J. Anim. Sci. 97, 1325–1334. doi:10.1093/jas/skz009
Schulmeister, T. M., Ruiz-Moreno, M., Silva, G. M., Garcia-Ascolani, M., Ciriaco, F. M., Henry, D. D., et al. (2019a). Evaluation of Brassica Carinata Meal as a Protein Supplement for Growing Beef Heifers1,2. J. Anim. Sci. 97, 4334–4340. doi:10.1093/jas/skz280
Seepaul, R., Marois, J., Small, I., George, S., and Wright, D. L. (2018). Optimizing Swathing and Chemical Desiccant Timing to Accelerate Winter Carinata Maturation. Agron.j. 110, 1379–1389. doi:10.2134/agronj2017.08.0496
Seepaul, R., Marois, J., Small, I. M., George, S., and Wright, D. L. (2019a). Carinata Dry Matter Accumulation and Nutrient Uptake Responses to Nitrogen Fertilization. Agron.j. 111, 2038–2046. doi:10.2134/agronj2018.10.0678
Seepaul, R., Mulvaney, M. J., Small, I. M., George, S., and Wright, D. L. (2020). Carinata Growth, Yield, and Chemical Composition Responses to Nitrogen Fertilizer Management. Agron.j. 112, 5249–5263. doi:10.1002/agj2.20416
Seepaul, R., Small, I. M., Mulvaney, M. J., George, S., Leon, R. G., Paula-Moraes, S. V., et al. (2019b). Carinata, the Sustainable Crop for a Bio-Based Economy: 2018-2019 Production Recommendations for the Southeastern United States. Gainesville, FL: University of Florida/IFAS Extension, Agronomy Department.
Sharpley, A., Slaton, N., Tabler, T., VanDevender, K., Daniels, M., Jones, F., et al. (2009). Nutrient Analysis of Poultry Litter. Fayetteville, AR: University of Arkansas Cooperative Extension Service.
Stocker, T. F., Qin, D., Plattner, G.-K., Tignor, M. M., Allen, S. K., Boschung, J., et al. (2014). Climate Change 2013: The Physical Science Basis. Contribution of Working Group I to the Fifth Assessment Report of IPCC the Intergovernmental Panel on Climate Change. Available at: https://www.ipcc.ch/report/ar5/wg1/ (Accessed December 2, 2021).
Tonitto, C., David, M. B., and Drinkwater, L. E. (2006). Replacing Bare Fallows with Cover Crops in Fertilizer-Intensive Cropping Systems: A Meta-Analysis of Crop Yield and N Dynamics. Agric. Ecosyst. Environ. 112, 58–72. doi:10.1016/j.agee.2005.07.003
US EPA (2020a). “ANNEX 3 Methodological Descriptions for Additional Source or Sink Categories,” in Inventory of U.S. Greenhouse Gas Emissions and Sinks: 1990-2018 (Washington, DC: U.S. Environmental Protection Agency), 318. Available at: https://www.epa.gov/ghgemissions/inventory-us-greenhouse-gas-emissions-and-sinks-1990-2018 (Accessed May 18, 2020).
US EPA (2018). Biofuels and the Environment: The Second Triennial Report to Congress. Washington, DC: US Environmental Protection Agency.
US EPA (2020b). Inventory of U.S. Greenhouse Gas Emissions and Sinks: 1990-2018. Washington, DC: US Environmental Protection Agency. Available at: https://www.epa.gov/ghgemissions/inventory-us-greenhouse-gas-emissions-and-sinks-1990-2018 (Accessed May 18, 2020).
USDA NRCS (2006). Land Resource Regions (LRR) and Major Land Resource Areas (MLRA) of the United States, the Caribbean, and the Pacific Basin. Washington, DC: U.S. Department of Agriculture
Williams, J. H., Jones, R. A., Haley, B., Kwok, G., Hargreaves, J., Farbes, J., et al. (2021). Carbon-Neutral Pathways for the United States. AGU Adv. 2, e2020AV000284. doi:10.1029/2020av000284
Zemanek, D., Champagne, P., and Mabee, W. (2020). Review of Life‐cycle Greenhouse‐gas Emissions Assessments of Hydroprocessed Renewable Fuel ( HEFA ) from Oilseeds. Biofuels, Bioprod. Bioref. 14, 935–949. doi:10.1002/bbb.2125
Zhang, Y., Gurung, R., Marx, E., Williams, S., Ogle, S. M., and Paustian, K. (2020a). DayCent Model Predictions of NPP and Grain Yields for Agricultural Lands in the Contiguous U.S. J. Geophys. Res. Biogeosci. 125. Available at: https://onlinelibrary.wiley.com/doi/abs/10.1029/2020JG005750 (Accessed August 20, 2020).
Zhang, Y., Marx, E., Williams, S., Gurung, R., Ogle, S., Horton, R., et al. (2020b). Adaptation in U.S. Corn Belt Increases Resistance to Soil Carbon Loss with Climate Change. Sci. Rep. 10, 13799. doi:10.1038/s41598-020-70819-z
Keywords: carinata, winter oilseed, soil carbon, ecosystem modeling, Daycent model, sustainable aviation fuel, life cycle assessment, climate-smart agriculture
Citation: Field JL, Zhang Y, Marx E, Boote KJ, Easter M, George S, Hoghooghi N, Johnston G, Masum FH, Mulvaney MJ, Paustian K, Seepaul R, Swan A, Williams S, Wright D and Dwivedi P (2022) Modeling Yield, Biogenic Emissions, and Carbon Sequestration in Southeastern Cropping Systems With Winter Carinata. Front. Energy Res. 10:837883. doi: 10.3389/fenrg.2022.837883
Received: 17 December 2021; Accepted: 04 March 2022;
Published: 13 April 2022.
Edited by:
Zia Haq, United States Department of Energy (DOE), United StatesReviewed by:
Sheikh Adil Edrisi, Thapar Institute of Engineering & Technology, IndiaBurton C. English, The University of Tennessee, United States
Copyright © 2022 Field, Zhang, Marx, Boote, Easter, George, Hoghooghi, Johnston, Masum, Mulvaney, Paustian, Seepaul, Swan, Williams, Wright and Dwivedi. This is an open-access article distributed under the terms of the Creative Commons Attribution License (CC BY). The use, distribution or reproduction in other forums is permitted, provided the original author(s) and the copyright owner(s) are credited and that the original publication in this journal is cited, in accordance with accepted academic practice. No use, distribution or reproduction is permitted which does not comply with these terms.
*Correspondence: John L. Field, john.L.field@gmail.com
†Present Address: Mark Easter, Indigo Agriculture, Boston, MA, United States