Can Environmental Governance and Corporate Performance be Balanced in the Context of Carbon Neutrality? — A Quasi-Natural Experiment of Central Environmental Inspections
 Xiang Deng
 Benxin Huang4
  Xiaohang Ren
- 1School of Finance, Zhongnan University of Economics and Law, Wuhan, China
- 2Collaborative Innovation Center of Industrial Upgrading and Regional Finance(Hubei), Wuhan, China
- 3Carbon Trading and Carbon Finance Research Center of Zhongnan University of Economics and Law, Wuhan, China
- 4Department of Mathematics, University College London, London, United Kingdom
- 5Economics and Management School, Wuhan University, Wuhan, China
- 6Business School, Central South University, Changsha, China
- 7School of Mathematical Sciences, University of Southampton, Southampton, United Kingdom
This paper creatively studies the impact of the environmental governance on corporate performance in the context of China. We take the first round of central environmental inspections as the quasi-natural experiment shocks, and then test its effects on Chinese listed companies’ performance using the propensity score matching method and the difference-in-differences with multiple periods method. Furthermore, we discuss the transmission mechanism between central environmental inspections and corporate performance. The results indicate that central environmental inspections have significantly improved the corporate performance of listed companies in polluting industries in the inspected provinces. The central environmental inspections reduce agency costs and enhance corporate performance by improving the internal agency problems of listed companies. In addition, state-owned and large-scale companies are more sensitive to the central environmental inspections, and the effect of corporate performance improvement is more obvious. However, in regions with different levels of environmental regulations, there is no significant difference in the effects of central environmental inspections on the improvement of corporate performance.
1 Introduction
The global economy has experienced rapid development after World War II. However, the economic boom is at the cost of resource consumption and environmental pollution, which has caused increasingly noticeable ecological problems (Ren et al., 2022). The environmental issues are increasingly becoming the main focus of attention around the world (Deng, 2016; Duan et al., 2021; Ren et al., 2021). As the largest developing country, China has shouldered the heavy task in mitigating climate change and reducing carbon emissions. On 15 March 2021, at the ninth meeting of the Central Finance and Economics Committee in China, the members clearly stated that “carbon peak and carbon neutrality” should be included in the overall layout of ecological civilization construction, striving to achieve carbon peak by 2030 and carbon neutrality by 2060. Moreover, the members pointed out that the “14th Five-Year Plan” would be a key period as well as a window period for the carbon peak, and the goals would be to implement pollution and carbon reduction actions in key industries. Therefore, this paper is designed to study the measures that government takes to achieve environmental goals and their impact on corporate performance of companies in polluting industries. To achieve green and low-carbon ecological civilization development, the central government has revised and issued several environmental protection laws and regulations to punish corporate pollution violations severely. However, China’s command-and-control environmental regulatory policies (Tu and Chen, 2015; Xie et al., 2017; Zhang et al., 2021; Xiang., 2022) generally have problems such as “government-enterprise collusion” (Liang and Gao, 2014; Long and Hu, 2014) and “formalism” (Zhang et al., 2018), which make the policy implementation less satisfactory. To solve the current dilemma facing environmental regulatory policies, the Ministry of Ecology and Environment of China has launched five batches of central environmental inspections in 31 provinces, autonomous regions, and municipalities across the country since 2016, urging corporations to effectively rectify pollution violations while taking the initiative to accept environmental protection responsibilities. The first batch of central environmental inspections, known as the “environmental storm” which is the toughest environmental policy in China’s history (Chen et al., 2019). To respond to the supervision of the central environmental inspection team, listed companies in heavy-polluting industries are bound to adopt corresponding environmental protection measures to reduce corporate pollution. The companies generally use the following three methods: (1) stop production for a short period (Shi et al., 2016), resulting in temporary reduction of pollution; (2) reduce the discharge of pollutants in the manufacturing process by improving environmental protective innovation and introducing green equipment or green manufacturing processes (Porter & Linde, 1995; Rubashkina et al., 2015; Galloway and Johnson, 2016; Lei et al., 2022; Dong et al., 2021); (3) reduce the level of corporate pollution by optimizing the efficiency of internal resource utilization and investing part of the funds in the field of environmental governance (Porter and Linde, 1995; Yang et al., 2021). The negative impact of the first method on corporate performance is self-evident, whereas the impact of the latter two methods requires empirical testing combined with actual conditions to draw definite conclusions.
With the in-depth development of the central environmental inspections, on 26 July 2021, at a regular press conference held by the Ministry of Ecology and Environment of China, it was proposed that the second round of central ecological and environmental inspections would include the level of implementation of “the carbon peak and carbon neutrality goal” for the first time. In the context of carbon neutrality, exploring the impact of central environmental inspections on corporate performance from the perspective of environmental economics provides not only a new research path for analyzing whether the environmental regulatory policies design is reasonable and sustainable but also crucial empirical evidence for China to achieve carbon peak and carbon neutrality goals. Considering that the second round of central ecological and environmental inspections is currently in the initiation stage, this paper takes the first round of central environmental inspections as the research object. We used the propensity score matching (PSM) and the difference-in-differences (DID) with multiple periods to analyze the impact of central environmental inspections on the performance of listed companies in heavy-polluting industries. Moreover, we analyzed whether there is an innovation-driven mechanism or a principal-agent mechanism between them. In order to explore the actual policy effects of central environmental inspections, we further investigated corporate and regional heterogeneity. We found that central environmental inspections have a more significantly effect on improving corporate performance for state-owned corporations. There is no significant difference in the effects of central environmental inspections on the improvement of corporate performance.
Our study contributes as follows: First, existing research on the impact of central environmental inspections on corporate performance is mainly limited to industrial companies. We extend the sample to listed companies in the Shanghai and Shenzhen A-share exchange markets. In addition, this study combines the PSM method with the DID model for empirical analysis, eliminating the problem of sample selection bias, making the empirical results more robust. Second, We discover that the principal-agent mechanism acts as a mediator through central environmental inspections to improve corporate performance. Finally, this article expands the existing literature on the theoretical explanation between the central environmental inspection system and corporate performance, making the research conclusions more universal.
The remainder of the paper is arranged as follows. Section 2 explains the policy background and the hypotheses. Section 3 illustrates the data, define variables and research design. The results and findings are elaborated in Section 4. Section 5 discusses on heterogeneity while assessing the robustness of testing and Section 6 concludes the paper.
2 Hypotheses Development
From January 2016 to September 2017, the Ministry of Ecology and Environment carried out five batches of environmental inspections in 31 provinces across the country. The first round of inspections solved about 150,000 environmental problems for the people. Additionally, more than 2,100 major ecological and environmental problems have been solved in various regions, with more than 18,000 individuals held accountable through measures such as inspection reports and special inspections. The specific inspection details are shown in Table 1.
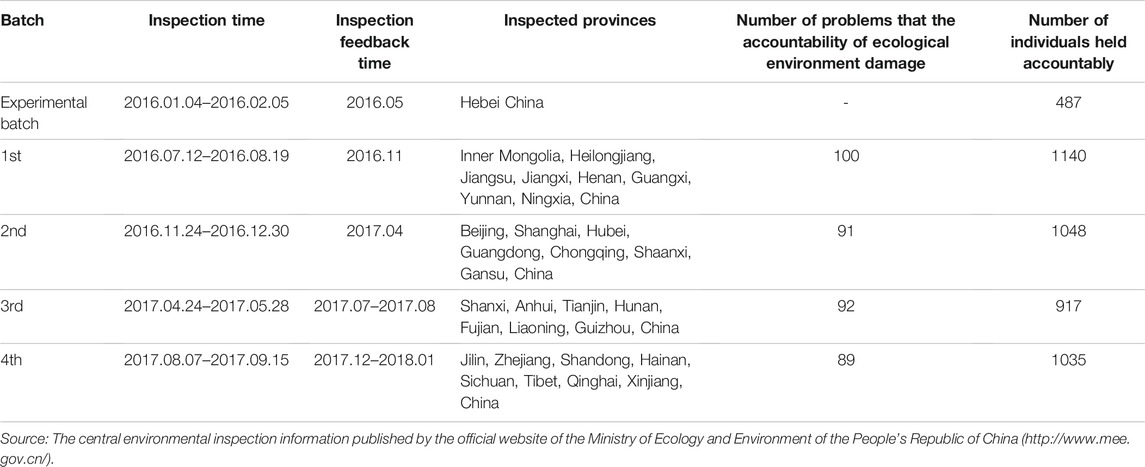
TABLE 1. Implementation effectiveness of the first round of central environmental inspections.
Environmental resources are public goods, whereas the goods produced by corporations are private goods. According to the basic principles of economics and the production possibility frontier analysis, the economy must choose between public and private goods. When corporations increase the production of private goods, it may reduce public goods, so public and private goods are opportunity costs of each other. If there are no environmental regulations, the price of environmental resources is zero. Companies may produce environmental pollution to increase private goods. Environmental degradation then keeps the economy within the production possibility frontier, and inefficiency arises consequently. Efficient environmental regulations can restore the production possibility frontier to the efficient frontier, conducive to readjusting resource allocation and solving the dilemma of misallocation of resources in society. Environmental regulations improve the overall economic efficiency of society, which benefits economic growth. Li and Li (2007) pointed out that regulatory externalities themselves result from a political process. These regulatory externalities manifest themselves as the external benefits or costs conferred on some interest groups. The externalities of environmental regulations preferably explain the mechanism through which environmental regulations affect the economic performance of corporations and provide theoretical support for further research on different effects of environmental regulations on corporate performance.
The relationship between environmental regulations and corporate performance has been one of the popular topics of academic research, but the existing literature has not drawn definitive conclusions. The main theories are the traditional hypothesis, Porter hypothesis, and uncertainty hypothesis. The early traditional hypothesis holds that environmental regulations harm corporate performance because regulatory costs would squeeze out corporate operating costs, leading to a decline in corporate performance (Jorgenson and Wilcoxen, 1990; Greenstone, 2002). The traditional hypothesis is based on the premise that a corporation’s technical conditions and resource utilization remain unchanged in the short term. The constraints of environmental regulations inevitably lead to an increase in the corporation’s operating cost, which could negatively affect corporate performance (Deng and Lu, 2017; Zhang et al., 2018; He et al., 2020). With the improvement of the internal governance structure of modern enterprises and the development of environmental and technological innovations, this hypothesis has been challenged by the Porter hypothesis. According to the Porter hypothesis (Porter and Linde, 1995), appropriate environmental regulations can improve corporate performance. The specific transmission path is that environmental regulations could stimulate corporations to carry out technological innovation and boost business operations, so the benefits created by innovative activities could even exceed the cost of environmental regulations, hence improving corporate performance (Johnstone et al., 2010). The uncertainty hypothesis holds that environmental regulations and corporate performance are restricted by various uncertain factors, making the impact of environmental regulations on corporate performance uncertain (Barbera and McConnell, 1990; Dou et al., 2022).
The central environmental inspections could affect corporate performance by shutting down the production of companies in heavily polluting industries, promoting companies’ research and development (R&D) and innovation, and improving companies’ principal-agent problems. However, to prevent some corporations from the indiscriminate suspension of work all at once during the inspection period, which could affect normal production, the Ministry of Ecology and Environment formulated the Prohibition of Rigidly Uniform Environmental Protection Work Guideline. The purpose of the guideline is to “strictly prohibit complete shutdowns, shutdowns before further discussion and other perfunctory responses” and to “resolutely avoid simple and rude behaviors such as centralized shutdowns of work, production and business.” The remarkable environmental governance effects of the central environmental inspections do not achieve temporary pollution and emission reduction through the suspension of production of heavily polluting enterprises. Hence, the central environmental inspections mainly affect corporate performance through an innovation-driven mechanism or a principal-agent mechanism. Moreover, to compensate for the compliance costs incurred by environmental regulations, companies might also increase asset utilization by optimizing resource allocation and using other means to promote corporate performance.
H1: Central environmental inspections can improve the corporate performance of listed companies in heavy-polluting industries.
Some scholars have found that environmental regulations can improve corporations’ internal principal-agent problem and restrain agency costs. Ambec and Barla (2002) proposed that environmental regulations can promote corporate environmental innovation and increase corporate profits by reducing agency costs. Li et al (2016) found that environmental regulations can improve corporate performance, and agency costs play a mediating role between them. The company behavior under the principal-agent framework results from the game that various stakeholders of the company play to find the optimal solution. Under the circumstance where both environmental protection and corporate development could be accomplished, the corporate shareholders hope that managers will maximize resource utilization efficiency and actively do a good job in environmental management. Therefore, managers are expected to reduce the possibility of corporate reputational damage caused by corporate pollution, since the corporate image is not only a negotiation basis for companies to obtain financial subsidies or bank loans, but also contributes to the improvement of corporate performance (Ren, 2017). However, due to information asymmetry, shareholders can only observe the input and output of a company and cannot know the whole process of realizing economic benefits. To ensure their interests and the limitation of the tenure period, managers might engage in short-sighted behaviors in the process of realizing economic benefits and hence fail to make reasonable use of corporate resources and cause specific damage to the environment (Li et al., 2016). In the absence of strict external environmental regulations, managers’ short-sighted behavior often causes severe environmental pollution, affecting the company’s reputation and leading to a decline in the company’s long-term financial performance. Whether a corporation takes the initiative to implement environmental governance is not only subject to external environmental regulatory policies but is also encouraged by environmental regulations to apply environmental protection management through the corporation’s internal governance mechanism. Corporate governance has played an important part in the transmission path from the negative environmental externalities of corporate behavior to corporate environmental governance. Furthermore, the Structure-Conduct-Performance model also provides theoretical explanations for the economic behavior and operating performance of corporations in the market (Rosenbaum and Rubin, 1983). Building on this analytical framework, scholars carry out relevant empirical studies to test whether environmental regulations, which are an important external shock that affects corporate behaviors, improve corporate performance through corporate governance. The huge political deterrence promoted by the central environmental inspections may arouse the public and the media’s attention to heavily polluting companies. Attention from the public and the media plays an important role in alleviating information asymmetry between shareholders and managers. It also helps central environmental inspections, which are means of environmental regulation, to influence corporations’ internal decision-making behavior on environmental protection. Managers may be forced to conduct scientific management of the corporation actively. The final manifestation is the improvement of the principal-agent relationship within the corporation, the reduction of agency costs, and thus the improvement of corporate performance.
H2: There is a principal-agent mechanism between the central environmental inspections and corporate performance, and the central environmental inspections improve corporate performance by improving the internal principal-agent problem of the corporation.
According to the Porter hypothesis (Porter and Linde, 1995), the appropriate intensity of environmental regulations can improve corporate performance while improving environmental quality, creating a win-win situation for environmental protection, pollution reduction, and economic growth. However, existing literature studies have not reached a consensus on the relationship between environmental regulations and economic growth (Feng and Chen, 2018; Hille et al., 2020; Shao et al., 2020; Zhou et al., 2020; Sun et al., 2021; Li et al., 2022). For China, a developing country that is in a critical period of economic transition, some Chinese scholars’ empirical evidence on Chinese companies supports the conclusion that there is no “Porter effect” or a “weak Porter effect” (Tu and Chen, 2015; Chen, 2016; Long and Wan, 2017; Chen. et al., 2022). Meanwhile, many scholars’ studies have provided evidence to support the “strong Porter effect.” Hamamoto (2005) took Japanese manufacturing companies as the research object, and the empirical results show that environmental regulations can increase companies’ R&D investment and improve enterprises’ total factor productivity. He and Luo (2018) showed that environmental regulations could increase industrial total factor productivity by promoting technological innovation. Yang and Peng (2021) found that environmental regulations affect corporate performance by promoting technological innovation, and technological innovation plays a mediating role between them. However, the current literature on central environmental inspections is limited, and most of the research focuses on the analysis and discussion of the system itself (Chen, 2017; Ren, 2018; Zhang et al., 2022) or the effectiveness of environmental governance (Liu and Wu, 2019; Wang et al., 2019). We determine the existence of the innovation-driven mechanism.
H3: There is an innovation-driven mechanism between the central environmental inspections and corporate performance, and the central environmental inspections stimulate corporations’ innovation vitality to improve corporate performance.
3 Variables, Methodology, Data
3.1 Variables
We select the natural logarithm of a company’s quarterly total profit (CP) as a tool to measure corporate performance (Chen et al., 2019). To ensure the robustness of the model, the natural logarithm of a company’s quarterly net profit (CP1) and the quarterly return on assets (ROA) are used as proxy variables for corporate performance in the robustness test.
The core explanatory variable, the central environmental inspections (CEI), is a difference-in-differences term containing two dummy variables. The first is the treatment group and the control group dummy variables (treat): The treatment group is a heavy-polluting industry corporation1, whereas the control group is a non-heavy-polluting industry corporation. When a listed company belongs to a heavy-polluting industry enterprise, treat is set to one; otherwise, it is set to 0. According to the Environmental Protection Inspection Project (Trial), the central environmental inspections mainly inspect the environmental pollution behaviors of industrial corporations in heavily polluting industries, so there is little or no impact of environmental inspections on non-heavy-polluting industries. The second dummy variable is the policy time dummy variable (post): When the central environmental inspection team starts to inspect a province, post is set to one; otherwise, it is set to 0. Moreover, considering the continuity of the central environmental inspections, the policy time dummy variable of the province after the end of inspections is still retained as a value of 1.
When the central environmental inspectorate starts to inspect a province does the core explanatory variable (CEI) of listed companies in the heavily polluting industry in that province take the value of 1, that is,
Regarding the mediator variable of R&D and innovation, because corporate-level green patent data are difficult to obtain and most of it has missing values, the number of green patents has a longer time lag in response to environmental regulatory policies than innovation investment (such as corporate R&D investment amount) does. We use the natural logarithm of a company’s annual R&D investment (lnRD) as a variable to measure the company’s R&D and innovation capabilities. As for the mediator variable of agency cost, there are currently two main methods for measuring agency cost used by domestic and foreign scholars, namely operating expense ratio and total asset turnover. The operating expense ratio measures agency costs from the perspective of input, and the additional increase in business expenses for companies with principal-agent problems is the agency costs of those companies. The asset turnover ratio measures agency costs from the perspective of output, which can better reflect the managers’ effort, level of management, and perquisite consumption and is more suitable for measuring agency costs. The higher the asset turnover rate, the higher the utilization efficiency of the company’s total assets and the lower the agency cost. We select the asset turnover rate (AC) as the reverse indicator of agency costs. Moreover, variables such as company size, debt-to-asset ratio, and company’s age are the control variables in the model, as shown in Table 2.
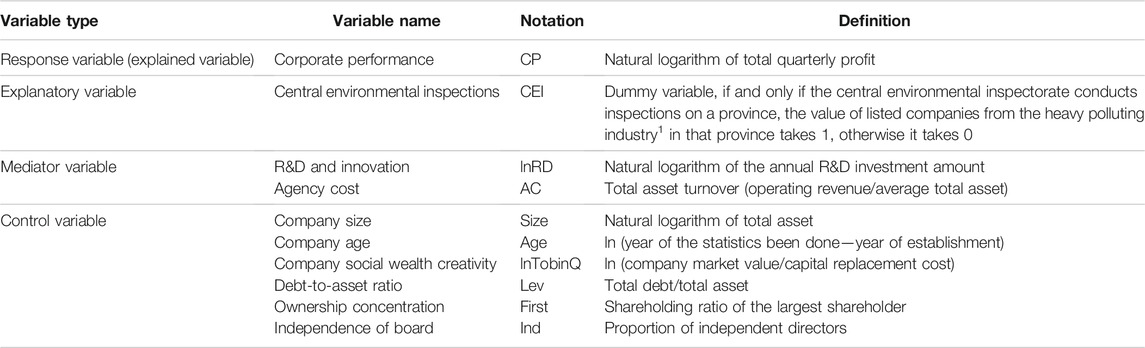
TABLE 2. Definition of main variables.
3.2 Methodology
The DID model can efficiently avoid the endogeneity problem and estimate the policy effect more accurately. Therefore, the DID model is suitable for this paper. We use the central environmental inspections as a quasi-natural experiment to construct a DID model to empirically test the net effect of the policies on corporate performance. Because the first batch of central environmental inspections was divided into five batches to inspect 31 provinces (autonomous regions and municipalities) across the country from 2016 to 2017, a multi-time period difference-in-differences method is used for empirical analysis. To eliminate sample selection bias caused by endogeneity, we use the PSM method to match the treatment group and the control group, and we construct the following benchmark model for empirical testing:
The subscript
We referred to the “three-step method” (Wen et al., 2005) to test the mediation and constructed the following six models to test the mediating effect of R&D and innovation and agency costs. Suppose the regression coefficients
3.3 Data and Descriptive Statistics
We used the quarterly unbalanced panel data from the Shanghai and Shenzhen A-share exchange market in China from 2014 to 2018 as the initial sample. To improve the validity of the data, the initial sample was processed according to the following criteria: (1) excluding ST and *ST companies; (2) excluding companies with severe absence of key variables; (3) excluding companies in the financial industry and real estate industry2; (4) excluding companies whose listing year is later than 2014. Finally, 41,786 groups of unbalanced panel data of 2,256 listed companies are obtained. The main reason for using quarterly data is to refer to the practice of Chen et al. (2019). The quarterly data can make the evaluation results of the policy effect of the multi-period DID method more accurate.
The listed company data was from the CSMAR database and the Chinese Research Data Services (CNRDS). The relevant data of the central environmental inspections was obtained from the released inspection information from the official website of the Ministry of Ecology and Environment of the People’s Republic of China3 and was sorted out. The measurement software used for empirical analysis in this paper is Stata 15.1.
Table 3 is the descriptive statistics of each variable. Table 3 shows that the minimum value of the response variable corporate performance (CP) is 0, the maximum value is 25.778, and the standard deviation is 5.59, indicating that the corporate performance of the sample listed companies is quite different overall. The minimum and maximum values of the mediator variable R&D and innovation (lnRD) are also quite different. The mean value of the entire sample is much larger than the minimum value, suggesting that the overall sample has a high level of R&D and innovation. The mediator variable agency cost (AC) also has large differences within the sample. The median is 0.289 and the mean is 0.39, which is very different from the maximum value of 11.416. Since the agency cost (AC) is an inverse indicator, the lower its value, the more serious the principal-agent problem of the enterprise. Therefore, most of the sample corporates have a lower level of internal governance.
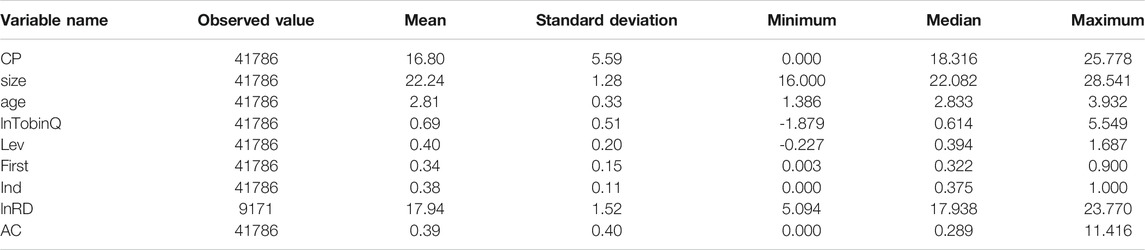
TABLE 3. Descriptive statistics.
Table 4 shows the Spearman correlation coefficient matrix between the variables. The absolute value of the largest correlation coefficient is 0.669, which is less than 0.8, and most of the coefficients are less than 0.5, suggesting that there is no collinearity problem in the model. Based on the above analysis, it can be decided that there is a significant correlation between the main variables, and the follow-up empirical analysis can be continued.
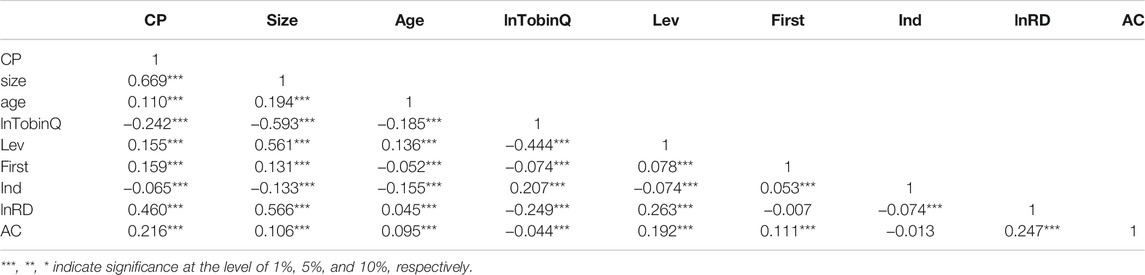
TABLE 4. Correlation coefficient matrix.
4 Empirical Analysis
4.1 Baseline Regression
The sample companies are grouped by industry and are divided into heavy-polluting companies and non-heavy-polluting companies. Many factors affect corporate performance, and there are naturally differences in company size, governance level, and financing costs between companies in heavy-polluting industries and companies in non-heavy-polluting industries. Suppose there is no parallel trend between the treatment group and the control group in the sample before the impact of the central environmental inspection policies. In that case, the estimated regression parameters of the central environmental inspections dummy variable based on these sample data cannot accurately reflect the net effect of the policy shock. Building on the above analysis, we use propensity score matching to match the treatment group with the control group. To make other corporate characteristics of both the treatment and control groups as similar as possible, we select six covariates: company size, company age, company social wealth creativity, debt-to-asset ratio, the shareholding proportion of the largest shareholder, and the proportion of independent directors. The PSM method calculates the propensity score according to the multidimensional covariate index and matches the treatment group with the control group according to the similarity of the propensity score. To test the quality of matching, we perform a balance test on the sample after matching, as shown in Table 5. Table 5 illustrates that the deviation rate of the covariates after matching is significantly reduced. The t-test results show that the null hypothesis that the treatment group and the control group are not significantly different is not rejected, indicating that the differences in corporate characteristics between the treatment group and the control group have been drastically reduced through propensity score matching. Figure 1 shows the fitting results of the propensity scores of the treatment group and the control group. The fitting after matching is significantly better than the fitting before matching. Table 6 reports the distribution of the number of individuals in the treatment group and the control group before and after matching. Due to the one-to-many matching, the number of samples in the treatment group after PSM is 11,073, and the number of samples in the control group is 10,759.
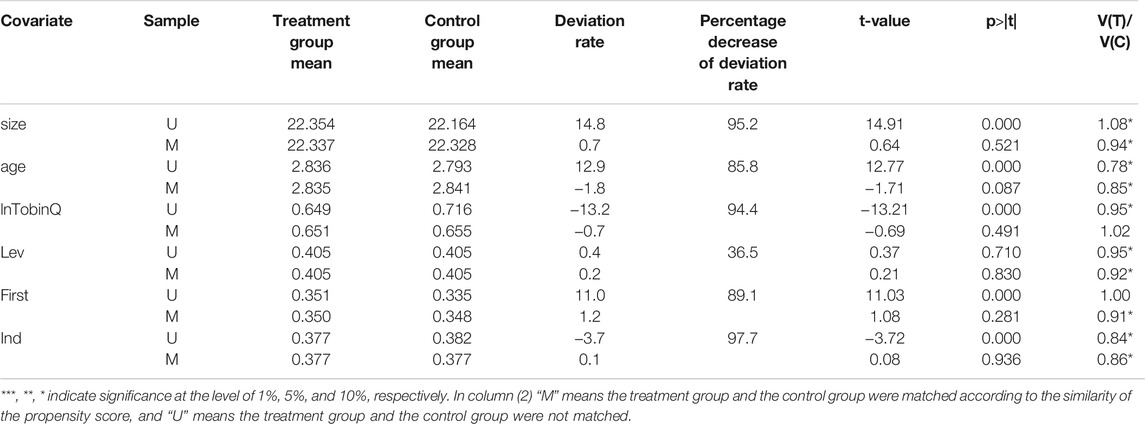
TABLE 5. Balance test.
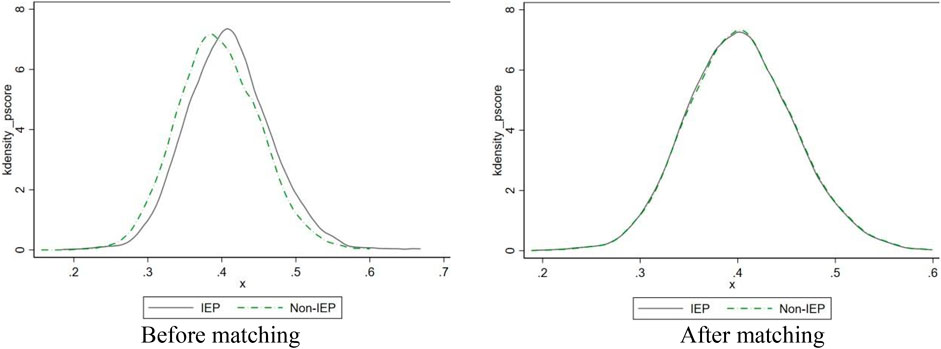
FIGURE 1. Propensity score fitting plot before and after PSM.

TABLE 6. Sample distribution table before and after matching.
In Table 7, column (1) is the full sample for regression, and the second column is the PSM matched sample for regression. Table 7 shows that the regression coefficients of the central environmental inspections (CEI) in columns (1) and (2) are both significant positive at the 1% level, indicating that the central environmental inspections significantly enhance corporate performance. Thus, H1 can be verified. Furthermore, after PSM, the coefficient of central environmental inspections (CEI) is slightly reduced compared with the coefficient of the full sample. Therefore, it could be deduced that propensity score matching can preferably eliminate sample selection bias and exclude other factors’ influences on corporate performance; thus, the coefficient of the central environmental inspections (CEI) only reflects the net effect of the policy on corporate performance. The R2 value of the PSM matched model fits better than the full sample model. Figure 2 shows that before the implementation of the central environmental inspection policies in 2016, the treatment group and the control group basically conformed to the assumption of parallel trends. After the central environmental inspections were launched in 2016, the corporate performance of the treatment group became significantly higher than that of the control group.
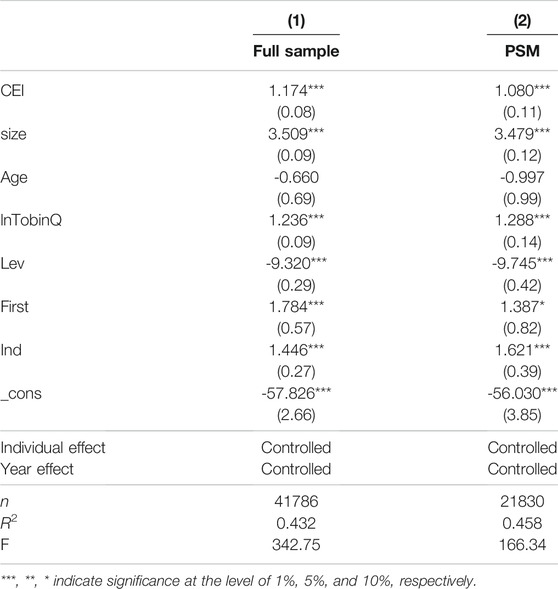
TABLE 7. Baseline regression results.
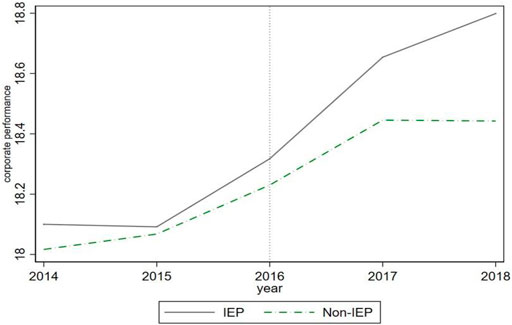
FIGURE 2. Corporate performance change trend. Note: IEP stands for treatment group and Non-IEP stands for control group.
4.2 Mediation Test
According to the above baseline regression analysis, the central environmental inspections have significantly improved corporate performance. To identify the specific transmission path through which the policy affects corporate performance, we focus on the innovation-driven mechanism and principal-agent mechanism while introducing the mediation model to test.
4.2.1 Innovation-Driven Mechanism
Table 8 shows that after controlling the individual effects and time effects, the regression coefficients of the explanatory variable, namely central environmental inspections (CEI), in column (2) are not significant. There is not an innovation-driven mechanism. R&D and innovation have not yet acted as mediators between the central environmental inspections and corporate performance, so H2 fails the test. The empirical results show that the current environmental regulatory policies of the central environmental inspections have failed to stimulate the innovative vitality of heavily polluting corporations, and the “strong Porter effect” cannot explain the mechanism by which the central environmental inspections improve corporate performance. Because it takes a long time for companies to carry out R&D and innovation, corporate performance cannot be improved in the short term, as the innovative compensation effect brought by the increase of companies’ R&D investment cannot surpass the cost effect of compliance in limited time. Companies in heavy-pollution industries in China do not have enough motivation to invest a large amount of R&D funds in green innovation, and they have not yet reached the “strong Porter effect” where a positive cycle and mutual promotion of economic benefits and green environmental protection are achieved.
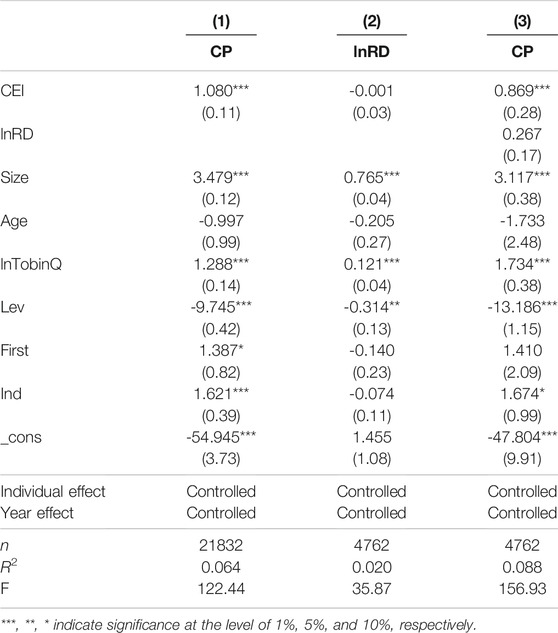
TABLE 8. Innovation-driven mechanism.
4.2.2 Principal-Agent Mechanism
In Table 9, in both columns (1) and (2), the regression coefficients of the central environmental inspections (CEI) pass the significance test at the 1% level. In column (3), the regression coefficient of the central environmental inspections (CEI) is significantly positive and slightly lower than the regression coefficient in column (1). The regression coefficient of agency cost (AC) is significantly positive at the 1% level. This suggests that there is a principal-agent mechanism between central environmental inspections and corporate performance, but it is not the only mechanism. Agency costs partly perform as a mediator between them. Thus, H2 is verified.
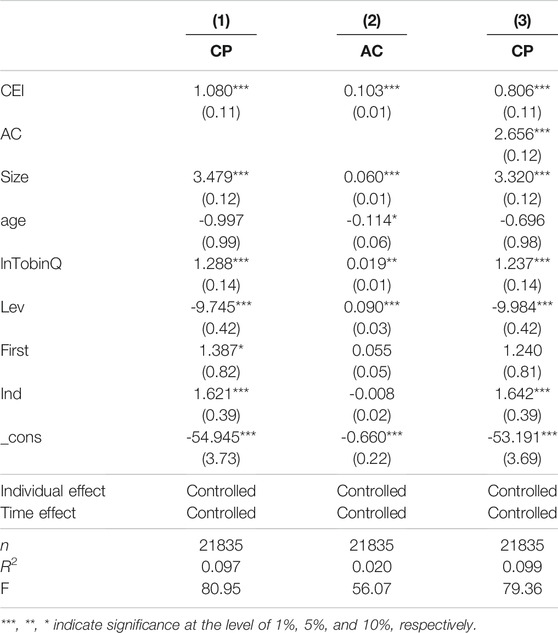
TABLE 9. Principal-agent mechanism.
The empirical results show that the central environmental inspection policies improve corporate performance by reducing corporate agency costs, which provides an empirical basis from the perspective of the principal-agency problem for analyzing the theoretical mechanism by which central environmental inspections affect corporate performance. The central environmental inspections have a strong political deterrent. Under these environmental regulations, external policy pressure has made the managers of heavily polluting corporations actively follow the environmental management system; reduce energy consumption and corporate pollution; and implement environmental protection behaviors in line with the interests of shareholders, leading to restrained agency costs and improved corporate performance. Moreover, the central environmental inspections involve public participation in supervision. To maintain a good corporate image, the managers of heavy-polluting companies may also take the initiative to adopt environmental management measures, and the possibility of environmental pollution behaviors that violate the interests of shareholders is reduced. Thereby, the principal-agent problem may be greatly reduced, and corporate performance can also be improved.
5 Discussion
The abovementioned baseline regression and mechanism analysis demonstrate that central environmental inspections can improve corporate performance by reducing corporate agency costs. For companies of different types or in different regions, would this policy show different policy effects? Based on the two major levels of corporate heterogeneity and regional heterogeneity, respectively, we test the heterogeneity of corporate size, equity nature, and level of regional environmental regulations.
5.1 Heterogeneity of Corporate Size
The interaction term of the independent variable central environmental inspections (CEI) and the moderator variable corporate size (size) is added to the model, and a moderation model is constructed to test the impact of company size on the effect of the central environmental inspection policies. To overcome the regression bias of the moderation model, the corporate size in the interaction term is decentered5. The regression results are shown in Table 10.
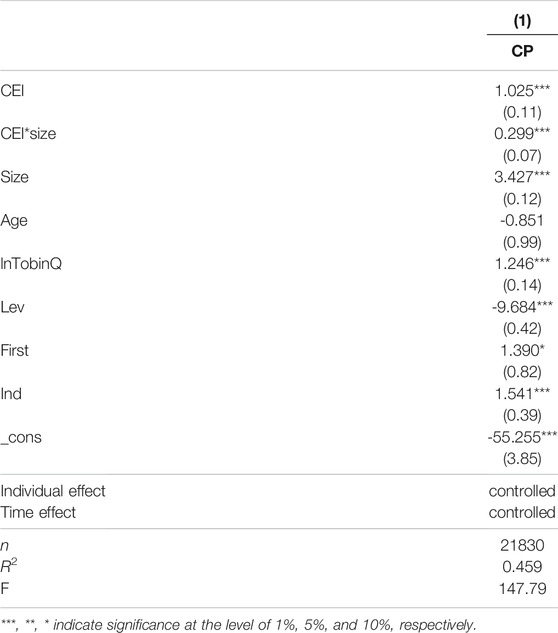
TABLE 10. Heterogeneity test for corporate size.
Table 10 illustrates that the coefficients of the independent variable and the interaction term are both significantly positive at the 1% level, implying that the size of a corporation plays a significant role in promoting the positive relationship between the central environmental inspections and corporate performance. That is, the larger the size of the corporation, and the more obvious the positive effect of the central environmental inspections on corporate performance could be. The larger the listed company’s scale, the better the internal governance structure of the company and the corporate managers’ level of decision-making could also improve accordingly. When faced with external environmental regulations of the central environmental inspections, companies are more capable and motivated to optimize their internal resource allocation, manage environmental protection strategies, and reduce the perquisite consumption of corporate managers, thereby curbing agency costs and improving corporate governance performance.
5.2 Heterogeneity of Equity Nature
According to the different nature of the equity of sample companies, the sample is divided into the state-owned corporate group and the non-state-owned corporate group, and the regression model is tested in layers. The regression results are presented in Table 11. In Table 11, the regression coefficients of the independent variable (CEI) of the non-state-owned corporate group and the state-owned corporate group are significantly positive at the 1% level, indicating whether a corporation is state-owned or not, the central environmental inspections can improve corporate performance. Specifically, the regression coefficient of the independent variable in the state-owned corporate group is higher than that in the non-state-owned corporate group, which implies that central environmental inspections have a more significant effect on the improvement of corporate performance for state-owned corporations.
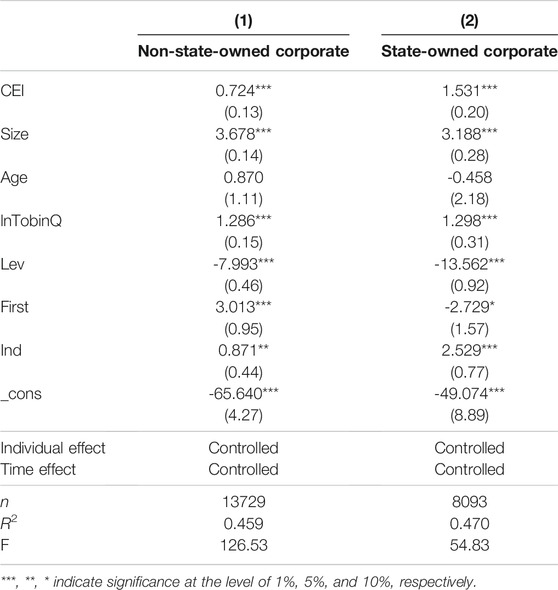
TABLE 11. Heterogeneity test for equity nature of corporates.
5.3 Heterogeneity of Regional Environmental Regulations Level
The interaction term of the independent variable central environmental inspections (CEI) and the moderator variable regional environmental regulations level (ER) is added to the model to construct a moderation model for testing the influence of the regional environmental regulations level on the effect of central environmental inspection policies. The regional environmental regulations level (ER) in the interaction item is decentered. Furthermore, the expression for the regional environmental regulations level (ER) is given by annual local fiscal environmental protection expenditure in each province/annual local fiscal general budget in each province. The regression results are shown in Table 12.
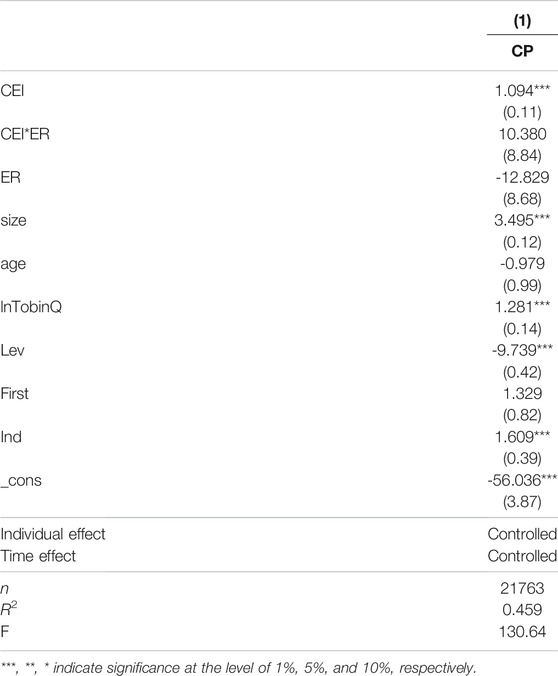
TABLE 12. Heterogeneity test for regional environmental regulations level.
Table 12 shows that the regression coefficient of the independent variable (CEI) is significantly positive at the 1% level, whereas the regression coefficient of the interaction term (CEI*CE) fails the significance test, indicating that the regional environmental regulations level does not strengthen the positive relationship between central environmental inspections and corporate performance. There is no significant difference in the effect of central environmental inspections on the improvement of corporate performance when comparing regions with higher and lower levels of environmental regulations. The central environmental inspectorate stayed in various provinces, autonomous regions, and municipalities to carry out environmental inspection work. The law enforcement was intense and lasted for an unprecedentedly long time. This has promoted the implementation of environmental protection responsibilities by party committees and governments at all levels. In turn, this has created a top-to-bottom political pressure of environmental protection covering all provinces, autonomous regions, and municipalities. Still, no apparent adjustments in the intensity of law enforcement have been made according to the level of environmental regulations in a certain province. The environmental pressure on corporations would not be significantly different depending on their region, and the effects on corporate performance improvement caused by environmental regulatory externalities are correspondingly similar. The level of regional environmental regulations has not yet had a significant impact on the effectiveness of the central environmental inspection policies.
5.4 Robust Test
5.4.1 Parallel Trend Test
The important premise of using the difference-in-differences model is that the treatment group and the control group meet the parallel trend assumption to ensure the unbiasedness of the regression coefficients. The hypothesis of parallel trends means that before the central environmental inspections, both heavy-polluting and non-heavy-polluting companies’ performances are basically the same in terms of time trends. After the central environmental inspections, the performance of heavy-polluting companies has improved significantly compared with that of non-heavy-polluting companies. To satisfy the assumption of parallel trends, we first match the treatment group with the control group using propensity scores before introducing the difference-in-differences method. The parallel trend test is carried out on the matched sample companies.
Figure 3 illustrates that before PSM, the coefficients of the dummy variable in each period are significantly different from 0 in the first three periods, and the preliminary judgment suggests it does not meet the parallel trend assumption. After PSM, in the first three periods, the dummy variable coefficients of each period are not significantly different from 0, and in the last five periods, the dummy variable coefficients of most periods are more significant than 0, revealing that the parallel trend assumption is satisfied, and the policy has a significant positive treatment effect. Furthermore, the tvdiff command in Stata 15.1 is used to perform a parallel trend test. The test results are presented in Table 13. Table 13 shows that after PSM, in the first three periods of implementing the central environmental inspection policies, the dummy variable coefficients in each period are not significantly different from 0, which shows that the sample companies after PSM have passed the parallel trend test.
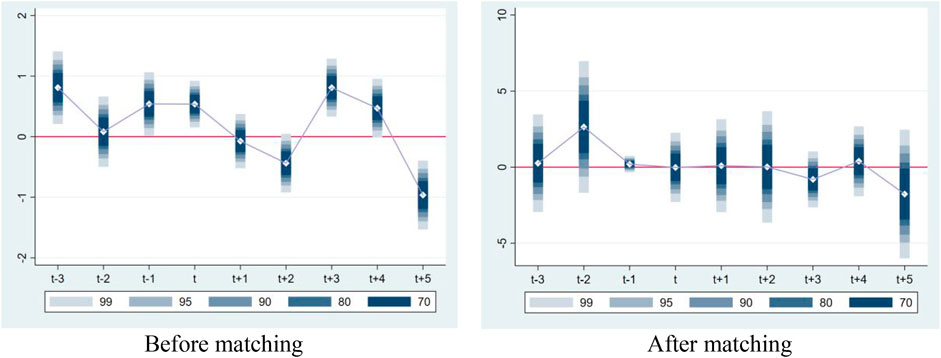
FIGURE 3. Parallel trends before and after PSM.
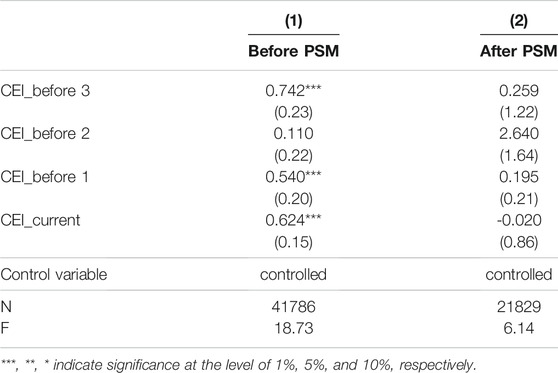
TABLE 13. Parallel trend test.
5.4.2 Replacing Key Variables
Using the natural logarithm of the company’s quarterly net profit (CP1) and the company’s quarterly ROA as measurement indicators of the response variable company performance, the empirical results are shown in columns (1) and (2) of Table 14. According to the regression results, the regression coefficient of the central environmental inspections is still significantly positive at the 1% level, indicating that the central environmental inspection policies have indeed improved corporate performance, and the results are consistent with the baseline regression results.
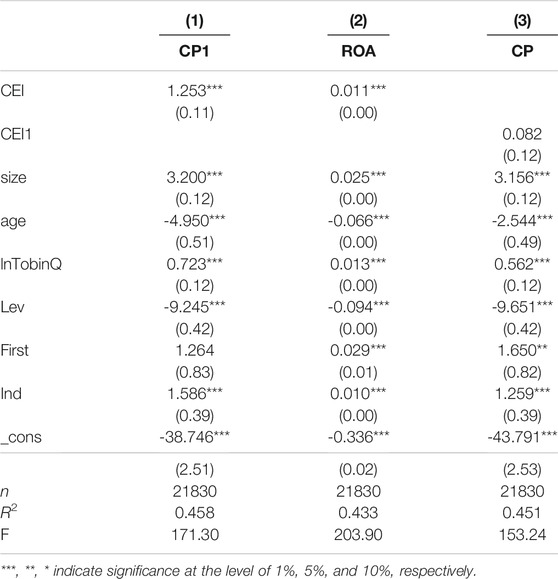
TABLE 14. Robustness test.
5.4.3 Policy Changing Time Window
Assuming that the implementation time of the central environmental inspections in each province is 2 years earlier, respectively, we now reconstruct the central environmental inspections dummy variable (CEI1). According to the regression results in column (3) of Table 14, the regression coefficient of the pseudo policy dummy variable is not significant. This conclusion supports the assumption of randomness in the policy implementation time.
6 Conclusion
This study applies the multi-period PSM-DID model to empirically test whether central environmental inspections can improve corporate performance by considering 2,256 listed companies in China’s Shanghai and Shenzhen A-share exchange markets. Moreover, we discuss the innovation-driven and the principal-agent mechanisms as mediators between the two factors in-depth. Based on the heterogeneity of corporations and regions, we analyze the differences in the policy effects of central environmental inspections on corporations of different types and in different regions. The research conclusions have vital theoretical and practical significance.
The research conclusions are as follows: (1) Central environmental inspections can significantly improve the corporate performance of listed companies in heavily polluting industries, and the results are still significant under the robustness test. (2) The principal-agent mechanism acts as a transmission path between the central environmental inspections and corporate performance, but it is not the only path. Central environmental inspections reduce corporate agency costs by improving the internal principal-agent problem of listed companies, improving the corporate performance. The innovation-driven mechanism cannot explain the impact path of the central environmental inspections on corporate performance. The central environmental inspection system has not yet exerted the “strong Porter effect,” and these environmental regulations have not improved the green innovation level of heavily polluting corporations. (3) Central environmental inspections have a differentiated policy effect on different types of companies. Central environmental inspections can boost the corporate performance improvement of listed companies with different micro-features, but they have a more obvious effect on enhancing the improvement of larger companies and state-owned companies; however, various levels of regional environmental regulations do not result in differentiated policy effects of the central environmental inspections. In regions with different levels of environmental regulations, there is no significant difference in the effect of central environmental inspections on the improvement of corporate performance. Therefore, it is necessary to establish a sound and standardized corporate environmental disclosure system. For corporate pollution behaviors, the rectification plan should be publicly disclosed; information asymmetry between the company and the public, shareholders, and managers should be effectively reduced; companies’ agency problem must be improved; and the corporate governance structure must be optimized. We must strongly promote the development of climate change investment and financing, guide more social funds into the field of low-carbon environmental protection, and help companies to obtain sufficient funds to invest in environmental protection equipment, thereby reducing carbon emissions and helping China achieve the “carbon peak and carbon neutrality” goal soon.
Data Availability Statement
Publicly available datasets were analyzed in this study. This data can be found here: Most of the basic data are publicly available, mainly from the National Bureau of Statistics of China, the official website, http://www.stats.gov.cn/, and the RESSET and IFind financial databases.
Author Contributions
XD: Conceptualization, Writing Original draft preparation, Methodology QZ: Software, Data Analysis Original draft preparation, BH: Writing, Reviewing and Proof, XR: Supervision Writing, Editing and Reviewing.
Funding
This research was supported by National Social Science Foundation of China under grant No. 17ZDA089, the Minister of Education of China New Liberal Art Research and Practice of Reform Project under grant No. 2021100064, the Minister of Education of China Industry-university Cooperative Education Project under grant No. 202102057010, the Fundamental Research Funds for the Central Universities, Zhongnan University of Economics and Law under grant No. 2722021AJ015.
Conflict of Interest
The authors declare that the research was conducted in the absence of any commercial or financial relationships that could be construed as a potential conflict of interest.
Publisher’s Note
All claims expressed in this article are solely those of the authors and do not necessarily represent those of their affiliated organizations, or those of the publisher, the editors and the reviewers. Any product that may be evaluated in this article, or claim that may be made by its manufacturer, is not guaranteed or endorsed by the publisher.
Footnotes
2Financial indicators such as the debt-to-asset ratio of listed companies in the financial and real estate industries are significantly different from those of listed companies in other industries, so companies in these industries are excluded.
2Financial indicators such as the debt-to-asset ratio of listed companies in the financial and real estate industries are significantly different from those of listed companies in other industries, so companies in these industries are excluded.
3Official website of the Ministry of Ecology and Environment of the People’s Republic of China(http://www.mee.gov.cn/).
References
Ambec, S., and Barla, P. (2002). A Theoretical Foundation of the Porter Hypothesis. Econ. Lett. 75. doi:10.1016/s0165-1765(02)00005-8
Barbera, A. J., and McConnell, V. D. (1990). The Impact of Environmental Regulations on Industry Productivity: Direct and Indirect Effects. J. Environ. Econ. Manag. 18, 50–65. doi:10.1016/0095-0696(90)90051-y
Chen, C. (2016). China’s Industrial Green Total Factor Productivity and its Influencing Factors: an Empirical Study Based on ML Productivity Index and Dynamic Panel Model. Stat. Res. 33, 53. doi:10.19343/j.cnki.11-1302/c.2016.03.007
Chen, H. (2017). Legalization of Environmental Inspection System: Positioning, Dilemma and A Way Out. L. Rev. 35, 176. doi:10.13415/j.cnki.fxpl.2017.03.019
Chen, M., Ma, M., Lin, Y., Ma, Z., and Li, K. (2022). Carbon Kuznets Curve in China's Building Operations: Retrospective and Prospective Trajectories. Sci. Total Environ. 803, 150104. doi:10.1016/j.scitotenv.2021.150104
Chen, R., Xiao, Q., Lan, S., and Liu, J. (2019). Can Central Environmental Inspections Improve Corporate Performance? -- Taking Listed Industrial Companies as an Example. Econ. Rev. 5, 36
Deng, X. (2016). How Do Environmental Violation Events Harm Chemical Enterprise External Financing in China. Chim. OGGI-Chemistry Today 34 (6b), 20–26.
Deng, X., and Lu, J. (2017). The Environmental Performance,Corporate Social Responsibility, and Food Safety of Food Companies from the Perspective of Green Finance, 58. Romania: Revista De Cercetare Si Interventie Sociala.
Dong, K., Ren, X., and Zhao, J. (2021). How Does Low-Carbon Energy Transition Alleviate Energy Poverty in China? A Nonparametric Panel Causality Analysis. Energ. Econ. 103, 105620. doi:10.1016/j.eneco.2021.105620
Dou, Y., Li, Y., Dong, K., and Ren, X. (2022). Dynamic Linkages between Economic Policy Uncertainty and the Carbon Futures Market: Does Covid-19 Pandemic Matter. Resour. Pol. 75, 102455. doi:10.1016/j.resourpol.2021.102455
Duan, K., Ren, X., Shi, Y., Mishra, T., and Yan, C. (2021). The Marginal Impacts of Energy Prices on Carbon price Variations: Evidence from a Quantile-On-Quantile Approach. Energ. Econ. 95, 105131. doi:10.1016/j.eneco.2021.105131
Feng, Z., and Chen, W. (2018). Environmental Regulation, Green Innovation, and Industrial Green Development: An Empirical Analysis Based on the Spatial Durbin Model. Sustainability 10 (1), 223. doi:10.3390/su10010223
Galloway, E., and Johnson, E. P. (2016). Teaching an Old Dog New Tricks: Firm Learning from Environmental Regulation. Energ. Econ. 59, 1–10. doi:10.1016/j.eneco.2016.06.023
Greenstone, M. (2002). The Impacts of Environmental Regulations on Industrial Activity: Evidence from the 1970 and 1977 Clean Air Act Amendments and the Census of Manufactures. J. Polit. Economy 110 (6), 1175–1219. doi:10.1086/342808
Hamamoto, M. (2005). Environmental Regulations and the Productivity of Japanese Manufacturing Industries. Resource Energ. Econ. 28, 299
He, W., Tan, L., Liu, Z., and Zhang, H. (2020). Property Rights protection, Environmental Regulation and Corporate Financial Performance: Revisiting the Porter Hypothesis. J. Clean. Prod. 264, 121615. doi:10.1016/j.jclepro.2020.121615
He, Y., and Luo, Q. (2018). Environmental Regulations, Technological Innovation and Industrial Total Factor Productivity-Retesting the ‘Strong Porter Hypothesis. Soft Sci. 32, 20–25.
Hille, E., Althammer, W., and Diederich, H. (2020). Environmental Regulation and Innovation in Renewable Energy Technologies: Does the Policy Instrument Matter. Technol. Forecast. Soc. Change 153, 119921. doi:10.1016/j.techfore.2020.119921
Johnstone, N., Haščič, I., and Popp, D. (2010). Renewable Energy Policies and Technological Innovation: Evidence Based on Patent Counts. Environ. Resource Econ. 45, 133–155. doi:10.1007/s10640-009-9309-1
Jorgenson, D. W., and Wilcoxen, P. J. (1990). Environmental Regulation and U.S. Economic Growth. RAND J. Econ. 21, 314–340. doi:10.2307/2555426
Lei, X., Zhang, J., Su, T., and Y, Y. (2022). Ecological Accountability, Media Coverage and Enterprise Green Process Innovation: A Quasi-Natural Experimental Study Based on Central Environmental Supervision. Foreign Economics & Management, 1–14. doi:10.16538/j.cnki.fem.20210921.204
Li, K., Ma, M., Xiang, X., Feng, W., Ma, Z., Cai, W., et al. (2022). Carbon Reduction in Commercial Building Operations: A Provincial Retrospection in China. Appl. Energ. 306, 118098. doi:10.1016/j.apenergy.2021.118098
Li, Q, Q., Tian, S., and Liu, T. (2016). The Impact of Senior ’management’s Political Network on Corporate Environmental protection Investment-Cconsidering the Role of Government and Market. J. Shanxi Univ. Finance Econ. 38, 90–99. doi:10.1016/j.jcorpfin.2016.02.001
Li, S, S., Zhao, X., and Lou, C. (2016). Environmental Regulations and Corporate Performance——Based on the Perspective of Agency Cost. J. Capital Univ. Econ. Business 18, 89–97. doi:10.13504/j.cnki.issn10080-2700.2016.02.012
Li, Y., and Li, X. (2007). Analysis of the Externality of Local Government Environmental Regulations--Based on the Perspective of Public Choice. Finance Trade Econ. 3, 54–59. doi:10.19795/j.cnki.cn11-1166/f.2007.03.009
Liang, P., and Gao, N. (2014). Personnel Change, Legal Environment and Local Environmental Pollution, 06. Beijing: Management World, 65–78. doi:10.19744/j.cnki.11-1235/f.2014.06.007
Liu, Z., and Wu, J. (2019). Have the Central Environmental Inspections Improve the Air Quality? --An Empirical Study Based on the Difference-in-Differences Model. J. Public Adm. 12, 23
Long, X., and Hu, J. (2014). Environmental Pollution from the Perspective of Government-enterprise Collusion: a Theoretical and Empirical Study. J. Finance Econ. 40 (10), 131–144. doi:10.16538/j.cnki.jfe.2014.10.001
Long, X., and Wan, W. (2017). The Heterogeneity of Environmental Regulations, Corporate Profit Margins and Compliance Costs. China Ind. Econ. 6, 155–174. doi:10.19581/j.cnki.ciejournal.2017.06.023
Porter, M. E., and Linde, C. v. d. (1995). Toward a New Conception of the Environment-Competitiveness Relationship. J. Econ. Perspect. 9 (4), 97–118. doi:10.1257/jep.9.4.97
Ren, G. (2017). Study on Corporate Environmental Investment Behavior from the Perspective of Corporate Governance. J. Zhengzhou Univ. (Philosophy Soc. Sci. Edition) 50 (03), 66–71+159.
Ren, H. (2018). An Analysis of the Concept of “Party and Government Co-Responsibility” in the Construction of China’s Environmental Accountability System. J. Beijing Univ. Tech. (Social Sci. Edition) 18, 49–55.
Ren, X., Cheng, C., Wang, Z., and Yan, C. (2021). Spillover and dynamic effects of energy transition and economic growth on carbon dioxide emissions for the European Union: A dynamic spatial panel model. Sust. Dev. 29 (1), 228–242. doi:10.1002/sd.2144
Ren, X., Li, Y., Shahbaz, M., Dong, K., and Lu, Z. (2022). Climate Risk and Corporate Environmental Performance: Empirical Evidence from China. Sustainable Prod. Consumption 30, 467–477. doi:10.1016/j.spc.2021.12.023
Rosenbaum, P. R., and Rubin, D. B. (1983). The Central Role of the Propensity Score in Observational Studies for Causal Effects. Biometrika 70, 41–55. doi:10.1093/biomet/70.1.41
Rubashkina, Y., Galeotti, M., and Verdolini, E. (2015). Environmental regulation and competitiveness: Empirical evidence on the Porter Hypothesis from European manufacturing sectors. Energy Policy 83, 288–300. doi:10.1016/j.enpol.2015.02.014
Shao, S., Hu, Z., Cao, J., Yang&Guan, L. D., and Guan, D. (2020). Environmental Regulation and Enterprise Innovation: A Review. Bus Strat Env 29, 1465–1478. doi:10.1002/bse.2446
Shi, Q., Guo, F., and Chen, S. (2016). “Political Blue Sky” in Haze Control: Evidence from Local “TWO Sessions” in China. China Ind. Economics05, 40–56. doi:10.19581/j.cnki.ciejournal.2016.05.003
Sun, Z., Wang, X., Liang, C., Cao, F., and Wang, L. (2021). The impact of heterogeneous environmental regulation on innovation of high-tech enterprises in China: mediating and interaction effect. Environ. Sci. Pollut. Res. 28, 8323–8336. doi:10.1007/s11356-020-11225-w
Tu, Z., and Chen, R. (2015). Can the Emissions Trading Mechanism Realize the Porter Effect in China. Econ. Res. J. 50, 160–173.
Wang, L., Liu, X., and Xiong, Y. (2019). Central Environmental Inspections and Air Pollution Control--Based on the Empirical Analysis of Micro-panel Data of Prefecture-level Cities. China Ind. Econ. 10, 5–22.
Wen, Z., Hou, J., and Zhang, L. (2005). Comparison and Application of Moderation and Mediation. Acta Psychologica Sinica 2, 268–274.
Xiang, X., Ma, X., Ma, Z., and Ma, M. (2022). Operational Carbon Change in Commercial Buildings under the Carbon Neutral Goal: A LASSO-WOA Approach. Buildings 12, 54. doi:10.3390/buildings12010054
Xie, R.-h., Yuan, Y.-j., and Huang, J.-j. (2017). Different Types of Environmental Regulations and Heterogeneous Influence on “Green” Productivity: Evidence from China. Ecol. Econ. 132, 104–112. doi:10.1016/j.ecolecon.2016.10.019
Yang, L., Zhang, Z., and Zhen, J. (2021). Can Central Environmental Inspectors Promote Corporate Investment in Environmental Protection? -- Based on the Empirical Analysis of Chinese Listed Companies. J. Zhejiang Univ. (Humanities Soc. Sciences) 51 (03), 95–116.
Yang, R., and Peng, A. (2021). Environmental Control, Technological Innovation and the Performance of Heavily Polluting Enterprises. J. East China Normal Univ. (Philosophy Soc. Sci. Edition) 53, 129–214. doi:10.16382/j.cnki.1000-5579.2021.01.016
Zhang, L, L., Qi, Y., and Mao, X. (2018). From Quantity to Quality: An Analysis of the Transformation of Government Environmental Assessment. China Population. Resour. Environ. 28 (10), 105–111.
Zhang, S., Ma, M., Li, K., Ma, Z., Feng, W., and Cai, W. (2022). Historical carbon abatement in the commercial building operation: China versus the US. Energ. Econ. 105, 105712. doi:10.1016/j.eneco.2021.105712
Zhang, S., Xiang, X., Ma, Z., Ma, M., and Zou, C. (2021). Carbon Neutral Roadmap of Commercial Building Operations by Mid-Century: Lessons from China. Buildings 11, 510. doi:10.3390/buildings11110510
Zhang, Y, Y., Wang, J., Xue, Y., and Yang, J. (2018). Impact of environmental regulations on green technological innovative behavior: An empirical study in China. J. Clean. Prod. 188, 763–773. doi:10.1016/j.jclepro.2018.04.013
Keywords: central environmental inspections, corporate performance, porter hypothesis, environmental governance, carbon neutrality
Citation: Deng X, Huang B, Zheng Q and Ren X (2022) Can Environmental Governance and Corporate Performance be Balanced in the Context of Carbon Neutrality? — A Quasi-Natural Experiment of Central Environmental Inspections. Front. Energy Res. 10:852286. doi: 10.3389/fenrg.2022.852286
Received: 11 January 2022; Accepted: 20 January 2022;
Published: 14 February 2022.
Edited by:
Minda Ma, Tsinghua University, ChinaReviewed by:
Xiaowei Xu, University of Rhode Island, United StatesShusen Qi, Xiamen University, China
Copyright © 2022 Deng, Huang, Zheng and Ren. This is an open-access article distributed under the terms of the Creative Commons Attribution License (CC BY). The use, distribution or reproduction in other forums is permitted, provided the original author(s) and the copyright owner(s) are credited and that the original publication in this journal is cited, in accordance with accepted academic practice. No use, distribution or reproduction is permitted which does not comply with these terms.
*Correspondence: Xiaohang Ren, domrxh@outlook.com