On the Fidelity of Computational Models for the Flow of Milled Loblolly Pine: A Benchmark Study on Continuum-Mechanics Models and Discrete-Particle Models
 Wencheng Jin1*
  Yimin Lu1,2
  Feiyang Chen1,3
  Ahmed Hamed1
  Nepu Saha1
  Jordan Klinger1
  Sheng Dai2
  Qiushi Chen3
  Yidong Xia1*
- 1Energy and Environment Science and Technology Directorate, Idaho National Laboratory, Idaho Falls, ID, United States
- 2School of Civil and Environmental Engineering, Georgia Institute of Technology, Atlanta, GA, United States
- 3The Glenn Department of Civil Engineering, Clemson University, Clemson, SC, United States
The upstream of bioenergy industry has suffered from unreliable operations of granular biomass feedstocks in handling equipment. Computational modeling, including continuum-mechanics models and discrete-particle models, offers insightful understandings and predictive capabilities on the flow of milled biomass and can assist equipment design and optimization. This paper presents a benchmark study on the fidelity of the continuum and discrete modeling approaches for predicting granular biomass flow. We first introduce the constitutive law of the continuum-mechanics model and the contact law of the coarse-grained discrete-particle model, with model parameters calibrated against laboratory characterization tests of the milled loblolly pine. Three classical granular material flow systems (i.e., a lab-scale rotating drum, a pilot-scale hopper, and a full-scale inclined plane) are then simulated using the two models with the same initial and boundary conditions as the physical experiments. The close agreement of the numerical predictions with the experimental measurements on the hopper mass flow rate, the hopper critical outlet width, the material stopping thickness on the inclined plane, and the dynamic angle of repose, clearly indicates that the two methods can capture the critical flow behavior of granular biomass. The qualitative comparison shows that the continuum-mechanics model outperforms in parameterization of materials and wall friction, and large-scale systems, while the discrete-particle model is more preferred for discontinuous flow systems at smaller scales. Industry stakeholders can use these findings as guidance for choosing appropriate numerical tools to model biomass material flow in part of the optimization of material handling equipment in biorefineries.
1 Introduction
Biorefineries can convert sustainable biomass into bio-energy (directly via combustion through intermediate fuels such as ethanol) and bio-chemicals (e.g., succinic acid). Over the past decade, bio-energy has achieved a steady increase in the U.S. renewable energy portfolio and is a vital contributorfor supporting the U.S. to accomplish the carbon-neutral goal (DOE-BETO, 2016). However, biorefineries suffer from unreliable operations in transportation, storage, and handling of granular biomass feedstocks. These process upsets, manifested in various occasions such as hopper arching, screw jamming, and particle segregation, can cause significant downtime of operations resulting in non-competitive market values of bio-products (Hess et al., 2007; Ramírez-Gómez, 2016; Dale, 2017; Ilic et al., 2018; Cheng et al., 2021). All these issues result from the poor flowability of the granular biomass feedstocks. Both experimental characterization (Hernandez et al., 2017; Salehi et al., 2019; Stasiak et al., 2019) and numerical modeling (Jin et al., 2020b; Xia et al., 2020) have been used to address the flowability issue with the objectives of optimizing equipment geometry/operation and optimizing the granular feedstock characteristics. However, experiments cannot measure all the critical state parameters constraint by sensors (e.g., shear testers only quantify two stress components of a full stress tensor), which are crucial to elucidate the flow physics. In addition, experiments are not economically viable to conduct at the industrial scale with a comprehensive test plan. Numerical modeling validated by experimental data is expected to address the experimental limitations and achieve the above objectives. Both the continuum-mechanics models and the discrete-particle models have been continuously developed, improved, and used to predict the flow behavior of the granular biomass feedstocks.
The continuum-mechanics models assume that the granular material can be treated as a continuum, for which the constitutive laws can describe the mechanical flow behavior. The variation of biomass species, particle size, and particle morphology are realized by using different constitutive laws or different values of the constitutive material parameters. For example, the authors previously applied the modified Drucker-Prager/Cap model (Jin et al., 2020a), the NorSand model (Jin et al., 2020b), and the hypoplastic model (Lu et al., 2021a,b) to predict the flow behavior of the milled loblolly pine with different particle size distributions. Yi et al. (2020a,b) used the modified Cam-Clay model and the Drucker-Prager/Cap model to simulate the milled corn stover and Douglas fir.
The discrete-particle models track individual particles and predict particle trajectories from the collisions with neighboring particles. The variation of particle size, morphology, and mechanical properties resulting from biomass species and pre-processing are explicitly described and simulated in discrete-particle modeling. For example, Xia et al. (2019) and Guo et al. (2020) used flexible clumped spheres to approximate different particle shapes for milled loblolly pine and switch grass. Xia et al. (2021) explicitly modeled the complex-shaped pine chips using the polyhedral discrete element model. Guo et al. (2021) developed an experiment-informed, semi-empirical, elasto-plastic bond model for discrete element modeling of woody biomass particles. A recent effort by Chen et al. (2022) proposed a set of complex particle contact laws to describe particle interactions using monospheres.
The continuum-mechanics and discrete-particle models have been used to simulate the granular biomass flow in various characterization tests, including uniaxial compression, axial shear, Schulz ring shear, and pilot-scale hopper with considerable success so far. In general, the continuum-mechanics models are found to be efficient in predicting large flow systems with reduced-order accuracy. In contrast, the discrete-particle models are more computationally expensive with higher precision and are more suitable for investigating the fundamental physics of granular flow at smaller scales. However, a quantitative comparison on capturing the in-depth flow physics at different scales and the associated computational cost of the two modeling approaches has been an untouched area in the literature.
This paper attempts to address this issue by benchmarking the numerical predictions of flow systems from a continuum model and a particle model against physical experiments. In Section 2, we briefly introduce the solution algorithms and the constitutive/contact laws of the two modeling approaches, followed by the targeted granular material (i.e., milled loblolly pine) and its material parameters for the two models. In Section 3, we detail the experimental and numerical setup of a lab-scale rotary drum test, a pilot-scale hopper test, and a full-scale inclined plate test. The qualitative and quantitative comparison among the experimental measurements and the numerical predictions from the two modeling methods are presented for each test. We then discuss the apparent advantages and disadvantages of the two modeling approaches based on the benchmark cases in Section 4. Lastly, the conclusion is provided in Section 5.
2 Methods and Materials
2.1 Continuum-Mechanics Model
2.1.1 Solution Algorithm
The principles of continuum-mechanics are the conservation of mass and momentum, which are the governing equations to describe the motion at any point,
where ρ is the bulk density of the granular material,
The above governing equations can be solved by many numerical methods, such as the mesh-based finite-element method (FEM) and finite-volume method (FVM), and the meshless smoothed-particle hydrodynamic (Jin et al., 2020b). We adopt the FEM with the coupled Lagrangian-Eulerian (CEL) approach as the resolution algorithm in this paper. The CEL approach solves the governing equations using two steps: 1) The granular material domain is discretized using Lagrangian mesh, and the deformable mesh tracks the movement of material; 2) the deformed mesh is returned to its initial position, and the deformed material properties are then interpolated back to the “fixed” mesh. This scheme enables CEL to model large deformation without the mesh-tangling issue.
2.1.2 Constitutive Model
The G-B hypoplastic model was formulated to model the soil behavior with the critical state concept, defined as the state of stress and void ratio upon which granular material can flow infinitely without volumetric changes. This constitutive model has been applied to effectively model various types of soil (Bauer, 1996; Gudehus, 1996; Herle and Gudehus, 1999; Mašín, 2005; Wójcik and Tejchman, 2009; Liao and Yang, 2021) and biomass materials (Lu et al., 2021b,a). The stress-motion relation and the void ratio e evolution of the G-B model are expressed in rate form as:
where
The forth order tensor
2.2 Discrete-Particle Model
2.2.1 Solution Algorithm
The discrete-particle models are generally referred as models solved by the discrete element method (DEM). With the theory initially established by Cundall and Strack (1979) and Chung (2006), DEM simulates the bulk flow behavior of granular materials by explicitly tracking the motion of each single particle of an assembly. The particle motion, expressed in terms of translation and rotation, is governed by the Newton-Euler equations:
where m and I are the particle’s mass and moment of inertia,
2.2.2 Contact Model
For granular material with complex particle shapes and sizes, one can explicitly model the complex shapes and sizes in DEM. However, such an approach is computationally expensive because of the mathematical complexity involved in describing particle shapes and in detecting and resolving particle contacts. Alternatively, the influence of particle-scale characteristics (e.g., shapes, sizes, deformability) on bulk behavior can be indirectly modeled with advanced contact laws with spherical particles. This latter approach is appealing for simulating larger-scale problems due to its computational efficiency and is therefore adopted in this study. Specifically, we adopt a recently proposed nonlinear hysteretic model to calculate the interaction forces (Chen et al.,2022). This model is capable of capturing the sophisticated bulk behavior of granular biomass that yield strain hardening, interlocking, and cohesion, when subjected to variable compressive and repeated loading conditions. It is mathematically expressed as:
where Fnl and Fnu denote the normal force component in compressive loading and unloading, respectively. Fnc is the cohesion force. The superscripts (m) and (m − 1) indicate the current and previous loading cycles, respectively. δ and δ0 are the total and plastic overlap distances. k1, k2, Knc, α, and C are the material parameters to represent particle stiffness. The exponent χ is the loading displacement power function index, f1 and f2 are two numerical correction terms to avoid the discontinuity in force calculation. Note that this model tracks the contact history of two contacting particles since the detection of their contact. The storage of history (e.g., plastic deformation δ0, loading cycle m) requires large computing memory and enables to model history-dependent flow behavior. The above contact model only accounts for normal interaction forces. We adopt the classical Mindlin theory (Mindlin, 1953; Kruggel-Emden et al., 2008) to calculate the tangential interaction forces.
2.3 Granular Material
The granular material used in this study is milled loblolly pine chips. The loblolly pine trees from a southeastern Georgia plantation in the U.S. were first processed in a flail chain to remove the bark, limbs, and needles. The main bole of the tree was chipped at the plantation to a nominal 50 mm size, then hammer milled in the Biomass Feedstock National User Facility at Idaho National Laboratory until the particles pass a retention screen of 6 mm. We further dried the granular pine chips in a rotary drum and stored with a moisture content of approximately 6%. The sieve analysis of the material sample shows that the cumulative passing particle size distribution has characteristic (10, 50, and 90% respectively) parameters of d10 = 0.38 mm, d50 = 0.82 mm, d90 = 1.79 mm. A more detailed description of sample preparation has been reported in an earlier work (Jin et al., 2020a).
We conducted extensive characterization on the mechanical behavior of the loblolly pine chips using the cyclic axial compression, the Schulze ring shear test, and the vibration test (Jin et al., 2020a). A workflow to calibrate the G-B hypoplastic model parameters for the loblolly pine chips using the characterization data was established by Lu et al. (2021b). Table 1 lists the calibrated material parameters, in which the internal friction angle at critical state ϕc and the exponent α determine the critical and the peak stress values. The granulate hardness hs, the exponent n and β control the elastic behavior of the material. The minimum, the critical and the maximum void ratios at zero pressure ed0, ec0 and ei0 provide the void ratio (density) boundaries that the granular material can achieve.
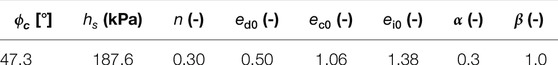
TABLE 1. Calibrated G-B hypoplastic model parameters for the loblolly pine chips.
For the discrete-particle model, we calibrated both the contact model parameters and the DEM spherical particle parameters (i.e., particle radius, particle density, Young’s modulus, Poisson’s ratio) for the targeted loblolly pine chips. Table 2 summarizes the calibrated DEM particle-particle (P-P) contact model parameters against the cyclic axial compression tests on loblolly pine chips. The calibration procedure is detailed in Chen et al. (2022) for the hysteretic contact model parameters (for normal contact force component) and in Xia et al. (2019) for the Mindlin model (for tangential contact force component). Note the parameters (A1, A2, A3) listed in the table are correlated with k1 and k2 in Eq. 7. Also, the “coarse-grained” DEM adopted in this study allows the spherical particles not equivalent to physical particles in shape and size. The bulks of spheres with radius of 1.5 mm were calibrated to render the equivalent bulk behavior of the biomass samples and used for all the following simulations. In addition to the hysteretic and the Mindlin contact models, we also adopt the rolling resistance model to account for the interlocking effect of the complex-shaped pine particles by applying the constant torque (Zhou et al., 1999). The typical range of the parameter associated with this model (i.e., rolling resistance μr) is 0.6–1.0, and we calibrated this parameter through trial-and-error in hopper simulation detailed in the following section.
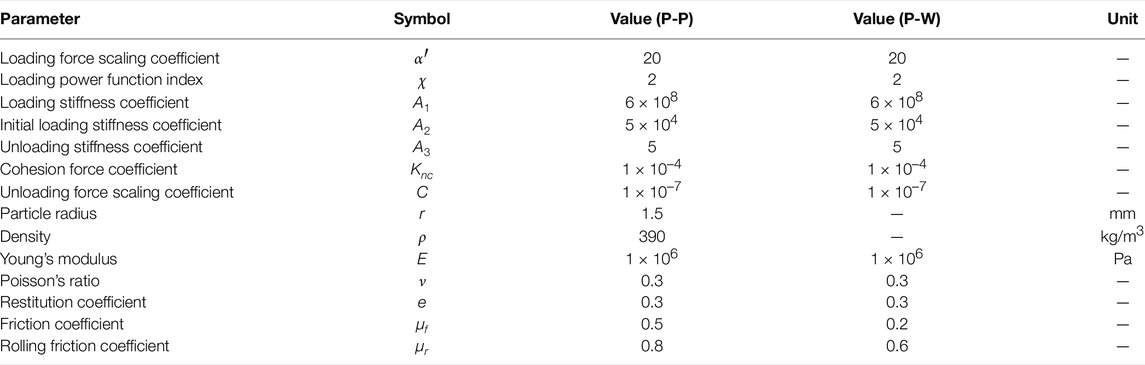
TABLE 2. Calibrated DEM model parameters for loblolly pine chips.
For the particle-wall (P-W) contact, we adopted the same set of contact models as for the particle-particle (P-P) contact. All the model parameters are the same except the friction coefficient μf and rolling friction coefficient μr, which are the two dominant parameters controlling frictional behavior. We chose the initial values of the two parameters by balancing a single sphere particle on an inclined plane with an inclination angle of 8.5° (Chen, 2022) from the experimental measurement for milled loblolly pine. The influence of varying these parameters on the flow behavior will be demonstrated in the case studies. The P-W column in Table 2 lists all parameters for the particle-wall contact.
3 Benchmark Cases
3.1 Hopper Flow and Arching
Hoppers are one of the most widely used equipment to handle granular materials across several industries including the bioenergy sector. Inconsistent hopper flow, such as hopper arching (Horabik and Molenda, 2014), rathole, surging flow, poses a significant challenge in biorefineries. Robust and high-fidelity numerical models can help to address this challenge by directly simulating hopper flow at various scales. In this section, we used the calibrated FEM and DEM models to simulate a hopper flow of the milled loblolly pine at the pilot-scale, and compared the predictions against experimental measurements to show the capabilities of the two models.
3.1.1 Experimental and Model Setup
The experimental tests to characterize the flow of milled loblolly pine in a wedge-shaped hopper are detailed in Lu et al. (2021a). Figures 1A,B show the front, side, and top views of the hopper and the size of the hopper, respectively. The hopper is customized with motors that can rotate its sidewalls to form any given semi-inclination angle θ. During the experiments, the hopper is first charged with the milled pine feedstock to a targeted height H = 0.68 m. Then the hopper opens its outlet by gradually sliding the two sidewalls in the upward-directions, holding the semi-angle constant. We measured the critical outlet width as the maximum orifice size at which the feedstock cannot continuously flow out of the hopper. We also logged the accumulated mass during the flow test to quantify the mass flow rate for any combination of outlet opening width W and semi-inclination angle θ.
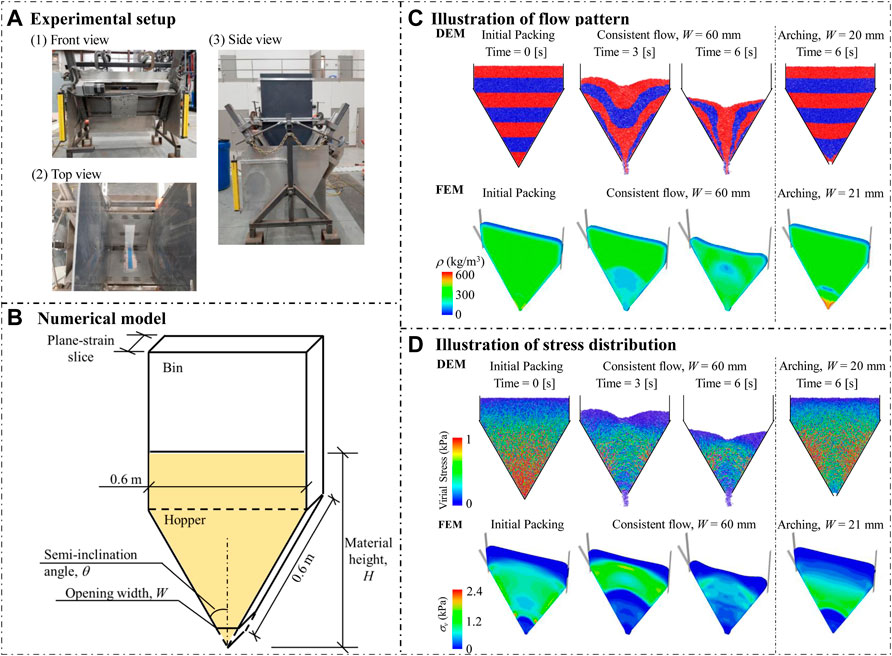
FIGURE 1. Overview of the hopper flow problem: (A) The top, side and front views of the customized hopper; (B) The geometry of the numerical models with simplified hopper thickness; (C) The comparison of flow pattern and arching from the DEM and FEM models; (D) The comparison of the stress distributions for the consistent flow and arching cases from the DEM and FEM models.
A full 3D hopper discharge simulation is neither computationally viable for DEM nor necessary, as the experiments observed flow pattern is in plane strain condition. As shown in Figures 1A,B thin cross-section of the hopper is considered with a depth of 3 mm in the out-of-plane direction (i.e, one layer of mono-spheres). The hopper walls are meshed with triangular elements. The charging process was simulated using the rainfall method (Härtl and Ooi, 2008; Xia et al., 2019), with which the particles were inserted into the computational domain and allowed to deposit in the hopper under gravity. The insertion zone is located at the top of the bin (1.2 m above the bottom of hopper) with a width of 0.6 m and height of 0.2 m. We adopted the rainfall method because it resembles the physical hopper charging procedure in experiments. Once the hopper was charged up to the same height H as the experiments, we stopped the insertion and let the particles sit in the hopper for a period to reach force equilibrium. The equilibrium was achieved when the maximum velocity of all the inserted particles was less than 1 mm/s. The charging and equilibrium process took about 1.5 s of physical time to finish. We trimmed the extra particles that are above the target height after the equilibrium. Different from the experimental procedure, we removed the lower sections of the hopper walls to create an opening with target width to initiate the discharging process. This simplification prevents additional disturbance of the particle packing. To obtain the critical outlet width, we run multiple simulations with gradually smaller opening widths until clogging happens. The mean value of the width of the clogging case and the width of the last case with smooth flow is defined as the critical outlet width, which has an accuracy of ±1.25 mm as we use 2.5 mm step size for hopper opening. The cumulative discharged mass was calculated by multiplying the discharge particle number with the particle mass.
The hopper flow simulation using the continuum FEM model has been described in our previous studies Lu et al. (2021b,a). Briefly, a half slice of the hopper with a thickness of 25 mm is modeled given its plane strain condition and its symmetrical flow pattern. The hopper walls are modeled as rigid bodies, and their interaction with the material is directly simulated through the Coulomb friction model with a wall friction angle of 8.5°. We simulated the charging step by applying gravity on the material and letting it rest until the stress equilibrium is achieved. Note that we assigned initial bulk density and void ratio according to the physical measurement. The following discharging step was realized by sliding sidewalls upwards following the experimental procedure and the material began flowing until the hopper is fully discharged. The mass flow rate qm is evaluated by extracting and integrating the nodal velocity and the elemental density of all elements at the outlet. The critical outlet width Wcr is obtained by the Dichotomy method, in which we simulated two different outlet widths W of flowing and arching situations and then gradually narrow the range of W until a dramatic change of flow responses occurs with two close outlet widths in 1 mm.
3.1.2 Results
Comparing the DEM results with experimental results of hopper discharge, we found that when the rolling friction coefficient μr is in the range of 0.6–1.0, the DEM model provides predictions with a good agreement with the FEM predictions and the experimental measurements. Accordingly, we used μr = 0.8 for all the following hopper flow simulations.
Figure 1C presents a qualitative comparison of the flow patterns predicted by the DEM and FEM models, with a hopper semi-inclination angle of 30° and a hopper opening W = 60 mm. Note the original distribution of the particles is colored by horizontal bands in the DEM case, while the FEM case shows the bulk density. While both the models predict a smooth discharge, the DEM model shows a funnel flow pattern (i.e., first-in last-out) and the FEM model predicts a mass flow pattern (i.e., first-in first-out). As the corresponding physical experiment of the same hopper configuration tended to yield pattern toward mass flow from our laboratory observation, we surmise that the particle-wall friction coefficient assigned in the DEM simulations might be higher than needed. Normally, lower wall friction tends to yield mass flow patterns in hopper discharge. Nevertheless, the particle-wall interaction parameters chosen in the DEM simulations have negligible influence on the mass flow rate and the critical arching distance reported in the following. When the hopper opening reduces to 20 mm, both models predict hopper arching phenomenon with arch-shaped virial stress distribution (Subramaniyan and Sun, 2008) from the DEM model and the arch-shaped vertical stress distribution from the FEM model in Figure 1D. Figure 1D also shows the stress distribution for case of W = 60 mm. The stress pattern of the two models match each other in general except in the hopper outlet area.
To examine whether the two numerical models can quantitatively capture the effect of outlet width on the discharging flow response, a suite of simulations with different outlet widths are performed. The results of the accumulative discharged mass against time are plotted in Figure 2A. For the same hopper opening width W, the DEM model prediction (solid lines) and the FEM model results (dashed line with markers) agree well with each other, especially for the openings W larger than 40 mm. Note that we scaled both the DEM and FEM predictions, because the DEM model has less total material for flow due to its model set-up (trim and hopper opening) and FEM model post-processing assumes the same velocity and density at a node within a time increment. Figure 2B compares the calculated mass flow rate qm between the DEM and FEM results, with reference to the experimental measurements for different hopper opening widths. The FEM model predicts a close agreement with the experimental data, whereas the DEM model slightly over-predicts the mass flow rate. The slight over-prediction is primarily due to larger particle-particle porosity of the bulk (and consequently lower total solid fraction of the bulk) than the physical materials in the initial packing. In the DEM simulation, the total mass of the material is nevertheless guaranteed by using a large sphere density, so the bulk density of the packed DEM spheres is comparable to the FEM simulation and the physical material. The coarse-grained spheres in the DEM simulations, without considering any cohesive force between the spheres in this case study, tend to deplete slightly faster from the hopper than the continuum description of the same process.
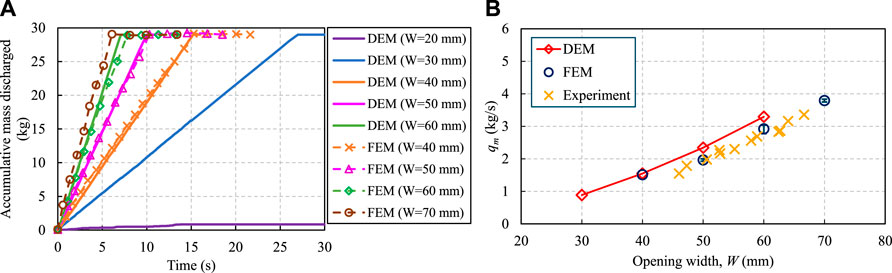
FIGURE 2. Quantitative comparison of (A) the cumulative mass discharged where the case with W = 20 mm is clogged, and (B) the mass flow rate qm against hopper opening width W among the DEM and FEM model predictions, and the experimental measurements, where the error bar in FEM results represents the numerical variation caused by different time step size.
Moreover, we obtained the critical outlet widths for different semi-inclination angles from the DEM and FEM results, and compared them against the experimental measurements in Figure 3. The error bar of the experimental data represents the variation of multiple measurements except the case of inclination angle θ = 30°. Both the FEM and DEM models predicted values of the Wcr agree well with the experimental data for different inclination angles. The slight difference between the model predictions and the experimental data for 32o < θ < 34o is primarily due to the local effect of pine samples near the outlet area with a non-representative particle size distribution (Lu et al., 2021a). This localization effect is often observed in biorefineries as a variation of critical outlet size (error bar) is observed for the same feeding material.
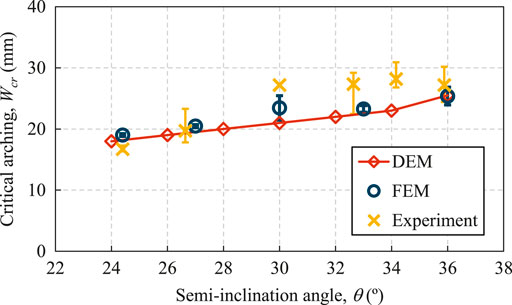
FIGURE 3. The variation of the critical outlet width with increasing hopper semi-inclination angle, predicted by the DEM and FEM models along with the experimental measurements. The error bar of the experimental data represents the min-max range of multiple measurements.
The quantitative comparison in Figure 2 and in Figure 3 demonstrates that both the FEM model and DEM model can reasonably capture the critical flow behavior of milled loblolly pine inside the hopper. If we neglect the required computational cost and modeling effort, we recommend that both models are suitable to inform the operation and design of wedge-shaped hoppers for the flowing of milled biomass.
3.2 Inclined Plane Flow
Granular flow on an inclined plane is a widely adopted benchmark test to decipher flow physics given it is a well-controlled granular flow system. It can also physically model engineering applications, such as landslides in geohazard mitigation. One of the most intriguing features is its inclusion of flows in both quasi-static and dense flow regimes, which are distinguished by their shear rate and realized simply with a variation of the inclination angle (Pouliquen, 1999; Pouliquen and Forterre, 2002; Jop et al., 2005, 2006; Forterre and Pouliquen, 2008). In this work, we focus on investigating the in-flow velocity and the after-flow material stopping thickness on the plane, by performing FEM and DEM simulations as well as physical inclined plane experiments.
3.2.1 Experimental and Model Setup
Figure 4A presents the customized experimental setup of pine chips flowing on an inclined plane with adjustable inclined angle η, along with its front view sketched in Figure 4B. An inclined ramp with a width of 760 mm is fixed on an aluminum frame. A cuboid-shaped material storage bin is installed at the upper end of the ramp with a length of 570 mm, a height of 915 mm, and the same width of 760 mm as the ramp. The sidewall facing the ramp can slide upwards in its plane to initiate material flow at a targeted gate opening. The plane’s inclination angle η can be adjusted by changing the height of the two supporting legs near the storage bin. A layer of pine chips is glued on the ramp to form a no-slip boundary condition.
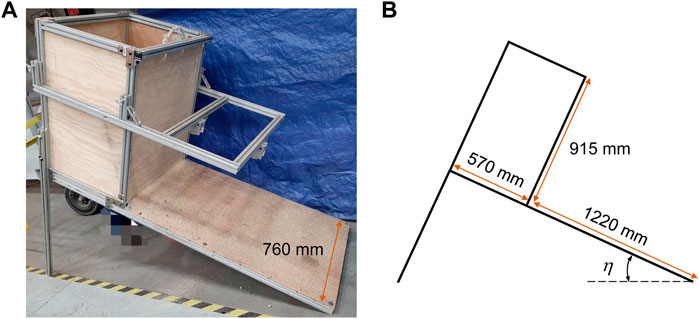
FIGURE 4. Experimental setup and geometry of the inclined plane tests. (A) A plane with a material storage bin at the top is hold by an aluminum frame. The height of the frame below the bin can be adjusted to vary the inclined angle of the plane. (B) The front view of the experimental setup.
The physical tests started with filling the storage bin with the milled loblolly pine, followed by flow initiation through sliding the gate to a preset height. After the flow stopped, we measured the thickness hstop of the material remained on the ramp using laser displacement sensors. hstop was only characterized at the middle of the ramp along the length of the plane.
Given the symmetrical feature with respect to the middle surface (shown as red plane in Figure 5A) of the experiment setup and the observed flow pattern, we constructed a 3D symmetrical FEM model with the same geometry as the physical experiment. For the boundary conditions, the inclined plane was considered as a no-slip boundary with all degrees of freedom been constrained, and the surfaces inside the storage box were considered as full-slip boundaries with no movements at the normal direction and no constraints at the tangential direction. We performed the FEM simulation using the calibrated G-B hypoplastic model (Section 2.1) following the same steps as the experiments. Each simulation began with a consolidation step until the stress equilibrium was achieved in the storage bin. The flow was then initiated by releasing the constraints of the nodes at the gate surface within a preset height. We stopped the simulation until material stops flowing, and we quantified the stopping thickness by extracting the material volume fraction in each element above the plane and summing up the heights of the elements occupied by the material.
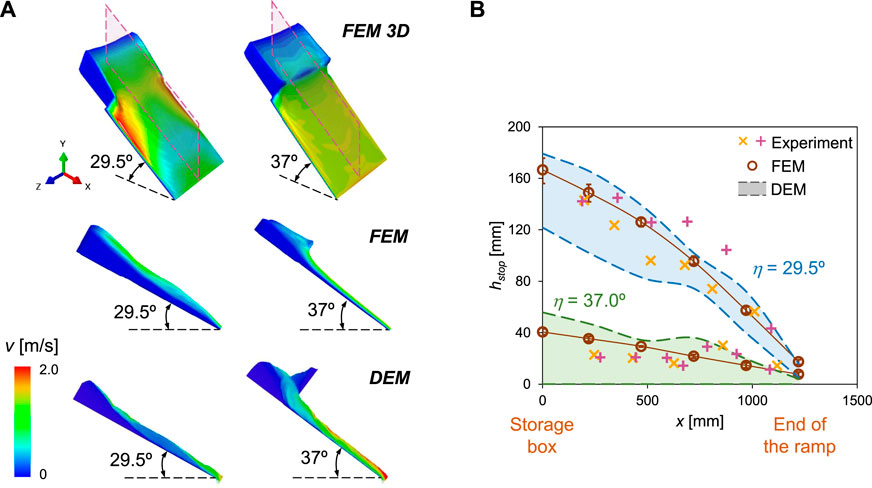
FIGURE 5. (A) Qualitative comparison of the predicted material profile overlapped with velocity distribution at a steady-flow state for two inclination angles. (B) Quantitative comparison of the stopping thickness hstop of the material among the FEM and DEM model predictions and physical measurements.
Constrained by the computational cost, the DEM model for the inclined plane assumed the flow follows plane strain condition. A thin cross-section with a thickness of 15 mm (5 times of the mono-sphere size) in the out-of-plane direction was modeled with a periodic boundary condition for the two surfaces. The rest of the DEM model geometry was kept the same as the experiments. The plane and storage bin walls were explicitly modeled as rigid walls composited by triangular elements. The initial particle packing inside the storage box was created following the same rainfall procedure as described in Section 3.1. Once the storage box was filled up to the target height (i.e., 0.5 m in this study), we stopped the insertion and consolidated the particles until they reached equilibrium. The flow was initiated by raising the right wall of the storage box to a certain height. After the modeled flow stopped, the thickness of the material remained on the ramp was measured by capturing the maximum heights of particles along the ramp.
3.2.2 Results
Figure 5A presents a qualitative comparison of FEM- and DEM-simulated material profiles with the colors denoting the magnitude of flow velocity during a steady-flow state. The “steady-flow state” is defined as the state at which the material height on the ramp stays the same with negligible variance in velocity distribution. The FEM and DEM results generally agree with each other on both the velocity magnitude and the material profile for the inclined angle η = 29.5° and 37°. However, the DEM model cannot capture material flow outside along the ramp side boundaries, as the DEM simulation domain used periodic condition (plane strain assumption) at these boundaries.
Figure 5B quantitatively compares the material stopping thickness hstop along the length of the ramp obtained from physical experiments and numerical simulations, in which “×”s and “+”s stand for two experimental measurements with the same plane inclination angle and gate opening height, “◦”s represent the FEM results, where the error bars mean the prediction variation from different gate opening heights (22–48 cm for 29.5° ramp and 8–19 cm for 37° ramp); the colored bands between dashed lines are the DEM predicted hstop range with the rolling resistance between 0.6 and 1.0 (as discussed in Section 3.1.2). It was found that, at both the inclination angles 29.5° and 37°, the DEM model with the calibrated material parameters can successfully cover the range of experimental measurements using different rolling resistance coefficients. The FEM model results render a smooth material profile and agree with the experimental measurements. Moreover, the small error bars on the FEM data points indicate that the gate opening height, equivalent to the initial flow velocity, has a minor influence on the material stopping thickness, as proved by the experimental observation (note the two experimental measurements of each inclination angle η were measured with the same gate opening, the variation is due to particle packing difference.). Both the quantitative and qualitative comparisons demonstrate the FEM and DEM models with proper material calibration can capture the quasi-static and dense flow regimes.
3.3 Rotating Drum
Angle of Repose (AoR) is an effective macroscopic property that is often used to characterize the mechanical behavior of granular materials. AoR has been widely used as a quantitative measure of granular materials flowability under stress-free condition. For example, AoR is one of the parameters utilized in the design of hoppers and storage bins (Frankowski and Morgeneyer, 2013; Beakawi Al-Hashemi and Baghabra Al-Amoudi, 2018; Hamed et al., 2022). Two types of AoR can be identified, namely, the static and the dynamic one. They differ by a few degrees with the smaller one being the dynamic AoR. The dynamic AoR is defined as the inclination angle of the free surface with respect to the horizontal of the formed material heap, and it is linked to the segregation phenomena of the particulate materials (Beakawi Al-Hashemi and Baghabra Al-Amoudi, 2018). In this work, the dynamic AoR of loblolly pine chips was studied using the rotating drum test. Both DEM and FEM were used to simulate the test. In addition, the dynamic AoR of the as-ground pine chips was physically measured in the laboratory as a benchmark value for the numerical models.
3.3.1 Experimental and Model Setup
A sealed polycarbonate drum is used to measure the dynamic AoR as shown in Figure 6A. The drum is 14.5 cm in internal diameter and 20.2 cm long. The cylinder was loaded up to 50% of its height with the milled loblolly pine (around 303.8 +/− 0.2 g) following the standard testing procedure. We closed the drum with a transparent polycarbonate sheet and placed it on the revolver. The revolver was rotated at a fixed speed of 20 revolutions per minute (rpm) until the free plane surface was formed with a constant slope, see Figure 6A. The inclination angle between the free surface and the horizon is the dynamic AoR and was measured manually from outside of the transparent side of the cylinder using a digital protractor (with readout to 0.1°). Dynamic AoR was measured 10 times using different batches to minimize the measurement error and the sample variability.
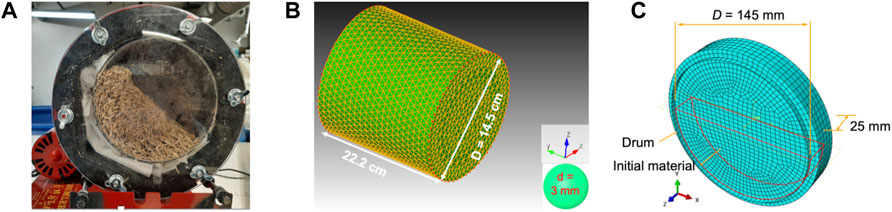
FIGURE 6. Rotating drum test configuration: the experimental set-up (A); the DEM model set-up with the same dimension as the experiment (B); and the geometrical configuration of the FEM model (C).
Different rotational speeds were attempted in the simulations of the rotating drum test using DEM and FEM. Figure 6B shows the full 3D DEM model with the same geometry as the experiments. The calibrated contact model parameters with 3 mm mono-sphere particles reported in the previous section were used for the drum simulation. We start the simulation by filling the stationary drum up to 50% of the drum volume using a random packing algorithm. This is followed by an equilibrium step, where the particles rearrange themselves under the influence of gravity. Afterwards, we rotate the drum with a preset constant rotational speed. Once the steady-state is achieved, we extract the slope of the free surface as the dynamic AoR. We used 1 μs as the step size and simulated 10 s of rotating.
The configuration of the FEM model is presented in Figure 6C, where the cross-section geometry is exactly same as the experiment and a reduced thickness of 25 mm along the axial direction is utilized to save the computational cost. This plane-strain consideration was validated by a full 3D modeling study, in which the predicted dynamic AoR is uniform along the axial direction and equals to the value predicted from the plane-strain case. A symmetrical boundary condition along the thickness direction is applied on the front and the back surfaces of the FEM model, while the contact between the drum and the material is explicitly modeled using the Coulomb friction law. We analyzed the influence of wall friction on the modeling results and we found that a wall friction angle greater than 20° results in a stable dynamic AoR with negligible variation. Therefore, friction angle of 20° is used for all rotating drum simulations. The simulation domain was meshed with element size of 5 mm and a time step of 10–20 μs was used for all simulation cases.
3.3.2 Results
The flow pattern in the rotating drum differs due to differences in rotational speeds, the wall friction angle between the drum surface and the material, and the filling degree (Frankowski and Morgeneyer, 2013; Zheng and Yu, 2015; Beakawi Al-Hashemi and Baghabra Al-Amoudi, 2018). Figure 7 depicts three different particle flow patterns (i.e., rolling, cascading, and centrifuging) observed in the FEM and DEM simulations of the rotating drum at different rotational speeds. The FEM snapshots display a color-coded bulk density, while the DEM snapshots show the particles configuration and the outline of the free surface at a cross-section. The rolling pattern occurs at a low rotational speed of 10 rpm and is characterized by a flat free surface that arises due to the continuous circulation of the particles in the drum. When the drum rotates at an intermediate rotational speed of 50 rpm, particles undergo cascading pattern at which the free surface fails to maintain a flat shape. The exhibited curvature in the free surface and expanded volume of material are associated with the spatial heterogeneity of porosity with denser interior region and higher porosity near the surface. Fast rotational speeds (300 rpm) give rise to the centrifuging regime because the centrifugal force outweighs gravity. In this regime, the particles adhere to the drum and form a ring-like shape.
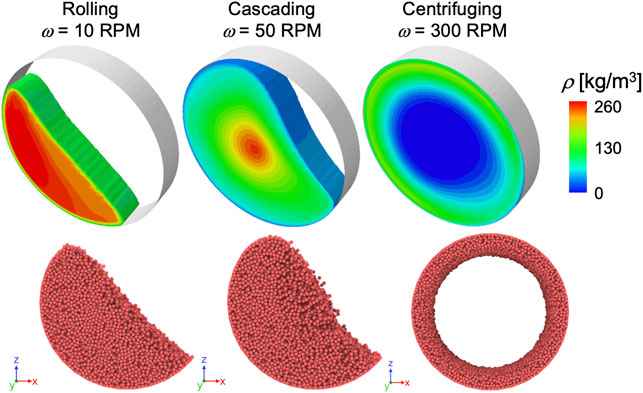
FIGURE 7. Three particle flow patterns observed at different rotational speeds. The top row are snapshots obtained from FEM simulations, while the DEM snapshots are displayed at the bottom row.
The effect of the rotational speed on the dynamic AoR within the rolling regime was investigated. Figure 8 illustrates the change of the dynamic AoR with the increasing rotational speed. The experimentally measured value of AoR at the rotational speed of 20 rpm is overlapped in the same figure. The error bar represents the standard deviation of multiple measurements. The quantitative comparison shows the DEM model predicted value has an excellent agreement with the experimental data while the FEM model slightly over-predicts the dynamic AoR about 1.5° for the rotation speed of 20 rpm. In addition, the two models correctly capture the increase of the dynamic AoR with the increasing rotational speeds, which is consistent with the observations and findings in (Frankowski and Morgeneyer, 2013). We also observe the slight difference in the predicted rate of increase with FEM showing a faster rate. This flow characteristic will be investigated using experiments in a future study.
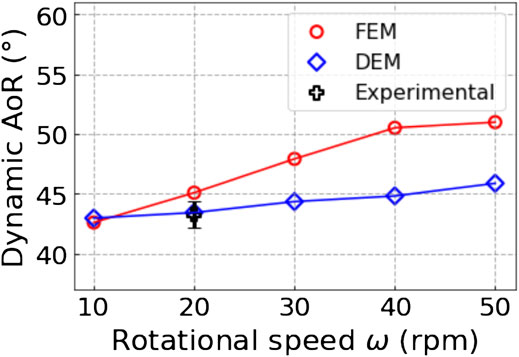
FIGURE 8. Dynamic angle of repose (AoR) versus the rotational speed from the FEM and DEM model predictions and the experimental measurement.
4 Discussion
Generally, continuum-mechanics models are more efficient and effective for modeling bulk granular flow problems at large scales, while the discrete-particle models are more often applied to understand the interactions of particles at smaller scales. The three flow cases presented in this work have demonstrated that both the continuum-mechanics model with a classic constitutive law and the discrete-particle model with a group of sophisticated contact laws can quantitatively simulate the biomass granular flow behavior at different scales. Nevertheless, the two modeling approaches are found to apparently have distinctive advantages and disadvantages given their fundamental differences described in Section 2.
• The constitutive law of the continuum-mechanics FEM model only requires eight material parameters to describe the flow behavior of the milled loblolly pine, whereas the contact laws and mono-sphere particles of the discrete-particle DEM model require 14 parameters. In addition, most of the material parameters of the FEM model (Table 1) have physical meaning and can be directly obtained from the lab characterization data (Lu et al., 2021b). In contrast, the particle-scale contact parameters (Table 2) were all fitted through a single set of cyclic axial compression data (Xia et al., 2019; Chen et al., 2022), though more sets of data can be used. The risk is that, if the objective fitting function has multiple saddle points, the calibration process may result in a local set of optimal values instead of their true global optimal.
• The Coulomb friction between the wall and the granular material is directly realized in the continuum FEM model. The wall friction angle is an independent parameter that can be assigned for any given wall materials and granular materials. In contrast, the particle-based DEM model indirectly captures wall friction by adjusting contact model parameters (e.g., frictional coefficient and rolling friction coefficient in this study). This disadvantage makes the DEM model double the effort in parameterization.
• Limited by the continuum assumption, the FEM model cannot accurately simulate the sharp boundaries between the moving material and the void (i.e., void in this paper). In contrast, the particle-based DEM model can easily handle these boundaries. For example, the FEM model predicts a extremely small mass flow rate for hopper arching shown in Figures 1C,D, while the DEM can predict a complete stop of material flow. Another example is the centrifuging pattern of rotary drum shown in Figure 7. The continuum FEM model represents the void space with an extremely-low density material, while the particle DEM model can physically simulate the centrifuging pattern with the void at the center.
• The initial void ratio/porosity of a granular system plays a significant role in its flow pattern (surge flow v. s. mass flow, see Lu et al. (2021a)). The initial value of the void ratio/porosity can be assigned directly in the continuum FEM model given its constitutive model is formulated in the framework of the critical state particle mechanics (i.e., the state of a granular assembly is determined by the stress tensor and the void ratio, and the assembly can shear/flow infinitely under a critical state without volumetric strain variation). The coarse-grained DEM model describes bulk solids using spheres, which limits its theoretical min-max void ratio/porosity range. To overcome this limit, dilation of DEM particle volume can be used to reduce the initial void volume fraction (Lattanzi and Stickel, 2020), which yet requires additional force equilibrium afterwards. Also, the initial particle packing (i.e., void ratio/porosity) prepared using the rain fall method of the DEM model results in the inter-particle void ratio in a bulk that is often larger than the physical material. Particle shape-resolved DEM model is another way to realistically realize any initial porosity of materials; yet, its computational cost is not affordable for large systems Xia et al. (2021).
In addition to the capability differences in capturing physics between the continuum model and the particle model, the computational cost of the two models is also distinctive. Figure 9 shows the comparison of computational cost between the continuum FEM model and the DEM model for typical cases of the three simulated flow problems. Note we used the CPU core hours—the computational time multiplied by the number of cores, to quantify the computational cost. Figure 9 shows that the DEM model took more core hours for all three cases, which is though expected. However, regarding the computational cost, the degree of advantage of the continuum FEM model over the DEM model varies in each case. For the hopper simulation, the computational cost of the case with semi-inclination angle 30o and outlet opening width 60 mm is presented with modeled physical flow time 11 s for both the FEM model and the DEM model. Because only a single layer of spheres (3 mm) in the out-of-plane direction for hopper were simulated by the particle DEM model, the computational efficiency of DEM is close to the continuum model. However, for the inclined plate simulation with inclination angle 29.5o modeling 18.8 s physical time, the FEM model outperforms the particle model with about 40 times the computational time advantage. This is because the high dimension ratio between a typical size of the experimental set-up and the size of the DEM spheres (3 mm in diameter) requires a huge amount of DEM spheres to represent the material, while the FEM model can mesh the 3D domain using relative coarse meshes and takes advantage of the non-slip boundary condition between the material and inclined plate wall. However, this huge amount of computational cost advantage of the continuum model does not hold for the lab-scale rotary drum. Only two times of computational cost is gained by the continuum model over the particle model for the case with 20 rpm rotation modeling 10 s physical time.
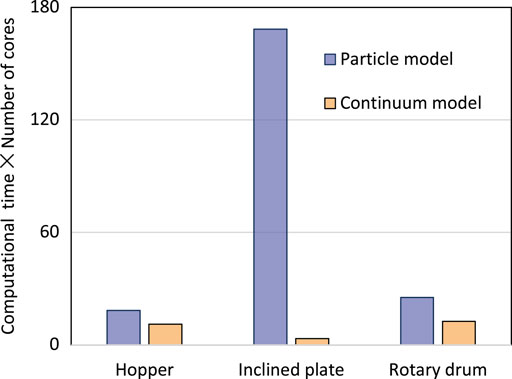
FIGURE 9. Comparison on the computational cost between the continuum FEM model and the particle DEM model for the hopper flow simulation (θ = 30o, W = 60 mm and physical time t = 11s), the inclined plate simulation (η = 29.5o, t = 18.8 s), and the rotary drum simulation (ω = 20 rpm, t = 10 s).
The above comparison of physics capturing and computational cost shows that the FEM model is preferred when the targeted problems are at pilot- or industry-scales and its continuum assumption is satisfied. In contrast, the DEM model is better at simulating lab-scale granular systems with discontinuities. A more sophisticated strategy is to couple the advantages of the continuum and particle models and simulate the granular flow problems using the multi-scale concurrent framework (Liang and Zhao, 2019). Take the hopper as an example, the bulk hopper material, as well as the interaction between the material and hopper wall, can be modeled using the efficient continuum FEM model. While the domain in the vicinity of the hopper outlet, including the particle flow into the downstream feeder/reactor, can be better handled by the particle DEM model. Nevertheless, a coupled FEM-DEM modeling approach will require significant further development and validation, before it can be reliably introduced for engineering applications that involve complex geometries.
5 Conclusion
This study reports the detailed comparison of a continuum-mechanics model and a coarse-grained discrete-particle model on the predictive fidelity and computational cost for simulating biomass granular flow. After briefly introducing the two models, we benchmarked their predictions against physical measurements for a lab-scale rotating drum flow test, a pilot-scale hopper flow test, and a full-scale inclined plate flow test. The predicted bulk flow behavior from the two models, i.e., the dynamic angle of repose of the rotary drum, the mass flow rate and the critical outlet width of hopper, and the stopping thickness of the inclined plate flow, all matched well with the experimental measurements. However,their fundamental differences in theories and solution algorithms resulted in distinctive apparent advantages and disadvantages of capturing granular flow physics. The continuum-mechanics model has the apparent advantages of parameterization in material and wall friction, direct initial state assignment, and computational efficiency for large-scale flow systems. In contrast, the discrete-particle model is more robust for handling discontinuous flow problems and decipher particle interaction during flow for smaller-scale systems. This comparative study has provided insights that industry stakeholders may find helpful when choosing suitable and experiment-informed/validated numerical models and packages as advanced design tools to assist the design and optimization of biomass granular flow systems.
Data Availability Statement
The original contributions presented in the study are included in the article, further inquiries can be directed to the corresponding authors.
Author Contributions
WJ conceptualized the article, drafted the introduction, methods and discussion sections, supervised the FEM modeling and edited full manuscript. YL performed all FEM analysis and drafted the inclined plate section; FC performed DEM analysis of the hopper and the inclined plate and drafted the hopper section; AH performed DEM modeling of the rotary drum and drafted the rotary drum section; NS and JK performed all the experimental characterization and edited full manuscript; YX supervised the DEM modeling and edited full manuscript. SD and QC edited full manuscript.
Funding
The research is fully supported by the U.S. Department of Energy (DOE), Office of Energy Efficiency and Renewable Energy (EERE), Bioenergy Technologies Office (BETO), the Feedstock-Conversion Interface Consortium (FCIC), under DOE Idaho Operations Office with Contract No. DE-AC07-05ID14517.
Conflict of Interest
The authors declare that the research was conducted in the absence of any commercial or financial relationships that could be construed as a potential conflict of interest.
Publisher’s Note
All claims expressed in this article are solely those of the authors and do not necessarily represent those of their affiliated organizations, or those of the publisher, the editors and the reviewers. Any product that may be evaluated in this article, or claim that may be made by its manufacturer, is not guaranteed or endorsed by the publisher.
Acknowledgments
This research made use of Idaho National Laboratory computing resources which are supported by the Office of Nuclear Energy of the U.S. Department of Energy and the Nuclear Science User Facilities under Contract No. DE-AC07-05ID14517.
References
Bauer, E. (1996). Calibration of a Comprehensive Hypoplastic Model for Granular Materials. Soils Found. 36, 13–26. doi:10.3208/sandf.36.13
Beakawi Al-Hashemi, H. M., and Baghabra Al-Amoudi, O. S. (2018). A Review on the Angle of Repose of Granular Materials. Powder Technol. 330, 397–417. doi:10.1016/j.powtec.2018.02.003
Chen, F. (2022). Discrete Element Modeling of the Shape- and History-dependent Behavior of Granular Materials. Ph.D. thesis (Clemson, SC, USA: Clemson University).
Chen, F., Xia, Y., Klinger, J. L., and Chen, Q. (2022). A Set of Hysteretic Nonlinear Contact Models for DEM: Theory, Formulation, and Application for Lignocellulosic Biomass. Powder Technol. 399, 117100. doi:10.1016/j.powtec.2021.117100
Cheng, Z., Leal, J. H., Hartford, C. E., Carson, J. W., Donohoe, B. S., Craig, D. A., et al. (2021). Flow Behavior Characterization of Biomass Feedstocks. Powder Technol. 387, 156–180. doi:10.1016/j.powtec.2021.04.004
Chung, Y. (2006). Discrete Element Modelling and Experimental Validation of a Granular Solid Subject to Different Loading Conditions. Ph.D. thesis (Edinburgh, Scotland: University of Edinburgh).
Cundall, P. A., and Strack, O. D. L. (1979). A Discrete Numerical Model for Granular Assemblies. Géotechnique 29, 47–65. doi:10.1680/geot.1979.29.1.47
Dale, B. (2017). A Sober View of the Difficulties in Scaling Cellulosic Biofuels. Biofuels, Bioprod. Bioref. 11, 5–7. doi:10.1002/bbb.1745
DOE-BETO (2016). “Biorefinery Optimization Workshop Summary Report,” in Tech. Rep. (Chicago, IL, United States: Bioenergy Technologies Office, Office of Energy Efficiency and Renewable Energy, U.S. Department of Energy).
Forterre, Y., and Pouliquen, O. (2008). Flows of Dense Granular Media. Annu. Rev. Fluid Mech. 40, 1–24. doi:10.1146/annurev.fluid.40.111406.102142
Frankowski, P., and Morgeneyer, M. (2013). Calibration and Validation of Dem Rolling and Sliding Friction Coefficients in Angle of Repose and Shear Measurements. AIP Conf. Proc. 1542, 851–854. doi:10.1063/1.4812065
Gudehus, G. (1996). A Comprehensive Constitutive Equation for Granular Materials. Soils Found. 36, 1–12. doi:10.3208/sandf.36.1
Guo, Y., Chen, Q., Xia, Y., Klinger, J., and Thompson, V. (2021). A Nonlinear Elasto-Plastic Bond Model for the Discrete Element Modeling of Woody Biomass Particles. Powder Technol. 385, 557–571. doi:10.1016/j.powtec.2021.03.008
Guo, Y., Chen, Q., Xia, Y., Westover, T., Eksioglu, S., and Roni, M. (2020). Discrete Element Modeling of Switchgrass Particles under Compression and Rotational Shear. Biomass Bioenergy 141, 105649. doi:10.1016/j.biombioe.2020.105649
Hamed, A., Xia, Y., Saha, N., Klinger, J., Lanning, D. N., and Dooley, J. (2022). Flowability of Crumbler Rotary Shear Size-Reduced Granular Biomass: An Experiment-Informed Modeling Study on the Angle of Repose. Front. Energy Res. 10, 859248. doi:10.3389/fenrg.2022.859248
Härtl, J., and Ooi, J. Y. (2008). Experiments and Simulations of Direct Shear Tests: Porosity, Contact Friction and Bulk Friction. Granul. Matter 10, 263–271. doi:10.1007/s10035-008-0085-3
Herle, I., and Gudehus, G. (1999). Determination of Parameters of a Hypoplastic Constitutive Model from Properties of Grain Assemblies. Mech. Cohes.-Frict. Mat. 4, 461–486. doi:10.1002/(SICI)1099-1484(199909)4:5<461::AID-CFM71>3.0.CO;2-P
Hernandez, S., Westover, T. L., Matthews, A. C., Ryan, J. C. B., and Williams, C. L. (2017). Feeding Properties and Behavior of Hammer- and Knife-Milled Pine. Powder Technol. 320, 191–201. doi:10.1016/j.powtec.2017.07.002
Hess, J. R., Wright, C. T., and Kenney, K. L. (2007). Cellulosic Biomass Feedstocks and Logistics for Ethanol Production. Biofuels, Bioprod. Bioref. 1, 181–190. doi:10.1002/bbb.26
Horabik, J., and Molenda, M. (2014). Mechanical Properties of Granular Materials and Their Impact on Load Distribution in Silo: a Review. Sci. Agric. Bohem. 45, 203–211. doi:10.1515/sab-2015-0001
Ilic, D., Williams, K., Farnish, R., Webb, E., and Liu, G. (2018). On the Challenges Facing the Handling of Solid Biomass Feedstocks. Biofuels, Bioprod. Bioref. 12, 187–202. doi:10.1002/bbb.1851
Jin, W., Klinger, J. L., Westover, T. L., and Huang, H. (2020a). A Density Dependent Drucker-Prager/cap Model for Ring Shear Simulation of Ground Loblolly Pine. Powder Technol. 368, 45–58. doi:10.1016/j.powtec.2020.04.038
Jin, W., Stickel, J. J., Xia, Y., and Klinger, J. (2020b). A Review of Computational Models for the Flow of Milled Biomass Part Ii: Continuum-Mechanics Models. ACS Sustain. Chem. Eng. 8, 6157–6172. doi:10.1021/acssuschemeng.0c00412
Jop, P., Forterre, Y., and Pouliquen, O. (2006). A Constitutive Law for Dense Granular Flows. Nature 441, 727–730. doi:10.1038/nature04801
Jop, P., Forterre, Y., and Pouliquen, O. (2005). Crucial Role of Sidewalls in Granular Surface Flows: Consequences for the Rheology. J. Fluid Mech. 541, 167–192. doi:10.1017/S0022112005005987
Kruggel-Emden, H., Wirtz, S., and Scherer, V. (2008). A Study on Tangential Force Laws Applicable to the Discrete Element Method (Dem) for Materials with Viscoelastic or Plastic Behavior. Chem. Eng. Sci. 63, 1523–1541. doi:10.1016/j.ces.2007.11.025
Lattanzi, A. M., and Stickel, J. J. (2020). Hopper Flows of Mixtures of Spherical and Rod‐like Particles via the Multisphere Method. AIChE J. 66, e16882. doi:10.1002/aic.16882
Liang, W., and Zhao, J. (2019). Multiscale Modeling of Large Deformation in Geomechanics. Int. J. Numer. Anal. Methods Geomech. 43, 1080–1114. doi:10.1002/nag.2921
Liao, D., and Yang, Z. (2021). Non‐coaxial Hypoplastic Model for Sand with Evolving Fabric Anisotropy Including Non‐proportional Loading. Int. J. Numer. Anal. Methods Geomechanics 45, 2433–2463. doi:10.1002/nag.3272
Lu, Y., Jin, W., Klinger, J., and Dai, S. (2021a). Flow and Arching of Biomass Particles in Wedge-Shaped Hoppers. ACS Sustain. Chem. Eng. 9, 15303–15314. doi:10.1021/acssuschemeng.1c05628
Lu, Y., Jin, W., Klinger, J., Westover, T. L., and Dai, S. (2021b). Flow Characterization of Compressible Biomass Particles Using Multiscale Experiments and a Hypoplastic Model. Powder Technol. 383, 396–409. doi:10.1016/j.powtec.2021.01.027
Mašín, D. (2005). A Hypoplastic Constitutive Model for Clays. Int. J. Numer. Anal. Meth. Geomech. 29, 311–336. doi:10.1002/nag.416
Mindlin, R. D., and Deresiewicz, H. (1953). Elastic Spheres in Contact under Varying Oblique Forces. J. Appl. Mech. 20, 327–344. doi:10.1115/1.4010702
Pouliquen, O., and Forterre, Y. (2002). Friction Law for Dense Granular Flows: Application to the Motion of a Mass Down a Rough Inclined Plane. J. Fluid Mech. 453, 133–151. doi:10.1017/S0022112001006796
Pouliquen, O. (1999). Scaling Laws in Granular Flows Down Rough Inclined Planes. Phys. fluids 11, 542–548. doi:10.1063/1.869928
Ramírez-Gómez, Á. (2016). Research Needs on Biomass Characterization to Prevent Handling Problems and Hazards in Industry. Part. Sci. Technol. 34, 432–441. doi:10.1080/02726351.2016.1138262
Salehi, H., Poletto, M., Barletta, D., and Larsson, S. H. (2019). Predicting the Silo Discharge Behavior of Wood Chips - A Choice of Method. Biomass bioenergy 120, 211–218. doi:10.1016/j.biombioe.2018.11.023
Stasiak, M., Molenda, M., Bańda, M., Wiącek, J., Parafiniuk, P., Lisowski, A., et al. (2019). Mechanical Characteristics of Pine Biomass of Different Sizes and Shapes. Eur. J. Wood Prod. 77, 593–608. doi:10.1007/s00107-019-01415-w
Subramaniyan, A. K., and Sun, C. T. (2008). Continuum Interpretation of Virial Stress in Molecular Simulations. Int. J. Solids Struct. 45, 4340–4346. doi:10.1016/j.ijsolstr.2008.03.016
Wójcik, M., and Tejchman, J. (2009). Modeling of Shear Localization during Confined Granular Flow in Silos within Non-local Hypoplasticity. Powder Technol. 192, 298–310. doi:10.1016/j.powtec.2009.01.021
Xia, Y., Chen, F., Klinger, J. L., Kane, J. J., Bhattacharjee, T., Seifert, R., et al. (2021). Assessment of a Tomography-Informed Polyhedral Discrete Element Modelling Approach for Complex-Shaped Granular Woody Biomass in Stress Consolidation. Biosyst. Eng. 205, 187–211. doi:10.1016/j.biosystemseng.2021.03.007
Xia, Y., Lai, Z., Westover, T., Klinger, J., Huang, H., and Chen, Q. (2019). Discrete Element Modeling of Deformable Pinewood Chips in Cyclic Loading Test. Powder Technol. 345, 1–14. doi:10.1016/j.powtec.2018.12.072
Xia, Y., Stickel, J. J., Jin, W., and Klinger, J. (2020). A Review of Computational Models for the Flow of Milled Biomass Part I: Discrete-Particle Models. ACS Sustain. Chem. Eng. 8, 6142–6156. doi:10.1021/acssuschemeng.0c00402
Yi, H., Puri, V. M., Lanning, C. J., and Dooley, J. H. (2020a). “Determination of Fundamental Mechanical Properties of Biomass Using the Cubical Triaxial Tester to Model Biomass Flow,” in 2020 ASABE Annual International Virtual Meeting (St. Joseph, Michigan, USA: American Society of Agricultural and Biological Engineers), 1. doi:10.13031/aim.202000058
Yi, H., Puri, V. M., Lanning, C. J., and Dooley, J. H. (2020b). “Finite Element Modeling of Biomass Hopper Flow,” in 2020 ASABE Annual International Virtual Meeting (St. Joseph, Michigan, USA: American Society of Agricultural and Biological Engineers), 1. doi:10.13031/aim.202000059
Zheng, Q. J., and Yu, A. B. (2015). Modelling the Granular Flow in a Rotating Drum by the Eulerian Finite Element Method. Powder Technol. 286, 361–370. doi:10.1016/j.powtec.2015.08.025
Keywords: granular materials, discrete-element, finite-element, lignocellulose biomass, hopper flow, flow regime
Citation: Jin W, Lu Y, Chen F, Hamed A, Saha N, Klinger J, Dai S, Chen Q and Xia Y (2022) On the Fidelity of Computational Models for the Flow of Milled Loblolly Pine: A Benchmark Study on Continuum-Mechanics Models and Discrete-Particle Models. Front. Energy Res. 10:855848. doi: 10.3389/fenrg.2022.855848
Received: 16 January 2022; Accepted: 30 May 2022;
Published: 28 June 2022.
Edited by:
Timothy G. Rials, The University of Tennessee, United StatesReviewed by:
Xizhong Chen, The University of Sheffield, United KingdomJean-Michel Pereira, École des ponts ParisTech (ENPC), France
Copyright © 2022 Jin, Lu, Chen, Hamed, Saha, Klinger, Dai, Chen and Xia. This is an open-access article distributed under the terms of the Creative Commons Attribution License (CC BY). The use, distribution or reproduction in other forums is permitted, provided the original author(s) and the copyright owner(s) are credited and that the original publication in this journal is cited, in accordance with accepted academic practice. No use, distribution or reproduction is permitted which does not comply with these terms.
*Correspondence: Wencheng Jin, wencheng.jin@inl.gov Yidong Xia, yidong.xia@inl.gov