Blue Energy Spearheading the Energy Transition: The Case of Crete
 Hrvoje Stančin1*
  Antun Pfeifer1 Christoforos Perakis2
  Nikolaos Stefanatos2
  Marko Damasiotis2 Stefano Magaudda3
  Federica Di Pietrantonio3
  Hrvoje Mikulčić1,4*
- 1Faculty of Mechanical Engineering and Naval Architecture, University of Zagreb, Zagreb, Croatia
- 2Centre for Renewable Energy Sources and Saving, Pikermi, Greece
- 3U-SPACE ESPAÑA, Sevilla, Spain
- 4Department of Thermal Engineering, Xi’an Jiaotong University, Xi’an, China
Decarbonization of remote or isolated island communities represents a significant challenge nowadays. Nevertheless, the environmental, economic, and social benefits seek more attention. Lately, blue energy sources, particularly offshore wind power, are gaining momentum to take the lead in the energy transition process, simultaneously offering numerous benefits for local communities and potential investors. In this research, offshore wind power is considered the main driver of the energy transition for the case of the island of Crete. The energy systems’ development scenarios are developed using an energy planning model EnergyPLAN, starting from a reference model developed for the year 2017. Since the island was recently isolated without connections to the mainland grid, integrating renewable energy sources was a challenging task that led to poor energy potential exploitation. The decarbonization of the power generation sector by offshore and onshore wind and photovoltaics can only partially reduce the import dependence on fossil fuels. At the same time, more significant efforts are expected in the transport and industry sectors. With the operational interconnections, 300 MW of offshore wind capacities can be deployed, averaging annual electricity production of 1.17 TWh, satisfying around 70% of total electricity demand.
Introduction
Energy transition of island communities is in particular focus of energy planning activities. This is important from an environmental point of view, but it is also interesting since the island energy systems are often isolated or not sufficiently connected to the mainland. Furthermore, seasonal variation in electricity demand due to high touristic activity makes this planning process even more complicated and requires energy storage installation or leads to oversizing of renewable energy source (RES) capacities (Marczinkowski and Barros, 2020). Overestimation of installed capacities coupled with insufficient infrastructure to utilize electricity production often results in critical excess electricity production (CEEP) and significant curtailments that are not beneficial from an energy and an economic point of view (Lund et al., 2017). Therefore, when it comes to planning smart energy systems based on renewables, it is inevitable to include either cross-border or cross-sector interconnectivity (Thellufsen and Lund, 2017). Cross-border interconnectivity might be more practical for isolated island energy systems since it is easier and cheaper to connect the island to the mainland by underwater cables than carrying out in-depth decarbonization that requires intra-sectoral interactions at the local or regional level (Bačeković and Østergaard, 2018). Moreover, in the case of isolated energy systems, higher penetration of RESs involves installing some form of energy storage which increases the overall costs of transition. Groppi et al. (2021) carried out a detailed review of potential storage options for smart energy islands, emphasizing the importance of power-to-transport solutions.
Various energy transition strategies and analyses have been performed for island communities, from small communities like Gozo Region, Malta (Diane et al., 2019), to the whole archipelago like Kvarner, Croatia (Mimica et al., 2020). The analyses most often focus on integrating renewables into the energy system by examining the maximum potential that could be installed by observing the demand–production relations, while the technical and operational characteristics of distribution systems are not often investigated (Cabrera et al., 2018). In addition, particular focus is usually given to the decarbonization of the heating and cooling sectors due to the specifics related to island communities (Santamarta et al., 2021). These specifics arise from the significant seasonality of electricity demand, which significantly correlates with touristic activities. Finally, it is necessary to include other sectors into the analysis to close the sustainability loop. Kiviranta et al. (2020) and Calise et al. (2021) presented the methodology for energy planning of islands by moving the system boundaries from the power generation sector to industry and transport. Their work showed that the inevitable step is to electrify residential heating systems, industrial processes, and transportation, simultaneously introducing alternative fuels where electrification is not viable. Pfeifer et al. (2021) used the EnergyPLAN model to simulate the energy system’s performance by analyzing different demand-response technologies. This work showed that significant savings could be achieved when demand-response technologies like vehicle-to-grid (V2G) are used, and the level of CEEP can be maintained in the acceptable range. Segurado et al. (2011) investigated the relation between renewables’ penetration and desalinization plant as a storage solution for the case of Cape Verde. The analysis showed that approximately 30% of renewables could be incorporated into the grid, simultaneously providing 50% of water demand. Bačelić Medić et al. (2013) investigated the decarbonization potential of remote communities that are intensely dependable on fossil fuels and electricity imports. The analysis showed that an optimal mix of different technologies is required to avoid excess costs and reduce the environmental impact which might arise when one technology is preferred. The choice of technology to replace conventional, fossil-fuel–based energy sources requires the trade-off between environmental benefits and installation costs (Curto et al., 2020). In general, the energy transition of island communities has been widely investigated up to now (Krajačić et al., 2009; Rodrigues et al., 2014; Schallenberg -Rodriguez, 2014; Pfeifer et al., 2018) by using different approaches, methods, and decarbonization strategies. The common thing for all of them is that some form of energy storage or demand-response technology is used to maximize the penetration of variable RESs. Another common thing for the vast majority of the work is that only the potential of on-land renewable energy sources is investigated, while the energy of seas and oceans is often neglected. Lately, blue energy (BE) sources have arisen as the prominent technology to enhance the sustainability of the island energy systems. The most prominent technology seems to be offshore wind (Ashley et al., 2014). Offshore wind farms have significantly higher load factors than the rest of the considered renewables like wave energy or sea currents. Even more, they are only suitable options for the Mediterranean context at the moment (Soukissian et al., 2017). Nevertheless, when selecting a site for deployment of offshore wind farms, besides the energy potential, it is necessary to consider navigation routes, fishery, and visual impact (Stelzenmüller et al., 2021). Finally, the integration of variable renewable sources requires the smart operation of the energy system to maintain grid stability (Lund et al., 2021). The simulations and analysis on an hourly basis in the simulation models like EnergyPLAN (2022) or Dispaset (2022) can provide a valuable insight into system performance and viability to install RESs.
This work investigates the blue energy potential and its role in the energy transition for the case of Crete, Greece. Literature review showed a lack of similar analyses, where offshore wind is used as a primary driver for power production sector decarbonization. In addition, up to now, there is no clear pathway or strategy for the decarbonization of Crete Island. At the same time, a vast potential of renewables, especially offshore wind and photovoltaic (PV), remains unused. Therefore, this work aims to investigate the potential production from offshore wind farms that can be deployed near the island’s coast and its influence on energy sector decarbonization. The simulations are carried out using the EnergyPLAN model, which was also used in similar studies. Additionally, simplified economic analysis is carried out to compare the cost of developed scenarios and evaluate their probability to be realized.
Methodology
Simulation of the energy system was performed using the planning model EnergyPLAN, as already mentioned above. The software can carry out simulations on an hourly basis with various possibilities for input data. The model allows system analysis at a local, regional, or national level with an additional option to include all sectors or just the one of particular interest. The methodology applied in this work was already used to analyze similar systems in the previous works mentioned in the Introduction. The illustration of the applied methodological approach is presented in Figure 1. The first step is data acquisition, which consists of collecting the actual values and energy balances for the latest available period. Also, it includes a detailed analysis of the energy transition plan and strategies for the considered area. Based on data quality and accuracy, it is necessary to build a Reference scenario that should be validated with the actual values. In this work, the transport sector was left out from the analysis due to a lack of reliable data. Moreover, there are no data regarding the total primary energy supply (TPES) and carbon dioxide (CO2) emissions which constrain the complete validation of the proposed Reference scenario. The energy transition plans and strategies are further used to develop future scenarios that include renewable energy sources and energy efficiency measures. Since the scope of this work was to investigate the potential of blue energy (BE) sources, an additional step was required. This is predominately related to selecting the appropriate technologies that have significant potential for the considered area. Once technologies are chosen, it is necessary to find suitable locations for their deployments. This is the most challenging step since it is necessary to consider other economic activities and avoid their interference. Selected areas resulted from an offshore wind energy potential analysis conducted in a GIS environment, based on open access geographical data on the environmental conditions and constraints relevant to the installation of offshore wind farms. Data processing within the GIS regarded a distance from the coast between 5 and 80 km and allowed for the following:
• The detection of the marine areas featuring the minimum environmental conditions required for the operation of floating offshore wind turbines, i.e., bathymetry between −400 m and −50 m and wind speed above 4 m/s at the sea level.
• The exclusion from these areas of sensitive environments (such as Natura2000 sites, GEA/GEN/GEETHA areas, and Posidonia meadows) and areas affected by navigation (such as shipping routes), which could interfere with offshore wind farms. Buffer zones were also proposed to minimize such interferences: a buffer of 2 km around environmentally sensitive areas and 5 km around the main navigation routes and the maneuvering areas of ports.

FIGURE 1. Illustration of the applied methodology.
This resulted in the identification of marine areas eligible for installing floating offshore wind turbines. Such results were further refined, selecting only sites with wind speed ≥ 7 m/s at 100 m above the sea level, thus identifying the areas with the highest potential. Since the highest potential lies on the island’s east side, this location is considered in this work (Figure 2). The maximum capacity that can be installed is obtained by considering dimensional requirements, cost of installation, and social factors such as the impact on tourism and visual effect. A full investigation of potential environmental impacts (especially on birds) was not carried out at this stage and will require additional data collection and processing.
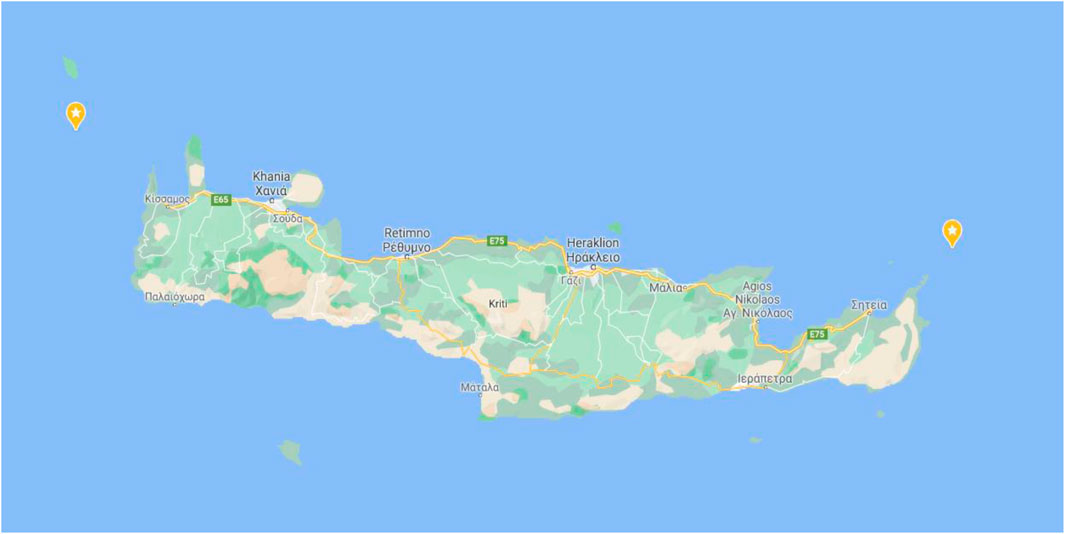
FIGURE 2. Potential locations for offshore wind farms.
Finally, the last step consists of gathering the hourly distribution curves for electricity demand, wind power potential, solar irradiation, and similar parameters depending on the input data. The hourly distribution curves for onshore wind and PV are obtained from the software Meteonorm (2022), while the values for electricity demand are obtained from the grid operator. The curve for offshore wind is obtained from Global Wind Atlas (2021), and the power potential is calculated using The PRISMI Wind Power Calculator Tool (PRISMI PLUS, 2021).
Case Study Analysis
Input Value for Energy Production and Consumption
In Table 1, the input values for installed energy production units at the island can be seen. The dominant electricity sources are thermal power plants that use fuel oil as an energy source. They account for approximately 2.48 TWh or 75% of electricity production. Moreover, there is notable production from onshore wind farms (0.505 TWh), while the PV potential remains mostly unused with a total installed capacity of only 96 MW and annual production of 0.162 TWh.
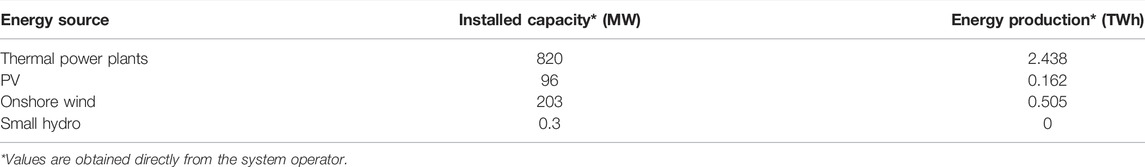
TABLE 1. Installed capacities for power production facilities in 2019.
Table 2 presents the input values used when building a Reference scenario, which corresponds to current fuel consumption by an energy source. The data are directly obtained from Hellenic Electricity Distribution Network Operator. Electric heating and cooling are subtracted in the simulation due to seasonality, but the total electricity demand in 2017 was 3.219 TWh. Figure 3 presents the annual electricity demand on an hourly basis in 2017 for the Crete case. As can be seen, the load is constant throughout the year, with several peaks in the summer and winter periods. The primary energy source is diesel in the residential sector, followed by renewable biomass and solar thermal primarily used for heating purposes. Various fossil fuels represent half of the consumption in the industry, while the other half is covered by biomass.

TABLE 2. Annual energy consumption by the type of fuel.
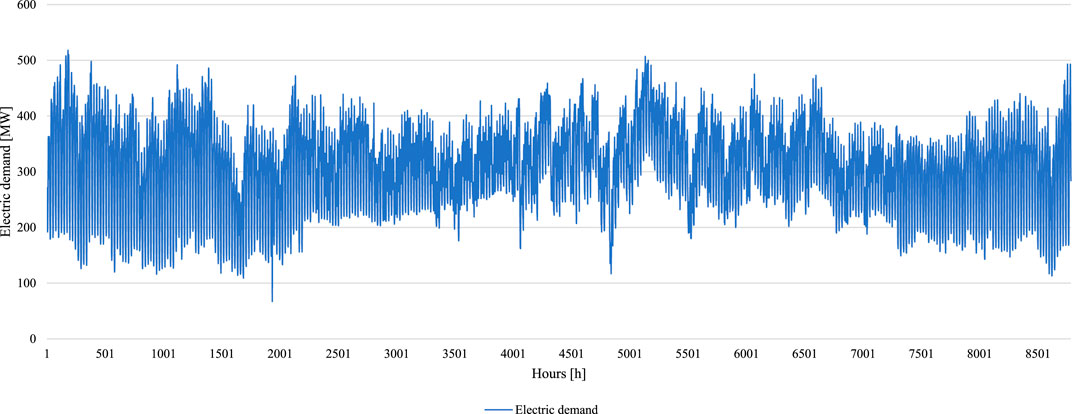
FIGURE 3. Annual electric demand on an hourly basis.
Modeling Future Scenarios
The precise, latest available data for 2017 and 2019 were used in the industry and power production sector. Nevertheless, when building future scenarios, fuel consumption for residential and industrial purposes did not change since the focus was on integrating renewable energy sources, especially offshore wind, when the island is connected to the mainland with interconnection cables. Therefore, there are four considered scenarios in this work. The first is the reference case where the island is an isolated system with thermal power plants, onshore wind, and photovoltaics. The second scenario considers the installation of a maximum of 300 MW of offshore wind on the east side of the island (Figure 1) and operating one interconnection cable of 400 MW capacity. In the third scenario, power plants are shut down, and the interconnection capacity is increased to 1400 MW. The last scenario considers the additional deployment of 480 MW of PV and onshore wind to reach the maximum capacity for the RES with a total interconnection capacity of 1400 MW. Interconnection capacities are obtained from the system and grid operator. According to the Greek national energy strategy, the shares of additional RES capacities are equally divided between PV and onshore wind (Hellenic Republic, 2019).
When building future scenarios, the following assumptions were used:
• The maximum offshore wind capacity is 300 MW.
• Interconnections will be fully operational by 2023.
• Power generation from thermal power plants is first reduced, and then they are entirely phased out.
• The additional renewable energy capacity that can be installed with fully operational interconnection is 480 MW.
An interconnection cable of 400 MW has been operational since the beginning of 2022, while an additional cable with 1000 MW will be deployed by the end of 2023. Thermal power plants, currently the backbone of the isolated energy system, will be shut down once interconnections are fully operational and the maximum capacity of renewable energy sources is installed. Interconnection of 1400 MW capacity allows for deployment of 300 MW offshore wind and an additional 480 MW of other RESs, which are equally divided on PV and onshore wind, following the guidelines from the national strategy (Hellenic Republic, 2019).
The future scenarios are named in the following manner: Reference (REF), Transition (TR), Blue Energy (BE), and Renewable (RE). Except for the Reference scenario, all others are investigating the potential of renewable sources in the context of interconnection with the mainland. Table 3 presents the considered parameters for each investigated scenario.
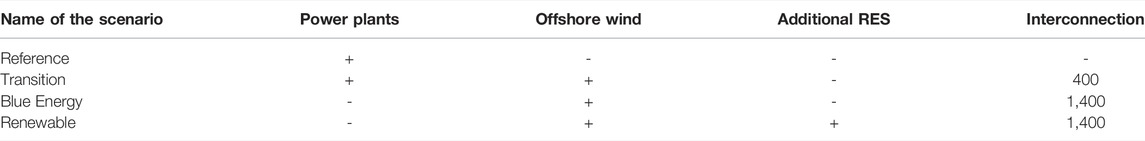
TABLE 3. Parameters investigated in considered scenarios.
Results
First, the Reference scenario was validated by comparing the results from the EnergyPLAN model with actual values available. In the first place, this implies the production from thermal power plants, onshore wind, and PV. Obtained values for onshore wind and PV are almost identical to actual values when iterative correction factors are applied further in all scenarios. The application of correction factors is inevitable since there is no option to determine the operating conditions of installed technologies. Currently, thermal power plants are the primary electricity source with an installed capacity of 820 MW. On an annual basis, this accounts for 2.44 TWh of produced electricity, while simulation gives a result of 2.55 TWh which can be considered the correct value since the difference is less than 5%. Renewable capacities are 96 MW for PV and 203 MW for onshore wind. Their annual electricity production is 0.16 TWh for PV and 0.505 TWh for onshore wind. These data are summarized in Table 1.
Figure 4 presents the hourly production from all deployed electricity sources on the island in the case of the Reference scenario. Load factors of deployed RESs are an essential parameter to evaluate their applicability for the considered area. In the case of PV, the annual load factor is approximately 19%, with the highest output in June and July. The load factor is 29% for the onshore wind, with maximum production during the winter months, December and January. Validation of the Reference scenario regarding the CO2 emissions and total primary energy supply (TPES) is impossible since there are no reference values for comparison, and the transport sector is not considered. Therefore, only the energy production sector is validated for its production, and the values correspond. Regarding the residential and industrial sectors, accurate available fuel consumption data (Table 2) are used and can be considered reliable.
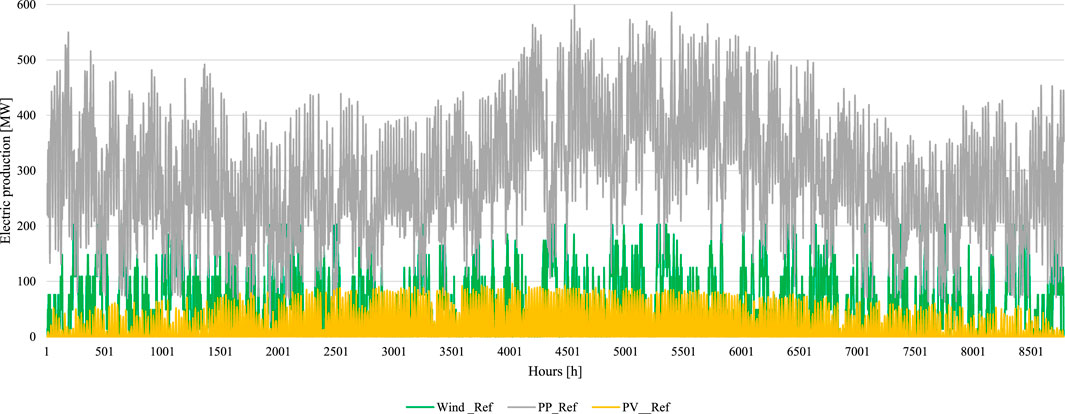
FIGURE 4. Hourly electric production in a Reference scenario.
Comparison of Scenarios With Operational Thermal Power Plants
In this subsection, Reference and Transition scenarios are compared more in-depth since they have operational thermal power plants included in the model. Moreover, this comparison shows the impact of offshore wind farms on energy system stability while there is no full connection to the mainland. There is no visible difference between the Reference and Transition scenarios in the case of PV and onshore wind electricity production. The power output remains the same in both cases, which is expected since the system is modeled to maximize renewables’ production. Nevertheless, the introduction of offshore wind farms had a notable effect on power output from thermal power plants. The capacity of 300 MW ensures the annual production of 1.17 TWh of electricity from offshore wind, with an average load factor of 42%, and the highest production in August, even though winter months, in general, express better energy potential. Deployment of offshore wind directly reflects in power output from thermal power plants, which is reduced from 2.55 to 1.51 TWh. Moreover, offshore wind turbines and connection to the mainland with underwater cables allows some electricity export when production is higher than electricity demand. Figure 5 presents the electricity production from offshore and onshore wind in a one-year period. It is evident that offshore wind has a significantly higher energy potential, resulting in higher load factors and electricity output. The production from the offshore wind farm is more than doubled compared to the onshore, even though the difference in considered capacity is less than 100 MW.
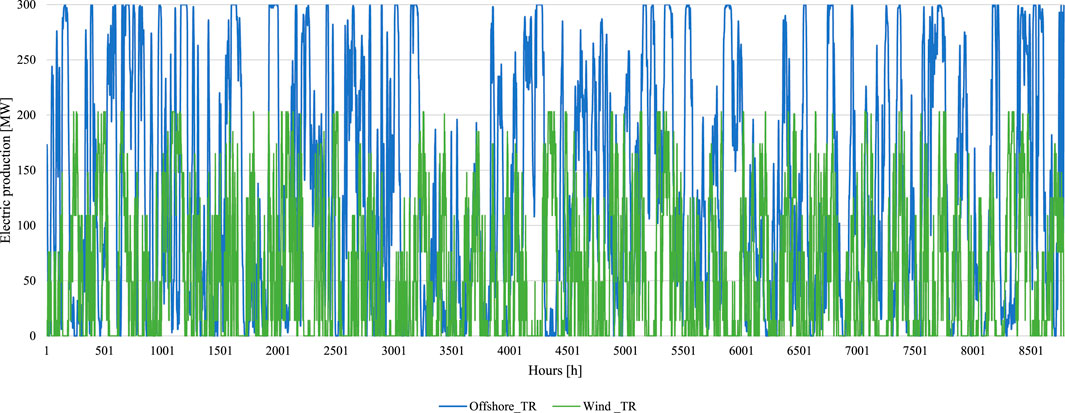
FIGURE 5. Comparison of electricity production from offshore and onshore wind for a one-year period.
Figure 6 presents the monthly production from considered energy sources for these two scenarios. The figure shows that the introduction of offshore wind farms directly reduces output from thermal power plants, while the share of renewables is increasing.
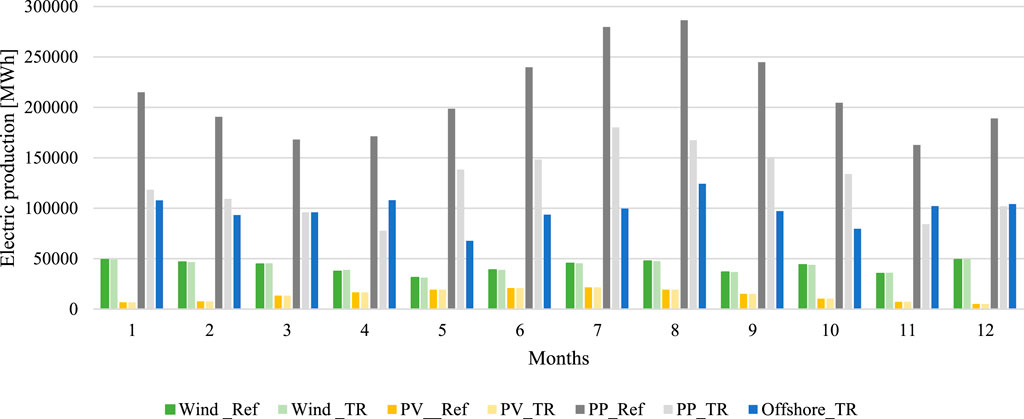
FIGURE 6. Monthly production from electricity sources in Reference and Transition scenarios.
The analysis of results on an hourly basis gives a good insight into system components’ interaction and reveals the potential spots where grid stability could be disturbed. With the operational thermal power plants, the supply side is stable since the production is following the demand side. The RESs are currently used to satisfy the peak demand, and the total share in the electricity mix is around 26%. The inclusion of offshore wind farms reduces the power output from thermal power plants, but even more, it opens the possibility for electricity export via the interconnection cable of 400 MW capacity. Figure 7 presents the influence of offshore wind on electricity export. The figure shows that electricity export occurs only when the offshore wind farm is at its peak production. The export is around 130 GWh annually in the Transition scenario, which might be utilized on the island by introducing electric vehicles (EVs) or heat pumps for heating. Nevertheless, this would require cross-sectoral integration and a systematic approach to develop a decarbonization strategy.
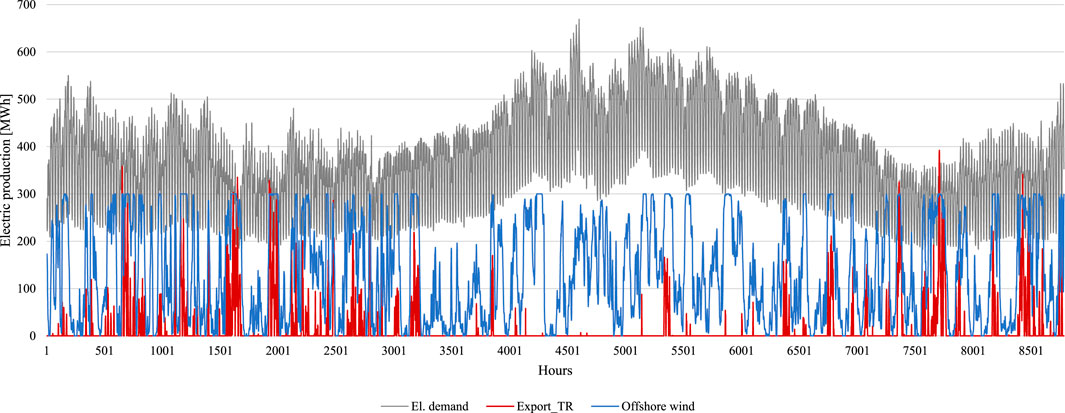
FIGURE 7. Influence of the offshore wind farm on electricity export.
Comparison of Scenarios Without Operational Thermal Power Plants
This section analyzes the energy system of Crete Island with fully operational interconnection cables with a capacity of 1400 MW and independent from fossil fuels for electricity production since the thermal power plants are phased out. The difference between Blue Energy and Renewable scenarios is in the total installed capacities of renewable energy sources. While the Blue Energy scenario considers offshore wind and currently installed PV and onshore wind capacities, an additional 480 MW of RES is added in the Renewable scenario. In total, 780 MW of renewables, compared to that in the Reference scenario, is the maximum capacity that could be installed with fully operational interconnection cables. Since the Greek energy strategy considers PV and onshore wind as the backbone of the future energy system, 480 MW is equally divided between these two sources. Therefore, the new capacity for PV is 336 MW, and the total capacity for onshore wind is 443 MW. It is necessary to ensure grid stability in both cases since installed renewables are strongly variable. The analysis shows that at least 25% of interconnection capacity needs to be used constantly for grid balancing to ensure undisrupted electricity supply to consumers. Moreover, to maintain grid stability in the Renewable scenario, it is necessary to ensure an operating grid stability strategy due to high-RES capacities. This can be done by electricity export, curtailment of the production from offshore and onshore wind farms, or utilizing electricity surplus to produce electrofuels. The exporting strategy was applied in this work, followed by the curtailment in extreme cases. Storing the electricity excess or utilization for electrofuel synthesis requires cross-sectoral coupling. This is not possible to assess with limited data or with the lack of a decarbonization strategy.
In the Blue Energy scenario, renewables can provide up to 57% (∼1.8 TWh) of electricity demand on an annual basis, while the rest comes from import (∼1.5 TWh). The electricity export accounts for 100 GWh on a yearly basis. Further increment of onshore renewables could theoretically cover up to 89% of electricity demand. Nevertheless, since the demand is not following the supply curve, a significant amount of electricity needs to be exported (∼515 GWh). Due to that fact, import remains a vital part of the system operation and stability, and it accounts for 0.9 TWh or 27% of electricity demand. Monthly production for considered renewables is given in Figure 8. As can be seen, the power output from offshore wind farms remains at the same level for both scenarios, 1.17 TWh, and is the major contributor to the power production sector with a share of 36%. The offshore wind production in these scenarios is identical to that in the Transition scenario, which is expected since simulations are carried out to maximize the power output from offshore wind farms to enhance their economics. Therefore, this value represents the maximum theoretical potential of offshore wind energy with the current level of technology development. For the Renewable scenario, increment of installed capacity for onshore wind farms doubled the production from this source to 1.11 TWh, and its share is approximately 35%. An additional 240 MW of PV increases power output from this source to 0.57 TWh, accounting for 18% of electricity production.

FIGURE 8. Monthly production from electricity sources in Blue Energy and Renewable scenarios.
Comparison of Energy Production and Fuel Consumption for Considered Scenarios
Figure 9 compares electricity supply by source for all considered scenarios. Currently, renewable electricity production is 0.67 TWh on an annual basis. Deployment of only 300 MW offshore wind turbines can increase this value to 1.85 TWh. Further increment in renewable capacities can increase renewable production on the island to 2.85 TWh, which corresponds to 89% of the current annual electricity demand. In terms of primary energy supply, fuel oil consumption for thermal power plants is 6.4 TWh for the Reference scenario, which can be reduced to 3.8 TWh in case that the offshore wind farm is installed. In general, the fuel oil used for power generation represents the vast majority of fossil fuels used on the island (∼80%) when the transport sector is not considered. Energy consumption in the residential and industrial sectors is kept at the same level (∼1.2 TWh) for all scenarios since electrification for heating, cooking, or industrial purposes is not considered.
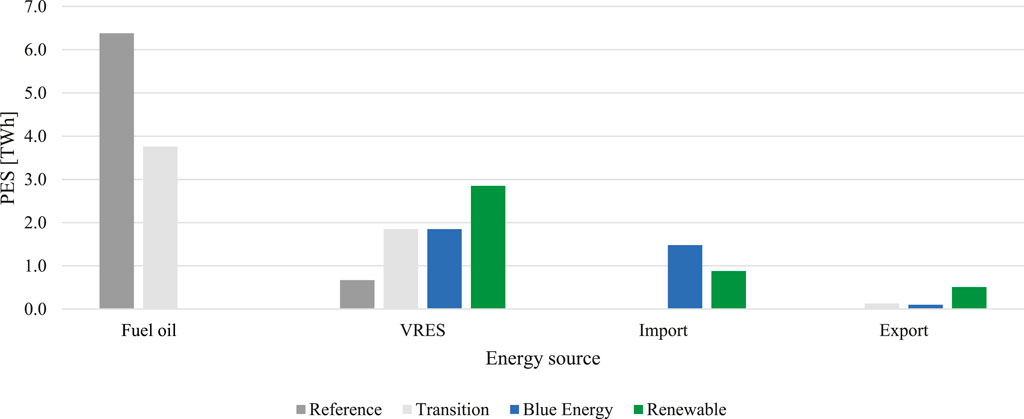
FIGURE 9. Comparison of electricity supply for all scenarios.
In terms of fuel consumption, it should be emphasized once again that this analysis is done without the inclusion of the transport sector for which the data were not available. Having this in mind, it can be concluded that the introduction of offshore wind and the increase in other renewables’ capacities can dramatically reduce the consumption of fossil fuels. As mentioned above, this is because the vast majority of fossil fuel consumption in considered sectors comes from thermal power plants where fuel oil is used. The remaining share of fossil fuel consumption (coal, natural gas, and some oil) is still used for industries and households. Still, their overall share is dramatically reduced compared to the reference case. The results are given in Figure 10.
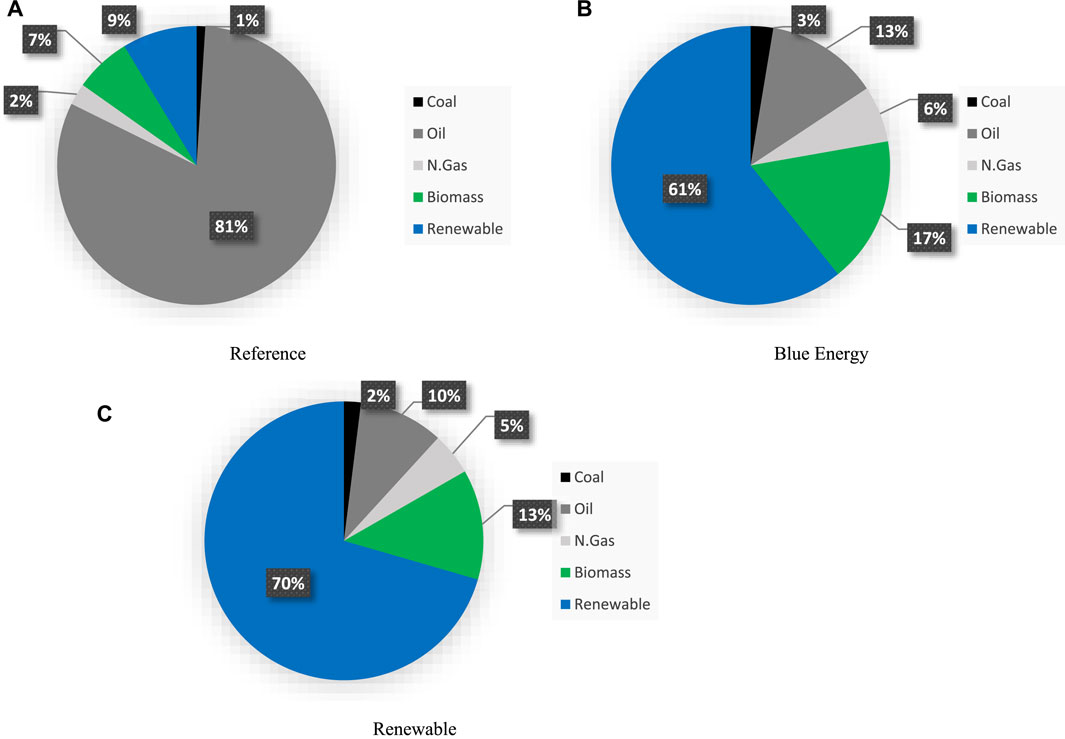
FIGURE 10. Comparison of fuel consumption for Reference (A), Blue Energy (B), and Renewable (C) scenarios.
Figure 11 sums up the share of renewable energy sources in electricity production and primary energy supply for assessed sectors. The share of renewables in electricity production increases from 25 to 100% when the offshore wind is deployed in combination with additional PV and onshore wind capacities, and thermal power plants are phased out. Nevertheless, it should be emphasized that a significant amount of electricity comes from import in this case, for which the production source is not known. In terms of primary energy supply, the share of renewables, including biomass, increases from 15 to 83%. For the case of the Blue Energy scenario, it is noted that the percentage of renewables in PES surpasses the share in electricity production, which is a direct consequence of the dramatic drop in fuel oil consumption. For complete decarbonization, it is necessary to electrify heating and, where possible, industrial sector and include alternative renewable fuels (Stančin et al., 2020). With the inclusion of the transport sector into the assessment, the share of fossil fuels in TPES would dramatically increase. Therefore, it is necessary to establish a strategy for transport decarbonization, which is inevitably related to the power production system once when there is a high share of electric vehicles.
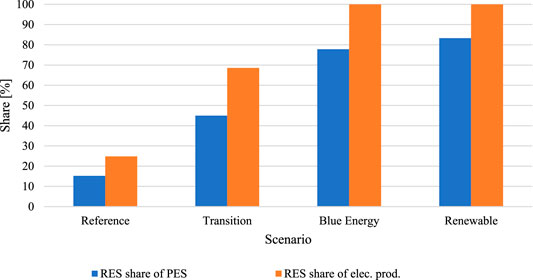
FIGURE 11. Share of the RES in PES and electricity production.
Estimation of CO2 Emissions for Energy, Residential, and Industrial Sectors
Since there are no available data regarding the CO2 emission for Crete Island, the results given in Figure 12 can only be used as indicative values. Even more, this analysis is limited since the software cannot calculate the values of CO2 emissions from imported electricity. For this reason, we have carried out a separate analysis to determine the level of emissions from imports, taking into account the average emission factor of Greek national systems, which is 487 kgCO2/MWh. In this case, for the BE scenario, the imported emissions are 0.73 Mt, and for the case of the RE scenario, they are approximately 0.44 Mt. On the contrary, the emission generated at power plants reduces from reference 1.53 Mt to only 0.18 Mt. Only the introduction of offshore wind farms reduced the CO2 emission by one-third to 1.0 Mt. From this preliminary analysis, it can be concluded that importing electricity from the mainland in combination with RES production at the island is a better solution than running thermal power plants.
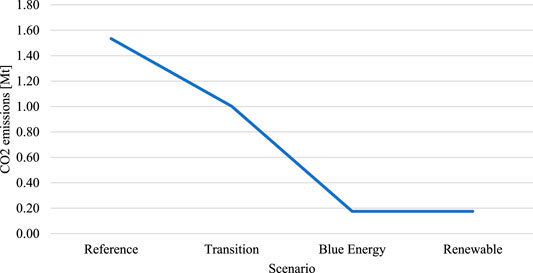
FIGURE 12. CO2 emissions for energy, residential, and industrial sectors.
Levelized Cost of Electricity
To evaluate the economic feasibility of proposed scenarios, the simplified levelized cost of electricity (LCOE) analysis is carried out. Simplified means that some rough estimations have been used, predominately on the investment side, due to the limited data availability. Table 4 summarizes the data used for this economic assessment. All data regarding the technology costs are taken from the Danish Energy Agency (Technology Data, 2022). The weighted average cost of capital (WACC) is taken from the Energy Post platform (Energy Post, 2022), but for the onshore wind in the case of Greece, since the data for offshore are not available. The calculation also included the investment for interconnector cables, even though this investment would happen with or without deployment of considered RESs (Greece commissions Crete-Peloponnese power interconnection, 2022; Independent Power Transmission Operator, 2022).
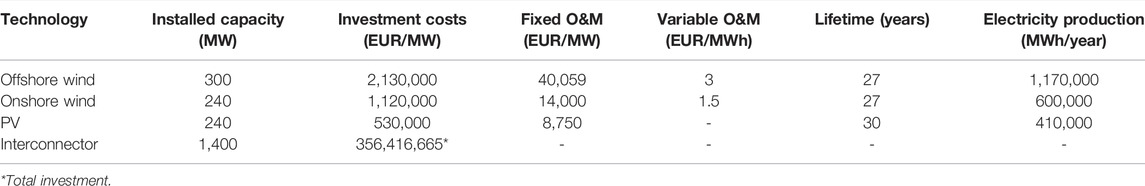
TABLE 4. Input data for LCOE analysis [1].
The analysis shows that, in the case of TR or BE scenarios where only offshore wind and interconnector are considered, the LCOE is around 120 EUR/MWh. This value is in the range of LCOE values for offshore wind farms published in the study (Energy and Climate, 2022). When additional PV and onshore capacities are deployed, such as in the RE scenario, the LCOE is further reduced to 90 EUR/MWh. This reduction can be expected since the investment and operating and maintenance (O&M) costs are comparably lower for PV and onshore wind than offshore wind. The technology lifetime was considered 27 years, with the 12% WACC used to discount the costs and energy production. Once again, these values should only be taken as orientational values due to used approximations and uncertainties regarding the technology costs.
Conclusion
The analysis of the energy system of Crete Island shows excellent potential for deployment of renewable energy sources, especially offshore wind. The island is currently acting as an energy system with limited interconnections to the mainland, with thermal power plants as the primary electricity source and complete dependence on imported fossil fuels used for all sectors. Since the transport sector is not considered, the energy sector with thermal power plants is the biggest consumer of fossil fuels, specifically fuel oil. Deployment of underwater interconnection cables allows for higher penetration of RESs and opens the possibility of shutting down thermal power plants and turning to sustainable energy sources. Especially interesting might be an integration of offshore wind, which has tremendous potential with a power output of 1.17 TWh per year with 300 MW of installed capacity with an average load factor of 41%. Additional installation of 480 MW of RES, which is possible with interconnection cables, opens the possibility of completely phasing out fossil fuels in the power generation sector and using interconnection with the mainland to maintain grid stability. More than 70% of electricity demand could be satisfied by the installed capacities at the island, while the total share of RESs in the primary energy supply is around 80%. This also allows a significant reduction in CO2 emissions, and even more, it opens the possibility to export excess electricity production. From the economic perspective, the calculated LCOE for TR and BE is 120 EUR/MWh. In comparison, this is further reduced to 90 EUR/MWh when additional RES capacities are deployed as in the RE scenario.
The transport sector should also be included in the analysis for future work. Moreover, an in-depth strategy for the electrification of the heating sector should be considered, especially seawater heat pumps as commercially available technology. This would require cross-sectoral coupling to minimize the losses and ensure a reliable, sustainable energy supply. Finally, it would be prudent to investigate the potential of offshore wind at the west location of the island to compare and make a trade-off between additional offshore and onshore capacities. Supplementary assessment of potential environmental impacts of offshore wind farms, especially on migratory birds, is also recommended.
Data Availability Statement
The original contributions presented in the study are included in the article/Supplementary Material, further inquiries can be directed to the corresponding authors.
Author Contributions
HS wrote and proofread the manuscript. HS and AP visualized the data. AP, HS, HM, and CP were involved in modeling the data. CP, FD, MD, NS, and SM were involved in data acquisition. MD, HM, and CP validated the results. HS interpreted the results.
Funding
This study was developed in the framework of the Interreg Med BLUE-DEAL (project number 5381) project co-financed by the European Regional Development Fund. Website: https://blue-deal.interreg-med.eu.
Conflict of Interest
The authors declare that the research was conducted in the absence of any commercial or financial relationships that could be construed as a potential conflict of interest.
Publisher’s Note
All claims expressed in this article are solely those of the authors and do not necessarily represent those of their affiliated organizations, or those of the publisher, the editors, and the reviewers. Any product that may be evaluated in this article, or claim that may be made by its manufacturer, is not guaranteed or endorsed by the publisher.
Acknowledgments
The authors would like to thank the anonymous reviewers for their dedicated time and valuable comments that improved the quality of this work.
References
Ashley, M. C., Mangi, S. C., and Rodwell, L. D. (2014). The Potential of Offshore Windfarms to Act as Marine Protected Areas - A Systematic Review of Current Evidence. Mar. Policy 45, 301–309. doi:10.1016/j.marpol.2013.09.002
Bačeković, I., and Østergaard, P. A. (2018). Local Smart Energy Systems and Cross-System Integration. Energy 151, 812–825.
Bačelić Medić, Z., Ćosić, B., and Duić, N. (2013). Sustainability of Remote Communities: 100% Renewable Island of Hvar. J. Renew. Sustain. Energy 5 (4). doi:10.1063/1.4813000
Cabrera, P., Lund, H., and Carta, J. A. (2018). Smart Renewable Energy Penetration Strategies on Islands: The Case of Gran Canaria. Energy 162, 421–443. doi:10.1016/j.energy.2018.08.020
Calise, F., Duic, N., Pfeifer, A., Vicidomini, M., and Orlando, A. M. (2021). Moving the System Boundaries in Decarbonization of Large Islands. Energy Convers. Manag. 234, 113956. doi:10.1016/j.enconman.2021.113956
Curto, D., Favuzza, S., Franzitta, V., Musca, R., Navarro Navia, M. A., and Zizzo, G. (2020). Evaluation of the Optimal Renewable Electricity Mix for Lampedusa Island: The Adoption of a Technical and Economical Methodology. J. Clean. Prod. 263, 121404. doi:10.1016/j.jclepro.2020.121404
Diane, C., Erika, M., Evangelos, R., Christoforos, P., Antun, P., Daniele, G., et al. (2019). “A Methodology for Energy Planning in Small Mediterranean Islands, the Case of the Gozo Region,” in SyNERGY MED 2019 - 1st International Conference on Energy Transition in the Mediterranean Area, Cagliari, Italy (Institute of Electrical and Electronics Engineers Inc.). doi:10.1109/synergy-med.2019.8764131
Dispaset (2022). The Dispa-SET Model — Documentation [Internet]. Available from: http://www.dispaset.eu/en/latest/.
Energy and Climate (2022). Policy Implications of 2022 Cost-Effective Decarbonisation Study - Florence School of Regulation [Internet]. Available from: https://fsr.eui.eu/policy-implications-of-2022-cost-effective-decarbonisation-study/.
Energy Post (2022). Energy Post - the Best Thinkers on Energy - [Internet]. Available from: https://energypost.eu/.
EnergyPLAN (2022). Advanced Energy Systems Analysis Computer Model [Internet]. Available from: https://www.energyplan.eu/.
Global Wind Atlas (2021). Global Wind Atlas [Internet]. Available from: https://globalwindatlas.info/.
Greece commissions Crete-Peloponnese power interconnection (2022). Enerdata [Internet]. Available from https://www.enerdata.net/publications/daily-energy-news/greece-commissions-crete-peloponnese-power-interconnection.html.
Groppi, D., Pfeifer, A., Garcia, D. A., Krajačić, G., and Duić, N. (2021). A Review on Energy Storage and Demand Side Management Solutions in Smart Energy Islands. Renew. Sustain. Energy Rev. 135, 110183. doi:10.1016/j.rser.2020.110183
Hellenic Republic (2019). Hellenic Republic M of the E and E. The National Energy and Climate Plan. Athens: Ministry of the Environment and Energy.
Independent Power Transmission Operator (2022). Interconnection of Crete with Peloponnese IPTO [Internet]. Available from: https://www.admie.gr/en/erga/erga-diasyndeseis/diasyndesi-tis-kritis-me-tin-peloponniso.
Kiviranta, K., Thomasson, T., Hirvonen, J., and Tähtinen, M. (2020). Connecting Circular Economy and Energy Industry: A Techno-Economic Study for the Åland Islands. Appl. Energy 279, 115883. doi:10.1016/j.apenergy.2020.115883
Krajačić, G., Duić, N., and Carvalho, M. da. G. (2009). H2RES, Energy Planning Tool for Island Energy Systems - the Case of the Island of Mljet. Int. J. Hydrogen Energy 34 (16), 7015–7026. doi:10.1016/j.ijhydene.2008.12.054
Lund, H., Østergaard, P. A., Connolly, D., and Mathiesen, B. V. (2017). Smart Energy and Smart Energy Systems. Energy 137, 556–565. doi:10.1016/j.energy.2017.05.123
Lund, H., Thellufsen, J. Z., Østergaard, P. A., Sorknæs, P., Skov, I. R., and Mathiesen, B. V. (2021). EnergyPLAN - Advanced Analysis of Smart Energy Systems. Smart Energy 1, 100007. doi:10.1016/j.segy.2021.100007
Marczinkowski, H. M., and Barros, L. (2020). Technical Approaches and Institutional Alignment to 100% Renewable Energy System Transition of Madeira Island-Electrification, Smart Energy and the Required Flexible Market Conditions. Energies 13 (17). doi:10.3390/en13174434
Meteonorm (2022). Intro - Meteonorm (de) [Internet]. Available from: https://meteonorm.com/.
Mimica, M., Krajacic, G., Medved, D., and Jardas, D. (2020). “Digitalization and Smart Islands in the Kvarner Archipelago,” in 2020 43rd International Convention on Information, Communication and Electronic Technology, MIPRO 2020 - Proceedings, Opatija, Croatia (Institute of Electrical and Electronics Engineers Inc.), 1837–1842. doi:10.23919/mipro48935.2020.9245328
Pfeifer, A., Herc, L., Batas Bjelić, I., and Duić, N. (2021). Flexibility Index and Decreasing the Costs in Energy Systems with High Share of Renewable Energy. Energy Convers. Manag. 240, 114258. doi:10.1016/j.enconman.2021.114258
Pfeifer, A., Dobravec, V., Pavlinek, L., Krajačić, G., and Duić, N. (2018). Integration of Renewable Energy and Demand Response Technologies in Interconnected Energy Systems. Energy 161, 447–455. doi:10.1016/j.energy.2018.07.134
PRISMI PLUS (2021). The PRISMI Wind Power Calculator Tool [Internet]. Available from: https://prismi.interreg-med.eu/news-events/news/detail/actualites/the-prismi-wind-power-calculator-tool/.
Rodrigues, E. M. G., Godina, R., Santos, S. F., Bizuayehu, A. W., Contreras, J., and Catalão, J. P. S. (2014). Energy Storage Systems Supporting Increased Penetration of Renewables in Islanded Systems. Energy 75, 265–280. doi:10.1016/j.energy.2014.07.072
Santamarta, J. C., García-Gil, A., Expósito, M. d. C., Casañas, E., Cruz-Pérez, N., Rodríguez-Martín, J., et al. (2021). The Clean Energy Transition of Heating and Cooling in Touristic Infrastructures Using Shallow Geothermal Energy in the Canary Islands. Renew. Energy 171, 505–515. doi:10.1016/j.renene.2021.02.105
Schallenberg-Rodriguez, J. (2014). Photovoltaic Techno-Economical Potential on Roofs in the Canary Islands. J. Sustain. Dev. energy water Environ. Syst. 2 (1), 68–87. doi:10.13044/j.sdewes.2014.02.0007
Segurado, R., Krajačić, G., Duić, N., and Alves, L. (2011). Increasing the Penetration of Renewable Energy Resources in S. Vicente, Cape Verde. Appl. Energy 88 (2), 466–472. doi:10.1016/j.apenergy.2010.07.005
Soukissian, T. H., Denaxa, D., Karathanasi, F., Prospathopoulos, A., Sarantakos, K., Iona, A., et al. (2017). Marine Renewable Energy in the Mediterranean Sea: Status and Perspectives. Energies 10 (10), 1–56. doi:10.3390/en10101512
Stančin, H., Mikulčić, H., Wang, X., and Duić, N. (2020). A Review on Alternative Fuels in Future Energy System. Renew. Sustain. Energy Rev. 128, 109927. doi:10.1016/j.rser.2020.109927
Stelzenmüller, V., Gimpel, A., Haslob, H., Letschert, J., Berkenhagen, J., and Brüning, S. (2021). Sustainable Co-location Solutions for Offshore Wind Farms and Fisheries Need to Account for Socio-Ecological Trade-Offs. Sci. Total Environ., 776, 145918. doi:10.1016/j.scitotenv.2021.145918
Technology Data (2022). Technology Data Energistyrelsen [Internet]. Available from https://ens.dk/en/our-services/projections-and-models/technology-data.
Keywords: sustainable island, blue energy, offshore wind, RES integration, decarbonization
Citation: Stančin H, Pfeifer A, Perakis C, Stefanatos N, Damasiotis M, Magaudda S, Di Pietrantonio F and Mikulčić H (2022) Blue Energy Spearheading the Energy Transition: The Case of Crete. Front. Energy Res. 10:868334. doi: 10.3389/fenrg.2022.868334
Received: 02 February 2022; Accepted: 14 April 2022;
Published: 17 May 2022.
Edited by:
Adrian Ilinca, Université du Québec à Rimouski, CanadaReviewed by:
Raquel Segurado, University of Lisbon, PortugalMuhammad Sufyan Javed, Jinan University, China
Copyright © 2022 Stančin, Pfeifer, Perakis, Stefanatos, Damasiotis, Magaudda, Di Pietrantonio and Mikulčić. This is an open-access article distributed under the terms of the Creative Commons Attribution License (CC BY). The use, distribution or reproduction in other forums is permitted, provided the original author(s) and the copyright owner(s) are credited and that the original publication in this journal is cited, in accordance with accepted academic practice. No use, distribution or reproduction is permitted which does not comply with these terms.
*Correspondence: Hrvoje Stančin, hrvoje.stancin@fsb.hr; Hrvoje Mikulčić, hrvoje.mikulcic@fsb.hr