Construction and Application of a Carbon Emission Model for China’s Coal Production Enterprises and Result Analysis
 Yang Li1
  Xiangyang Jin
 Yuqi Ren
- 1School of Energy and Mining Engineering, China University of Mining and Technology-Beijing, Beijing, China
- 2China Coal Technology and Engineering Group International Engineering Co Ltd, Beijing, China
To achieve the national goal of “peak carbon emissions and carbon neutrality,” a specific action plan is needed. Therefore, it is particularly important to scientifically calculate the total carbon emissions of enterprises in various industries. According to the related enterprises’ characteristics, this study adopts different-source methods to construct the carbon emission calculation model. Carbon dioxide emissions are calculated based on the gas grade, and the results are as follows: 1) Carbon emissions of enterprises are significantly different with various gas grades; 2) gas dissipation accounts for more than 80% of carbon emissions of relevant enterprises, so the gas content in the coal seam increases the effect of carbon emissions; and 3) with the increase in mining depth, carbon emissions are increasing. This innovation of study is, first, comprehensively analyzing the carbon emission sources of relevant enterprises from six aspects, including fuel combustion, torch burning, CH4 and CO2 dissipation, net purchased electricity and heat implication, coal gangue storage and utilization, and coal transportation. Moreover, the source–sink relationship method is proposed when the CH4 and CO2 dissipation is calculated, which avoids human errors such as inaccurate measurement of the actual statistical method and the difficulty of obtaining calculation parameters, thus more accurately calculating the total carbon emissions. The source–sink relationship method can be applied in open coal pits to solve the carbon emission calculation. Implementing green and low-carbon development and achieving the goal of peak carbon emissions and carbon neutrality is significant.
Introduction
Greenhouse gas emissions (CO2, CH4, N2O, HFCs, PFCs, SF6, etc.) caused by human activities such as agriculture and the exploitation of fossil energy such as coal, oil, and natural gas lead to a rise in the concentration of greenhouse gases, the enhancement of the greenhouse effect, global warming, and the frequent occurrence of extreme weather. To protect our environment, 200 contracting parties signed the Paris Agreement, which clearly stated that “by the end of this century, the global average temperature rise shall be maintained within 2°C relative to the preindustrial level, and efforts shall be made to control the global average temperature rise within 1.5°C to reduce the risks and impacts of climate change” (Cai F et al., 2022).
In 2019, global carbon emissions were 40.1 billion tons of carbon dioxide, 86% of which came from fossil fuels (Wang X. et al., 2021). Among them, coal, as an important fossil energy source, accounted for 27% of the world’s primary energy in 2019 (BP, 2020). Carbon makes up more than 60% of coal. As an energy source and industrial raw material, coal creates a large amount of CO2 emissions at the production end (coal production enterprises) and consumption end (coal power companies, heating companies, coal-to-chemical companies, building materials companies, etc.). Due to China’s energy features of the “rich coal, poor oil, and less natural gas,” the proportion of coal in total energy consumption was much higher than the world average, between 60% and 70% for many years (Li et al., 2021). In recent years, with the rapid development of new energy sources and the technical improvement of fossil energy, the proportion of coal in total energy consumption dropped to below 60% for the first time in 2018 and to 56.8% in 2020 (Ministry of Natural Resources, PRC, 2021). According to the Guiding Opinions on the High-Quality Development of the Coal Industry during the Fourteenth Five-Year Plan, by 2025, domestic coal production will be controlled at approximately 4.1 billion tons, and national coal consumption will be controlled at approximately 4.2 billion tons, with average annual consumption growth of approximately 1%.
To achieve the goal of carbon neutrality, China must completely change the energy structure dominated by coal and increase the proportion of noncarbon energy sources. Coal production enterprises are facing serious pressure of industrial optimization and adjustment and stress on the supply chain and the public. On 22 April 2021, at the Earth Day Leaders’ Climate Summit, Xi Jinping proposed that China will strictly control coal power projects and the growth of coal consumption during the “14th Five-Year Plan” period and gradually decrease coal consumption during the “15th Five-Year Plan” period. Coal control will be a major means for China to reduce carbon emissions in the future (Xinhuanet, 2021). To formulate carbon reduction policies for the coal industry, the responsible department of the coal industry should accurately verify the carbon emission data of coal production enterprises and study the characteristics and trends of carbon emissions. Therefore, a simple carbon emission model for coal production enterprises should be constructed; it should have a wide application range and be easily accessible.
At present, the research on the construction of carbon emission models for coal production enterprises in domestic and foreign academic circles primarily focuses on the research of model construction methods, the determination of carbon emission sources, and the prediction of methane emissions. The main research results of the model construction method and carbon emission source determination are as follows. IPCC (2006) presented calculation methods for total carbon emissions in the production process of power generation, coke, and lignite briquette (Intergovernmental Panel on Climate Change, 2006). Liu and Wang (2013) established measurement models of corporate carbon emissions, taking the coal power industry chain as the mainline and applying the whole life cycle analysis method, which was divided into mining, washing, thermal power generation, and gas power generation (Liu and Wang, 2013). The National Development and Reform Commission (2014) promulgated the Guidelines for Accounting Methods and Reporting of Greenhouse Gas Emissions from China’s Coal Production Enterprises (Trial) (AMCC) to build an accounting model from four aspects, including fuel combustion, torch burning, CH4 and CO2 escape, and net purchased electricity and heat implications (National Development and Reform Commission of the People’s Republic of China, 2014). Wang, Wen, and Zhu (2015) studied CMM emission characteristics and designed a coefficient-intensity factor methodology integrated with IPCC methodology to increase its applicability to regional circumstances (Wang et al., 2015). Wang B. J. et al. (2019) presented the status and hot spots reported in studies on the carbon emissions of the coal mining industry in China (Wang B. et al., 2019). Wang et al. (2022) built a source-driven CO2 emissions accounting model for the coal development sectors using the emissions factor method (Wang B. et al., 2019). Zhou et al. (2020) used the life cycle (LCA) method to study and establish a carbon emission calculation model of the whole process of coal production enterprises from the aspects of mining, ventilation, drainage, power consumption, transportation, and closure activities (Zhou et al., 2020). The main research results of methane emission prediction are as follows. Based on numerical analysis, Brodny and Tutak (2016) proposed the mechanism of CMM release from a mined rock mass and a rockfall goaf, which was released to the surface and into the atmosphere through a ventilation system (Brodny and Tutak, 2016). Tutak and Brodny (2019) studied the methodology of predicting methane emissions based on artificial neural networks and selected statistical methods (Magdalena et al., 2019). According to AMCC, Ren et al. (2022) established the carbon emission calculation model in the process of coal development, calculated the carbon emissions in the process of coal development, analyzed the carbon emission characteristics of different links, and put forward the technical methods of carbon emission reduction in the process of coal development from the three links of production energy consumption, gas emissions, and post-mining activities (Ren et al., 2022).
Most of the above carbon emission models are constructed by the different-source method, and many studies have been carried out on carbon emission sources. However, the following problems have been identified: 1) for carbon emission calculation of the key influencing factor methane, the statistical measurement method is adopted, which requires many parameters that are difficult to obtain, and some parameters use empirical data; 2) empirical data are used for CH4 emission factors of open-pit mining and post-mining activities, resulting in inaccurate calculation results; 3) the unsystematic emission of greenhouse gases from ground fissures and closed pits is not considered, resulting in a smaller value being calculated for carbon emission; and 4) due to the different gas content in coal seams, the carbon emission per unit of coal output varies greatly. The existing research results have not been classified and evaluated according to the gas grade. Therefore, it is impossible to scientifically guide the responsible departments of the coal industry to formulate plans and carbon reduction policies. Because of the problems above, this study optimizes the carbon emission model of coal production enterprises and proposes the source–sink relationship method for the calculation of methane and CO2 emissions. At the same time, based on the coal mine gas grade, the carbon emissions are calculated using the established model, and the emission data are analyzed and predicted. The main significance of this research is as follows: 1) to provide a simpler and more accurate calculation method of carbon emissions so that the government and coal production enterprises can have an accurate and objective understanding of the carbon emissions of coal mines; 2) to determine the key factors affecting the carbon emissions of coal production enterprises and calculate the carbon emissions per ton and the trend of coal mines with different gas grades so that the coal mines can understand the composition of their own carbon emissions to take more targeted measures to reduce carbon emissions from the source; 3) to understand the carbon emission status of the coal industry and provide a scientific basis for the formulation of a carbon neutralization planning strategy; and 4) to formulate targeted policies according to the carbon emission characteristics of coal production enterprises.
Construction Method of Carbon Emission Model for Coal Production Enterprises
According to the carbon emission calculation process, referring to the IPCC (2006) Guidelines for National Greenhouse Gas Inventories and AMCC, a carbon emission model for coal production enterprises is constructed. The steps of the carbon emission calculation are shown in Figure 1.

FIGURE 1. Steps of carbon emission calculation.
Determine the Accounting Boundary
A coal production enterprise is engaged in coal mining and washing activities within China. Therefore, the accounting boundary should be the process from coal removal to transportation, crushing, washing, and processing into commercial coal. However, since product coal and coal gangue must be transported over long distances in the subsequent utilization link, the CH4 dissipation process is relatively slow and continues until the coal is finally used. Therefore, to ensure the calculation accuracy of carbon emissions, the accounting boundary should be extended to the end-users of coal, involving the transportation of coal and coal gangue, excluding the end users’ consumption of coal. In other words, all the links before the end-users are included.
The facilities within the accounting boundary comprise the primary and auxiliary production systems, administrative welfare facilities, and transportation links to end-users. The primary production systems include coal mining, coal tunnel excavation, coal washing, and processing. Auxiliary production systems include lifting, ventilation, transportation, drainage, compressed air, gas extraction systems, power supply and distribution, heating, refrigeration, mechanical repair, coal gangue storage, and environmental protection facilities. Administrative welfare facilities include offices, accommodations, bathrooms, and canteens. Transportation links include automobiles, railways, and water transportation.
Identify Emission Sources
The types of greenhouse gases made by coal production companies are divided into direct and indirect emissions. Direct emissions are methane (CH4) and CO2 dissipation emissions, fuel combustion CO2 emissions, torch burning CO2 emissions, coal gangue storage and utilization, and coal transportation to users. Indirect emissions are CO2 emissions implied by the net purchase of electricity and heat (Climate change response Department of national development and Reform Commission, 2011). The specific analysis is as follows:
(1) Carbon emissions from CH4 and CO2 dissipation: the dissipation emissions of CH4 and CO2 from coal production and post-mining activities. The coal production link includes the escape of coal mining, excavation, and transportation activities from shaft, pumping station, and ground fissures, and the post-mining activities refer to the CO2 emission from the free and adsorbed CH4 and CO2 in the coal, which is slowly released into the atmosphere during the coal transportation, storage, and processing. After the mine is closed, the residual CH4 and CO2 pass through the fracture zone and the unclosed shafts and finally dissipate into the atmosphere.
(2) Fuel combustion carbon emissions: the CO2 emissions generated by the full combustion of coal, gas, gasoline, diesel, and other fossil fuels with oxygen through boilers, self-provided power plants, standby generators, gas power generation equipment, and transportation vehicles.
(3) Carbon emissions from torch burning: the CO2 emissions generated by the torch burning of gas from coal mines for safety and environmental protection purposes.
(4) Carbon emissions from coal gangue storage and utilization: the coal gangue produced by the tunneling system and washing is temporarily stored in the gangue site. Gangue will produce CH4 and CO2, and some will ignite spontaneously, leading to carbon emissions. Coal gangue is transported to low-calorific value power plants or gangue brick factories for comprehensive utilization, and carbon emissions will be released during the transportation process. The CH4 and CO2 dissipation of coal gangue are counted in (1).
(5) Carbon emissions implied by net purchases of electricity and heat: the CO2 emissions from fuel combustion during the production process corresponding to the annual net purchase of electricity or heat (steam, hot water) by coal production enterprises. Emissions actually occur in those electricity or heat production enterprises but are triggered by the consumption activities of the coal production companies and calculated in their total emissions.
(6) Carbon emissions from coal transportation: coal production is located in Inner Mongolia, Shanxi, and Shaanxi. The total raw coal production of these three provinces in 2020 was 2.752 billion tons, accounting for 71% of the national raw coal production (Statistics Bureau of the People’s Republic of China, 2020). The coal from the three provinces was transported to the coast along the Yangtze River, North China, and Northeast China. The annual net transfer volume reached 1.5 to 1.6 billion tons, with an average transportation distance of 1,204 km (Coalrennet, 2020). The long-distance transportation of coal not only led to severe carbon emissions from vehicle fuel but also caused the residual CH4 and CO2 of the coal to dissipate into the atmosphere. The carbon emissions of this part are counted in (1).
The sources of greenhouse gas emissions from coal production enterprises are shown in Figure 2.
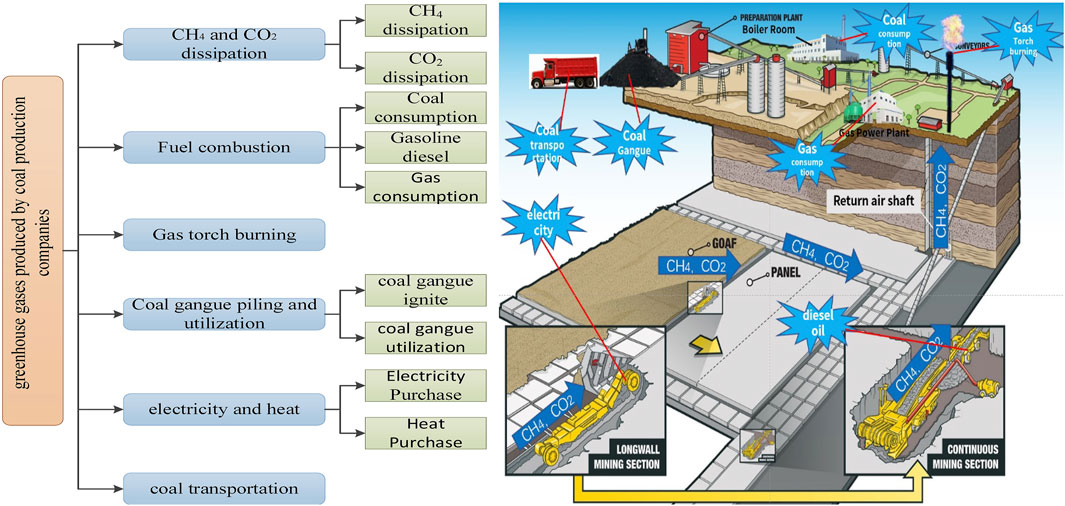
FIGURE 2. Greenhouse gas emission sources of coal production enterprises.
Construction of the Carbon Emission Model of Coal Production Enterprises
Referring to AMCC, by using a different-source method to construct an accounting model, the total greenhouse gas (GHG) emissions of coal mine production enterprises are equal to the sum of the carbon emissions from CH4 and CO2 dissipation, fossil fuel combustion, torch burning, coal gangue storage and utilization, and the net purchased electricity and heat. Please see the following formula:
EGHG is total enterprise greenhouse gas emissions, ton·CO2 equivalent.
ECH4dissipation is dissipation emissions of CH4, tons·CH4.
GWPCH4 is the global warming potential (GWP) value of CH4 compared to CO2, taken as 28 (IPCC, 2014).
ECO2 dissipation is CO2 dissipation emissions, tons·CO2.
ECO2 burn is CO2 emissions from fossil fuel combustion, tons·CO2.
ECO2 torch is CO2 emissions from gas torch burning, tons·CO2.
ECO2 gangue is CO2 emissions from coal gangue storage and utilization, ton·CO2.
ECO2 electricity is CO2 emissions implied by the company’s net purchase of electricity, ton·CO2.
ECO2heat is CO2 emissions implied by the net purchase of heat by the company, ton·CO2.
Dissipation Emissions of CH4 and CO2
The dissipation emissions of CH4 and CO2 are the key and difficult point for coal production enterprises to calculate carbon emissions. Affected by mining disturbance, the original CH4 and CO2 in the coal seam and surrounding rocks begin to desorb, and the pressure and content of CH4 and CO2 begin to decrease over time. The desorbed CH4 and CO2 enter the gas drainage system or flow into the coal mine ventilation system. The remaining CH4 and CO2 in the extracted coal enter the surface production system along with the raw coal and are slowly released into the atmosphere during the process of crushing, washing, storage, and transportation, which constitute the dissipation emissions of CH4 and CO2 from post-mining activities. The residual CH4 and CO2 in the gob and protective coal pillars that have not been completely desorbed in adjacent coal seams will continue to be slowly released. Even after the mine is closed, CH4 and CO2 will still enter the atmosphere through mining gallery cracks, geological structures, and poorly closed shafts.
The source–sink relationship of mine CH4 (CO2) is shown in Figure 3.
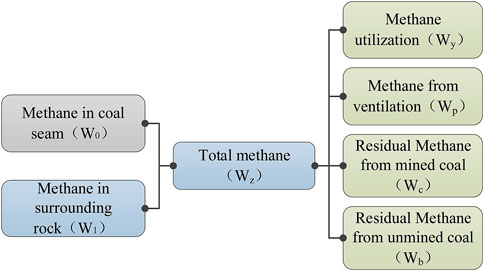
FIGURE 3. Source–sink relationship of CH4 in coal production enterprises.
According to the above analysis, the dissipation emissions of CH4 and CO2 can be calculated by two methods: the measured statistics method and the source–sink relationship method.
Dissipation Emissions of CH4
(1) Measured statistics method:
ECH4 dissipation is annual CH4 emissions, t/a.
ECH4direct is the amount of CH4 emitted directly into the atmosphere by the ventilation system or gas extraction system, t/a.
ECH4mined is the amount of CH4 emitted after the raw coal is mined until it is transported to the coal users, t/a.
ECH4unsystematic is the unsystematic discharged CH4 that has not entered the mine ventilation system and passes through cracks, faults, and uncomplete closed shafts, t/a.
① Calculation of ECH4direct:
QCH4ventilate is the amount of CH4 in the airflow in the air-return roadway in 1 year, 10,000 Nm3/year.
QCH4drainage, QCH4torch, QCH4usage are, in the gas drainage system, the amount of drainage, torch burning, and gas used, which can be directly read through the gas drainage system, 10,000 Nm3/year.
ρCH4 is the density of CH4 under standard conditions of 7.17 tons of CH4/10,000 Nm3.
T is the operating hours of the mine in the current year, h.
n is the nth monitoring of the air-return roadway within 1 h.
N is the number of monitoring of the air-return roadway within 1 h.
Qair-return is the nth monitored wind flow in the air-return roadway, Nm3/min.
Cair-return is the volume concentration of CH4 monitored for the nth time in the air-return roadway, dimensionless, with a value range of 0–1.
② Calculation of ECH4mined:
ADcoal is the annual output of raw coal, t/a.
QCH4residual is the residual gas content for the mined raw coal, m3/t.
The gas desorption in coal is complex, comprising penetration and diffusion, and is affected by temperature, air pressure, particle size, coal quality, and exposure time. After research, the theoretical calculation of the time required for lump coal to desorb 90% of the gas is shown in Table 1 (Li, 1992).
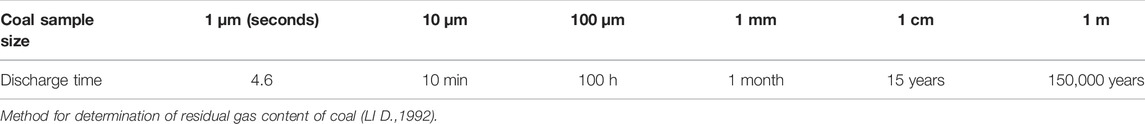
TABLE 1. Desorption time of 90% gas from lump coal with different particle sizes.
According to the Design Code of Boiler House and the Technical Conditions of Coal for Chain Grate Boiler, the maximum size of power coal is 50 mm. Table 1 shows that, for raw coal with a particle size of 10 mm, it takes 15 years to desorb 90% of the gas. Therefore, it is difficult to accurately determine the CH4 emissions from coal production enterprises’ post-mining activities. For the transportation and storage of coal products from coal production enterprises to end users, the dissipation emissions of CH4 and CO2 cannot be calculated due to the uncertain time of gas desorption. Hence, the life cycle method is adopted to extend the calculation boundary of coal production enterprises to the links of coal transportation and coal gangue utilization. As more than 50% of China’s coal is used for thermal power generation, to improve boiler efficiency and fuel utilization, coal is ground into pulverized coal before being blown into the furnace through the air carrying less than 75% of the pulverized coal, with a particle size less than 90 μm.
The process is shown in Figure 4.

FIGURE 4. Whole life cycle process of raw coal.
Figure 4 shows that the raw coal undergoes multiple processes, such as crushing, screening, washing, long-distance transportation, storage, coal blending, and coal grinding, over a period of 30–60 days. During this time, the residual CH4 and CO2 of the coal are nearly zero:
③ Calculation of ECH4unsystematic:
ADunmined is the amount of coal resources affected by mining in the current year, t/a.
QCH4residual is the residual gas content of unmined coal, m3/t.
The actual measured statistical method is simple and easy to implement and can be used in coal mines with continuous monitoring conditions. However, there are the following problems:
a. Due to the different intensities of coal mining, the gas concentration varies greatly.
b. On the cross-section of the air-return roadway, the gas concentration is different at different locations.
c. The CH4 content of mined raw coal and unmined coal has a wide variation range, which cannot be continuously measured.
d. Not applicable to open-pit coal mines.
(2) Source–sink relationship method:
As shown in Figure 3, the source of CH4 is the desorption of CH4 in coal seams and surrounding rocks affected by mining and driving, and finally, CH4 is released into the atmosphere and gas extraction and utilization system. Therefore, the total amount of CH4 that finally dissipates into the atmosphere is composed of three parts: the amount of gas exhausted through ventilation, the dissipation of residual CH4 of the mined coal, and the fractured but not mined coal:
Combining formulas (7) and (8), we can conclude the following formula:
WCH40 is annual CH4 emissions from coal seams affected by mining disturbance, t/a.
WCH41 is annual CH4 emissions from surrounding rocks affected by mining disturbance, t/a.
WCH4y is the annual utilization of CH4, t/a.
Among them, the calculation of WCH40 is shown as follows:
ADaffected is the amount of coal resource affected by mining and driving that year, t/a.
QCH4original is the original gas content of the coal seam that shall be calculated by the coal seam slice.
By the original gas content value of the surrounding rock or the estimation method, WCH41 is calculated as follows:
k means the gas emission coefficient of the surrounding rock is 0.2–0.5. When the roof is managed by the total collapse method and the surrounding rock has more carbon content, k will take a larger value. When the backfilling method is used, k will take a small value. When the surrounding rock is tight, k will take a smaller value.
The source–sink relationship method employs the law of conservation of mass to indirectly calculate the annual CH4 emissions. It uses a few parameters, making the calculation simple. However, it does not consider the amount of CH4 permanently remaining in the underground mine that did not dissipate into the atmosphere, leading to a large calculated value. Nevertheless, in the long run, the calculation result of the source–sink relationship method is more reasonable, it can calculate the impact on the atmosphere of CH4 emitted by coal production enterprises throughout the life cycle, and it is also suitable for open-pit coal mines and should be put into use first.
Dissipation Emissions of CO2
The calculation of CO2 dissipation emissions is the same as that of CH4 dissipation emissions. The calculation formula is as follows:
The parameters’ meaning in the calculation of CO2 fugitive emissions above is similar to the calculation formula of CH4 in 3.1.1.
ρCO2 is CO2 density under standard conditions, 19.7 tons of CO2/10,000 Nm3.
Emissions of CO2 From Fuel Combustion
Fossil fuels need to be used to ensure the production and continuity of coal mines. For example, boilers are used in heating and hot water systems, hot blast stoves are used for shaft air intake heating, diesel vehicles are used in underground auxiliary transportation, and gasoline is used in ground vehicles. Fuel combustion CO2 emissions are the different fossil fuel combustion volumes of facilities of coal mining enterprises, multiplied by the corresponding fuel carbon content and carbon oxidation rate and then accumulated layer by layer as follows:
ECO2burn means CO2 emissions from fossil fuel combustion, tons/year.
i are types of fossil fuels.
j is the serial number of the combustion facility.
ADi,j is the consumption of fossil fuel type i burned in the combustion facility j in tons for solid or liquid fuels, and 10,000 Nm3 (volume under standard conditions) for gas fuels. The volume under non-standard conditions needs to be converted into standard conditions for calculation.
CCi,j is the carbon content of the fossil fuel i burned in the combustion facility j measured in units of ton carbon per ton of fuel for solid and liquid fuels and measured per ton of carbon per 10,000 Nm3 for gaseous fuels.
OFi,j means the carbon oxidation rate of fossil fuel i in the combustion facility j is dimensionless, and the value range is 0–1, which can be measured by enterprises. The default value is not measured. The carbon oxidation rate of liquid fuels is 0.98 and that of gas fuels (including CBM or CMM, which is used as fuel by enterprises through recycling) is taken as 0.99. When solid fuel is not measured, it is taken as 1 (Ministry of ecology and environment, 2021).
44/12 is the molecular weight conversion coefficient of CO2 and carbon (C).
In
NCVi is net calorific value of fossil fuel type i, GJ/ton.
EFi is the carbon content per calorific value of the fossil fuel type i, ton carbon/GJ, and the EFi of common fuels can be obtained from the relevant table (Climate change response Department of national development and Reform Commission, 2011).
CO2 Emissions From Torch Burning
Before the gas is discharged into the atmosphere, it is burned with a torch. The combustion product is CO2. The calculation formula is shown in Eq. 15. However, due to environmental protection requirements, it has rarely been used:
ECO2torch means CO2 emissions from coal bed methane (CBM) (coal mine methane (CMM)) torch burning, tons·CO2;
Qgastorch means torch burning volume (mixed volume) of coalbed methane (coal mine methane), 10,000 Nm3; CCnonCO2 means the total carbon content of other carbon-containing compounds except for CO2 in CBM or CMM, a ton of carbon/10,000 Nm3, can be calculated after actual measurement of each gas component; OFtorch means the carbon oxidation rate of the torch burning is dimensionless, and the value range is 0–1. When there is no actual measured value, it is taken as 0.99.
CO2 Emissions From Coal Gangue Storage and Utilization
Coal gangue storage and utilization will bring carbon emissions from the following links: ① coal gangue storage spontaneous combustion, resulting in CO2 emissions, and ② CH4 and CO2 dissipation from coal gangue storage and transportation, which has been included in Formula (5). Carbon emissions generated by coal gangue transport vehicles have been considered in road transport companies, and calculation will not be repeated for coal production companies. The calculation formula is shown as follows:
ECO2gangue means CO2 emissions from coal gangue storage and utilization, ton·CO2.
ADgangue is annual production of coal gangue, t/a.
CCgangue is the carbon content of coal gangue, ton of carbon per ton of fuel.
OFgangue is the carbon oxidation rate of coal gangue, 1 if no actual measurement is available.
Implied CO2 Emissions From Net Purchased Electricity and Heat
For production and life needs, coal production enterprises, especially in recent years, have gradually achieved mechanization, automation, and intelligence, requiring a large amount of electricity. Additionally, industrial and civil building heating, shaft air-intake heating, and bathing, among others, sometimes need to purchase heat, and it is necessary to calculate the implied CO2 emissions from both electricity purchased and heat. The necessary calculations are shown as follows:
ECO2electricity is CO2 emissions implied by the net purchased electricity of the company, ton·CO2.
ECO2heat is CO2 emissions implied by the net heat purchased by the company, ton·CO2.
ADelectricity is the power consumption of the company’s net purchases, megawatt-hours (MWh). ADheat is the heat consumption of the company’s net purchase, GJ, in respect of hot water or steam measured by mass. It can be converted into the heat unit GJ.
EFelectricity is the CO2 emission factor for electricity supply, ton CO2/MWh. The emission factor corresponding to the power purchased from the grid and the power supplied by the self-provided power plant adopts the 2015 national grid average emission factor of 0.6101tCO2/MWh.
EFheat is the CO2 emission factor for the heating power supply, ton CO2/GJ, provided by the heating company. The default value is 0.11tCO2/GJ.
Case Study, Result Analysis, and Total Carbon Emission Estimation
According to the model, the factors affecting carbon emissions of coal production enterprises are CH4 dissipation, CO2 dissipation, fuel combustion, and purchased power. Due to the different gas contents in coal seams, CH4 dissipation varies greatly among coal mines. Therefore, to accurately identify the key factors affecting coal mine carbon emissions and estimate the carbon emissions per ton of coal, representative coal mines should be selected for research according to the gas grade. According to the AMCC, approximately 90% of China’s coal production comes from underground coal mines. According to the gas content of and emissions from coal seams, underground coal mines are divided into three categories: low gas mines, high gas mines, and coal and gas outburst mines. This study selects one case from each of the three types of coal mines for research and verifies the model in the Lingzhida coal mine.
Case Study and Model Verification of a Low Gas Mine
Overview of the Lingzhida Coal Mine
The Lingzhida coal mine, located in Changzhi City, Shanxi Province, belongs to the Changzhi mining area of the Qinshui coalfield. The area of the field is 17.6874 km2, and the minable coal seams in the field are the No. 3 coal seam and No. 15 coal seam. The production capacity of the Lingzhida coal mine is 1.50 MTPA. At present, the No. 15 coal seam is mined from shallow to deep. The thickness of the coal seam is 3.5 m. It uses fully mechanized mining and full height mining at the same time. The gas content of coal seam 15 is 1.3–4.9 m3/t, which is a low gas mine. The main carbon emission sources of the Lingzhida coal mine are the return air shaft, raw coal storage yard, coal washing plant, railway loading station, gangue storage plant, underground and ground-level diesel locomotives, and electrical equipment.
Carbon Emission Calculation
The main carbon emission sources of the Lingzhida coal mine are CH4 and CO2 dissipation, fossil fuel combustion (diesel), and purchased electricity.
The relevant data of 2020 are shown in Table 2.

TABLE 2. Data of carbon emission of Lingzhida coal mine in 2020.
The data in Table 2 are substituted into the calculation model constructed above, in which CH4 dissipation is calculated according to the measured statistical method and the source–sink relationship method, and the larger value is used. The calculated results are shown in Table 3.
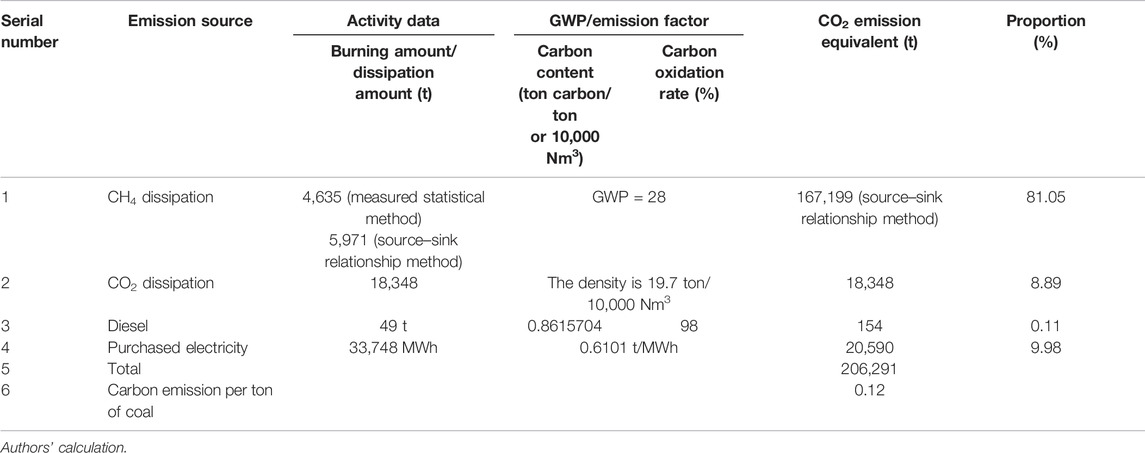
TABLE 3. Calculation results of CO2 emission of Lingzhida coal mine.
The carbon emission ratio of the Lingzhida coal mine is shown in Figure 5.
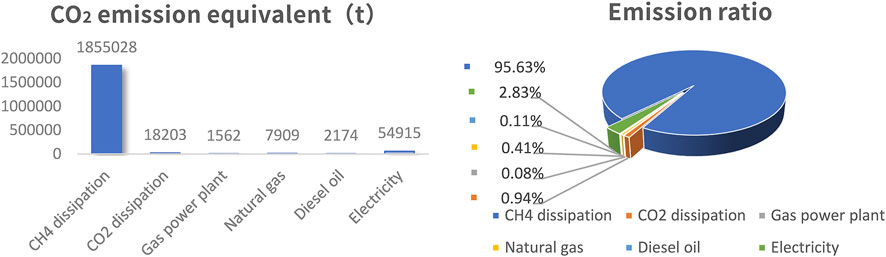
FIGURE 5. Carbon emission by source and emission proportion of Wangpo coal mine.
Model validation
In order to verify the carbon emission calculation model constructed in this study, the calculation method in AMCC is used to calculate the CO2 emissions of the Lingzhida coal mine.
The calculation formula is as follows:
EGHG = ECH4dissipation × GWPCH4+ECO2dissipation+ECO2burn+ECO2torch+ECO2electricity+ECO2heat,
ECH4dissipation = ECH4ug+ECH4mined,
ECH4ug=((∑QCH4ventilate +(∑QCH4drainage −QCH4torch −QCH4usage)) × ρCH4 = 2616t,
ECH4 mined = 1760000 × 0.6/1000 = 1056t。1760000 is the annual output, and 0.6 is selected according to the default value in AMCC, 0.6 kg CH4/ton of raw coal,
ECH4 dissipation = 3672t,ECO2 dissipation = 7188t,ECO2 burn = 154t,ECO2 torch = 0,ECO2 electricity = 20590t,ECO2 heat = 0,
EGHG = 3672 × 28+7188+154+0+20590+0 = 130748 t.
The above calculation results are 36.6% lower than the calculation model constructed in this study (Table 3) because the model in AMCC ignores the unsystematic emission of CH4 and the default value of post-mining activities is too small and additionally ignores the unsystematic emission of CO2 and the dissipation of post-mining activities.
Because the values of unsystematic emissions and post-mining activities are difficult to obtain, the source–sink relationship method effectively calculates the dissipation of CH4 and CO2.
Case Study of a High Gas Mine
Overview of the Wangpo Coal Mine
The Wangpo coal mine, an underground typical high gas mining area, located in northwestern Jincheng city, Shanxi Province, belongs to the Jincheng mining area of the Qinshui coalfield, covering an area of 25.3652 km2. The mineable coal seams in the field are No. 3, No. 9, and No. 15. Among them, the average spacing between No. 3 and No. 9 is 48.27 m, and the average spacing between No. 9 and No. 15 is 38.85 m. The upper part of No. 3 is located in No. 1 and No. 2, which is approximately 0.3 m thick and non-mineable. The spacing is 15 m between No. 2 and No. 3 and 30 m between No. 1 and No. 3. The production capacity of the Wangpo coal mine is 3.0 MTPA. At present, coal seam 3 is mined from shallow to deep. The thickness of the coal seam is 5.76 m. It is mined by fully mechanized top coal caving. The gas content of No. 3 is 5.02–18.77 m3/t, which signifies a high gas mine. The main carbon emission sources of the Wangpo coal mine are the No. 1 return air shaft, No. 2 return air shaft, raw coal storage yard, coal washing plant, railway loading station, gangue storage plant, gas boiler room, gas power station, gas extraction station, underground and ground-level diesel locomotives, and electrical equipment.
Carbon Emission Calculation
The main carbon emission sources of the Wangpo coal mine are CH4 and CO2 dissipation, fossil fuel combustion (diesel, gas, and natural gas), and purchased electricity.
The relevant data for 2020 are shown in Table 4.

TABLE 4. Data of carbon emission of Wangpo coal mine in 2020.
The carbon emission model created in this study is used to calculate the carbon emissions of the Wangpo coal mine. The calculation results are shown in Table 5.
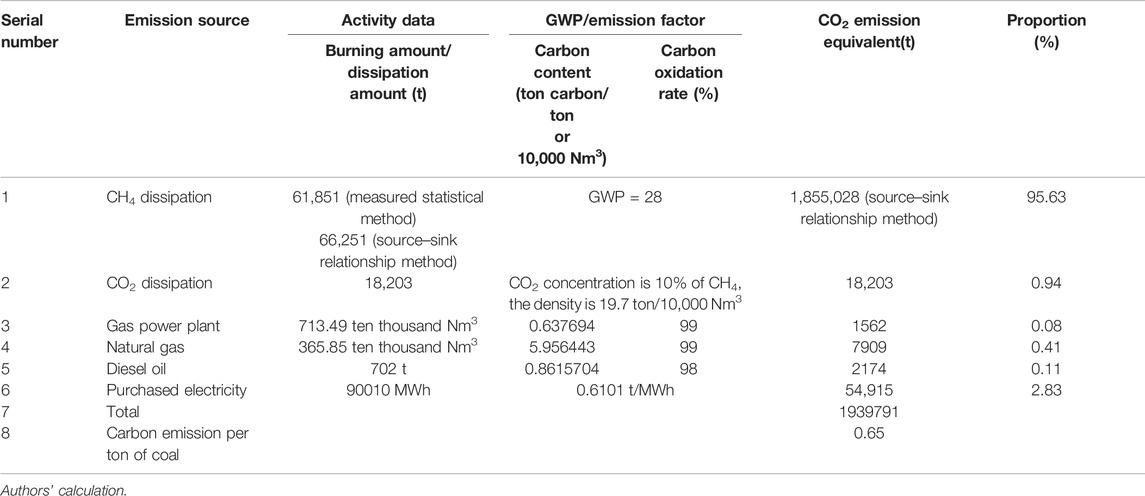
TABLE 5. Calculation results of CO2 emission of Wangpo coal mine.
The carbon emission ratio of the Wangpo coal mine is shown in Figure 6.
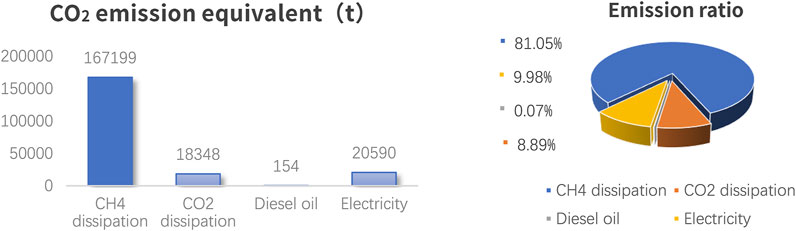
FIGURE 6. Carbon emission by source and emission proportion of Lingzhida coal mine.
Case Study of a Coal and Gas Outburst Mine
Overview of the Zhongheng Coal Mine
The Zhongheng coal mine, located in Hongguo Town, Panxian County, Guizhou Province, belongs to the Panxian coalfield. The Panxian coal field is the main coking coal base in China. Most of the coal mines are coal and gas outburst mines. The area of the minefield is 2.9078 km2, and the minable coal seams in the field are coal seams 1, 3, 4, 8, 12, 15-1, 15-3, 20-1, 22, 23, 24, and 25. The production capacity of the Zhongheng coal mine is 0.90 MTPA. At present, the No. 15-1 coal seam is mined from shallow to deep. The thickness of the coal seam is 2.07 m. It uses fully mechanized mining and full height mining at the same time. The gas content of coal seam 15-1 is 13.88 m3/t, and the Zhongheng coal mine is a coal and gas outburst mine. The main carbon emission sources of the Zhongheng coal mine are the return air shaft, raw coal storage yard, coal washing plant, gangue storage plant, gas power station, gas extraction station, and electrical equipment.
Carbon Emission Calculation
The main carbon emission sources of the Wangpo coal mine are CH4 and CO2 dissipation, fossil fuel combustion (gas), and purchased electricity.
The relevant data for 2020 are shown in Table 6.
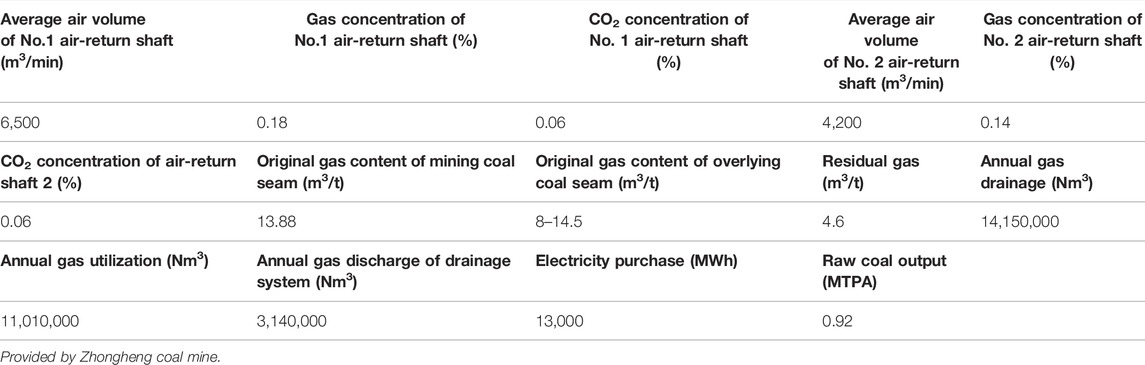
TABLE 6. Data of carbon emission of Zhongheng coal mine in 2020.
The carbon emission model created in this study is used to calculate the carbon emissions of the Zhongheng coal mine. The calculation results are shown in Table 7.
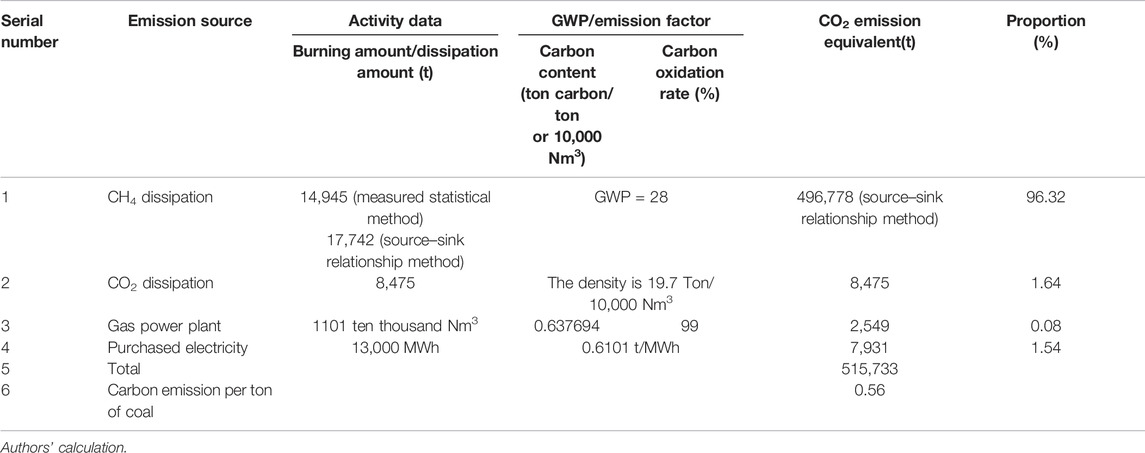
TABLE 7. Calculation results of CO2 emission of Zhongheng coal mine.
The carbon emission ratio of the Zhongheng coal mine is shown in Figure 7.
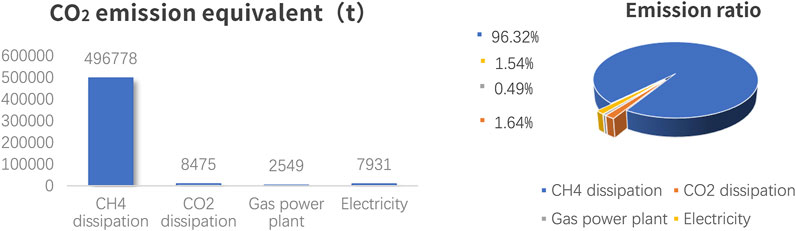
FIGURE 7. Carbon emission by source and emission proportion of Zhongheng coal mine.
Analysis and Comparison of Carbon Emission Data
The comparison of carbon emissions per ton of coal in the Lingzhida coal mine, Wangpo coal mine, and Zhongheng coal mine from 2016 to 2020 is shown in Figure 8.
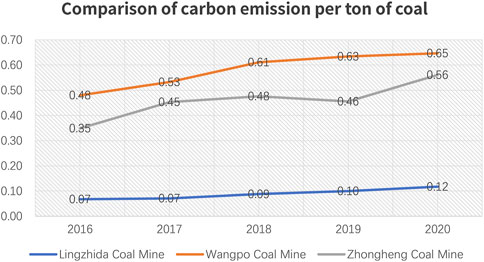
FIGURE 8. Comparison of carbon emission per ton of coal.
The following conclusions can be drawn from Figures 5–8:
① Gas dissipation accounts for more than 80% of the carbon emissions of coal production enterprises, including more than 95% of high gas mines and coal and gas outburst mines. Therefore, coal seam gas content is the key factor affecting the carbon emissions of coal production enterprises.
② For coal mines with different gas grades, the carbon emissions per unit of coal output vary greatly. The carbon emissions per ton of low gas coal mines are significantly lower than those of high gas coal mines and coal and gas outburst coal mines, and the carbon emissions per ton of high gas coal mines and coal and gas outburst coal mines are equivalent.
③ With the increase in mining depth, the carbon emissions of coal production enterprises increase year by year.
Estimation of Total Carbon Emissions in the Coal Industry
In 2020, China’s raw coal output will be 3.902 billion tons (Statistics Bureau of the People’s Republic of China, 2020). The annual output of high gas and coal and gas outburst mines in China accounts for 32.7% of the total output (Sun, 2014), which is 1.276 billion tons, whereas the annual output of low gas mines is 2.626 billion tons. According to the results of carbon emissions per ton of coal shown in Figure 8, it is estimated that, in 2020, the carbon emission equivalent of high gas and coal and gas outburst mines was approximately 770 million tons, the carbon emission equivalent of low gas coal mines was approximately 320 million tons, and the carbon emission equivalent of coal production enterprises was 1.09 billion tons.
Discussion
Compared with the calculation model in AMCC, the carbon emission model of coal production enterprises established in this study optimizes the calculation method of CH4 dissipation and CO2 dissipation, which makes the calculation simpler and the result more objective. It is suitable for solving the problem of calculating the empirical value of open-pit coal mines. The conclusion is verified by the application of the model in the Lingzhida coal mine.
The calculation of carbon emissions of three types of coal mines indicated that gas content is the key influencing factor, and the carbon emissions per ton of coal vary greatly among coal production enterprises with different gas grades. By calculating the carbon emissions per ton of coal, the total carbon emissions of the coal industry are estimated to be 1.09 billion tons. The former conclusion is consistent with the conclusion that the carbon emissions of gas emissions account for the highest proportion in Characteristics Of Carbon Emissions During Coal Development And Technical Approvals For Carbon Neutral Development (Ren et al., 2022), but the total carbon emissions are higher than the 593 million tons estimated in the paper, mainly due to different calculation models. These conclusions are helpful for coal mines to take targeted measures to reduce carbon emissions and for the government to formulate industry planning and policies.
Limited by time and data acquisition, this study selects three types of coal mines to calculate the carbon emissions per ton of coal and then estimates the carbon emissions of coal mines in China. There are few samples, and the estimated value is inaccurate. In future research, the number of samples will be increased.
Conclusion and Policy Recommendations
Conclusion
(1) CH4 dissipation is calculated by the measured statistics method and the source–sink relationship method. The latter calculation result can better reflect the carbon emission activities of coal production enterprises and is suitable for open-pit coal mines.
(2) Coal seam gas content is the key factor affecting the carbon emissions of coal production enterprises, especially in high gas coal mines and coal and gas outburst coal mines, where the proportion of gas dissipation carbon emissions accounts for more than 95%. Therefore, improving the utilization rate of drainage and studying the utilization of low-concentration gas is an important aspect of green coal mining.
(3) Coal mines with different gas grades have huge differences in carbon emissions per unit of coal output. Therefore, carbon reduction policies are formulated according to classification.
(4) The model established in this study estimated that the total carbon emissions of the coal industry will be 1.09 billion tons in 2020, and with the increase in mining depth, the coal seam gas content will increase. If the gas utilization rate is not improved, the carbon emissions will increase. Therefore, policymakers should focus attention on the carbon emissions of the coal industry.
Policy recommendations
The following suggestions are put forward for the responsible department of the coal industry’s response to the national carbon neutralization policy.
(1) To calculate the total carbon emissions and composition of coal production enterprises accurately.
Coal projects that require large investments have a strong effect on economics and are difficult for local governments and enterprises to control the investment impulse. From January to May 2021, the total profit of the national coal mining and beneficiary industry was 161.44 billion (Yuan, 2021), a year-on-year increase of 109.4% (Statistics Bureau of the People’s Republic of China. From January to May 2021). The later the carbon reaches the peak, the greater the peak carbon emission is and the more difficult it is to realize carbon neutrality in the future. Thus, in the context of carbon neutrality, local governments should enhance risk awareness and replan high-carbon projects guided by the goal of carbon neutrality. To this end, the responsible department of the coal industry should accurately calculate the total carbon emissions and composition of China’s coal production enterprises and organize the preparation of the carbon peak and carbon neutrality roadmap of coal production enterprises as soon as possible.
(2) To incorporate coal mine methane emission control into the carbon emission reduction development plan.
As methane dissipation is a key influencing factor of carbon emissions, it is suggested to incorporate coal mine methane emission control into the development plan of carbon emission reduction as soon as possible, formulate methane control objectives and paths, and comprehensively improve the control level of methane emissions. This is a key measure for the coal industry to achieve the goal of peak carbon and carbon neutrality.
(3) To establish more stringent gas drainage and utilization regulation so that all gas should be drained and used only when it can be used.
The existing gas extraction and utilization regulations have low requirements on the gas extraction and utilization rate and lack effective supervision and punishment, resulting in the gas treatment of coal production enterprises mainly addressing air exhaust, so a large amount of gas is directly discharged into the atmosphere. For air exhaust, only the gas concentration of the air-return roadway is controlled; as long as the air volume is large enough, more gas can be discharged. According to research, air exhaust gas accounts for 80% of the total gas emissions of coal mines (Xie et al., 2010). For this reason, stricter gas drainage and utilization regulations must be established, and a coal mine should control not only the concentration of air exhaust gas but also the amount of air exhaust gas per ton of raw coal produced. For gas drainage and utilization, it is also necessary to increase the drainage ratio and utilization ratio so that it can be extracted and used most effectively.
(4) To conduct research on bringing CH4 into the carbon emission trading market.
The carbon emission trading market is an important measure to reduce carbon emissions by using the market mechanism of “punishing enterprises with more carbon emissions and rewarding enterprises with (fewer) carbon emissions.” Bringing methane into the carbon emission trading market is conducive to forcing enterprises to carry out technological transformation and upgrading, improve the utilization rate of gas drainage, and reduce direct gas discharge. It helps encourage coal production enterprises to achieve low-cost carbon emission reduction targets.
(5) To strengthen the prevention and control of spontaneous combustion of coal and gangue, coal gangue must be comprehensively utilized to achieve energy conservation and emission reduction.
The spontaneous combustion of coal and gangue hills produces a large amount of carbon emissions, pollutes the environment, and occupies land resources. If coal gangue is comprehensively utilized, it will not only save energy but also reduce carbon emissions and save land resources. The annual output of coal gangue in China is approximately 700 million tons, and the comprehensive utilization rate of coal gangue resources is 72.2% (Yang and Xu, 2021). At present, the main methods of comprehensive utilization of coal gangue resources include coal gangue power generation, underground filling materials, building materials, road construction, and backfilling of subsidence areas.
(6) To change the concept of “a big horse pulling a small carriage” in coal mine equipment selection and carry out energy-saving transformation of coal mine equipment.
In recent years, coal production enterprises have had better profits to pursue equipment reliability, and they generally choose mining equipment that does not match the capacity of the underground coal mine. The one-sided pursuit of equipment reliability and the selected equipment power requirements consume much electricity, resulting in many indirect carbon emissions through purchasing power. By changing the idea of “a big horse pulling a small carriage” in equipment selection and energy-saving transformation of coal mine equipment, the indirect carbon emissions of purchased electricity can be reduced by over 30%.
(7) To establish the exit schedule of coal production enterprises.
The basic data sheet shall be established by coal mines, and the government will entrust scientific research institutions to measure the gas content of all coal seams in the country to conduct carbon verification. According to the road map of peak carbon and carbon neutrality in the coal industry and the scenario prediction of the end of coal consumption, combined with the service life and carbon emissions of coal mines, the exit schedule of coal production enterprises will be formulated. Detailed plans for the exit schedule, energy supply security, employment resettlement, transformation of related industries, social security and so on should be made.
(8) To strengthen the regulation of coal and power imports and reduce the production of high gas coal mines and long-distance coal transportation.
China’s coal production and selling regions are seriously uneven. Only five provinces and regions, namely, Inner Mongolia, Shanxi, Shaanxi, Guizhou, and Xinjiang, have more coal production than consumption. Guizhou and Xinjiang are mainly transporting coal to neighboring provinces. Large amounts of coal from the three provinces of Inner Mongolia, Shanxi, and Shaanxi are transported to the coastal, riverside, northern, and northeastern regions of the country. For the southeast coastal area, the annual coal consumption is approximately 900 million tons, of which the imported coal is 250 million tons. In China, the southeast coastal areas use Indonesian coal, which reduces the carbon emissions of long-distance coal transportation. At the same time, coal in Indonesia has a low gas content, which can greatly reduce the carbon emissions caused by gas dissipation. For Northeast China and North China, researchers can study the import of coal or electricity from Russia and Mongolia. To ensure energy security, China can obtain resources through purchase, equity participation, collaborative development of coal resources, and other collaboration methods. Chinese coal enterprises should be encouraged to go global; incorporate overseas resource development into national strategies; and gain support in finance, banking, insurance, taxation, and technical assistance, among others. In addition, to maintain the stable import of coal, long-term contracts should be signed.
Data Availability Statement
The original contributions presented in the study are included in the article/Supplementary Material. Further inquiries can be directed to the corresponding author.
Author Contributions
Conceptualization: YL. Data curation: XJ. Formal analysis: GW and YR. Investigation; HT. Methodology: YL and XJ. Software: NL. Validation: XJ. Writing—original draft: XJ, GW, and YR. Writing—review and editing: HT and NL.
Funding
The study was supported by the National Natural Science Foundation Sciences (no. 52074293) and Natural Science Foundation of Hebei Province (no. E2020402041).
Conflict of Interest
Author XJ is employed by China Coal Technology and Engineering Group International Engineering Co., Ltd. and studied at China University of Mining and Technology-Beijing. Author GW is employed by China Coal Technology and Engineering Group International Engineering Co., Ltd.
The remaining authors declare that the research was conducted in the absence of any commercial or financial relationships that could be construed as a potential conflict of interest.
Publisher’s Note
All claims expressed in this article are solely those of the authors and do not necessarily represent those of their affiliated organizations or those of the publisher, the editors, and the reviewers. Any product that may be evaluated in this article, or claim that may be made by its manufacturer, is not guaranteed or endorsed by the publisher.
References
Brodny, J., and Tutak, M. (2016).Analysis of Methane Emission into the Atmosphere as a Result of Mining Activity. 16th ed. Sofia, Bulgaria: International Multidisciplinary Scientific GeoConference SGEM 3, 83–90. Book 4.
Cai, F., Yang, L., Yuan, Y., and Taghizadeh-Hesary, F. (2022). The Application of an Improved Fuzzy Comprehensive Evaluation in Coal Quality Rating: The Case Study of China. Front. Energy Res. 9, 752472. doi:10.3389/fenrg.2021.752472
Climate change response Department of national development and Reform Commission, (2011). Guidelines for the Preparation of Provincial Greenhouse Gas Inventories (For Trial Implementation). China: National Development and Reform Commission.
Coalrennet (2020). Since October, the Average Transportation Distance of National Coal Transportation Orders Has Been 1204. China: Meitanren. km[EB/OL]. http://www.coalren.org/bencandy.php?fid=214&id=34427.
Intergovernmental Panel on Climate Change (2006). IPCC Guidelines for National Greenhouse Gas Inventoriess EnergyStationary Combustion, 2. Japan: IGES. Availabe at: https://www.ipcc-nggip.iges.or.jp/public/2006gl/pdf/2_Volume2/V2_2_Ch2_Stationary_Combustion.pdf (Accessed June 27, 2021).
Li, D. (1992). Method for Determination of Residual Gas Content of Coal. J. Saf. Coal. Min. (09), 5–8.
Li, P., Yu, H., Zhang, J., Du, M., and Xiong, J. (2021). Coal Supply Sustainability in China: A New Comprehensive Evaluation Methodology. Front. Energy Res. 9, 701719. doi:10.3389/fenrg.2021.701719
Liu, J., and Wang, C. (2013). Carbon Emission Calculation and Evaluation of Coal Enterprise. J. Coal. Min. Technol. 18 (6), 99–102. doi:10.13532/j.cnki.cn11-3677/td.2013.06.030
Ministry of ecology and environment (2021). Guidelines for Accounting Methods and Reporting of Greenhouse Gas Emissions by Enterprises Power Generation Facilities. China: Ministry of Ecology and Environment.
Ministry of Natural Resources PRC (2021). China Mineral Resources 2020. China: Ministry of Land and Resources.
National Development and Reform Commission of the people's Republic of China (2014). Guidelines for Accounting Methods and Reporting of Greenhouse Gas Emissions of China's Coal Production Enterprises (For Trial Implementation). China: National Development and Reform Commission.
IPCC (2014). Climate Change 2014: Synthesis Report. Contribution of Working Groups I, II and III to the Fifth Assessment Report of the Intergovernmental Panel on Climate Change Core Writing Team. Editors Pachauri R. K., and Meyer L. A. (Geneva, Switzerland: IPCC), 151.
Ren, Shihua, Xie, Yachen, Jiao, Xiaomiao, Xie, Heping, et al. (2022). Characteristics of Carbon Emissions during Coal Development and Technical Approaches for Carbon Neutral Development. J. Adv. Eng. Sci. 54 (1), 60–68. doi:10.15961/j.jsuese.202100924
Statistics Bureau of the people's Republic of China (2020). China Statistical Yearbook. China: National Bureau of Statistics.
Statistics Bureau of the people's Republic of China (2021). From January to May 2021, the Profits of Industrial Enterprises above Designated Size Increased by 83.4% Year-On-Year, with an Average Increase of 21.7% in Two Years. China: National Bureau of Statistics. [EB/OL] http://www.stats.gov.cn/tjsj/zxfb/202106/t20210627_1818792.html.
Sun, Q. (2014). Research on Status Quo and Prevention Countermeasures of Coal Mine Gas Disaster in China. J. Saf. Coal. Min. 40 (03), 116–119. doi:10.19880/j.cnki.ccm.2014.03.027
Tutak, M., and Brodny, J. (2019). Forecasting Methane Emissions from Hard Coal Mines Including the Methane Drainage Process. Energies 12 (20), 3840. doi:10.3390/en12203840
Wang, B., Cui, C.-Q., Zhao, Y.-X., Chen, M., and Yuan, X.-C. (2019b). Climate Change Mitigation in the Coal Mining Industry: Low-Carbon Pathways and Mine Safety Indicators. Nat. Hazards 95 (1-2), 25–38. doi:10.1007/s11069-018-3438-1
Wang, B. J., Zhao, J. L., and Wei, Y. X. (2019a). Carbon Emission Quota Allocating on Coal and Electric Power Enterprises under Carbon Trading Pilot in China: Mathematical Formulation and Solution Technique. J. Clean. Prod. 239, 118104. doi:10.1016/j.jclepro.2019.118104
Wang, N., Wen, Z., and Zhu, T. (2015). An Estimation of Regional Emission Intensity of Coal Mine Methane Based on Coefficient-Intensity Factor Methodology Using China as a Case Study. Greenh. Gas. Sci. Technol. 5, 437–448. doi:10.1002/ghg.1485
Wang, X., Li, L., and Zhao, F. (2021). Decomposition Analysis of CO2 Emissions in Northeast China: Insights From Investment Factors. Front. Energy Res. 9, 777290. doi:10.3389/fenrg.2021.777290
Wang, X., Liang, S., Wang, H., Huang, S., and Liao, B. (2022). Do Fossil-Fuel Price Distortions Impact the Low-Carbon Transition in China's Energy Intensive Industries? Front. Energy Res. 9, 805224. doi:10.3389/fenrg.2021.805224
Xie, K., Yuan, M., Ma, K., Li, B., and Chen, W. (2010). Research on the Utilization of Ventilation Air Methane in Colliery in China. Coal. Mine. Mod. 95 (2), 1–2. doi:10.3969/j.issn.1009-0797.2010.02.001
Xinhuanet (2021). Xi Jinping's Speech at the "leaders Climate Summit. China: Xinhuanet. [EB/OL]. http://www.xinhuanet.com/politics/leaders/2021-04/22/c_1127363132.htm.
Yang, F., and Xu, H. (2021). Analysis on the Development Path of Ecological Environment Protection and Resources Comprehensive Utilization in Coal Industry during the 14th Five-Year Plan Period. J. China Coal. 47 (5), 73–82. doi:10.19880/j.cnki.ccm.2021.05.012
Yuan, L. (2021). Study on the Development Strategy of Coal Mine Safety in China. J. China Coal. 47 (6), 1–6. doi:10.19880/j.cnki.ccm.2021.06.001
Keywords: coal production enterprises, total carbon emissions, calculating model, calculating method, classified accounting
Citation: Li Y, Jin X, Wang G, Ren Y, Tan H and Li N (2022) Construction and Application of a Carbon Emission Model for China’s Coal Production Enterprises and Result Analysis. Front. Energy Res. 10:889877. doi: 10.3389/fenrg.2022.889877
Received: 04 March 2022; Accepted: 09 June 2022;
Published: 08 July 2022.
Edited by:
Jingying Fu, Chinese Academy of Sciences (CAS), ChinaReviewed by:
Yuntao Liang, CCTEG Shenyang Research Institute, ChinaShaobin Wang, Chinese Academy of Sciences (CAS), China
Fangtian Wang, China University of Mining and Technology, China
Copyright © 2022 Li, Jin, Wang, Ren, Tan and Li. This is an open-access article distributed under the terms of the Creative Commons Attribution License (CC BY). The use, distribution or reproduction in other forums is permitted, provided the original author(s) and the copyright owner(s) are credited and that the original publication in this journal is cited, in accordance with accepted academic practice. No use, distribution or reproduction is permitted which does not comply with these terms.
*Correspondence: Xiangyang Jin, 45805801@qq.com