Numerical study on influence of wind on thermal performance of a solid particle solar receiver
 Zhenzhong Li
 Bowen Wang1
  Liangjin Xu
 Shanshan Bu
 Deqi Chen
- 1Key Laboratory of Low-grade Energy Utilization Technologies & Systems of Ministry of Education of China, School of Energy and Power Engineering, Chongqing University, Chongqing, China
- 2School of Civil Engineering, Chongqing University, Chongqing, China
- 3School of Chemical Engineering and Technology, Xi’an Jiaotong University, Xi’an, SN, China
The effects of wind speed and wind attacking angle on the thermal performance of a solid particle solar receiver (SPSR) are studied by numerical simulation. In addition, the effect of aerowindow on the efficiency of the solar receiver is also explored. The results show that under different wind speeds and attack angles, wind can differently prevent hot air from flowing out and carry cold air into the solar receiver. These two effects compete with each other, resulting in the complex influence law of wind on receiver efficiency. Generally, the increasing wind speed will eventually lead to a negative effect on the thermal efficiency of the receiver. At the incident radiation aperture, the aerowindow formed by the air nozzle can effectively reduce convection heat loss and significantly improve the receiver efficiency. Under the simulation conditions of the present study, there is an optimal air jet velocity to maximize the protection effect of the aerowindow. The heat receiver efficiency increases from 41.7 to 58.2% when the wind is 2.5 m/s and the wind attacking angle is 135°. In the analysis of the energy balance inside the solar receiver, the proportion of radiation heat loss is about one-third, and it is not affected by the aerowindow. Thus, reducing radiation heat loss is very important for further improving the receiver’s efficiency of SPSR.
Introduction
The large-scale use of traditional fossil energy has brought about air pollution, climate warming, and other environmental issues. The development and utilization of clean renewable energy represented by solar energy are of great significance to the sustainable development of the human society (Gilbert, 2021). Tower solar power is an attractive technology in large solar power stations by virtue of its high heat-transfer efficiency, concentrated energy, ease to store energy, and so on (Alexopoulos and Hoffschmidt, 2010) As one of the core components of the tower solar power system, thermal performance of the solar receiver plays the decisive role in solar thermal power generation (Yang et al., 2017). As the heat-transfer medium of the solar receiver, solid particles have the advantages of a high heat absorption temperature and easy coupling with thermochemical energy storage systems (Peng et al., 2021). In addition, solid particle solar receiver (SPSR) coupling the sCO2 Brayton cycle is one of three kinds of concentrating solar power in the third generation of SunShot Plan (Mehos et al., 2017). A study on the thermal performance of SPSR and its influence factors is of great significance to the technology for practical industrial applications.
Since Sandia National Laboratory in the United States proposed solid particles as heat absorption and transfer media of concentrating solar power in the 1980s, researchers carried out many experiments and numerical simulation studies on SPSR from the aspects of receiver structure, particle types, characteristic parameters, and flow characteristics (Hruby et al., 1984; Clifford, 2016; Lopez et al., 2016; Sharaf et al., 2019; Li et al., 2020; Marianne et al., 2021). Wang et al. (2017) carried out dynamic thermal performance experiments on a falling particle receiver of a single quartz tube and found that particle diameter, particle inlet temperature, particle flow, and type of quartz tube had a significant influence on the temperature of particles at the outlet. Nie et al. (2019) tested in experiments the influence of particles made of nine different kinds of materials on receiver efficiency, with the results showing that three kinds of materials, namely, silicon carbide, gray ceramsite sand, and bauxite-cordierite ceramics with good solar weighted absorptivity and anti-sintering properties, could be taken as good candidates of heat absorption media in SPSR systems. Aiming at the falling process of a single particle inside a solar receiver, Wang et al. (2016) found through numerical simulation that when a solid particle had a relatively large diameter, the resulting convection losses and radiation losses were smaller and the particle could reach a higher maximum temperature. Under 920 kW/m2 incident radiation intensity, Chen et al. (2007a) found through numerical simulation that the particle cluster where the initial temperature was 300 K could be heated to 1.559 K to the maximum. They also found that the particle outlet temperature was inversely proportional to its diameter. Siegel et al. (Siegel and Kolb, 2008; Siegel et al., 2010) found through experiments and numerical simulations that the heat receiver efficiency of the particle would be improved with the increase in mass flow rate of solid particles. Under some circumstances, the thermal efficiency of the solar receiver could reach up to 70%. In addition, other studies had fully demonstrated the feasibility and suitability of the SPSR (Sarker et al., 2018; Jiang et al., 2019; Nie et al., 2020). However, there was a major problem in the application of SPSR in tower solar thermal power plants: the existence of environmental wind reduced the efficiency of the heat absorbers significantly.
In fact, wind will not only interfere with solid particles' flow inside the falling particle solar receiver but also influence energy transfer between particles and air inside it, thus significantly affecting the receiver efficiency. In cold-state experimental studies for wind effects on particles in a solar receiver, Kibum et al. (2010) found that when the wind speed was 6.5 m/s and the wind direction angle was 45°, the particle loss was about 10% and particles closer to the back wall would be less susceptible to wind. Chen et al. (2007b) numerically studied the influence of solar receiver opening on it. The result shows that the opening area will result in more convection losses and stronger cold air convection between particles and entrainment air. Tan et al. (2009) numerically studied the influence of wind speed and wind attacking angle on the thermal performance of solar receivers. They found that wind had an obvious influence over receiver efficiency and particle temperature. Xiao et al. (2012) quantitatively analyzed through numerical simulation changes of convection heat losses of a solar receiver with wind speed, wind attacking angle, and inclination angle of the receiver. The result shows that under the combination of a specific wind attacking angle and inclination angle, there is a critical wind speed which makes the convection heat losses of the solar receiver less than the natural convection heat losses.
In order to reduce the adverse influence of wind and particle loss on the thermal performance of falling particle solar receivers, researchers proposed different improvements. Tan et al. (2015) studied numerically the influence of aerowindow on the performance of SPSR and found that an aerowindow could significantly improve the efficiency of solar receivers. Yong et al. (2011) installed a quartz glass window to separate the internal and external flow fields of a solar receiver at its aperture. Although a quartz glass window could effectively solve issues brought about by wind, it was very expensive due to large-area high transparency. Maag et al. (2011) thought that the inclination angle of the solar receiver aperture was important and found through numerical simulations that a down-flow solar receiver with a certain inclination angle could reduce particle loss and convection heat loss but increase additional radiation heat loss. Qaisrani et al. (2019) added a wind shield at the periphery of a solar receiver, which showed an excellent thermal insulation effect in the direction of adverse wind. When the wind speed was 9 m/s, a 1 m wide windshield could reduce convection heat loss by up to 33%. Through numerical simulations, Ho et al. (2014) found that the aerowindow formed by an upward air jet at the bottom of the receiver aperture could reduce particle loss when particles were released near the aperture in the presence of external wind. Through numerical simulation, they showed that the convective losses were reduced by 3.5 percentage points with the presence of an air curtain when the initial particle temperature was 600°C.
Although numerous studies had shown that wind could cause negative effects that reduce the thermal performance of a falling particle solar receiver and an aerowindow was an effective measure to reduce this effect, there is a lack of comprehensive data under different wind conditions to summarize the reason and degree of efficiency reduction. For example, the effect of backflow behind the solar receiver has not been evaluated in existing studies. In addition, how an aerowindow works and its efficiency improvement ability also need further research. In this study, the external wind field of the solar receiver was expanded to increase the wind direction of wind, and air backflow at the back of the falling particle solar receiver was considered at the same time. Based on actual wind conditions in Hami prefecture, Xinjiang, China, change rules on the thermal performance of the solar receiver were studied under different wind speeds and wind attack angles. In addition, by quantifying the proportion of convective and radiant heat loss in the process of energy conversion inside the receiver, the improvement ability of the air window on the thermal performance of the solar receiver was analyzed.
Mathematical and physical model
Physical models
The geometrical model of the falling particle solar receiver is shown in Figure 1, and its specific dimensions are as follows: 3 m height, 2 m length, and 1.58 m width. The wall thickness is 0.1 m. The solar receiver has a 1.5 m × 1.5 m open aperture of concentrated solar incident radiation in its front, where the lower edge is 0.1 m away from the internal bottom of the solar receiver. As is shown in Figure 1B, a 1.5 m × 0.1 m rectangular air nozzle is installed on the upper edge of the aperture and air blown out from the nozzle vertically can form an aerowindow that can cover the incident radiation aperture. The top of the solar receiver is provided with a rectangular particle feed opening (1.5 m long and 0.04 m wide) which is 0.25 m away from the internal face of the back wall (shown in Figure 1C). The CARBO-HSP sphere particle which contains mainly bauxite and about 7% iron oxide is used as a heat absorption particle (Tan et al., 2009).
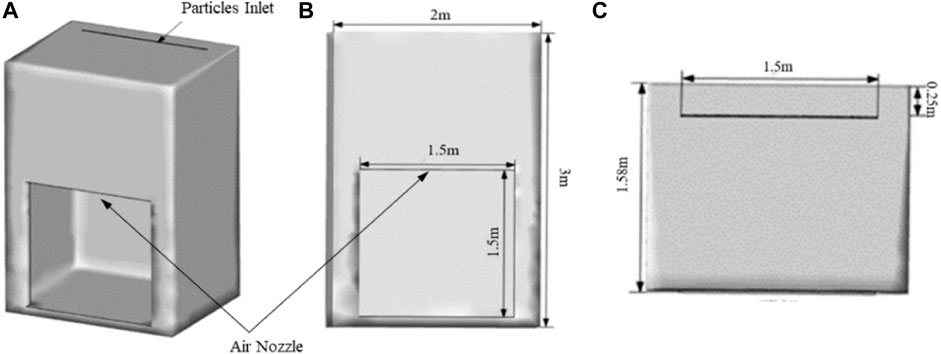
FIGURE 1. Geometrical model of SPSR. (A) isometric view, (B) front view, (C) vertical view.
In order to study the influence of wind on the thermal performance of SPSR, internal and external flow fields of the solar receivers are both calculated in the simulation. The sketch of the computational domain is shown in Figure 2. Theoretically, the larger the external wind field area is, the more accurate the calculation results are. As shown in Figure 2, the external wind field area can be determined by L and S. Tan et al., 2009 studied the effects of the lengths of L and S on the numerical results. They found that the difference in calculation results was within 5% when L ≥ 7 m and S ≥ 3 m. Therefore, the values of L and S are set as 7 and 3 m in the present study, respectively. It is worth mentioning that in studies made by Tan et al. (2009) and Ho et al. (2014), the area at the back of the solar receiver was not calculated. As shown in Figure 2, this study extended the L length at the back of the solar receiver as the computational domain, which not only considered air backflow at the back of the solar receiver but also considered wind conditions under wind attack angles of 135° and 180°. As shown in Figure 2, point A and point B locate at the central plane of the solar receiver aperture and these two points can be used for subsequent grid independence analysis. Point A is inside the solar receiver, and point B is at the radiation inlet. The coordinates of point A and point B are (-1 m,1 m, 0 m) and (-1 m,1 m, 0.79 m), respectively.
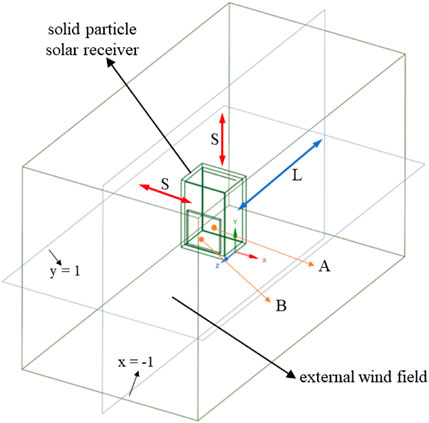
FIGURE 2. Computational domain.
Mathematical models
In the present numerical study, both the ambient wind and the loaded solar radiation are steady boundary conditions. In addition, the particle flow and the interphase heat transfer are also assumed to be steady states. Therefore, steady-state calculations are adopted and the Reynolds-averaged Navier–Stokes (RANS) equations are employed to describe the fluid flow. The air inside the solar receiver and in the external wind region is regarded as an incompressible ideal gas. The continuity equation and momentum equation under Cartesian coordinate systems are written as
where
where
where
Heat transfer within the computational domain is described through an energy equation, and it can be expressed as
where
The DO radiation model is adopted to calculate solar radiation and consider radiation heat exchange inside the solar receiver. The control equation of radiation is as follows:
where
The discrete particle model (DPM) is used to describe the movement and heat exchange of solid particles inside the solar receiver. The velocity and temperature of particles are obtained through integrating the particle motion equation under the Lagrange coordinate system and the differential equation for heat transfer. Speed- and temperature-governing equations of solid particles are as follows:
where
where
Boundary conditions and numerical method
Boundary conditions constitute a complete mathematical description of physical problems in conjunction with the governing equations. In the fluid flow calculation, the solar receiver’s walls are considered as no-slip wall boundary conditions. The inlet of the external wind field is set as the velocity inlet, and other boundaries of the external wind field are set as pressure outlets. The air nozzle at the upper surface of the incident radiation aperture is set as the velocity inlet boundary. Because the outer wall of SPSR will be set with an insulating layer in the actual engineering application, the wall of the solar receiver is set as an adiabatic boundary condition. For the radiation equation, the emissivity of the wall is 0.8 and the particle emissivity equals 0.9. The diffuse fractions for the visible light band and the infrared band are 0.9 and 1.0, respectively. When operating in actual engineering, the sunlight is concentrated by the mirror field. The mirror field usually covers a large area, and the solar receiver is in a high position. Therefore, the solar flux is assumed to be uniformly distributed. The intensity of solar radiation entering the solar receiver via incident radiation aperture is 920 kW/m2 (Tan et al., 2009). Solid particles are released to the solar receiver in the form of surface injection at the particle inlet opening with a mass flow rate of 5 kg/s. The initial particle's initial speed is 0.088 m/s. The initial particle temperature is 873 K. The particles are trapped by the wall when particles reach the bottom of the solar receiver. Thus, there is no hopper in the present geometry model.
As shown in Figure 3, wind attack angle α is the angle between the wind direction and normal direction of the radiation inlet of the solar receiver on the XZ section, while the β angle is the angle between the wind direction and normal direction of the radiation inlet of the solar receiver on the YZ section. The wind speed is set in accordance with actual conditions in Hami, Xinjiang, which is a solar energy industry base in China. According to data from China Meteorological Data Network, the maximum monthly average wind speed is 7.93 m/s between 2020 and 2021 in Hami. Therefore, the maximum wind speed (
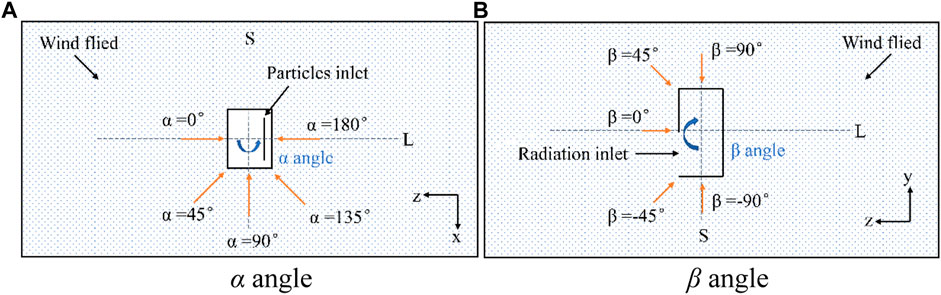
FIGURE 3. Schematic diagram of wind angles, the α angle and β angle. (A) schematic diagram of α angle, (B) schematic diagram of β angle.
The commercial software ANSYS Fluent 19.2 was used to conduct the present numerical study. A pressure-based solver is used in this research for the solution of the fluid flow field, in which the pressure velocity coupling method is the coupled algorithm. The pressure gradient term is discretized by the PRESTO! scheme, and convective terms in momentum and energy equations are discretized by a QUICK scheme. The second-order central difference scheme is used to discrete dissipation terms. During the simulation, when the monitored residuals were less than predetermined limits and there were no changes in temperature of monitoring point A and monitoring B, it was considered that computation reaches convergence.
Grid-independence verification
As is well known, the basic principle of computational fluid dynamics is to divide the computational domain into many small control volumes and then discretize governing equations into algebraic equations in each control volume and obtain the flow field and temperature field through a solution of these algebraic equations. Therefore, a suitable grid system is the key to obtaining reasonable computation results. When generating grids, hexahedral elements with multiple nodes and a higher computation accuracy are selected as volume grids. Local size is added at internal and external walls of the solar receiver for local mesh refinement of the solar receiver area. In order to avoid the influence of grid number on computation results, the grid-independent test was carried out and five kinds of grids with a total of 340 thousand, 1.09 million, 1.68 million, 2.54 million, and 3.36 million grids are obtained through changing refinement surface grid size and volume grid size.
Numerical calculations are performed based on the previous five kinds of grids in the case of no wind conditions. When numerical simulations reach convergence, the temperatures at point A and point B are shown in Figure 4. It can be seen from the figure that when grids are more than 1.68 million, the changes in temperature difference at point A and point B are less than 3%, and it can be confirmed that computation results are unrelated to grid number. To save computation time while guaranteeing computation accuracy, 1.68 million grids are employed for subsequent conditions. The grid system used in the present study is shown in Figure 5.

FIGURE 4. Grid independence verification.
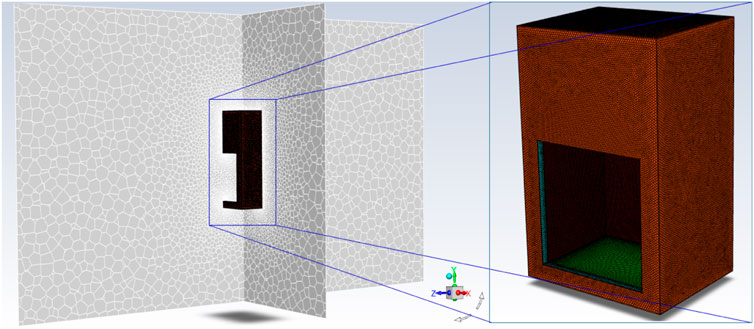
FIGURE 5. Diagram of the computational mesh.
Model verification
In order to verify the fluid flow and heat-transfer models in the present numerical simulation, fluid flow and heat transfer in the free falling particle curtain are calculated and numerical results are compared with experimental data. The experiment made by Hruby et al. (Hruby et al., 1988) in the Sandia National Laboratories (SNL) was performed to evaluate a high-temperature central receiver concept. In this benchmark study (Hruby et al., 1988), external solar radiation is not added, with an ambient temperature of 300 K, the mass flow rate of a particle of 0.04 kg/s and the initial temperature at the inlet of 773 K, a density of 3,130 kg/m3, and a specific heat capacity of the particle of 1,255 J/(kgK). Changes in dimensionless velocity and temperature of particles with falling height are shown in Figure 6. The dimensionless velocity
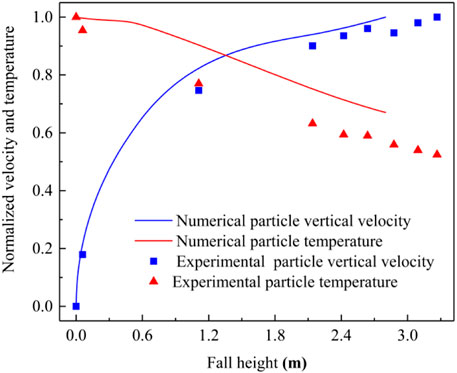
FIGURE 6. Changes of dimensionless velocity and temperature with falling height of particles.
In the abovementioned equations,
Results and discussions
Receiver efficiency
where

FIGURE 7. Temperature distribution during the process of particle falling.
Influence of wind on receiver efficiency under different α angles
The existence of wind will obviously change the internal flow field of the solar receiver so as to affect the heat-transfer process of particles. When there is no aerowindow protection, changes in receiver efficiency under different α wind attack angles and wind speeds are shown in Figure 8. In the case where the wind speed is 0, the average outlet temperature of particles of the solar receiver is 1,058.6 K and the corresponding thermal efficiency is 46.8%. When the wind speed is low, the receiver efficiency under all α angles will be on the decline. While the wind speed is high, the receiver efficiency under different α angles will vary. When the wind attack angle α is 0° and 90°, the receiver efficiency gradually declines with the increase of wind speed. However, when the wind attack angle α is 45°, 135°, and 180°, the receiver efficiency will increase with the increase in wind speed after the wind speed reaches 2 m/s. When the wind speed is 8 m/s and α = 0°, the resulting average outlet temperature of particles is 1,007.2 K and the corresponding receiver efficiency is 35.2%, which is the minimum value in the present study. When α = 180°, the highest average outlet temperature is 1,089.5 K and the receiver efficiency is 56.7%.
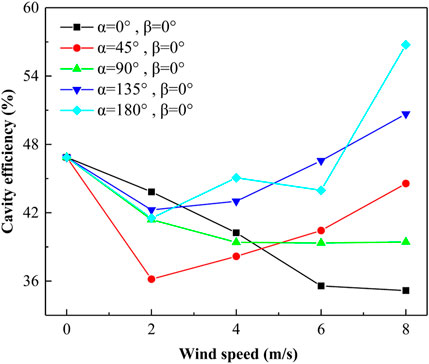
FIGURE 8. Changes in receiver efficiency under different α angles and wind speeds.
Flowing in of external cold air and flowing out of internal hot air of the solar receiver jointly affect the outlet temperature of particles and the heat receiver efficiency of the solar receiver. When the wind attack angle α is 0° and 45°, respectively, the temperatures inside the solar receiver and in surrounding areas are shown in Figure 9. When α = 0° and the wind speed is low, flowing out of hot air continuously lowers the receiver efficiency. When the wind speed is high, although cold air which is blown in head-on will prevent the hot air from flowing out, a large amount of cold air enters, further lowering the efficiency. When the wind speed is low, cold air blown in under α = 45° will increase internal turbulence and cause more hot air to be flowed out and the receiver efficiency to sharply decline. As shown in Figure 9B, when the wind speed is higher than 6 m/s, cold air blown slantwise can better prevent hot air from flowing out and high pressure from hot air in the solar receiver will restrain the blowing in of cold air, consequently obviously increasing the efficiency.
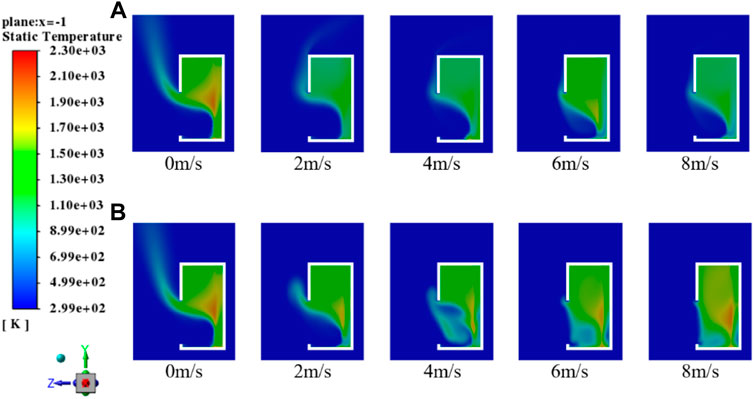
FIGURE 9. Internal temperature distribution of the solar receiver under different wind speeds: (A) α = 0°, β = 0°; (B) α = 45°, β = 0°.
When the wind speed reaches 8 m/s, the receiver efficiency is lower than that when the wind speed is 0 under α < 90° and is higher than that when the wind speed is 0 under α > 90°. The air velocity vector at the radiation inlet of the solar receiver when the wind attack angle α is 45°, 90°, and 180° is shown in Figure 10. The plane of the velocity vector diagram can correspond to the view in Figure 2 and Figure 3. The red and black arc arrows in the figure represent the flow process of hot and cold air, respectively, and similarly hereinafter. It can be seen from Figure 10 that under α = 45°, nearly all cold air will flow from the outside of the solar receiver and hot air in the solar receiver will backflow due to obstruction of cold air, with less convection heat losses and hot air flowing out, resulting in a higher receiver efficiency. Under α = 90°, due to the viscosity of air, the high-speed wind will form a vortex at a certain angle at the solar receiver inlet. This eddy blows a large amount of cold air into the receiver and brings out hot air, which causes more convection heat losses, which consequently result in a lower receiver efficiency. Under α = 180°, the cold air vortex vertical to the solar receiver inlet and the pressure of hot air inside the solar receiver are in a balanced state, which can better prevent hot air in the solar receiver from flowing out. Meanwhile, cold air flows away from two sides basically with few convection heat losses, and the receiver efficiency reaches the highest at the same time.
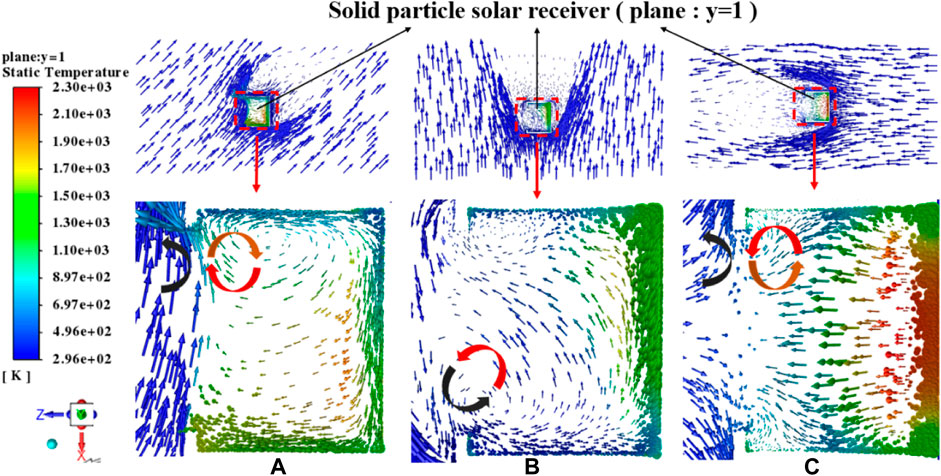
FIGURE 10. Velocity vector distribution at the inlet of the solar receiver under different α angles: (A) α = 45°, β = 0°; (B) α = 90°, β = 0°; (C) α = 180°, β = 0°.
Influence of wind on receiver efficiency under different β angles
When there is no aerowindow protection, variations of receiver efficiency under different β wind attack angles and wind speeds are shown in Figure 11. When the wind speed is less than 2 m/s, the influence of the β angle on receiver efficiency is similar to that of the α angle on receiver efficiency. However, when the wind speed is high, the receiver efficiency under different β angles varies. When the wind speed is 6 m/s, the highest particle outlet temperature is 1,096.2 K when the β angle is -90° and the receiver efficiency is 58.5% at this time. When the speed is more than 6 m/s, the receiver efficiency under different β angles will be on the decline with the increase of wind speed.
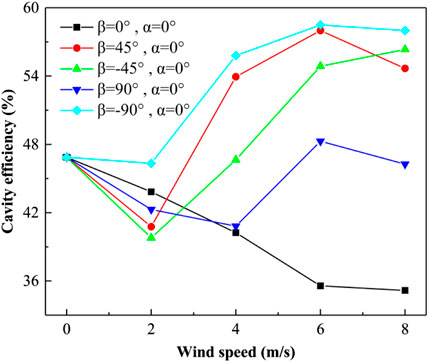
FIGURE 11. Receiver efficiency under different β angles and wind speeds.
Under different β angles and wind speeds of 2, 6, and 8 m/s, the velocity vector field around the solar receiver inlet is shown in Figure 12. When the wind speed is 2 m/s, hot air cannot be effectively prevented from flowing out due to insufficient wind power, and some cold air is blown into the solar receiver in different ways, resulting in varying degrees of convection heat losses and a decline in receiver efficiency. When the wind speed reaches 6 m/s, wind can better prevent hot air from flowing out, so there will be a great increase in receiver efficiency. However, when the wind speed is more than 6 m/s, high-speed wind can prevent hot air from flowing out but also carry cold air into the solar receivers, causing a decline in receiver efficiency instead. According to the above analysis, wind can play the role of preventing hot air from flowing out and carrying cold air into the solar receiver. Preventing hot air from flowing out can improve the receiver efficiency, while carrying cold air into the solar receiver will reduce the receiver efficiency. Under different wind speeds and attack angles, wind’s capacity of preventing hot air from flowing out and carrying cold air into the solar receiver varies and the combined effect of these two actions determines the influence of wind on the thermal efficiency of the solar receiver.
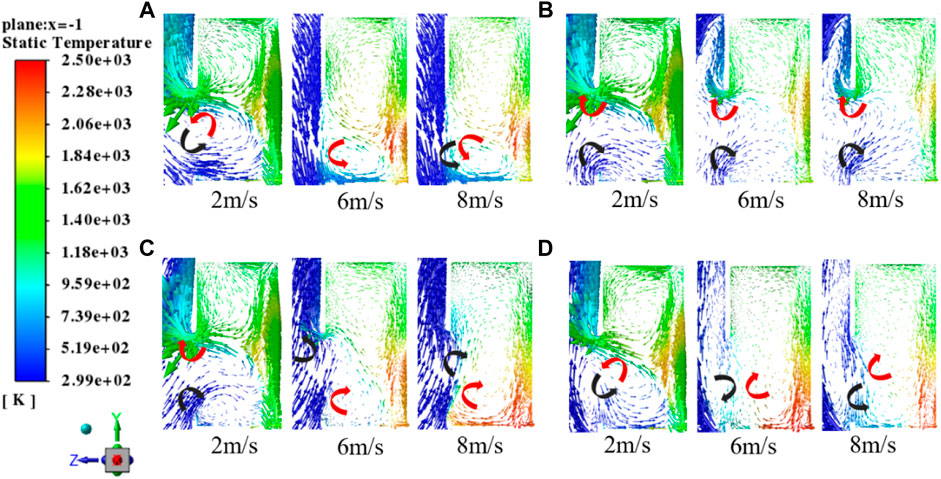
FIGURE 12. Velocity vector distribution near the solar receiver inlet under different β angles: (A) α = 0°, β = 45°; (B) α = 0°, β = 90°; (C) α = 0°, β = -45°; (D) α = 0°, β = -90°.
Influence of air jet velocity of the aerowindow on the performance of the solar receiver
According to the above-mentioned analysis, the main causes for the decline in receiver efficiency are as follows: 1) hot air in the solar receiver flows out from the solar receiver via the incident radiation aperture and 2) cold wind blown into the inside of the solar receiver. From Figure 12, it can be seen that the escape of hot air occurs mainly in the upper region of the incident radiation aperture. Therefore, air flow ejected from the upper boundary of the solar receiver aperture and the air curtain forming at the incident radiation aperture can prevent hot air in the solar receiver from flowing out and external cold air from invading so as to increase the receiver efficiency. Based on the wind direction rose diagram, the average wind speed, and the maximum wind speed in Hami City, conditions of α = 0° and
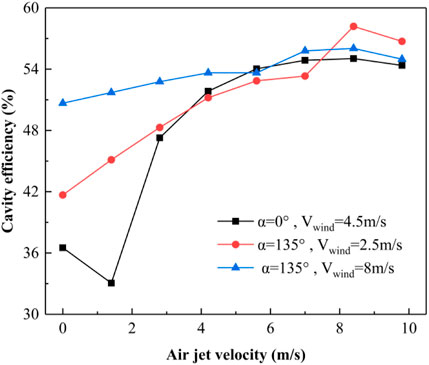
FIGURE 13. Receiver efficiency under different air jet velocities of the aerowindow.
Under the condition of α = 135° and
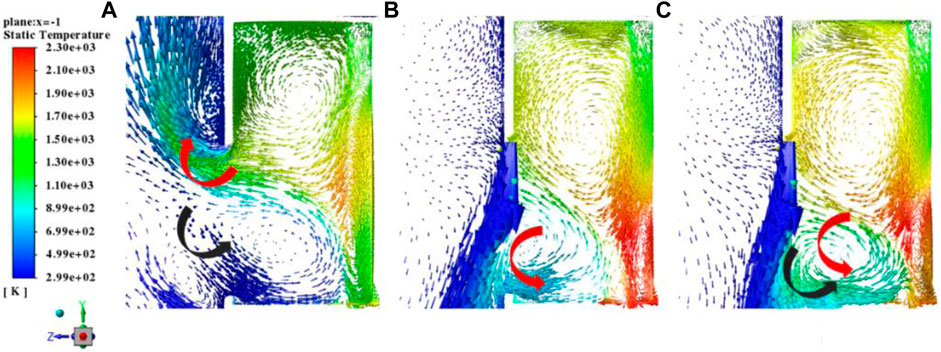
FIGURE 14. Velocity vector distribution at the solar receiver inlet under different air jet velocities: (A)
In order to further illustrate the ability of the aerowindow to improve the thermal efficiency of the solar receiver, an energy balance calculation of the incident radiation aperture is carried out. The internal energy conversion process of the solar receiver is analyzed through specific numerical values. For the conditions in Figure 13, the corresponding ratios of convection heat loss and radiation heat loss under different air jet velocities are shown in Figure 15. As the air jet velocity increases, the convection heat loss ratio of the solar receiver gradually decreases. After the jet velocity becomes greater than 8.4 m/s, the convection heat loss ratio will be less than 10%. Convection heat loss suppressed by the aerowindow is converted into the heat absorption of particles, which improves the efficiency of the solar receiver. However, as the particle temperature increases, radiation heat loss will increase accordingly. At the optimal jet velocity of 8.4 m/s, the sum of convection and radiation heat losses is the smallest, and the efficiency of the solar receiver reaches the largest. From Figure 15, it can also be seen that the proportion of radiant heat loss ranges from 25 to 45%. When the air jet velocity is greater than 2 m/s, the radiation heat loss accounts for about one-third. This indicates that the radiation heat loss accounts for a large proportion, and obviously, the aerowindow cannot reduce the radiation heat loss. In order to further improve the efficiency of the SPSR, the structure and materials of the receiver need to be studied in order to reduce the radiation heat loss.
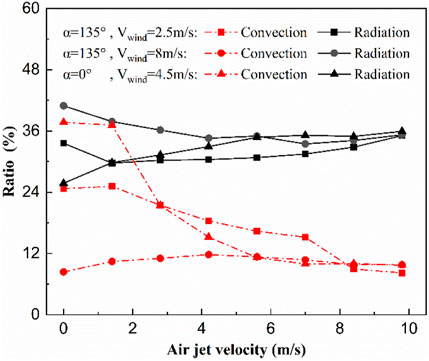
FIGURE 15. Ratios of convection and radiation heat loss under different air jet velocities.
Conclusion and outlook
In this study, the thermal performance of an SPSR was investigated with numerical simulation under different wind conditions and the influence of air jet velocity of the aerowindow on the thermal performance of the solar receiver was studied to make the following main conclusions.
1) Under different α and β wind attack angles, with the increase of wind speed, there are obvious differences in receiver efficiency. This is mainly because under different wind attack angles, wind can differently prevent hot air from flowing out and carry cold air into the receiver, which will compete with each other, resulting in the complex influence law of wind on receiver efficiency. Generally, when wind attack angles α and β are 0°, with the increase in wind speed, the thermal efficiency of the solar receiver will gradually decrease. When the wind attack angle α is 45°, 135°, and 180°, with the increase in wind speed, the receiver efficiency will first decrease and then increase. When the wind attack angle β is not equal to 0°, with the increase in wind, the receiver efficiency shows a trend of first decrease, then increase, and then decrease.
2) The aerowindow formed by the air jet on the top of the incident radiation aperture can effectively reduce convection heat losses and obviously improve the receiver efficiency. With the increase in air jet velocity of the aerowindow, the receiver efficiency will first increase and then decrease and the optimal air jet velocity exists for the maximum receiver efficiency. Under the research conditions of this study, the optimal air jet velocity of the aerowindow is 8.4 m/s. When α = 0° and wind is 4.5 m/s, the highest receiver efficiency is 55.0%, a growth rate of 50.7% relative to conditions without the aerowindow. When α = 135° and the wind speeds are 2.5 and 8 m/s, the highest receiver efficiency is respectively 58.2 and 56.0%, a growth rate of 39.6 and 10.7% separately relative to the condition without the aerowindow.
3) The aerowindow can effectively reduce the convection heat loss of the SPSR but has little effect on the radiation heat loss. The radiation heat loss accounts for about one-third. Therefore, further research on the structure and materials of the receiver is needed to reduce the radiation heat loss to improve the thermal efficiency of SPSR.
Data availability statement
The original contributions presented in the study are included in the article/Supplementary Material; further inquiries can be directed to the corresponding authors.
Author contributions
ZL: Methodology, software, writing—original draft, and resources. BW: Software and writing—review and editing. LX: Conceptualization and resources. JW: Supervision and writing—review and editing. SB: Software and validation. DC: Methodology and writing—review and editing.
Acknowledgments
We gratefully acknowledge the financial support from the National Natural Science Foundation of China Fund (grant number 51806023) and the Fundamental Research Funds for Central Universities.
Conflict of interest
The authors declare that the research was conducted in the absence of any commercial or financial relationships that could be construed as a potential conflict of interest.
Publisher’s note
All claims expressed in this article are solely those of the authors and do not necessarily represent those of their affiliated organizations or those of the publisher, the editors, and the reviewers. Any product that may be evaluated in this article or claim that may be made by its manufacturer is not guaranteed or endorsed by the publisher.
References
Alexopoulos, S., and Hoffschmidt, B. (2010). Solar tower power plant in Germany and future perspectives of the development of the technology in Greece and Cyprus. Renew. Energy 35, 1352–1356. doi:10.1016/j.renene.2009.11.003
Chen, H. J., Chen, Y. T., Hsieh, H. J., Kolb, G., and Siegel, N. (2007). “Numerical investigation on optimal design of solid particle solar receiver,” in ASME 2007 energy sustainability conference, Long Beach, California, USA, July 27–30, 2007, 971–979.
Chen, H. J., Chen, Y. T., Hsieh, H. T., and Siegel, N. (2007). Computational fluid dynamics modeling of gas-particle flow within a solid-particle solar receiver. J. Sol. Energy Eng. 129, 160–170. doi:10.1115/1.2716418
Clifford, K. H. (2016). A review of high-temperature particle receivers for concentrating solar power. Appl. Therm. Eng. 109, 958–969. doi:10.1016/j.applthermaleng.2016.04.103
Gilbert, M. (2021). Special issue on renewable energy policy and economics for climate action. Int. J. Sol. Energy 224, 1–2. doi:10.1016/j.solener.2021.05.080
Ho, C. K., Christian, J. M., Moya, A. C., Taylor, J., Ray, D., and Kelton, J. (2014). “Experimental and numerical studies of air curtains for falling particle receivers,” in Proceedings of the ASME 2014 energy sustainability and fuel cell conference, Boston, Massachusetts, USA, June 30–July 2, 2014.
Hruby, J. M., Steele, B. R., and Burolla, V. P. (1984). Solid particle receiver experiments: radiant heat test. Central receivers, Sandia National Laboratories. SAND84-8251.
Hruby, J. M., Steeper, R., Evans, G., and Crowe, C. (1988). An experimental and numerical study of flow and convective heat transfer in a freely falling curtain of particles. J. Fluids Eng. 110, 172–181. doi:10.1115/1.3243531
Jiang, K. J., Du, X. Z., Kong, Y. Q., Xu, C., and Ju, X. (2019). A comprehensive review on solid particle receivers of concentrated solar power. Renew. Sustain. Energy Rev. 116, 109663. doi:10.1016/j.rser.2019.109463
Kibum, K., Moujaes, S. F., and Kolb, G. J. (2010). Experimental and simulation study on wind affecting particle flow in a solar receiver. Sol. Energy 84, 263–270. doi:10.1016/j.solener.2009.11.005
Li, X. L., Sun, C., Xia, X. L., Li, Z. H., and Li, Y. (2020). Modeling of coupled heat transfer in a windowed volumetric solar receiver. Sol. Energy 201, 195–208. doi:10.1016/j.solener.2020.02.073
Lopez, I. P., Benoit, H., Gauthier, D., Sans, J. L., Guillot, E., Mazza, G., et al. (2016). On-sun operation of a 150 kWth pilot solar receiver using dense particle suspension as heat transfer fluid. Sol. Energy 137, 463–476. doi:10.1016/j.solener.2016.08.034
Maag, G., Falter, C., and Steinfeld, A. (2011). Temperature of a quartz/sapphire window in a solar cavity-receiver. J. Sol. Energy Eng. 133, 14501. doi:10.1115/1.4002774
Marianne, B. P., Sans, J. L., Eric, B., Ludovic, C., Alain, F., and Sébastien, C. (2021). Emissivity at high temperature of Ni-based superalloys for the design of solar receivers for future tower power plants. Sol. Energy Mater. Sol. Cells 227, 111066. doi:10.1016/j.solmat.2021.111066
Mehos, M., Turchi, C., and Vidal, J. (2017). Concentrating solar power Gen3 demonstration roadmap. Technical Report NREL/TP-5500-67464.
Nie, F. L., Cui, Z. Y., Bai, F. W., and Wang, Z. F. (2019). Properties of solid particles as heat transfer fluid in a gravity driven moving bed solar receiver. Sol. Energy Mater. Sol. Cells 200, 110007. doi:10.1016/j.solmat.2019.110007
Nie, F. L., Yu, Y. P., Bai, F. W., and Wang, Z. F. (2020). Experimental and numerical investigation on thermal performance of a quartz tube solid particle solar receiver. Sol. Energy 207, 1055–1069. doi:10.1016/j.solener.2020.07.013
Peng, X. Y., Bajaj, I., Yao, M., and Maravelias, C. T. (2021). Solid-gas thermochemical energy storage strategies for concentrating solar power: optimization and system analysis. Energy Convers. Manag. 245, 114636. doi:10.1016/j.enconman.2021.114636
Qaisrani, M. A., Fang, J. B., Jin, Y. B., Wan, Z. J., Tu, N., Khalid, M., et al. (2019). Thermal losses evaluation of an external rectangular receiver in a windy environment. Sol. Energy 184, 281–291. doi:10.1016/j.solener.2019.03.103
Sarker, M. R. I., Mandal, S., and Tuly, S. S. (2018). Numerical study on the influence of vortex flow and recirculating flow into a solid particle solar receiver. Renew. Energy 129, 409–418. doi:10.1016/j.renene.2018.06.020
Sharaf, O. Z., Khateeb, A. N. A., Kyritsis, D. C., and Nada, E. A. (2019). Four-way coupling of particle-wall and colloidal particle-particle interactions in direct absorption solar collectors. Energy Convers. Manag. 195, 7–20. doi:10.1016/j.enconman.2019.04.069
Siegel, N. P., Ho, C. K., Khalsa, S., and Kolb, G. J. (2010). Development and evaluation of a prototype solid particle receiver: on-sun testing and model validation. J. Sol. Energy Eng. 132, 3041–3045. doi:10.1115/1.4001146
Siegel, N. P., and Kolb, G. (2008). “Design and on-sun testing of a solid particle receiver prototype,” in Energy sustainability conference, Jacksonville, Florida, USA, August 10–14, 2008, 329–334.
Tan, T. D., Chen, Y. T., and Chen, Z. Q. (2015). Parametric study on the performance of a solid particle solar receiver. Sol. Energy 120, 277–286. doi:10.1016/j.solener.2015.01.029
Tan, T. D., Chen, Y. T., Chen, Z. Q., Siegel, N., and Kolb, G. J. (2009). Wind effect on the performance of solid particle solar receivers with and without the protection of an aerowindow. Sol. Energy 83, 1815–1827. doi:10.1016/j.solener.2009.06.014
Wang, T. J., Bai, F. W., Chu, S. Z., Zhang, X., and Wang, Z. F. (2017). Experiment study of a quartz tube falling particle receiver. Front. Energy 11, 472–479. doi:10.1007/s11708-017-0502-6
Wang, T. J., Bai, F. W., and Yang, B. (2016). Heat performance of single falling solid particle under high concentrated solar irradiation. Chin. Sci. Bull. 61, 3172–3182. (in Chinese). doi:10.1360/n972015-01254
Xiao, L., Wu, S. Y., and Li, Y. R. (2012). Numerical study on combined free-forced convection heat loss of solar cavity receiver under wind environments. Int. J. Therm. Sci. 60, 182–194. doi:10.1016/j.ijthermalsci.2012.05.008
Yang, N., Pu, W. H., Zhang, T. W., Yue, C., and Han, D. (2017). Numerical simulation on solid particle solar receiver. Energy Chem. Ind. 38, 7–13. (in Chinese). doi:10.3969/j.issn.1006-7906.2017.04.003
Yong, S., Wang, F. Q., Xia, X. L., Tan, H. P., and Liang, Y. C. (2011). Radiative properties of a solar cavity receiver/reactor with quartz window. Int. J. Hydrogen Energy 36, 12148–12158. doi:10.1016/j.ijhydene.2011.07.013
Nomenclature
Nu Nusselt number
Greek symbols
Superscript
Subscript
i ith direction
j jth direction
Keywords: solid particle solar receiver, wind, aerowindow, receiver efficiency, numerical simulation
Citation: Li Z, Wang B, Xu L, Wei J, Bu S and Chen D (2022) Numerical study on influence of wind on thermal performance of a solid particle solar receiver. Front. Energy Res. 10:916559. doi: 10.3389/fenrg.2022.916559
Received: 09 April 2022; Accepted: 12 July 2022;
Published: 09 August 2022.
Edited by:
K. Sudhakar, Universiti Malaysia Pahang, MalaysiaReviewed by:
Yanxin Hu, Guangdong University of Technology, ChinaErdem Cuce, Recep Tayyip Erdoğan University, Turkey
Copyright © 2022 Li, Wang, Xu, Wei, Bu and Chen. This is an open-access article distributed under the terms of the Creative Commons Attribution License (CC BY). The use, distribution or reproduction in other forums is permitted, provided the original author(s) and the copyright owner(s) are credited and that the original publication in this journal is cited, in accordance with accepted academic practice. No use, distribution or reproduction is permitted which does not comply with these terms.
*Correspondence: Liangjin Xu, xuliangjin@yeah.net; Shanshan Bu, shanshanbu@cqu.edu.cn