Identifying Risk Transmission in Carbon Market With Energy, Commodity and Financial Markets: Evidence From Time-Frequency and Extreme Risk Spillovers
 Yufeng Chen
 Chuwen Wang1
  Jiafeng Miao
 Tanjun Zhou
- 1School of Economics, Center for Studies of Modern Business, Zhejiang Gongshang University, Hangzhou, China
- 2College of Business Administration, Capital University of Economics and Business, Beijing, China
- 3School of Statistics and Mathematics, School of Management and E-business, Zhejiang Gongshang University, Hangzhou, China
The carbon market is a vital tool to achieve carbon neutrality. This paper uses daily closing price data of Shenzhen carbon trading market, energy, commodity and financial markets from 18 October 2018 to 19 August 2021, examining the transmission of risk/information from the perspective of market volatility spillover and tail risk transmission based on quantile spillover. The stock market crash and COVID-19 have increased the volatility of the system substantially. Next, the increase in trading frequency is accompanied by an increase in total volatility connectivity, and the carbon market transforms into a recipient of systemic shocks. Finally, the results of tail risk transmission reveal that the net effect of carbon reception increases significantly. These findings have implications for policymakers to improve the carbon market and provide important insights for investors to trade in turbulent periods.
1 Introduction
In the past 40 decades, China’s reform and opening-up level of high-speed development have made it leap to the second-largest energy economy in the world, while industries and enterprises also burn and utilize fossil fuels in large quantities without restraint, emitting considerable amounts of greenhouse gases (An et al., 2021; Chen and Zhu, 2022; Xian et al., 2022). To strengthen ecological protection and promote sustainable development, the issue of carbon emission management from an economic perspective has been considered by the government (Liu et al., 2021; Yu et al., 2021). China’s first carbon emissions trading market was officially launched in Shenzhen on 18 June 2013. It has gradually formed the most complete legal institutional framework for carbon trading in China, laying a good foundation for the smooth operation of China’s overall carbon market construction (Jiang et al., 2014; Cong and Lo, 2017). In the context of low-carbon environmental protection, the operation of the carbon trading market has greatly supported the financial instruments to achieve China’s “double carbon” goal. However, the current development of China’s carbon emissions trading market is still immature and investors do not choose carbon as their investment and financial management tool, which makes it difficult for the carbon market, a market-based environmental regulation policy, to be effective.
The energy market is closely related to the carbon emission trading market. Looking at the current situation of energy consumption and carbon emissions in China, the energy structure of China is still dominated by fossil energy under the constraint of resource endowment. In 2019, China’s coal consumption accounted for 57.5%, oil consumption for 18.9%, and natural gas consumption for 8.1%, with a total fossil energy consumption share of nearly 85%1. Energy markets are vulnerable to various uncertainties and volatility (Maneejuk et al., 2021). In turn, the energy market is used as a medium to transmit this volatility to the carbon trading market. Therefore, identifying the spillover effects of energy shocks on the carbon market is of great relevance. In addition, it is crucial to analyze the volatility between some high carbon product markets and carbon trading markets. As basic consumables for industrial raw materials, fluctuations in copper and iron ore prices have severely affected the economy as well as other markets (Guo et al., 2020; Chen and Yang, 2021). With the trend of financialization in the metals market, precious metals have become a popular hedge asset for investors. To achieve effective development of the carbon market, there is a real need to consider the relationship of risk transfer between the precious metals and the carbon market in the future (Adekoya et al., 2021). In addition, there is a linkage between the stock market and the carbon market, both at the overall and industry level (Wen et al., 2020). Given this, we will construct a system of the markets as mentioned above to analyze the volatility spillover relationship between the markets, with the carbon market as the main object of study.
In recent years, scholars have extensively discussed the risk contagion of carbon markets (Balc et al., 2020; Yuan and Yang, 2020; Zhu et al., 2020; Xu, 2021), analyzing the spillover effects of carbon markets with energy, commodity and financial markets (Ji et al., 2018; Wang and Guo, 2018; Gong et al., 2021; Ma and Wang, 2021; Jiang and Chen, 2022). Nonetheless, most studies on risk contagion in previous generations lack a systematic framework. In addition, the impact of tail risk is often neglected in existing studies on the spillover effects of the system.
To fill the gap in previous studies, this paper analyzes the volatility spillover relationship between carbon market and energy, commodity and financial markets by time-varying, time-frequency and quantile spillover methods, taking the Shenzhen carbon emission trading market as the main research object. In today’s financial world, modeling analysis of information/risk spillover from one market to another is important for asset pricing, investment decisions, leverage decisions, portfolio allocation in international markets, and macroeconomic strategy formulation by government policymakers. This study aims to present empirical methods to identify the volatility risk transmission from carbon markets with energy, commodity and financial markets to reduce the risk of related market transactions. It not only facilitates carbon trading investors to choose reasonable investment instruments but also provides a strong scientific basis for carbon market policymakers to regulate the development of the carbon market more ideally by formulating appropriate carbon finance plans.
The main contributions are as follows. Firstly, a wavelet decomposition approach is used to process the signal into four time-lengths to describe the volatility spillover constructs within the system. This approach enriches the perspective of investors by classifying them by trading duration. Previous related literature also demonstrates that carbon has a different structure from other markets in terms of spillovers at different frequencies (Adekoya et al., 2021). Second, the spillover of the bull, as well as bear market systems, are explored to obtain more scientific and comprehensive results. The occurrence of tail quantile-extreme events is also a part of greater interest to investors and governments. In the Chinese carbon trading market, the transmission of market risk is exacerbated by extreme events and the market suffers severe shocks (Zhu et al., 2021; Jiang and Chen, 2022; Zhao and Wen, 2022). Third, this paper also presents novel information/risk transmission findings in the carbon market with energy, commodities and financial markets. The impact of the stock market crash and COVID-19 has exacerbated risk transmission within the system. As the frequency of trading increases, the carbon market turns into a net recipient. Under extreme conditions, the negative spillover effect of the carbon market intensifies. The identification of volatility risk transmission in the Shenzhen carbon market helps provide a relevant theoretical basis for other carbon markets in China to implement efficient operations in the future.
The structure of this article is as follows. The relevant literature review is described in Section 2. The methods and data are present in Sections 3 and 4. Section 5 is the analysis of empirical results. Finally, the conclusions and policy implications are reported in Section 6.
2 Literature Review
In this section, we summarize relevant recent research examining the linkages between carbon markets and other markets. Energy and carbon prices are interconnected and are relatively complex systems. There are significant spillovers between carbon and fossil energy markets, with the strongest volatility spillover between coal and carbon markets (Zhang and Sun, 2016; Wu et al., 2020; Gong et al., 2021). Evidence of synchronization between the China carbon and coal markets has also been found (Yin et al., 2021). Oil prices influence carbon prices in terms of risk and volatility (Ji et al., 2018). Xu (2021) used the conditional volatility of Daqing crude oil returns to measure the risk spillover effect of energy market uncertainty on the China carbon market, which yielded significant risk spillover effects. However, this is contrary to earlier research findings (Reboredo, 2014). In studies of electricity markets, there is a strong information spillover relationship between European carbon prices and electricity markets (Ji et al., 2019). Yang (2022) and Zhu et al. (2020) examined the relationship between the EU-ETS and the electricity market. The results of the idiosyncratic spillover indicate that carbon is a net recipient of systemic risk, and the level of this risk spillover has different architectures in frequencies. It is clear that changes in energy market prices have an impact on carbon emissions and influence the development of carbon markets.
Carbon emissions are essential in the production process of high-carbon companies. There are few studies related to high-carbon products and carbon markets in the existing literature. Most scholars have selected steel, iron ore, and aluminum as the subjects of research on the relationship with carbon spillovers (Ma and Wang, 2021; Jiang and Chen, 2022). Jiang and Chen (2022) include steel and aluminum in the materials market, and the results after COVID-19 indicate an increase in spillovers in the materials market. The carbon market in China is still evolving and remains sensitive to other markets. Using a combination of the DY spillover index and Copula framework Ma and Wang (2021), found that iron ore has the highest degree of spillover in the system, and carbon emission prices have a relatively low degree of spillover. The stock market is often applied as a barometer of macroeconomic and financial markets. Most previous studies have measured the relationship between stocks in specific sectors and the carbon market (Yuan and Yang, 2020; Dai et al., 2022; Tiwari et al., 2022). It has some limitations that do not provide a complete interpretation of the stock market as a whole.
The studies mentioned above mainly respond to the correlation between energy and high carbon products due to the production of carbon emissions, ignoring the fact that the carbon emissions trading market can be used as a channel for the investment market. In addition, the European carbon trading market is better developed, and previous studies have mainly explored this market for the analysis of the relationship with other markets. Since there are still some gaps in China’s carbon trading market, we choose the earliest ETS market in Shenzhen as the main object of this paper and analyze the spillover relationship with the energy market, high carbon products market, precious metals market and financial market. Precious metals (gold and silver) and high-carbon products (copper) are considered, as precious metals are of great significance to investors, while copper as a high-carbon product is often overlooked.
Although much of the literature has been tested to prove that there is indeed some spillover relationship between carbon and one of the markets mentioned above, a systematic examination is still lacking. Regarding the methodological models, most scholars generally adopt a construct based on Diebold and Yilmaz’s (2012) spillover index to explore the spillover relationship (Ji et al., 2018; Wang and Guo, 2018). Another part of scholars use models such as GARCH, Copula and causality to consider inter-market dependence (Zhang and Sun, 2016; Yuan and Yang, 2020). Nevertheless, these methods are not quantified and the case of multiple groups of markets is difficult to deal with. Therefore, this paper extends the market price information/risk spillover (DY index) framework to consider the degree of system integration and the direction and magnitude of information/risk transmission within the system, which is more convincing than the traditional tests. Especially, the methodology combines the maximum overlapping wavelet decomposition (Percival and Walden, 2000), quantile spillover (Ando et al., 2022) integrated to measure the variation of intra-system spillover for investors with different trading frequencies and when extreme events occur. The inclusion of the quantile element overcomes the drawback that the average estimate is too homogeneous to provide a complete assessment of the tail process. Overall, in this paper, we decided to use a wavelet decomposition and quantile architecture connectivity approach to measure the selected indicator system's spillover.
3 Methodology
3.1 The Wavelet Decomposition Framework
Many methods of signal time and frequency processing are available at this stage. For instance, EMD, Fourier transform and BK index decomposition have been widely used in processing financial time series data (Zhu et al., 2020; Luo et al., 2021; Liu et al., 2022). In particular, wavelet transform has a wide range of applications as time-frequency analysis in various research fields, and it is suitable for decomposing some non-stationary time series signals. Compared to the Fourier transform, the wavelet transform has a good interpretation advantage for time and frequency.
3.1.1 Continuous Wavelet Transform
The continuous wavelet transform for measuring a given signal
Where
3.1.2 Discrete Wavelet Transform
The discrete wavelet transform differs from the continuous wavelet transform described above in that there are special requirements for the setting of the a and b parameters. Both a and b need to be a multiple of an integer, typically requires
Next, different filters divide the wavelet function into a mother wavelet and a father wavelet function. The mother wavelet is defined for data at low scale and high frequency and the father wavelet presents data at high scale and low frequency. The following equation can represent the output after two frequency filters:
The smoothing coefficients of the father wavelet—Approximation coefficients (CA) are representative of the high scale and low frequency:
The detail coefficients of the mother wavelet—Detail coefficients (CD) present data of low scale and high frequency:
However, DWT requires that the sample size be an integer power of 2, which is difficult to satisfy in practice. This study introduces the maximum overlap discrete wavelet transform (MODWT) to overcome this drawback. The highly redundant transformation of the coefficients is expressed as:
Here, J = 4 is set according to the sample size. The wavelet decomposition is performed using a Daubechies minimum asymmetric wavelet filter of length 10, i.e., LA (10).
3.1.3 Time-Varying Vector Autoregression
To explore the mechanism of information/risk transmission in time-varying situations, this paper constructs a TVP-VAR model based on the maximum discrete wavelet transform according to Antonakakis et al. (2020). The main advantage of the TVP-VAR method is that there is no need to pick a specific window size when building the connectivity model in the next step, which avoids some errors caused by subjective window selection. The following equation describes the TVP-VAR model:
Where
3.2 The Quantile Framework
According to the theory of linear quantile regression first proposed by Koenker and Bassett (1978), in linear conditions, given the dependent variables
The quantile structure is next constructed into the VAR model as follows:
First, we estimate a quantile vector autoregression (MA), which can be depicted as follows:
Where
3.3 The DY Spillover Framework
Then, for building the generalized error variance decomposition framework based on the two regression conditions described in the previous section. For the forecast range H, the generalized forecast error variance decomposition (GFEVD) of variables caused by shocks of different variables:
The
Since the above framework does not query the orthogonalization of shocks, the sum of elements of each row of the matrix is not equal to 1:
Finally, this paper constructs connectedness measures based on the spillover index framework of Diebold and Yilmaz (2012), which is formulated by using generalized forecast error variance decomposition. The total spillover index, net spillover index, and net pairwise spillover index are expressed in the following formulations:
In particular, to reflect the dynamics of the time-varying spillover on the quantile-connected framework, this paper uses the rolling window estimation, which is based on lag with SIC = 1 and forecast error variance decomposition of 10 steps in advance.
4 Data Description
Considering the liquidity of the transaction and the range of carbon allowance prices recorded, the empirical analysis selects Shenzhen carbon trading market's daily closing price data as the carbon price benchmark. Shenzhen carbon trading market is the earliest and relatively well-developed carbon trading pilot in China (Cong and Lo, 2017). The other data is in four major categories: energy prices, product prices, precious metal prices and financial markets. Energy prices have always been closely linked to carbon markets. In addition to traditional fossil energy (oil and power coal), the Electric Power index is also included. Copper and iron ore are collected as product prices, and their production process is accompanied by significant carbon consumption and emissions. In the precious metals market, gold and silver are often important tools for investors to hedge their bets. Finally, the CSI 300 index is used as to represent the financial market. The sample period is from 18 October 2013, to 19 August 2021. The sources are listed in Table 1 and the data are from Wind. Meanwhile, since the data are all from China, the influence of currency exchange rate on the time series modeling of closing price is negligible.
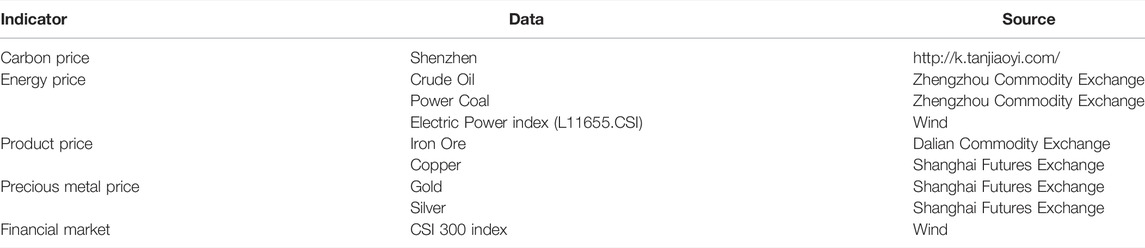
TABLE 1. Indicator selection and data sources.
The descriptive statistics and the unconditional correlation matrix of returns for the whole period are provided in Table 2. As the main decarbonization instrument currently in China, the carbon market has negative average returns and the largest variance, suggesting that the China carbon market may not be a good financial instrument for investors. Significant negative returns and relatively large variance are also found in oil and iron ore. As important strategic resources, they are subject to high volatility mainly due to uncertainties such as geopolitical factors. Almost all other markets have positive returns, and the volatility is not particularly pronounced. In particular, the minimum variance gold price still maintains a stable trend, which also verifies the safe-haven value of gold from another perspective. In terms of the distribution characteristics of the series, all markets except carbon, gold and copper show a negative bias. Both left-skewed and right-skewed results are found. Without exception, all samples are above the benchmark criterion of 3 and there is a significant excess kurtosis. To further demonstrate the statistical properties of the series, another more advanced test is performed in this paper. Without any disappointment, the JB statistic rejects the original hypothesis of a normal distribution. Therefore, it seems reasonable to use the quantile framework model structure below to measure the results of this non-normal distribution. Finally, their production process the ERS unit root test results show that all returns remain stationary at the 1% significance level.
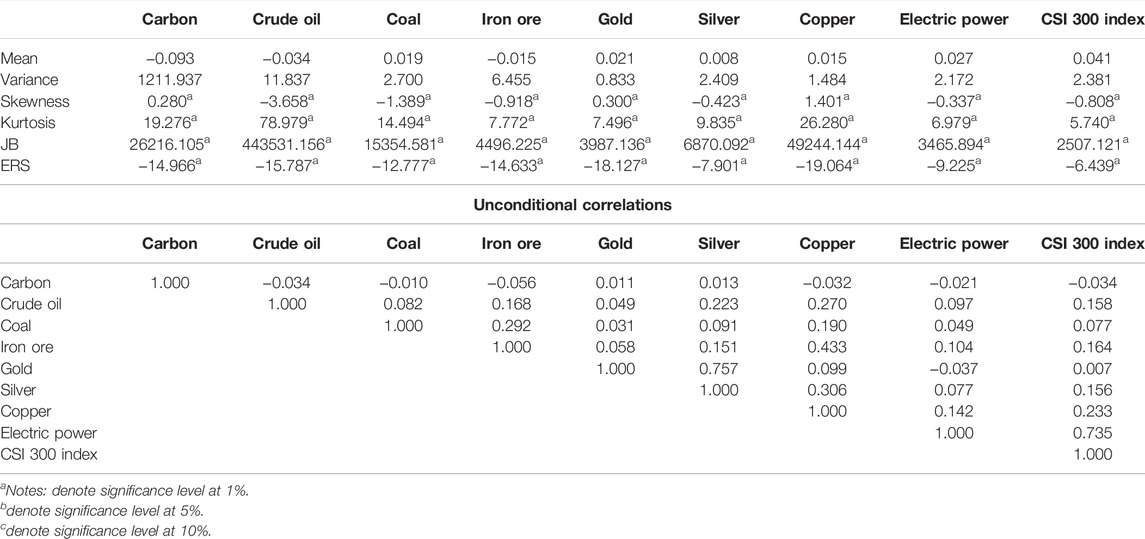
TABLE 2. Summary statistics and unconditional correlations.
In the results of the unconditional correlation matrix, all returns exhibit different levels of correlation. Among them, gold and silver, both precious metal commodities, present the strongest positive correlation in the system with over 80%. The unexpected result occurs between gold and the CSI 300 index, which possess only a 0.7% correlation degree.
5 Empirical Results
As mentioned in the introduction, this part takes carbon prices as the main object of analysis, firstly exploring the time-varying spillover effect of the system. The spillover for different frequencies based on the results of wavelet decomposition is analyzed in Section 5.2. Furthermore, in Section 5.3, this paper investigates what happens to the system under the influence of bull and bear markets in extreme cases.
5.1 Time-Varying Analysis of Spillover
To study the volatility transmission of the system, this section first analyzes the time-varying characteristics of the system volatility using absolute returns based on the TVP-DY spillover index method proposed by Antonakakis et al. (2020). Here, this paper estimates the dynamic total and net spillover indices (see Figures 1, 2). Figure 1 indicates the total dynamic spillover across the system. Overall, the system has high volatility with the total spillover indices ranging from 20% to 45%. Combining the occurrence of the relevant events, it is significant to find that the volatility connectivity changes abruptly in 2015 and 2019. These two points in time correspond precisely to the stock market crash and the COVID-19. The stock market crisis was triggered by the market's large number of highly leveraged placements. After the bubble occurred, it exacerbated the panic fall in the stock markets, which transmitted this damaging information to other capital markets, creating a situation where the risk of systemic volatility was abnormally high. Interestingly, this paper finds a much higher risk of volatility from health crises than the results due to stock market crash. As the epidemic improves, the systems volatility transmission risk decreases.
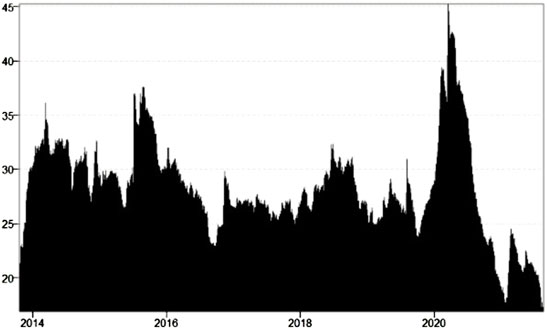
FIGURE 1. Time-varying total spillover.
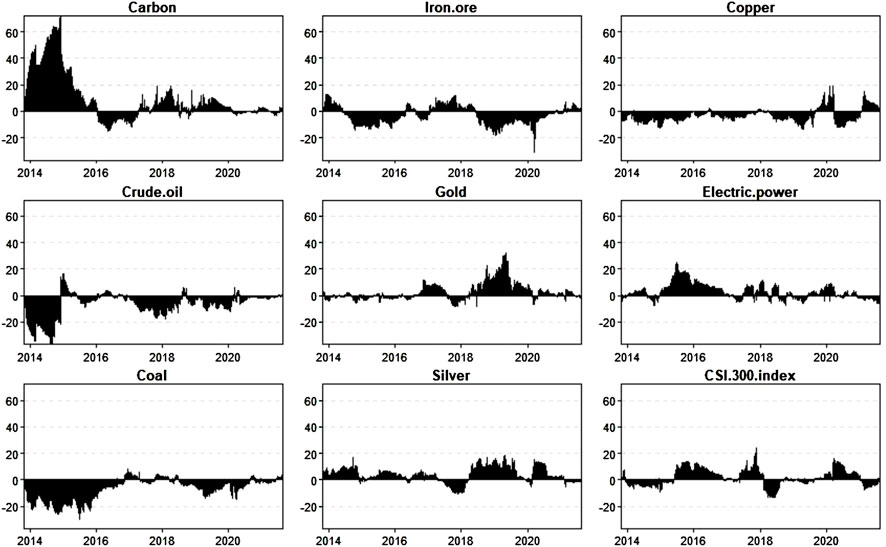
FIGURE 2. Time-varying net directional spillover.
Figure 2 reviews the directional information to understand the estimated net directional spillover. With the exception of energy and commodities, almost all assets provide historical evidence of mixed patterns. During the incipient phase of the carbon market, it became the largest transmitter. For the Shenzhen carbon market—the first carbon trading pilot in China, although the development system has been a leader in the country, the low liquidity of carbon trading has resulted in “A bid but no volume dilemma” and “large exposure to risk” (Fan et al., 2019; Li et al., 2021a). It is the opposite of the European carbon trading market, which was developed earlier and is relatively mature (Adekoya et al., 2021). On the contrary, oil, power coal, iron ore, and copper are net recipients of volatility spillovers. Analyzed from another perspective, these commodities cannot be burned and processed without carbon emissions, and the corresponding assets are closely linked to carbon trading. Investors can focus on carbon to form portfolio assets with oil, power coal, etc. to face bad volatility spillovers from various uncertainties and geopolitical factors (Chen et al., 2019). 2016–2020 belongs to the accelerated development phase of the Shenzhen carbon market, in which positive and negative alternating roles are found. Although there are still many externalities disturbing still transmitting or receiving risks during this period, the Chinese government is also improving the top-level design to reasonably avoid risks. With the improvement of the carbon market trading mechanism, the spillover started to diminish in 2020, and the contribution to systemic shocks tends to be close to 0. It may be due to the reduction of carbon emissions by firms driven by the carbon peaking and carbon neutrality targets, which reduces the carbon price volatility (Zhou et al., 2022).
Among the other markets, the stock market crash has had the most pronounced impact on financial markets. The high volatility spillover of these two indices validates that the stock market is a barometer that reacts to the macroeconomy, and that the stock market is constantly transmitting and channeling signals/risks (Sadorsky, 1999). While gold and silver continuously transmit shocks to the system in 2018–2020, no significant spillover effects arise at other times. Due to their hedging role in uncertain events such as geopolitics, many investors choose precious metals as an effective hedge in turbulent times (Li et al., 2021b; Salisu et al., 2021; Wang and Lee, 2021).
5.2 Time-Frequency Analysis of Spillover
To get a comprehensive understanding of the linkages between carbon and other markets, this section quantifies the volatility spillover effects of different frequency cycles. Table 32 reflects the time-frequency spillover effects at different frequencies of absolute returns derived by wavelet frequency decomposition. The trading frequencies are divided into four frequency bands: 2–4 days, 4–8 days, 8–16 days, and 16–32 days, which correspond to short term trading, short-medium term trading, medium term trading, and long term trading, respectively (Mensi et al., 2021a; Miao et al., 2022). The construct of the total spillover changes significantly as they correspond to 28.35, 29.71, 34.87, and 42.88%. Keynes (1936) argued that rational investors are primarily concerned with short term price changes of assets and tend to disregard the prediction of long-term price changes. “Investor short-sightedness” leads to a tendency for many investors to trade on suitable assets with high short term liquidity in markets with asymmetric information (Adekoya et al., 2021). A few cases are contrary to the results of the previous analysis, for example, Shah and Dar (2021) reached the opposite conclusion in exploring commodities and financial markets, they pointed out that the overall premium index gradually decreases with increasing holding time, although the individual investor’s preference for risk plays a major part.
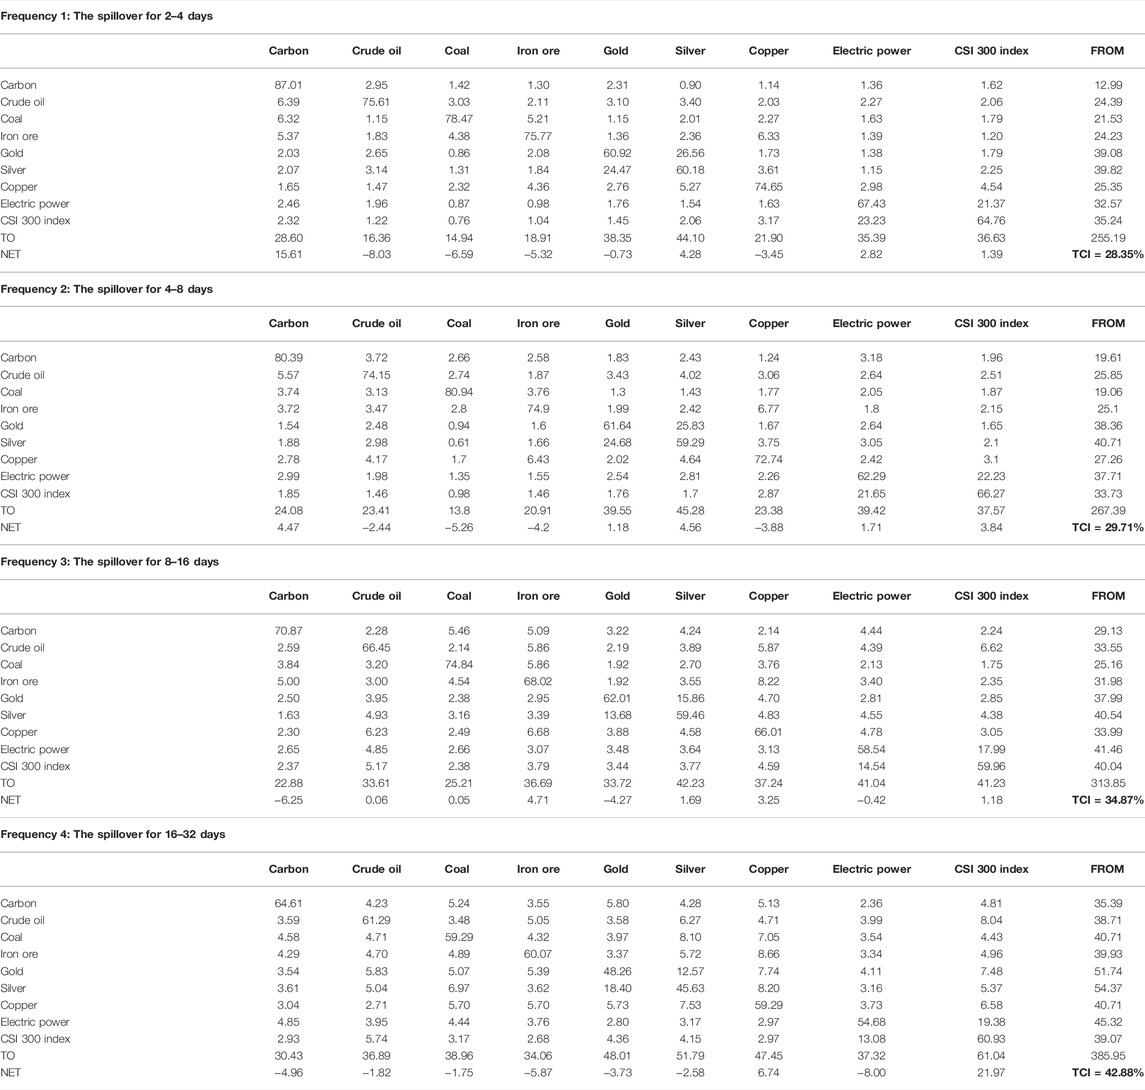
TABLE 3. Frequency spillover results based on the wavelet decomposition. Frequency 2: The spillover for 4–8 days. Frequency 3: The spillover for 8–16 days.
Further findings in Table 3 show that the oil (coal) market and the iron ore (copper) market are net recipients of shocks in the system in the short-medium term. It should be recalled that these markets also exhibit similar results under the time-domain spillover results. On the one hand, due to the various uncertainties in the market, health crises and economic events occupy the main dimensions (Adekoya et al., 2021; Jiang and Chen, 2022). Volatility in energy and commodities markets increased and investor panic flooded the trading system. On the other hand, commodities are highly sensitive to their demand and supply factors, which exacerbates volatility risk. (Guo et al., 2020; Chen and Yang, 2021).
The shift of volatility spillover effects in the system is presented in the 8–16 days frequency. In short, the carbon emissions, gold and electricity index markets begin to experience negative net volatility spillovers. From the combination of the different frequency results, a similar effect may exist for the Shenzhen ETS carbon market and the electric power index. Yang (2021) argued that clean electricity plays an important role in decarbonization. It is mainly because the renewable energy transition of power companies cannot be achieved overnight, and the strong demand for carbon credits drives up the price of carbon. At the same time, power companies pass on the rising cost of purchasing carbon allowances to consumers, driving up the price of electricity.
Especially, copper has been the focus of attention for heavy metal manufacturing commodities. Throughout the copper smelting system, each process requires electricity or fuel consumption. In addition, energy sources such as coke powder, heavy oil, natural gas, methane and liquid ammonia are consumed as raw materials in the anode furnace refining process, so each production stage has a certain amount of carbon emissions. As it happens, a remarkable result is observed for copper. Regardless of the frequency and duration of the transactions, the spillover trends in the copper and carbon markets are reversed. In the future, some considerations could be given to carbon-copper contract pairs to balance the spillover effects of inter-system risk fluctuations.
5.3 Extreme Quantile Analysis of Spillover
The occurrence of extreme events can affect the level of information/risk contagion in the system (Bouri et al., 2021; Saeed et al., 2021). In the sample period selected for this paper, many extreme events also occurred, such as the stock market crash in 2015 and COVID-19 in 2020. To study information/risk spillovers under extreme events, this section uses the quantile DY spillover index framework proposed by Ando et al. (2022) to analyze the average spillover relationship of the considered variables by estimating the spillover network graph for the whole sample period. Unlike the median connectivity approach, the tails can reveal more hidden architectures (Naeem, Billah, et al., 2021). The 5th and 95th quantiles are employed to capture the volatility spillover of the whole system during the bull and bear phases, respectively. Figure 3 provides a visual representation of the results obtained, identifying assets as network transmitters or receivers of spillover effects. The thickness of the arrows and the shade of color indicate the size and intensity of the dynamic average spillover between assets. The size and color of the nodes report the magnitude and direction of the net spillover (red for “+” and blue for “-”).
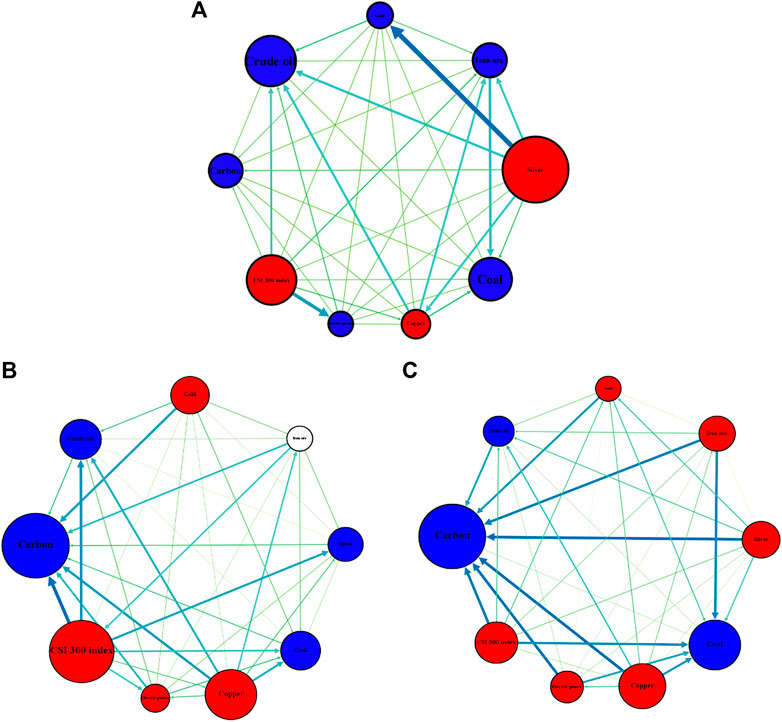
FIGURE 3. Pairwise directional spillover among different quantiles. (A) NPCI Based on 0.50 quantile. (B) NPCI Based on 0.05 quantile. (C) NPCI Based on 0.95 quantile.
Combined with Supplementary Table SA1, this paper finds significant differences in the structure of the systems estimated based on the upper, middle, and lower quantiles. There is a remarkable increase in the degree of dependence compared to the median, with nearly 80% of the volatility spillover results occurring in the tail estimates. Similar findings exist for the international stock market, cryptocurrency, and the Asia-Pacific currency market (Su, 2020; Bouri et al., 2020; Bouri et al., 2021). The different architectures in the system are presented in Figure 3. Many previous studies have demonstrated that the spillover effect of such extreme events remains asymmetric. The impact of the lower quantile is much larger than the upper quantile (Bouri et al., 2021). For power coal, the degree of spillover from its net reception in bear markets does not diminish, but rather increases over normal periods, an aspect that investors should be aware of. Evidence of shifting roles played by assets in bull and bear markets is found in gold and silver, iron ore and power indices. Despite having a small spillover level, the power index is no longer receiving shocks on the market in the tail risk. As the financialization of the Chinese electricity market is currently low, stock indices are still less useful in the market than spot and futures, which enable better price discovery (Gürbüz and Şahbaz, 2021). The establishment of future electricity futures markets may better offset the shocks with other markets. In addition, gold and silver are strongly correlated during the upper quartile, and 9Mensi et al., 2021b) demonstrate that silver-gold pairs' negative short-term correlation exists during bull markets. However, the two show a different picture due to the occurrence of extreme events, in short, gold is gradually changing from a spill recipient to an information/risk sender and the link between the two is weakening.
In contrast to risk measures in other markets, carbon markets require special attention to upside and downside risk spillovers (Feng et al., 2012). During normal trading periods, carbon is a net recipient of volatility spillovers (−1.84%). Under extreme conditions, which increase the spillover effects received by carbon, a large amount of volatility spillover effects are bound to generate risk. Similar findings to the previous frequency structure are revealed in the copper analysis. The increased positive spillover effect of copper continuously transmits information/risk to the market. It further strengthens the results derived in the previous section that carbon-preferring investors can still pick up copper futures contracts for risk hedging in response to extreme contingencies.
6 Conclusion and Policy Implications
The carbon emission trading market is essential in constructing ecological civilization in China. This study takes the Shenzhen carbon trading market as the main research object, focusing on the volatile connectivity of carbon markets, energy, high-carbon products and financial markets. Previous studies have mainly used mean-connected models, which may lead to neglecting different trading frequency constructs and inaccurate estimation of some extreme events based on mean regression. Therefore, in this paper, wavelet analysis and quantile-based spillover measures are used to comprehensively consider spillover for different transaction frequencies as well as for the upper, middle and lower quantile connection networks. The main results are summarized as follows: 1) Initially, carbon is the primary market volatility risk/information transmitter. With the continuous improvement of the carbon market system, the spillover of the carbon market diminished. 2) The volatility spillover increases gradually with the frequency period, and the frequency period of the asset held is proportional to the volatility risk. 3) Frequency spillover constructs show different results. All markets are net recipients of shocks in terms of long-term frequency, except for copper and the CSI 300 index market. In particular, it should be noted that the carbon market transforms into the most pronounced net receiver of shocks effect. 4) The overall connectivity of the results in different market states is heterogeneous, with the carbon market increasing the receiving effect of shocks.
Investment and policy recommendations are given in the following discussion. From investors' perspective, investors need to recognize the strength of inter-systemic spillovers and build new diversified portfolio solutions when forecasting market risk in commodity asset portfolios. In short-term trading, investors with net receiving positions in energy markets and high-carbon product markets can consider hedging with carbon markets to offset their risks. As frequency cycles increase, investors who hold carbon assets for the long term no longer have an advantage. Our results suggest that copper can effectively hedge the risk in both markets over the long term and under extreme conditions. Investors need to be more aware of changes in the market during periods of extreme events, where risk contagion is exacerbated in the tail.
At the same time, the results of this paper lead to some policy considerations. The government’s macro-regulation is crucial to the development of the carbon market. From the perspective of carbon market development, it should clarify the systematic information transmission mechanism and focus on the enterprises with high energy consumption. Secondly, we should improve the risk prevention mechanism related to the carbon market, prevent the risk of carbon price plunge caused by the risk spillover effect and take appropriate price stabilization mechanism to intervene in the carbon price. Finally, promoting the development of a multi-level carbon market system, including the carbon derivatives market, is important to meet multiple entities' individualized investment and financing needs. It can also effectively enhance market liquidity and reduce transaction costs to promote the orderly development of the carbon market.
Data Availability Statement
The raw data supporting the conclusion of this article will be made available by the authors, without undue reservation.
Author Contributions
YC: Funding acquisition; Conceptualization; Formal analysis; Writing- Reviewing and Editing; CW: Data curation; Writing- Original draft preparation; Visualization; Writing- Reviewing and Editing; JM: Methodology; Software; Writing- Original draft preparation; Writing- Reviewing and Editing; TZ: Data curation; Visualization.
Funding
This work was supported by National Natural Science Foundation of China (No. 72174180, No. 71673250); Zhejiang Provincial Natural Science Foundation for Distinguished Young Scholars (LR18G030001); Major Projects of the Key Research Base of Humanities Under the Ministry of Education (No. 14JJD790019); and Zhejiang Provincial Philosophy and Social Science Planning Project (No. 22QNYC13ZD, No. 21NDYD097Z).
Conflict of Interest
The authors declare that the research was conducted in the absence of any commercial or financial relationships that could be construed as a potential conflict of interest.
Publisher’s Note
All claims expressed in this article are solely those of the authors and do not necessarily represent those of their affiliated organizations, or those of the publisher, the editors and the reviewers. Any product that may be evaluated in this article, or claim that may be made by its manufacturer, is not guaranteed or endorsed by the publisher.
Supplementary Material
The Supplementary Material for this article can be found online at: https://www.frontiersin.org/articles/10.3389/fenrg.2022.922808/full#supplementary-material
Footnotes
1The data was reported by the National Bureau of Statistics of the People’s Republic of China (2020).
2TCI, Total spillover index; TO/FROM: Directional spillover index; NET, Net directional spillover index. The diagonal values represent the contribution of own shocks and the non-diagonal lines are the contribution of shocks to others.
References
Adekoya, O. B., Oliyide, J. A., and Noman, A. (2021). The Volatility Connectedness of the EU Carbon Market with Commodity and Financial Markets in Time- and Frequency-Domain: The Role of the U.S. Economic Policy Uncertainty. Resour. Policy 74, 102252. doi:10.1016/j.resourpol.2021.102252
An, Y., Zhou, D., Yu, J., Shi, X., and Wang, Q. (2021). Carbon Emission Reduction Characteristics for China's Manufacturing Firms: Implications for Formulating Carbon Policies. J. Environ. Manag. 284, 112055. doi:10.1016/j.jenvman.2021.112055
Ando, T., Greenwood-Nimmo, M., and Shin, Y. (2022). Quantile Connectedness: Modelling Tail Behaviour in the Topology of Financial Networks. Manag. Sci. 68 (4), 2401–2431. doi:10.1287/mnsc.2021.3984
Antonakakis, N., Chatziantoniou, I., and Gabauer, D. (2020). Refined Measures of Dynamic Connectedness Based on Time-Varying Parameter Vector Autoregressions. Jrfm 13 (4), 84. doi:10.3390/jrfm13040084
Balcılar, M., Demirer, R., Hammoudeh, S., and Nguyen, D. K. (2016). Risk Spillovers across the Energy and Carbon Markets and Hedging Strategies for Carbon Risk. Energy Econ. 54, 159–172. doi:10.1016/j.eneco.2015.11.003
Bouri, E., Lucey, B., Saeed, T., and Vo, X. V. (2020). Extreme Spillovers across Asian-Pacific Currencies: A Quantile-Based Analysis. Int. Rev. Financial Analysis 72, 101605. doi:10.1016/j.irfa.2020.101605
Bouri, E., Saeed, T., Vo, X. V., and Roubaud, D. (2021). Quantile Connectedness in the Cryptocurrency Market. J. Int. Financial Mark. Institutions Money 71, 101302. doi:10.1016/j.intfin.2021.101302
Chen, Y., Li, W., and Qu, F. (2019). Dynamic Asymmetric Spillovers and Volatility Interdependence on China's Stock Market. Phys. A Stat. Mech. Its Appl. 523, 825–838. doi:10.1016/j.physa.2019.02.021
Chen, Y., and Yang, S. (2021). Time-varying Effect of International Iron Ore Price on China's Inflation: A Complete Price Chain with TVP-SVAR-SV Model. Resour. Policy 73 (121), 102200. doi:10.1016/j.resourpol.2021.102200
Chen, Y., and Zhu, Z. (2022). Liability Structure and Carbon Emissions Abatement: Evidence from Chinese Manufacturing Enterprises. Environ. Resour. Econ. doi:10.1007/s10640-022-00649-2
Cong, R., and Lo, A. Y. (2017). Emission Trading and Carbon Market Performance in Shenzhen, China. Appl. Energy 193, 414–425. doi:10.1016/j.apenergy.2017.02.037
Dai, Z., Zhu, H., and Zhang, X. (2022). Dynamic Spillover Effects and Portfolio Strategies between Crude Oil, Gold and Chinese Stock Markets Related to New Energy Vehicle. Energy Econ. 109, 105959. doi:10.1016/j.eneco.2022.105959
Diebold, F. X., and Yilmaz, K. (2012). Better to Give Than to Receive: Predictive Directional Measurement of Volatility Spillovers. Int. J. Forecast. 28 (1), 57–66. doi:10.1016/j.ijforecast.2011.02.006
Fan, X., Lv, X., Yin, J., Tian, L., and Liang, J. (2019). Multifractality and Market Efficiency of Carbon Emission Trading Market: Analysis Using the Multifractal Detrended Fluctuation Technique. Appl. Energy 251, 113333. doi:10.1016/j.apenergy.2019.113333
Feng, Z.-H., Wei, Y.-M., and Wang, K. (2012). Estimating Risk for the Carbon Market via Extreme Value Theory: An Empirical Analysis of the EU ETS. Appl. Energy 99, 97–108. doi:10.1016/j.apenergy.2012.01.070
Gong, X., Shi, R., Xu, J., and Lin, B. (2021). Analyzing Spillover Effects between Carbon and Fossil Energy Markets from a Time-Varying Perspective. Appl. Energy 285, 116384. doi:10.1016/j.apenergy.2020.116384
Guo, Y., Yao, S., Cheng, H., and Zhu, W. (2020). China's Copper Futures Market Efficiency Analysis: Based on Nonlinear Granger Causality and Multifractal Methods. Resour. Policy 68, 101716. doi:10.1016/j.resourpol.2020.101716
Gürbüz, S., and Şahbaz, A. (2022). Investigating the Volatility Spillover Effect between Derivative Markets and Spot Markets via the Wavelets: The Case of Borsa İstanbul. Borsa Istanb. Rev. 22 (2), 321–331. doi:10.1016/j.bir.2021.05.006
Ji, Q., Xia, T., Liu, F., and Xu, J.-H. (2019). The Information Spillover between Carbon Price and Power Sector Returns: Evidence from the Major European Electricity Companies. J. Clean. Prod. 208, 1178–1187. doi:10.1016/j.jclepro.2018.10.167
Ji, Q., Zhang, D., and Geng, J.-b. (2018). Information Linkage, Dynamic Spillovers in Prices and Volatility between the Carbon and Energy Markets. J. Clean. Prod. 198, 972–978. doi:10.1016/j.jclepro.2018.07.126
Jiang, J. J., Ye, B., and Ma, X. M. (2014). The Construction of Shenzhen׳s Carbon Emission Trading Scheme. Energy Policy 75, 17–21. doi:10.1016/j.enpol.2014.02.030
Jiang, W., and Chen, Y. (2022). The Time-Frequency Connectedness Among Carbon, Traditional/new Energy and Material Markets of China in Pre- and Post-COVID-19 Outbreak Periods. Energy 246, 123320. doi:10.1016/j.energy.2022.123320
Keynes, J. M. (1936). The General Theory of Employment, Interest and Money. Limnol. Oceanogr. 12 (1-2), 28–36.
Li, Y., Huang, J., and Chen, J. (2021a). Dynamic Spillovers of Geopolitical Risks and Gold Prices: New Evidence from 18 Emerging Economies. Resour. Policy 70, 101938. doi:10.1016/j.resourpol.2020.101938
Li, Y., Liu, T., Song, Y., Li, Z., and Guo, X. (2021b). Could Carbon Emission Control Firms Achieve an Effective Financing in the Carbon Market? A Case Study of China's Emission Trading Scheme. J. Clean. Prod. 314 (145), 128004. doi:10.1016/j.jclepro.2021.128004
Liu, X., Ji, Q., and Yu, J. (2021). Sustainable Development Goals and Firm Carbon Emissions: Evidence from a Quasi-Natural Experiment in China. Energy Econ. 103, 105627. doi:10.1016/j.eneco.2021.105627
Liu, Y., Wei, Y., Wang, Q., and Liu, Y. (2022). International Stock Market Risk Contagion during the COVID-19 Pandemic. Finance Res. Lett. 45, 102145. doi:10.1016/j.frl.2021.102145
Luo, C., Liu, L., and Wang, D. (2021). Multiscale Financial Risk Contagion between International Stock Markets: Evidence from EMD-Copula-CoVaR Analysis. North Am. J. Econ. Finance 58, 101512. doi:10.1016/j.najef.2021.101512
Ma, Y., and Wang, J. (2021). Time-varying Spillovers and Dependencies between Iron Ore, Scrap Steel, Carbon Emission, Seaborne Transportation, and China's Steel Stock Prices. Resour. Policy 74, 102254. doi:10.1016/j.resourpol.2021.102254
Maneejuk, P., Thongkairat, S., and Srichaikul, W. (2021). Time-varying Co-movement Analysis between COVID-19 Shocks and the Energy Markets Using the Markov Switching Dynamic Copula Approach. Energy Rep. 7, 81–88. doi:10.1016/j.egyr.2021.05.076
Mensi, W., Lee, Y.-J., Vo, X. V., and Yoon, S.-M. (2021a). Quantile Connectedness Among Gold, Gold Mining, Silver, Oil and Energy Sector Uncertainty Indexes. Resour. Policy 74, 102450. doi:10.1016/j.resourpol.2021.102450
Mensi, W., Rehman, M. U., and Vo, X. V. (2021b). Dynamic Frequency Relationships and Volatility Spillovers in Natural Gas, Crude Oil, Gas Oil, Gasoline, and Heating Oil Markets: Implications for Portfolio Management. Resour. Policy 73, 102172. doi:10.1016/j.resourpol.2021.102172
Miao, X., Wang, Q., and Dai, X. (2022). Is Oil-Gas Price Decoupling Happening in China? A Multi-Scale Quantile-On-Quantile Approach. Int. Rev. Econ. Finance 77, 450–470. doi:10.1016/j.iref.2021.10.016
Naeem, M. A., Billah, M., Marei, M., and Balli, F. (2021). Quantile Connectedness between Sukuk Bonds and the Impact of COVID-19. Appl. Econ. Lett., 1–10. doi:10.1080/13504851.2021.1934384
Percival, D. B., and Walden, A. T. (2000). Wavelet Methods for Time Series Analysis. Cambridge University Press, Vol. 4.
Reboredo, J. C. (2014). Volatility Spillovers between the Oil Market and the European Union Carbon Emission Market. Econ. Model. 36, 229–234. doi:10.1016/j.econmod.2013.09.039
Sadorsky, P. (1999). Oil Price Shocks and Stock Market Activity. Energy Econ. 21 (5), 449–469. doi:10.1016/S0140-9883(99)00020-1
Saeed, T., Bouri, E., and Alsulami, H. (2021). Extreme Return Connectedness and its Determinants between Clean/green and Dirty Energy Investments. Energy Econ. 96, 105017. doi:10.1016/j.eneco.2020.105017
Salisu, A. A., Vo, X. V., and Lawal, A. (2021). Hedging Oil Price Risk with Gold during COVID-19 Pandemic. Resour. Policy 70, 101897. doi:10.1016/j.resourpol.2020.101897
Shah, A. A., and Dar, A. B. (2021). Exploring Diversification Opportunities across Commodities and Financial Markets: Evidence from Time-Frequency Based Spillovers. Resour. Policy 74, 102317. doi:10.1016/j.resourpol.2021.102317
Su, X. (2020). Measuring Extreme Risk Spillovers across International Stock Markets: A Quantile Variance Decomposition Analysis. North Am. J. Econ. Finance 51, 101098. doi:10.1016/j.najef.2019.101098
Tiwari, A. K., Aikins Abakah, E. J., Gabauer, D., and Dwumfour, R. A. (2022). Dynamic Spillover Effects Among Green Bond, Renewable Energy Stocks and Carbon Markets during COVID-19 Pandemic: Implications for Hedging and Investments Strategies. Glob. Finance J. 51, 100692. doi:10.1016/j.gfj.2021.100692
Wang, K.-M., and Lee, Y.-M. (2022). Is Gold a Safe Haven for Exchange Rate Risks? an Empirical Study of Major Currency Countries. J. Multinatl. Financial Manag. 63, 100705. doi:10.1016/j.mulfin.2021.100705
Wang, Y., and Guo, Z. (2018). The Dynamic Spillover between Carbon and Energy Markets: New Evidence. Energy 149, 24–33. doi:10.1016/j.energy.2018.01.145
Wen, F., Zhao, L., He, S., and Yang, G. (2020). Asymmetric Relationship between Carbon Emission Trading Market and Stock Market: Evidences from China. Energy Econ. 91, 104850. doi:10.1016/j.eneco.2020.104850
Wu, Q., Wang, M., and Tian, L. (2020). The Market-Linkage of the Volatility Spillover between Traditional Energy Price and Carbon Price on the Realization of Carbon Value of Emission Reduction Behavior. J. Clean. Prod. 245, 118682. doi:10.1016/j.jclepro.2019.118682
Xian, Y., Yu, D., Wang, K., Yu, J., and Huang, Z. (2022). Capturing the Least Costly Measure of CO2 Emission Abatement: Evidence from the Iron and Steel Industry in China. Energy Econ. 106, 105812. doi:10.1016/j.eneco.2022.105812
Xu, Y. (2021). Risk Spillover from Energy Market Uncertainties to the Chinese Carbon Market. Pacific-Basin Finance J. 67, 101561. doi:10.1016/j.pacfin.2021.101561
Yang, L. (2022). Idiosyncratic Information Spillover and Connectedness Network between the Electricity and Carbon Markets in Europe. J. Commod. Mark. 25, 100185. doi:10.1016/j.jcomm.2021.100185
Yin, J., Zhu, Y., and Fan, X. (2021). Correlation Analysis of China's Carbon Market and Coal Market Based on Multi-Scale Entropy. Resour. Policy 72, 102065. doi:10.1016/j.resourpol.2021.102065
Yu, J., Shi, X., Guo, D., and Yang, L. (2021). Economic Policy Uncertainty (EPU) and Firm Carbon Emissions: Evidence Using a China Provincial EPU Index. Energy Econ. 94, 105071. doi:10.1016/j.eneco.2020.105071
Yuan, N., and Yang, L. (2020). Asymmetric Risk Spillover between Financial Market Uncertainty and the Carbon Market: A GAS-DCS-Copula Approach. J. Clean. Prod. 259, 120750. doi:10.1016/j.jclepro.2020.120750
Zhang, Y.-J., and Sun, Y.-F. (2016). The Dynamic Volatility Spillover between European Carbon Trading Market and Fossil Energy Market. J. Clean. Prod. 112, 2654–2663. doi:10.1016/j.jclepro.2015.09.118
Zhao, L., and Wen, F. (2022). Risk-return Relationship and Structural Breaks: Evidence from China Carbon Market. Int. Rev. Econ. Finance 77, 481–492. doi:10.1016/j.iref.2021.10.019
Zhou, X., Gao, Y., Wang, P., Zhu, B., and Wu, Z. (2022). Does Herding Behavior Exist in China's Carbon Markets? Appl. Energy 308, 118313. doi:10.1016/j.apenergy.2021.118313
Zhu, B., Huang, L., Yuan, L., Ye, S., and Wang, P. (2020). Exploring the Risk Spillover Effects between Carbon Market and Electricity Market: A Bidimensional Empirical Mode Decomposition Based Conditional Value at Risk Approach. Int. Rev. Econ. Finance 67, 163–175. doi:10.1016/j.iref.2020.01.003
Keywords: shenzhen carbon market, risk transmission, TVP-DY index, MODWT, quantile spillover
Citation: Chen Y, Wang C, Miao J and Zhou T (2022) Identifying Risk Transmission in Carbon Market With Energy, Commodity and Financial Markets: Evidence From Time-Frequency and Extreme Risk Spillovers. Front. Energy Res. 10:922808. doi: 10.3389/fenrg.2022.922808
Received: 18 April 2022; Accepted: 04 May 2022;
Published: 22 June 2022.
Edited by:
Jian Yu, Central University of Finance and Economics, ChinaReviewed by:
Zhenhua Liu, China University of Mining and Technology, ChinaYahua Xu, Central University of Finance and Economics, China
Copyright © 2022 Chen, Wang, Miao and Zhou. This is an open-access article distributed under the terms of the Creative Commons Attribution License (CC BY). The use, distribution or reproduction in other forums is permitted, provided the original author(s) and the copyright owner(s) are credited and that the original publication in this journal is cited, in accordance with accepted academic practice. No use, distribution or reproduction is permitted which does not comply with these terms.
*Correspondence: Jiafeng Miao, miaojiafeng1996@gmail.com