Marketing Mix of Energy Companies of EnergyTech From the Positions of Their Contribution to Sustainable and Environmental Development of Energy Economics
 Lyudmila V. Borisova1
  Yuliya G. Tyurina
 Irina А. Morozova
- 1Department of Innovative Business and Management, Don State Technical University, Rostov-on-Don, Russia
- 2Financial University under the Government of the Russian Federation, Moscow, Russia
- 3Department of Economics and Management, Volgograd State Technical University, Volgograd, Russia
- 4Institute of Economics and Management, North Caucasus Federal University, Stavropol, Russia
Introduction
If natural monopolies dominated the world energy markets in the past century, in recent years, due to the emergence and mass availability of alternative and clean energy, competition has been increasing in these markets. Global competitiveness requires energy companies to actively use the marketing tools of business management. Marketing support for the corporate environmental responsibility of energy companies also plays an important role.
Marketing penetrates from the outside into the activities of traditional players in the energy markets—oil and gas companies—with the artificial creation of competition in natural monopolies (Li et al., 2022; Wei et al., 2022). Against their background, new players that have entered the energy markets, in connection with the development of sustainable territories and responsible communities, are clearly distinguished—“clean” energy companies (EnergyTech). Marketing is deeply integrated into their activities (rooted in their nature) (Dai et al., 2022).
According to the calculations of the International Energy Agency (2022), the share of “clean” (renewable) energy in the world energy markets was 29% in 2020, which is an increase compared to 2019, when it was 27%. In 2021, its growth continued, which was estimated to be 8%. The largest producers of “clean” energy are China (almost 300 TW), the United States (100 TW), and the European Union (70 TW), where wind energy prevails. They are followed by India (40 TW), where solar energy prevails. In the rest of the world, hydropower is the dominant source of energy, and the share of bioenergy is quite large.
Taking into account the domination in the global energy markets by oil and gas companies, the existing literature reports by Nuseir and El Refae (2021) and Shukla et al. (2021) focus on the marketization of these companies. The growing level of environmental awareness and responsibility of energy consumers, as well as the launch and implementation of economic decarbonization strategies in countries around the world, contributes to rethinking the activities of energy companies from the standpoint of their contribution to sustainable and environmental development of energy economics.
The problem is that the activities of oil and gas companies make a small contribution, while the activities of clean energy companies (EnergyTech), which make the greatest contribution to sustainable and environmental development of energy economics, have not been properly considered in the existing literature. Their marketing mix is poorly understood, while this article hypothesizes that it is marketing that helps to achieve this contribution. This article is aimed at researching the marketing mix of clean energy companies (EnergyTech) in terms of their contribution to the sustainable and ecological development of the energy economy.
Noospheric Approach to Marketing of EnergyTech Companies
This article is based on the noospheric approach to the study of economic activity in the unity of its economic (profitability and effectiveness of “green” investment projects of energy companies), social (benefits to society in the form of corporate environmental responsibility), and environmental (contribution of energy companies to the conservation of natural resources for future generations and the fight against climate change) components.
In the existing literature, much attention is paid to the contribution of energy companies to sustainable and environmental development of energy economics. A whole layer of scientific research is devoted to the best practices of the European Union (EU), which enables us to note that this contribution is achieved mainly through regulatory measures. For example, EU legislation is actively fighting against natural monopolies.
The requirement of securing competition contributes to the marketization of the activities of oil and gas companies (Menegaki, 2012), but obviously, this is not enough since it has already been announced that a carbon tax will be introduced in the near future (Jiménez-Marín et al., 2021). Consequently, the contribution of energy companies to sustainable and environmental development of energy economics is determined by government regulation of their operations (Kagiannas et al., 2003). The marketing of oil and gas companies is described in detail in the works of Cheah and Low (2022) and Krishnan and Butt (2022), which note the insignificant role of marketing in ensuring the contribution of these companies to the sustainable and environmental development of energy economics.
At the same time, the marketing of “clean” energy companies (EnergyTech) is poorly studied, and its role in ensuring their contribution to sustainable and environmental development of energy economics is unknown, which is a research gap. Some issues in the marketing of “clean” energy companies are considered in the works of Kratschmann and Dütschke (2021), Wei et al. (2021), and Das et al. (2022). This article is designed to fill this gap, i.e., to identify the features of the marketing mix of EnergyTech companies, as well as to determine the role of marketing in their contribution to achieving sustainable and environmental development of energy economics.
Critical Analysis of the Marketing Mix Experience of the World’s Largest Energy Companies Specializing in “Clean” Energy in 2021
To clarify the causal relationships of the contribution of EnergyTech companies to sustainable and environmental development of energy economics, their marketing activities are being investigated. The research methodology is based on the 7P marketing mix model. Using this method, we will conduct a review and critical analysis of the marketing mix experience of the world’s largest energy companies specializing in “clean” energy in 2021, in accordance with the materials of “New Energy Giants Are Renewable Companies” Bloomberg (2022). The study was conducted on the example of the so-called “clean supermajors” Enel, Iberdrola, NextEra, and Orsted, which have overtaken oil and gas companies by market capitalization (in particular, Exxon, Eni, Repsol, and BP). Next, we will consider these results through the prism of the elements of the marketing mix.
P1: product. The range of directions of product quality management of EnergyTech companies is very wide. For example, Iberdrola (based in Spain and operating in the United States, Great Britain, Mexico, Brazil, and Australia) invests in new technologies such as “green” hydrogen and ammonia, as well as in electric vehicle charging stations in order to improve environmental friendliness (as a key quality factor). The volume of investments in the “green” innovations of this company in the period from 2020 to 2025 is estimated to be $ 89 billion.
P2: price. Owing to the large volume of financial resources, EnergyTech companies charge a price premium to the price for the environmental friendliness of their products. According to Bloomberg (2022), in order to avoid an environmental crisis in the period up to 2050, $11 trillion of investments in EnergyTech will be required. This will inevitably lead to an increased cost of “clean” energy compared to oil and gas analogs.
P3: place of sale. EnergyTech companies are strongly dependent on the infrastructure. For example, NextEra (the world’s largest investor–producer of solar and wind energy) operates in the United States and Canada, where it invested $60 billion in pipelines from 2019 to 2022 and plans to create another 30 million new solar panels by 2030.
P4: promotion. EnergyTech companies pay great attention to loyalty management programs toward their activities not only on the part of state regulatory authorities but also representatives of businesses and local communities. For example, the company Orsted (based in Denmark and operates in Denmark, Great Britain, Germany, United States, Netherlands, and Taiwan) divested fossil fuels and expanded its clean energy business to develop projects around the world.
P5: people. Human resources are critically important for EnergyTech companies, and they are more human-capital-intensive industries than those of oil and gas companies. For example, the number of employees of the oil and gas company Eni is 31 thousand people, and the company EnergyTech Iberdrola is 67 thousand people. Similarly, the number of employees of the oil and gas company Repsol is 24 thousand people, and the number of staff of the company EnergyTech Orsted is 36 thousand people. At the same time, the capitalization of all these companies is the same.
P6: process. All processes of EnergyTech companies are flexible—they are constantly being transformed in accordance with changes in demand, the environment, and many other factors. As noted in the materials of Bloomberg (2022), “clean” energy cannot yet completely replace fossil fuels. As an example, the experience of another EnergyTech company is noteworthy, Tesla Inc., which provides solar energy for about half of the energy in the grid during the day in South Australia.
P7: physical evidence. EnergyTech companies consider the environment as their physical evidence. For example, Enel (based in Italy) conducts business in more than 30 countries and presents itself as an EnergyTech company seeking to support countries around the world to switch to “clean” energy. To achieve this, the company plans to invest $190 billion in “clean” energy by 2030.
Discussion
The article contributes to the development of the theory of sustainable energy through the justification of the key role of marketing in achieving the contribution of EnergyTech companies to sustainable and environmental development of energy economics. A comparative analysis of the marketing mix of “clean” energy companies and oil and gas companies is presented in Table 1.
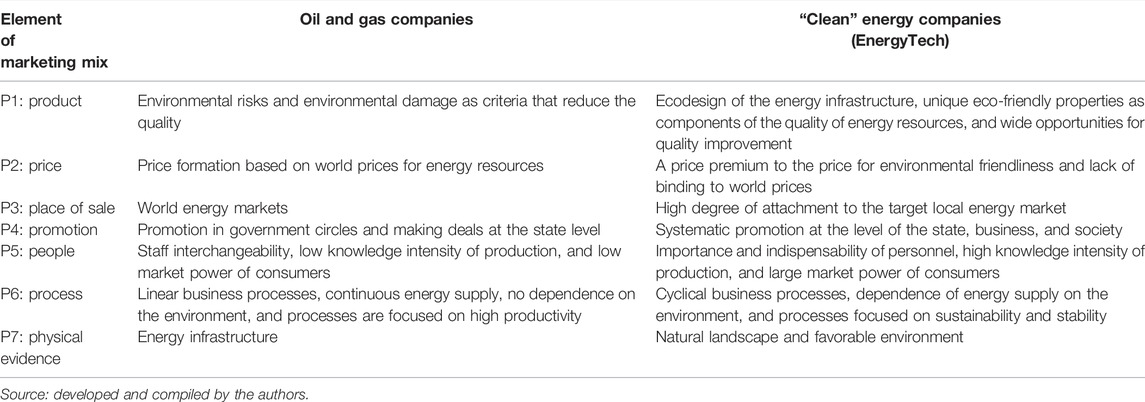
TABLE 1. Comparative analysis of the marketing mix of “clean” energy companies and oil and gas companies.
As can be seen from Table 1, the difference between oil and gas companies and EnergyTech companies is observed at the marketing level, and the difference is manifested in each element of the marketing mix. P1: product. For oil and gas companies, product marketing is aimed at reducing environmental risks and environmental damage as criteria (preventing quality degradation). The product marketing of EnergyTech companies is aimed at improving quality through eco-design of energy infrastructure and unique environmental properties as components of the quality of energy resources.
P2: price. The pricing of oil and gas companies is based on world prices for energy resources. EnergyTech companies have a premium on the price for environmental friendliness, but they do not have a link to world prices.
P3: place of sale. Oil and gas companies ensure their presence in the global energy markets. EnergyTech companies, due to the peculiarities of the “clean” energy infrastructure, are strictly tied to the target local energy market.
P4: promotion. Oil and gas companies promote their activities in government circles as deals for the supply of their products are concluded at the state level. EnergyTech companies carry out the systematic promotion of their activities and their products in the state, business, and society as the approval of local communities is important for them.
P5: people. Oil and gas companies have interchangeable personnel, low knowledge intensity of production, and low market power of consumers. EnergyTech companies are characterized by the valuable and indispensable personnel, high knowledge intensity of production, and large market power of consumers.
P6: process. Oil and gas companies have linear business processes, and they are focused on high productivity; the energy supply is continuous and does not depend on the environment. EnergyTech companies have circular business processes, and they are focused on sustainability and stability; energy supply depends on the environment.
P7: physical evidence. The physical evidence for oil and gas companies is their energy infrastructure, and it is a natural landscape or a favorable environment in the case of EnergyTech companies.
Thus, in contrast to Kagiannas et al. (2003), Cheah and Low (2022), and Krishnan and Butt (2022), it has been found that the contribution to the sustainable and environmental development of energy economics is provided not through government regulation, but through the marketing of EnergyTech companies. Rethinking the activities of energy companies from the standpoint of the Noospheric approach revealed that the economic component prevails in the activities of oil and gas companies. In contrast, marketing contributes to the fact that the economic, social, and environmental components in the activities of EnergyTech companies are balanced, which contributes much more (compared to oil and gas companies) to the sustainable and environmental development of energy economics.
Conclusion
As a result of the conducted research, it can be concluded that the hypothesis put forward has been confirmed; the significant contribution of clean energy companies (EnergyTech) to the sustainable and environmentally friendly development of the energy economy is based on the features of their marketing mix, which is fundamentally different from the marketing mix of oil and gas companies. The theoretical significance of the results obtained lies in revealing the causal relationships of the contribution of EnergyTech companies to the sustainable and ecological development of energy economics, as well as the fact that marketing is the basis of this contribution.
The fundamental difference between oil and gas companies and EnergyTech companies in the field of marketing demonstrated in the article has formed a new wide field for further study of these types of companies separately, taking into account their marketing features. Management implications are related to the fact that the marketing mix of EnergyTech companies revealed in the article may be subject to further improvement by these companies to maximize their contribution to sustainable and environmental development of energy economics.
Author Contributions
All authors listed have made a substantial, direct, and intellectual contribution to the work and approved it for publication.
Conflict of Interest
The authors declare that the research was conducted in the absence of any commercial or financial relationships that could be construed as a potential conflict of interest.
Publisher’s Note
All claims expressed in this article are solely those of the authors and do not necessarily represent those of their affiliated organizations, or those of the publisher, the editors, and the reviewers. Any product that may be evaluated in this article, or claim that may be made by its manufacturer, is not guaranteed or endorsed by the publisher.
References
Bloomberg (2022). New Energy Giants Are Renewable Companies. Available at: https://www.bloomberg.com/graphics/2020-renewable-energy-supermajors/ (Accessed 04 25, 2022).
Cheah, S. K. A., and Low, B. (2022). The Impact of Public Policy Marketing, Institutional Narratives and Discourses on Renewable Energy Consumption in a Developing Economy. Asia Pac. J. Mark. Logist. 34 (5), 944–962. doi:10.1108/APJML-11-2020-0835
Dai, S., Ye, Z., Wei, W., Wang, Y., and Jiang, F. (2022). Economic Analysis of Transactions in the Energy Storage Power Market: A Life-Cycle Cost Approach. Front. Energy Res. 10, 845916. doi:10.3389/fenrg.2022.845916
Das, S., Nayak, J., Mishra, M., and Naik, B. (2022). Solar Photo Voltaic Renewal Energy: Analyzing the Effectiveness of Marketing Mix Strategies. Lect. Notes Electr. Eng. 814, 527–540. doi:10.1007/978-981-16-7076-3_45
International Energy Agency (2022). Global Energy Review 2021: Renewables. Available at: https://www.iea.org/reports/global-energy-review-2021/renewables (Accessed 04 25, 2022).
Jiménez-Marín, G., Zambrano, R. E., Galiano-Coronil, A., and Ravina-Ripoll, R. (2021). Business and Energy Efficiency in the Age of Industry 4.0: The Hulten, Broweus and Van Dijk Sensory Marketing Model Applied to Spanish Textile Stores during the COVID-19 Crisis. Energies 14 (7), 1966. doi:10.3390/en14071966
Kagiannas, A. G., Patlitzianas, K. D., Askounis, D. T., and Psarras, J. (2003). Enhancing Energy Policy Cooperation between EU and GCC: A Marketing Strategy for Oil and Gas Technologies. Int. J. Glob. Energy Issues 19 (4), 310–332. doi:10.1504/IJGEI.2003.003198
Kratschmann, M., and Dütschke, E. (2021). Selling the Sun: A Critical Review of the Sustainability of Solar Energy Marketing and Advertising in Germany. Energy Res. Soc. Sci. 73, 101919. doi:10.1016/j.erss.2021.101919
Krishnan, R., and Butt, B. (2022). “The Gasoline of the Future:” Points of Continuity, Energy Materiality, and Corporate Marketing of Electric Vehicles Among Automakers and Utilities. Energy Res. Soc. Sci. 83, 102349. doi:10.1016/j.erss.2021.102349
Li, G., Li, G., and Zhou, M. (2022). Market Transaction Model Design Applicable for Both Plan and Market Environment of China's Renewable Energy. Front. Energy Res. 10, 862653. doi:10.3389/fenrg.2022.862653
Menegaki, A. N. (2012). A Social Marketing Mix for Renewable Energy in Europe Based on Consumer Stated Preference Surveys. Renew. Energy 39 (1), 30–39. doi:10.1016/j.renene.2011.08.042
Nuseir, M. T., and El Refae, G. A. (2021). Marketing Efficiency of Energy-Efficient Electrical Home Appliances in the Gulf Cooperation Council (GCC) Region. Int. J. Trade Glob. Mark. 14 (6), 603–619. doi:10.1504/IJTGM.2021.118909
Shukla, P., Paul, D., Malik, S., and Mishra, D. K. (2021). The Role of Green Marketing in Energy Conservation in the Domestic Sector. Int. J. Energy Econ. Policy 11 (1), 263–269. doi:10.32479/ijeep.10567
Wei, C., Li-Feng, Z., and Hong-Yan, D. (2021). Impact of Cap-And-Trade Mechanisms on Investments in Renewable Energy and Marketing Effort. Sustain. Prod. Consum. 28, 1333–1342. doi:10.1016/j.spc.2021.08.010
Keywords: marketing mix, energy companies, oil and gas companies, EnergyTech, sustainable development, environmental development, energy economics
Citation: Borisova LV, Tyurina YG, Morozova IА and Momotova ON (2022) Marketing Mix of Energy Companies of EnergyTech From the Positions of Their Contribution to Sustainable and Environmental Development of Energy Economics. Front. Energy Res. 10:931891. doi: 10.3389/fenrg.2022.931891
Received: 29 April 2022; Accepted: 11 May 2022;
Published: 21 June 2022.
Edited by:
Elena G. Popkova, Moscow State Institute of International Relations, RussiaReviewed by:
Nursultan Shurenov, Al-Farabi Kazakh National University, KazakhstanCopyright © 2022 Borisova, Tyurina, Morozova and Momotova. This is an open-access article distributed under the terms of the Creative Commons Attribution License (CC BY). The use, distribution or reproduction in other forums is permitted, provided the original author(s) and the copyright owner(s) are credited and that the original publication in this journal is cited, in accordance with accepted academic practice. No use, distribution or reproduction is permitted which does not comply with these terms.
*Correspondence: Yuliya G. Tyurina, u_turina@mail.ru