A Dynamic Evaluation Method for High-Permeability New Energy Distribution Network Planning Considering Multistage Development Trends
 Junxiao Zhang1
  Min Xu
 Zuogang Guo
- 1Grid Planning & Research Center, Guangdong Power Grid Co., Ltd., Guangzhou, China
- 2Electric Power Research Institute, CSG, Guangzhou, China
With the development of new power systems, high penetration of new energy (HPNE) will become a major feature of power systems in the future. In order to solve the problem that the traditional distribution network planning index makes it difficult to fully consider the impact of new energy access on the distribution network, this paper constructs a distribution network planning evaluation index system considering the characteristics of HPNE, and designs a set of static comprehensive evaluation methods of distribution network planning schemes based on the “over-average penalty” entropy weight method (EWM). At the same time, distribution network planning is a long-term dynamic process, and the static evaluation method makes it difficult to describe the actual situation of the multistage construction process of distribution networks. To this end, a dynamic evaluation method of distribution network planning is proposed, which realizes the comprehensive evaluation of multistage distribution network planning based on dual excitation control lines. Finally, an example of four 10 kV distribution network planning schemes of a power supply bureau are analyzed to prove the effectiveness of the proposed method.
1 Introduction
Vigorously promoting the sustainable development of renewable energy, improving its penetration in the power grid, and achieving the goal of “carbon peaking and carbon neutralization” have become the new trends of building a green and clean power system (NDRC, 2015; Yang et al., 2018). However, high permeability new energy access brings new challenges to the distribution network, such as randomization of the operation state and the complexity of planning objectives (Kang and Yao, 2017; Zhang et al., 2021). Therefore, Zou et al. (2012), Jia et al. (2018), and Wang et al. (2019) used different methods to solve the problem of improving the randomness of distribution network operations after new energy access, and realized the robust planning of new distribution networks. Huang et al. (2016), Su et al. (2016), Sheng and Liu (2017), Wang et al. (2019), and Yao et al. (2019) incorporated economic benefit indicators, energy conservation and emission reduction indicators, power quality indicators, and other objectives into the planning of distributed resources accessing active distribution networks. It can be seen that a large number of distribution network planning studies focus on how to solve the highly stochastic robust planning problem with the penetration of new energy and the collaborative planning problem with different objectives. By contrast, in distribution network planning research, the index quantification and statistical analysis of the impact of HPNE on distribution networks is still in its infancy.
In the evaluation index system of distribution network planning schemes, the traditional distribution network planning indexes can be divided into three categories: economic indexes considering construction cost, reliability indexes considering power supply reliability, and other technical indexes similar to new energy consumption rates. In the context of high permeability new energy access, these traditional indicators make it difficult to fully consider the impact of new energy access on distribution networks. Therefore, some studies have been carried out.
Yan et al. (2018) made a preliminary exploration into the distribution network evaluation indexes of new energy characteristic access, and designed new indexes such as new energy output fluctuation. Zhang et al. (2010) considered various impacts of distributed resource access on distribution networks and put forward corresponding quantitative indexes. Chen et al. (2017) designed a new distribution network evaluation index, considering the voltage and frequency fluctuations of the bus with photovoltaic grid-connection. Considering the penetration of renewable energy, Ma et al. (2019) established a new evaluation index system for economic operation of distribution networks. In addition, many distribution network evaluation systems with different requirements have been established (Cui et al., 2013; Liu et al., 2013; Ou et al., 2014). The above studies have tried to include the impact of new energy on the distribution network evaluation. However, a complete evaluation index system for distribution network planning under the high permeability new energy has not been formed.
As for the comprehensive evaluation method of distribution network planning schemes, many scholars have studied and discussed it. Wang et al. (2018) comprehensively evaluated the intelligent planning schemes of distribution networks by using the analytic hierarchy process. Ding et al. (2015) introduced the utility risk model and fuzzy comprehensive evaluation method into the vulnerability assessment of distribution networks. Gang et al. (2007) attempted to establish a comprehensive Decision-Making System for distribution network planning schemes using the data envelopment method. In Jiang et al. (2021), a comprehensive evaluation system of distribution network indicators was established based on the analytic hierarchy process. These studies depend on the subjective evaluation of the importance of each index. And it is worth noting that every index in distribution network planning is of great significance, especially the reliability index. The disqualification of any index should be reflected in the final evaluation results. However, the current research used the weighted summation method to calculate the final evaluation value, which makes it difficult to reflect the impact of unqualified indicators. In addition, these studies on distribution network planning and evaluation focus more on the static evaluation at the end of distribution network planning, while distribution network planning is actually a multistage dynamic problem.
To sum up, this paper systematically explores the distribution network planning with the characteristics of HPNE, puts forward a distribution network planning index system, and designs a static comprehensive evaluation method for distribution network planning schemes. Furthermore, a dynamic evaluation method considering the characteristics of multistage distribution network planning is introduced to form a complete evaluation system of distribution network planning schemes. The main contributions of the article are as follows:
1) According to the actual impact of HPNE on the distribution network, the evaluation indexes considering the characteristics of HPNE are summarized. Combined with the existing evaluation index system of distribution network planning schemes, a comprehensive evaluation index system more suitable for distribution network planning in the future new power system is proposed in this paper.
2) In order to highlight the impact of unqualified indexes, this paper introduces an “over-average penalty” to improve the entropy weight method (I-EWM), and further puts forward the static comprehensive evaluation method of distribution network planning schemes under the HPNE.
3) Considering that distribution network planning is a multistage dynamic process, a dynamic evaluation method of distribution network planning schemes based on dual excitation control lines is proposed.
2 Evaluation Index System of Distribution Network Planning Schemes Under High Penetration of New Energy
2.1 Characteristics of Grid Integration of New Energy
Grid integration indexes reflect the impact of the energy and distribution characteristics of new energy on the distribution network, including typical output fluctuation index CF, dispersion index CD, and line N−1 verification contribution rate index CN−1.
2.1.1 Typical Output Fluctuation Index CF
The fluctuation and intermittence of the new energy output will interfere with the operation of the distribution network. Considering that new energy is changeable and highly random, this paper introduces the typical output fluctuation index to quantify the fluctuation of new energy. The typical output of new energy can be extracted by the hierarchical clustering method (Peng et al., 2015).
where
2.1.2 Dispersion Index CD
In the distribution network, the more dispersed the access of new energy, the more conducive to the local consumption of energy. Therefore, this paper proposes the dispersion index. The calculation formula is:
where
2.1.3 Line
Considering that the new energy can be considered as a standby resource (Pan et al., 2017), it contributes to improving the
where
2.2 New Energy Acceptance Capacity
The specific contents of new energy acceptance capacity indexes include effective penetration rate index CP and peak shaving contribution CB.
2.2.1 Effective Penetration Rate Index CP
Considering power flow reverse transmission will pose a threat to security (Chen et al., 2021; Hu et al., 2019), the effective penetration rate index is proposed to investigate the local consumption of new energy.
where
2.2.2 Peak Shaving Contribution Index CB
In order to consider the contribution of new energy in peak shaving, this paper introduces the peak shaving contribution index as:
where
2.3 Economy of New Energy Access
The economy of new energy access consists of direct and green economic benefits.
2.3.1 Direct Economic Benefits
The direct economic benefit is calculated by subtracting the annual cost of new energy installation and operation from its own power generation income.
where
2.3.2 Green Economic Benefits
where
2.4 Reliability Indexes
This paper selects the comprehensive power supply availability rate
2.4.1 Power Supply Availability Rate
The power supply availability rate index is obtained by the power outage time of users.
where
2.4.2 Average Household Power Outage Time
The
where
2.5 Technical Evaluation Indexes
The technical indexes reflect the operation level of the distribution network, which include the voltage qualification rate
2.5.1 Voltage Qualification Rate
The new energy improves the problem of voltage drop at the end of the distribution network effectively. The larger
where
2.5.2 Line Loss Rate
Reasonable arrangement of the location and capacity of new energy can effectively reduce the line loss (Bai et al., 2015; Kang and Yao, 2017). Therefore, the line loss rate is introduced to quantify the impact of new energy on the operation of the power grid.
where
So far, the comprehensive evaluation index system for distribution network planning under HPNE has been established.
3 Static Comprehensive Evaluation Method of Distribution Network Planning Schemes Based on the “Over-Average Penalty” Entropy Weight Method
3.1 Standardized Processing Method
There are differences in the dimensions and attributes of each index in the comprehensive evaluation index system for distribution network planning under HPNE. The deviation standardization method is used to normalize the raw data, and all index values are converted into benefit-type values in the [0, 1] interval (that is, the larger the value, the better).
Assuming that m distribution network planning schemes are evaluated at a certain stage
If the index
If the index
3.2 “Over-Average Penalty” Entropy Weight Method
Considering that the hierarchical order relationship method and the AHP both rely on expert knowledge, their results contain subjective experience. So, this paper adopts the entropy weight method based on the entropy of data information for evaluation.
For the evaluation object
The information entropy of the corresponding index Xj is:
Considering that each index has rich meanings, and the failure of any indicator should be reflected in the final evaluation result, this paper introduces the “over-average penalty.” When weighting the evaluation value of each scheme, the corresponding weight of the element whose value is lower than the average value of the index is reset to zero.
where
4 Dynamic Evaluation Method of Distribution Network Planning Schemes Based on Dual Excitation Control Lines
This paper introduces a dynamic evaluation method based on dual excitation control lines, which considers the multistage construction process of the distribution network.
4.1 Information Aggregation Algorithm Based on Dual Excitation Control Lines
Discrete evaluation points at different stages are transformed into continuous curves within a unit time period and are compared with positive and negative excitation lines. Appropriate rewards and punishments are given to the part above the positive incentive line and the part below the negative incentive line, respectively. The new evaluation value of each time period is obtained after weighted summation based on the positive and negative excitation coefficients. Finally, the new evaluation value is weighted and summed by the time factor to obtain the dynamic comprehensive evaluation value of the evaluation object. Dual excitation lines are usually expressed in linear form:
where
The multistage evaluation value connecting line constitutes the development track of the evaluation object. The area enclosed by it and the horizontal axis reflect the overall condition of the evaluation object in the multi-stage. Therefore, the comprehensive evaluation value can be expressed by an integral. As shown in Figure 1, the area enclosed by the straight line
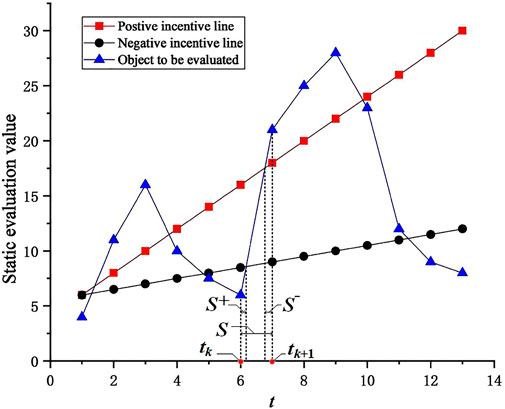
FIGURE 1. Schematic diagram of dual excitation control lines.
Similarly, the comprehensive evaluation value of positive incentive
Due to the introduction of positive and negative excitation lines, the dynamic evaluation value includes rewards and punishments for the parts outside the positive and negative excitation lines. Let
Through the weighted synthesis of each time period in the whole process
where
To determine the positive and negative excitation coefficients
1) The principle of conservation of incentives.
For all m evaluation objects, the total number of positive and negative incentives is equal.
2) The principle of moderate incentives.
The sum of the positive and negative excitation coefficients is 1.
4.2 Multistage Dynamic Comprehensive Evaluation Steps
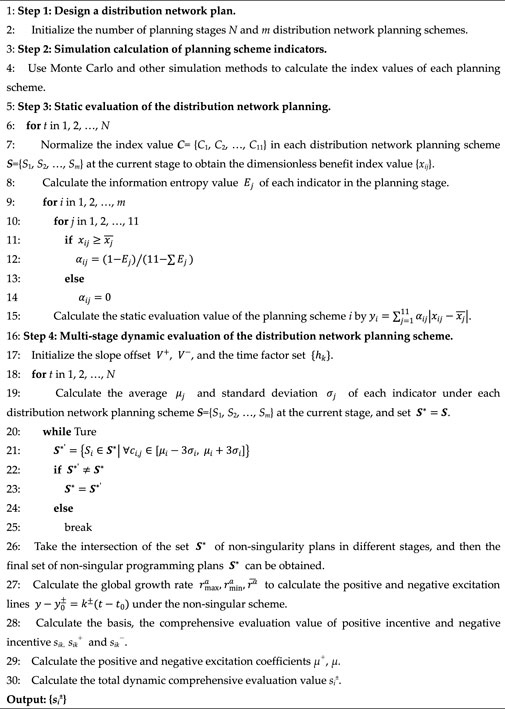
The basic data of the multistage dynamic comprehensive evaluation should be derived from the static comprehensive evaluation results of the distribution network planning scheme in Section 3. Before the multistage dynamic evaluation of the distribution network planning, the static comprehensive evaluation of each stage needs to be carried out. The evaluation idea of the entire dynamic comprehensive evaluation is shown in the following pseudo code.
Algorithm 1. 1A dynamic evaluation method of distribution network planning schemes based on dual excitation control lines
5 Case Analysis
To verify the method proposed in this paper, we conducted an evaluation of four schemes of a 20-year 10 kV distribution network planning bureau in China. Each case is divided into four stages for planning. According to Section 2, the different index values of each case are shown in Supplementary Appendix B. The static evaluation result of I-EWM and EWM is shown in Table 1. The result of I-EWM is smaller than that of EWM, because each case is subject to the over-average penalty.
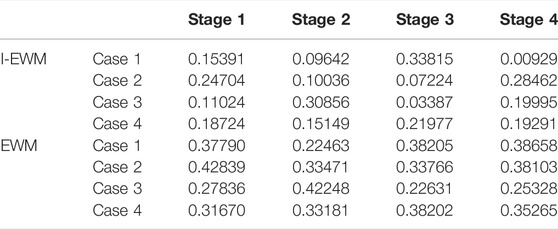
TABLE 1. Comprehensive evaluation results by I-EWM and EWM.
In order to analyze the “over-average penalty”, we took the first stage as an example, and used the radar chart to compare the normalized indicators of each planning scheme with its average value as shown in Figure 2. The weight calculated by the EWM is displayed as shown in Figure 3. From Figure 2, most indicators of case 1 and case 3 are below the average in stage 1. So, they are punished by the average value. In Figure 3, it can be seen that compared to case 4, case 2 has a higher weight for the indicators that are not subject to the mean penalty. Therefore, the final evaluation of case 2 is better than that of case 4.
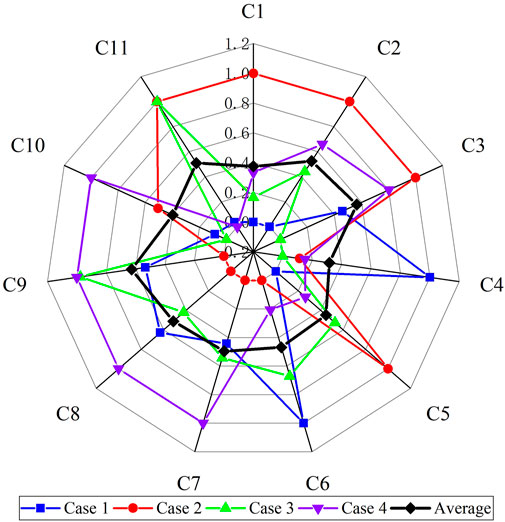
FIGURE 2. Radar chart of indicators compared to the average for each option under planning stage 1.
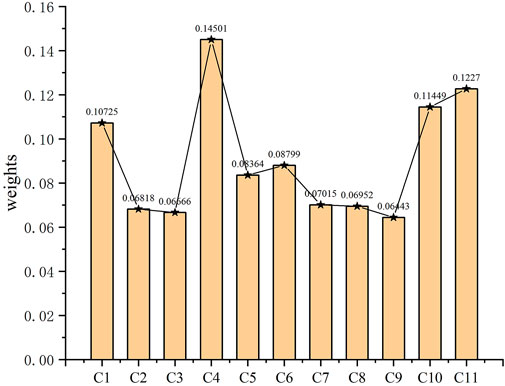
FIGURE 3. Weight value of each index obtained by EWM in planning stage 1.
Further, the multistage dynamic evaluation method is used to realize the comprehensive evaluation of the four cases.
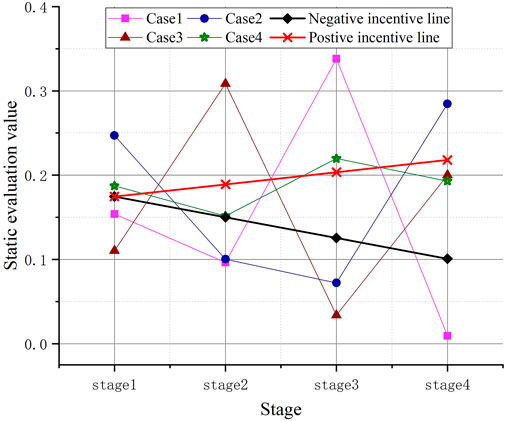
FIGURE 4. Dynamic evaluation infographic under
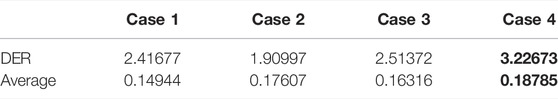
TABLE 2. Dynamic comprehensive evaluation results of each planning case (
The dynamic evaluation results are closely related to the setting of positive and negative excitation lines. In order to explore the influence of excitation lines, this paper sets the combination of positive and negative slope offsets with an interval of 0.1. The dynamic evaluation surface is shown in Figure 5.
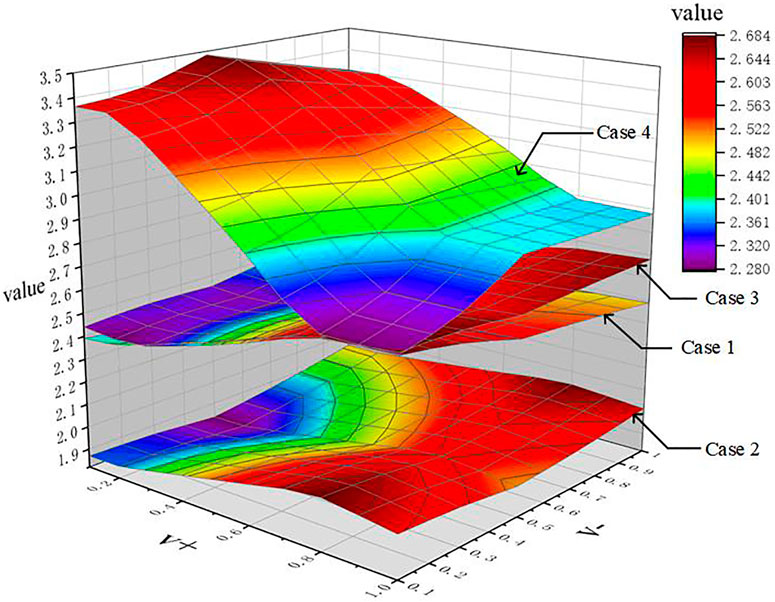
FIGURE 5. Dynamic evaluation surfaces of each scheme under different
From Figure 5, case 4 is always superior to other cases, and case 2 is obviously inferior to other options. Simultaneously, the average value of static evaluation can also reflect the superiority of case 4, but it cannot reflect the disadvantage of case 2 during the overall planning period. In addition, the result of cases 1, 3, and 4 are close when V^+ = 1.0, V^− = 0.1. The positive and negative excitation lines make the evaluation results of the three case reach the same level. So, the results of the change of
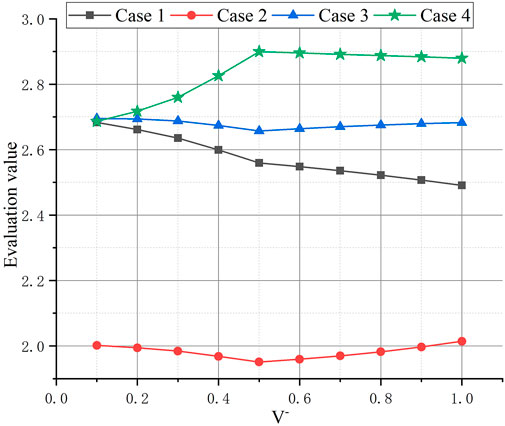
FIGURE 6. The influence of different
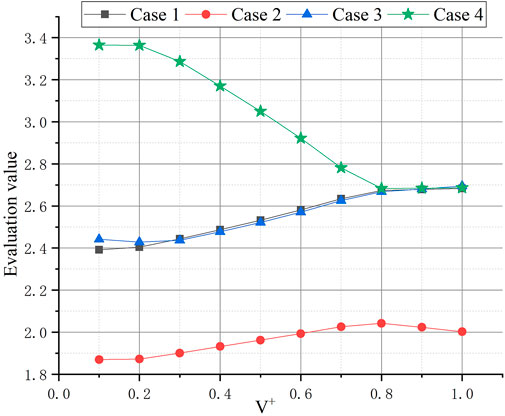
FIGURE 7. The influence of different
From Figure 6 and Figure 7, the results of each case show different trends with the change of
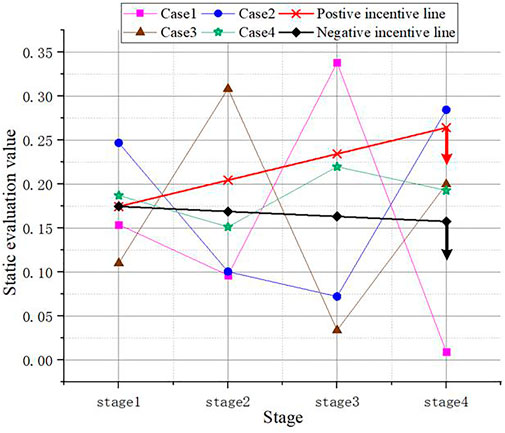
FIGURE 8. Dynamic evaluation infographic under
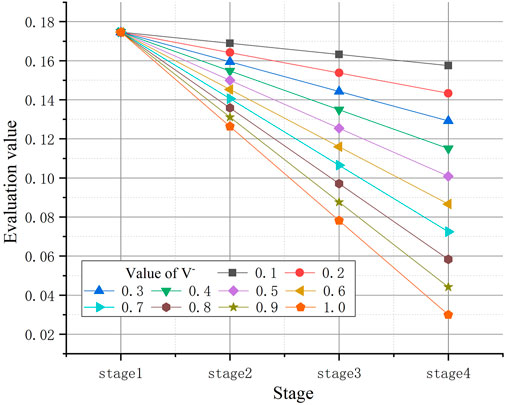
FIGURE 9. Influence of different
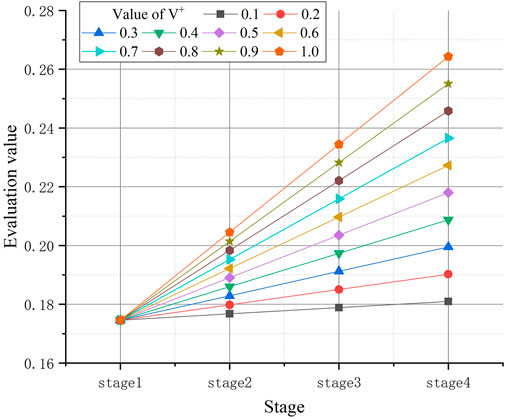
FIGURE 10. Influence of different
When
From Figure 7, before
To sum up, the selection of the positive and negative slope offset
6 Conclusion
In summary, this paper discusses the dynamic comprehensive evaluation of the multistage segment distribution network planning scheme under the characteristics of high permeability new energy. The main contributions are as follows:
1) The evaluation index considering the characteristics of HPNE is summarized and extracted. A comprehensive evaluation index system that is more suitable for the planning of distribution networks under the new power system in the future is proposed.
2) The entropy weight method is improved by introducing the “over-average penalty”. A static comprehensive evaluation method for the distribution network planning scheme under the HPNE is proposed.
3) A dynamic evaluation method based on the multistage development of the dual excitation control line distribution network planning is proposed to realize the dynamic evaluation of the multistage planning scheme of the distribution network.
It needs to be clarified that under the dynamic evaluation method in this paper, the development trend of the static evaluation results and the positive and negative incentives in each stage are fitted to a linear trend, which will make it difficult to accurately describe the distribution network changes in each stage of the planning scheme evaluation. The complex impact of the results and the inability to accurately represent the planner’s reward and punishment need improving, and how to improve them is a direction for further research.
Data Availability Statement
The raw data supporting the conclusions of this article will be made available by the authors, without undue reservation.
Author Contributions
JZ and CG put forward the basic idea of the article and completed the example analysis. TW and YD improved the idea of the article. MX and ZG completed basic data analysis and article polishing.
Funding
The authors declare that this study received funding from the Science and Technology Project of China Southern Power Grid (GDKJXM20212051). The funder had the following involvement with the study: Study design and Interpretation of data.
Conflict of Interestt
Authors ZJ, GC, WT, and DY were employed by the company Guangdong Power Grid Co., Ltd.
The remaining author declares that the research was conducted in the absence of any commercial or financial relationships that could be construed as a potential conflict of interest.
Publisher’s Note
All claims expressed in this article are solely those of the authors and do not necessarily represent those of their affiliated organizations, or those of the publisher, the editors and the reviewers. Any product that may be evaluated in this article, or claim that may be made by its manufacturer, is not guaranteed or endorsed by the publisher.
Supplementary Material
The Supplementary Material for this article can be found online at: https://www.frontiersin.org/articles/10.3389/fenrg.2022.958892/full#supplementary-material
References
Bai, J., Xin, S., Liu, J., and Zheng, K. (2015). Roadmap of Realizing the High Penetration Renewable Energy in China. Proc. CSEE 35 (14), 3699–3705. doi:10.13334/j.0258-8013.pcsee.2015.14.026
Chen, L., Hu, P., and Wei, J. (2017). A New Evaluation System of Grid-Integrated PV Generation. Power Syst. Prot. Control 45 (2), 105–110. doi:10.7667/PSPC160129
Chen, Y., Liu, F., Wei, W., and Mei, S. (2021). Energy Sharing at Demand Side: Concept, Mechanism and Prospect. Automation Electr. Power Syst. 45 (02), 1–11. doi:10.7500/AEPS20200506004
Cui, K., Shi, Z., and Zhao, J. (2013). Research on Evaluation System of Power Distribution Network. Electr. Power Constr 34 (02), 18–21. doi:10.3969/j.issn.1000-7229.2013.02.004
Diao, P., Hou, F., and Yu, Z. J. (2021). Multi-stage Double Incentive Evaluation Method with Tracking Control Characteristics. J. Syst. Eng. 36 (02), 279–288. in Chinese. doi:10.13383/j.cnki.jse.2021.02.012
Ding, M., Guo, Y., and Zhang, J. (2015). Node Yulnerability Assessment for Complex Power Grids Based on Effect Risk Entropy-Weighted Fuzzy Comprehensive Evaluation. Trans. China Electrotech. Soc. 30 (3), 214–223. doi:10.3969/j.issn.1000-6753.2015.03.027
Gang, W., Wu, W., and Jia, L. (2007). Comprehensive Judgment for Power System Planning Alternatives Based on SE-DEA Model. Power Syst. Technol. 31 (24), 12–16.
Hu, J., Wang, K., Xin, A., Han, X., Yang, G., and Xue, Y. (2019). Transactive Energy: an Effective Mechanism for Balancing Electric Energy System. Proc. CSEE 39 (04), 953–966. doi:10.13334/j.0258-8013.pcsee.180537
Huang, F., Wang, Q., and Wang, M. (2016). Optimal Allocation of Distributed Generator Based on Carbon Benefits and Time-Sequence Characteristics. Proc. CSUPSA 28 (8), 61–68. doi:10.3969/j.issn.1003-8930.2016.08.011
Jia, Q., Zhao, M., and Sun, L. (2018). Planning for Grid-Connection of Distributed PVs Considering the Sequential Feature and Correlation in Active Distribution Network. Proc. CSEE 38 (6), 1719–1728.
Jiang, S., Yang, W., Deng, J., Zhao, Y., Li, J., Li, P., et al. (2021). “Reliability Index Evaluation System of Distribution Network Based on Maximum Deviation and Application,” in IOP Conference Series: Earth and Environmental Science (IOP Publishing), Bristol, United Kingdom, 645, 012034. doi:10.1088/1755-1315/645/1/012034IOP Conf. Ser. Earth Environ. Sci.1
Kang, C., and Yao, L. (2017). Key Scientific Issues and Theoretical Research Framework for Power Systems with High Proportion of Renewable Energy. Automation Electr. Power Syst. 41 (09), 2–11. doi:10.7500/AEPS20170120004
Liu, W. X., Zhang, Y. Y., and Li, H. (2013). Reliability-Based Comprehensive Evaluation and Decision-Making for Distribution Network Planning. Appl. Mech. Mater. 336-338, 1103–1108. Trans Tech Publications Ltd. doi:10.4028/www.scientific.net/amm.336-338.1103
Ma, L., Wang, Z., Zhu, T., and Lu, Z. (2019). Evaluation Model for Economic Operation of Active Distribution Network Orienting to Energy Internet. J. Electr. Eng. Technol. 14 (3), 1151–1164. doi:10.1007/s42835-019-00164-3
NDRC (2015). National Development and Reform Commission, Energy Administration: The 13th Five-Year Plan for Electric Power Development (2016-2020) [EB/OL]. Available at:. https://www.ndrc.gov.cn/xxgk/zcfb/ghwb/201612/P020190905497888172833.pdf. (Accessed April 23, 2022).
Ou, Y. Q., Cheng, L. F., Wen, J. Z., Qiu, X. Y., and Yu, T. (2014). Research on Reliability Evaluation Methods of Distribution System. Appl. Mech. Mater. 672-674, 1441–1446. Trans Tech Publications Ltd. doi:10.4028/www.scientific.net/amm.672-674.1441
Pan, Z., Zhang, X., and Yu, T. (2017). Hierarchical Real-Time Optimized Dispatching for Large-Scale Clusters of Electric Vehicles. Automation Electr. Power Syst. 41 (16), 96–104. in Chinese. doi:10.7500/AEPS20160919012
Peng, C., Yu, R., and Sun, H. (2015). Multi-objective DG Planning Based on K-Means Clustering and Multi-Scenario Timing Characteristics Analysis. Electr. Power Autom. Equip. 35 (10), 58–65. in Chinese. doi:10.16081/j.issn.1006-6047.2015.10.009
Sheng, S., and Liu, M. (2017). Coordination Planning of Distributed Generation and Energy Storage System in Active Distribution System. Proc. CSUEPSA 29 (2), 71–76. doi:10.3969/j.issn.1003-8930.2017.02.012
Su, H., Hu, M., and Liang, Z. (2016). Distributed generation&.Energy Storage Planning Based on Timing Characteristics. Electr. Power Autom. Equip-ment 36 (6), 56–63. doi:10.16081/j.issn.1006-6047.2016.06.009
Wang, W., Wu, X., and Zhu, A. (2018). Research and Application of Low-Voltage Intelligent Planning and Comprehensive Treatment Evaluation Technology for Distribution Network Based on Analytic Hierarchy Process. Trans. China Electrotech. Soc. 33 (S2), 569–607. doi:10.19595/j.cnki.1000-6753.tces.180531
Wang, Y., Zhang, W., and Li, W. (2019). Optimal Allocation for Distribution Generator Considering Energy Storing and Randomness of Photovoltaic. Electr. Meas. Instrum. 56 (9), 91–96.
Yan, L., Wang, J., and Wang, S. (2018). Research on Evaluation Indices of New Energy Generation Characteristics and Membership Functions. Power Syst. Prot. Control 46 (8), 43–49. doi:10.7667/PSPC170462
Yang, J., Zhang, N., and Wang, Y. (2018). Multi Energy System towards Renewable Energy Accommodation: Review and Prospect. Automation Electr. Power Syst. 42 (4), 11–24.
Yao, H., Li, Y., and Tan, Y. (2019). Optimal Allocation of Distributed Generations Considering Power Export in Multi-Voltage Level Grid. Power Syst. Prot. Control 47 (19), 54–62. doi:10.19783/j.cnki.pspc.181415
Yi, P. T., Guo, Y. J., and Zhang, D. N. (2007). A Multi-phase Information Aggregation Method Based on Double Inspiriting Control Lines. Forecasting 26 (3), 39–43. in Chinese. doi:10.3969/j.issn.1003-5192.2007.03.007
Zhang, L., Tang, W., and Zhao, Y. (2010). The Integrated Evaluation of Impact of Distributed Generation on Distribution Network. Power Syst. Prot. Control 38 (21), 132–140. doi:10.7667/j.issn.1674-3415.2010.21.027
Zhang, Z., Zhang, N., and Du, E. (2021). Review and Countermeasures on Frequency Security Issues of Power Systems with High Shares of Renewables and Power Electronics. Proc. CSEE, 1–23. doi:10.13334/j.0258-8013.pcsee.211425
Keywords: high permeability new energy distribution network, distribution network planning, comprehensive evaluation index system, multistage development dynamic evaluation, entropy weight method
Citation: Zhang J, Gao C, Wang T, Duan Y, Xu M and Guo Z (2022) A Dynamic Evaluation Method for High-Permeability New Energy Distribution Network Planning Considering Multistage Development Trends. Front. Energy Res. 10:958892. doi: 10.3389/fenrg.2022.958892
Received: 01 June 2022; Accepted: 22 June 2022;
Published: 12 August 2022.
Edited by:
Bo Yang, Kunming University of Science and Technology, ChinaReviewed by:
Jiajun Yang, South China University of Technology, ChinaXiaoshun Zhang, Northeastern University, China
Copyright © 2022 Zhang, Gao, Wang, Duan, Xu and Guo. This is an open-access article distributed under the terms of the Creative Commons Attribution License (CC BY). The use, distribution or reproduction in other forums is permitted, provided the original author(s) and the copyright owner(s) are credited and that the original publication in this journal is cited, in accordance with accepted academic practice. No use, distribution or reproduction is permitted which does not comply with these terms.
*Correspondence: Zuogang Guo, guozg@csg.cn