Changes in the production of energy from renewable sources in the countries of Central and Eastern Europe
 Tomasz Rokicki1*
  Grzegorz Koszela1
  Luiza Ochnio1 Aleksandra Perkowska1
  Piotr Bórawski2 Aneta Bełdycka-Bórawska2 Barbara Gradziuk3
  Piotr Gradziuk4 Agnieszka Siedlecka5
  András Szeberényi6
  Maciej Dzikuć7
- 1Institute of Economics and Finance, Department of Logistics, Warsaw University of Life Sciences, Warsaw, Poland
- 2Faculty of Agriculture and Forestry, Department of Agrotechnology and Agribusiness, University of Warmia and Mazury in Olsztyn, Olsztyn, Poland
- 3Faculty of Agrobioengineering, Department of Management and Marketing, University of Life Sciences in Lublin, Lublin, Poland
- 4Institute of Rural and Agricultural Development, Polish Academy of Sciences, Warsaw, Poland
- 5Faculty of Economic Sciences, Department of Economy, Pope John Paul II State School of Higher Education, Biała Podlaska, Poland
- 6Faculty of Business, Communication and Tourism, Institute of Marketing, Budapest Metropolitan University, Budapest, Hungary
- 7Faculty of Economics and Management, Department of Division of Innovation and Entrepreneurship, University of Zielona Góra, Zielona Góra, Poland
The main aim of this paper was to determine changes in renewable energy production in the countries of Central and Eastern Europe. The specific objectives were to assess the degree of concentration of renewable energy and the pace of changes in the volume of production of this energy from individual sources in the countries of Central and Eastern Europe, as well as to determine the structure according to renewable energy sources to show the directions of changes. Central and Eastern Europe countries were covered in the research, meaning that a total of 23 countries were included in the analysis. The data used in the study was obtained from the IRENA and World Bank databases. The research period covered the years from 2011 to 2019. For data analysis, the following methods were used: Index methods, Gini coefficient, Lorenz curve, and Grade Data Analysis. The development of the renewable energy sector and modernisation of the energy structure are of great importance for countries to meet their climate obligations. Large-scale energy production from renewable sources could reduce a 60% reduction in the temperature rise. Additionally, such activities will contribute to an increase in energy efficiency by 90%. The energy transition would also bring more comprehensive social and environmental benefits. Thus far, researchers have dealt with energy consumption-related problems in Central and Eastern Europe countries. This article focuses on the production of renewable energy in countries of Central and Eastern Europe. The article fills the research gap in this area. It refers to the situation in the countries of Central and Eastern Europe at a time when developing renewable energy has become very important. In our analysis, we examine renewable energy production in countries located in one region but are and are not EU members. Thanks to this, it will be possible to observe differences in terms of belonging to economic groups. In the case of the pace of changes and the structure of renewable energy produced, a difference can be found between the EU member countries of Central and Eastern Europe and the group of countries outside the EU. The fastest renewable energy production growth was achieved in EU member countries of Central and Eastern Europe. In the case of the mentioned countries, the production of solar, wind, and bioenergy was developed. In other countries, hydropower production was set and treated as a traditional energy source. Generally, in countries of Central and Eastern Europe, the development of energy based on renewable energy sources was not dependent on the pace of economic development of the country. Decision-makers in the countries of Central and Eastern Europe should develop the production of renewable energy from sources that are the easiest and cheapest to use. This is the only way to increase the production of renewable energy in developing countries.
Introduction
Renewable energy sources have always been used by humanity. When renewable energy sources are mentioned, we can generally think of solar energy, wind energy, water energy–including river currents, sea and ocean waves–and energy from biomass, biogas, or bioliquids. Renewable energy also means the heat obtained from the ground (heat pumps, geothermal energy), air (aerothermal), and water (hydrothermal) (Liang, 2016; Owusu and Asumadu-Sarkodie, 2016; Khan et al., 2018; Rodríguez-Monroy et al., 2018; Tareen et al., 2018; Rokicki et al., 2021a; Rokicki and Perkowska, 2021c). All renewable resources belong to the so-called Green energy, which means that these resources are natural, easily accessible and affordable if appropriate methods are developed for obtaining them. (Rokicki and Perkowska, 2020).
The role of energy in achieving sustainable development was recognised when the concept was first introduced in 1987 in the UN report Our Common Future (Brundtland and Khalid, 1987). Since then, sustainable energy development has become a crucial political target on the international agenda (Gunnarsdóttir et al., 2021). The relationship between the atmosphere, greenhouse gas emissions, and energy was initially emphasised in the United Nations Framework Convention on Climate Change in 1992 and the Kyoto Protocol in 1997. Both international treaties called for a new approach to energy development, emphasising reducing production emissions and consumption of energy (United Nations Organization, 1998). Energy was seen as a necessity for sustainable development, and at that time, attention was paid to climate issues, energy security and the shortage of fossil fuel resources (Mao et al., 2015). The concept of the sustainable use and management of energy resources is relatively new (United Nations Organization, 2002). Changes in the energy policy–worldwide–are quite well described in the literature. Therefore, the focus was on the latter, which concerned energy from renewable sources. However, the 2011 UN initiative should also be mentioned. The Sustainable Energy for All (SE4ALL) initiative was presented at that time. Its goal is to ensure sustainable energy for all by 2030, emphasising access to energy, energy efficiency, and sustainable energy sources (Ki-Moon, 2011). In 2015, the 2030 Agenda for Sustainable Development and the related Sustainable Development Goals (SDGs) were ratified (Assembly, 2015).
Appropriate documents were drawn up in the European Union, and directions for developing the energy sector were aligned with the UN arrangements. Historically, several important strategic documents can be mentioned. In December 2008, the Council of the European Union adopted assumptions on counteracting climate change. The EU plan was known as the 3 × 20, but there were four proposals (Fouquet and Johansson, 2008; Goodarzi et al., 2020). According to them, by 2020, the European Union should reduce greenhouse gas emissions by 20% (compared to 1990), increase the share of renewable energy in its total consumption to 20%, and increase energy efficiency by 20%. It was also assumed that the share of biofuels in the total consumption of transport fuels would increase by at least 10%. For individual countries, different target shares of energy from renewable sources in the final gross energy consumption were set for 2020, but there was a large disproportion in this respect (Directive 2009/28/EC, 2009; Klessmann et al., 2011). The following challenges posed by the European Union were even more ambitious, as they assumed achieving at least a 40% reduction in greenhouse gas emissions by 2030 (compared to 1990 levels), increasing the share of renewable energy in its total consumption to a minimum of 32% and increasing energy efficiency by at least 32.5% (Klessmann, 2009; GREEN PAPER, 2013; Paska and Surma, 2014). The European Green Deal, published by the European Commission, presents a clear vision of how to achieve climate neutrality by 2050. It increases the EU’s climate ambitions for 2030 and 2050, the ambition of zero pollution in the environment, providing clean, inexpensive, and safe energy, mobilising industry to create circular economies, building energy and resource efficiency, protecting and restoring ecosystems and biodiversity, a fair, healthy and environmentally friendly food system, accelerating the transition to sustainable and smart mobility (The European…, 2019). Implementation of the idea of the Green Deal will require the introduction of many political, economic and social activities that will cover all aspects of the lives of EU citizens. To achieve success in this area, it is crucial to carry out an effective and quick process of energy transformation towards renewable energy production. The EU policy in this area, supported by appropriate funding, is conducive to the rapid achievement of ambitious goals (Brodny and Tutak, 2020). The Just Energy Transition Fund (JET) is to be very important, as it will be the financial basis for the Just Transition Mechanism (JTM). This fund is dedicated to countries and regions that will struggle to achieve economic zero emissions and will support the decarbonisation process in Europe (Financing..., 2020).
Central and Eastern European countries that are not EU members are developing renewable energy production to a lesser extent. The applied energy policy and the position of the state authorities do not encourage rapid changes and investments in renewable energy. Post-communist countries can generally be divided into rich and poor in energy resources. Renewable energy technologies will develop slowly in rich countries, while there is more pressure to produce energy from renewable sources in poor ones. Still, the assumptions are not implemented (Karatayev et al., 2021). For example, in Russia, the biggest challenge–which is also an obstacle to the development of renewable energy in the country–is the government’s insufficient attention to clean technologies. Another limiting factor is lobbying and traditional reliance on fossil fuels and nuclear power (Agyekum et al., 2021). In non-EU post-communist countries, plans to develop renewable energy production are not as ambitious as in the EU. For example, in Belarus, it was assumed that the share of renewable energy in total energy production should amount to 6% in 2020 and only 9% in 2030 (Novikau, 2019). On the other hand, the Western Balkans countries (Albania, North Macedonia, Bosnia and Herzegovina, Kosovo and Serbia) set ambitious goals for developing renewable energy in their long-term strategies. However, these targets were not met, as renewable energy in the region only accounted for around 6% of total energy production. Relevant problems are also low credibility and non-transparent regulations, which result in a low level of investor confidence in the production of renewable energy (Đurašković, 2021).
The importance of the research topics is emphasised in the literature and various reports. It is assumed that the development of the renewable energy sector and modernisation of the energy structure are of great importance for countries to meet their climate obligations (Ji and Zhang, 2019; Szeberényi, 2021). This is especially true in limiting the rise in global temperatures (IRENA, 2019a). According to the IRENA report, large-scale electricity production from renewable sources could reduce a 60% reduction in the temperature rise. Additionally, such activities will contribute to an increase in energy efficiency by 90%. According to estimates, solar and wind energy can meet 86% of energy demand. The energy transition will also contribute to global GDP growth by 2.5% and employment by 0.2% by 2050. It would also bring more comprehensive social and environmental benefits. Therefore, governments of many countries are forced to develop energy production from renewable sources (IRENA, 2019b; Asmelash, 2020). According to the IRENA report, a climate-safe energy system requires an investment of approximately USD 110 trillion in the energy sector by 2050. This means an increase in the currently planned investments by USD 15 trillion. There is currently USD 27 trillion in investment in renewable energy. Part of the funds from investments in fossil energy should be shifted to clean technologies (IRENA, 2019c). However, the presented dependencies are not so one-sided. When discussing renewable energy, solar, wind, and bioenergy production development, many factors must be considered, not just in political terms (Baloch et al., 2021; Rokicki et al., 2021b). Many studies emphasise the correlation between the development of renewable energy production and economic growth as measured by GDP. Dependencies and impacts can be two-way or one-way. There is no unanimity in this regard (Muhammad et al., 2017). There are also studies available in the literature showing the positive impact of renewable energy in total and by type on GDP per capita (Armeanu et al., 2017). In some studies, the results were inconclusive as there were countries with a significant but also irrelevant relationship (Marinaș et al., 2018). The presented dependencies require examination in individual countries of Central and Eastern Europe. There are studies that indicate a positive impact of GDP per capita on the production of renewable energy per capita. A 1% change in income has a greater impact on renewable energy production in developed countries than in developing countries. The difference may be due to the growing concern for environmental sustainability in higher-income countries. High-income countries care more about the environment while enjoying a high level of technological and infrastructural progress that facilitates the development of renewable energy production (Bamati and Raoofi, 2020).
The countries of Central and Eastern Europe have a similar history, as they operated under the communist regime for several dozen years. At the beginning of the 1990s, all these countries transformed their economies, i.e. introducing a capitalist system. In many countries, the changes were drastic because factories were closed, unemployment was rising, and GDP was falling. The recession ended at the turn of the century, and the countries of Central and Eastern Europe began to develop very quickly. Better financial results have been due to economic reforms, privatization, of open trade and finance, integration with the West, membership of the European Union in some countries, and a significant inflow of foreign direct investment (Chapman and Meliciani, 2018). All these activities were conducive to economic growth, and through technology transfers and externalities, they increased productivity, both at the national level and in individual industries (Jimborean and Kelber, 2017; Damijan et al., 2018).
The possibility of developing renewable energy production has been discussed in several reports. According to the IRENA report for the countries of Central and South-Eastern Europe, these countries have additional, cost-effective renewable energy potential that goes beyond their existing plans and forecasts. As a result, it is possible to redirect investments and start building an energy system based on renewable energy sources. Renewable energy production can lower the region’s energy costs for the benefit of citizens and industry. Additionally, energy security and air quality will be improved, and it will be easier to meet the long-term decarbonisation goals included in the Paris Agreement (IRENA, 2020). The accession of countries of Central and Eastern Europe to the European Union and participation in the European energy policy contributed to the improvement of energy efficiency in these countries (Sineviciene et al., 2017). Some countries covered by the article are still outside the EU. Some of them have the status of associated countries. All countries of Central and Eastern Europe have made significant strides towards a more sustainable development model in terms of green energy consumption. However, there were differences between countries. The Baltic countries, Romania and Slovenia, set specific targets that were more ambitious than the EU average regarding the share of renewable energy in final energy consumption (20%). As a result, Estonia, Romania, Lithuania, Bulgaria, and the Czech Republic have already achieved the goals set by the EU for 2020. In turn, Poland, Slovakia, and Bulgaria had less ambitious goals. Overall, it must be stated that the countries of Central and Eastern Europe have adapted to the changes in the energy sector quite well and have systematically increased the share of renewable energy in total energy consumption and improved energy efficiency (Marinaș et al., 2018; Szeberényi, 2017).
Thus far, researchers have dealt with energy consumption-related problems in Central and Eastern Europe countries. This article focuses on the production of renewable energy in countries of Central and Eastern Europe (CEE). Dates show that the potential of CEE countries to produce renewable energy is still untapped. The article fills the research gap because it refers to the situation in the countries of Central and Eastern Europe at a time when the importance of developing renewable energy has become very important. Additionally, we used complex methods to assess changes in this area and compare countries. So far, countries in individual economic groups (e.g., the EU) or individual countries have been analysed. In our analysis, we examine renewable energy production in countries located in one region but not EU members. As a result, it will be possible to observe differences precisely in terms of belonging to economic groups. This article contains a new approach, which cannot be found in any other recent work related to the problem of countries of Central and Eastern Europe. Overall, there is a substantial imbalance between energy production and consumption. The shares of individual energy sources are different. This is mainly due to the large import of energy resources. Especially, countries of Central and Eastern Europe are dependent on Russia. Therefore, focusing on the self-production of energy, preferably from renewable sources, is crucial. Additionally, the countries of Central and Eastern Europe have a common history and a similar path of economic transformation. Despite many similarities, there are also differences because countries that joined the EU developed faster than other countries aspiring to the EU or are under the political influence of Russia. The conducted research fills the research gap in the field of focusing on the production of energy from renewable sources in countries of Central and Eastern Europe that were previously influenced by the Soviet Union and started from a similar level of economic development in the early 1990s but developed differently in the following years as a result of EU membership or its absence.
The main aim of this article was to determine changes in renewable energy production in Central and Eastern Europe countries. The specific objectives were to determine the degree of concentration of renewable energy production and the pace of changes in the production volume of this energy from individual sources in the countries of Central and Eastern Europe, as well as to determine the structure according to renewable energy sources, to show the directions of changes in the second decade, and last but not least, to determine the links between changes in renewable energy production and the level of economic development of the country.
The following research hypotheses were formulated in this paper:
1) There was a difference in the pace of changes and the structure of renewable energy produced between the countries of Central and Eastern Europe that are EU members and a group of non-EU countries, resulting from the applied energy policy.
2) Changes in renewable energy production in countries of Central and Eastern Europe were associated with changes in the level of economic development measured by GDP per capita.
Materials and methods
At the initial stage, all Central and Eastern European countries were included in the research. These were the EU member countries of Central and Eastern Europe and the Eurasian countries, which are partly located in Eastern Europe. The differences between the countries that are members of the EU and those that were not members of this grouping will be of particular importance. The study covered 23 countries for which data were obtained for the entire study period. The following acronyms were used in the case of the included countries: Albania (AL), Armenia (AM), Azerbaijan (AZ), Belarus (BY), Bosnia and Herzegovina (BA), Bulgaria (BG), Croatia (HR), Czechia (CZ), Estonia (EE), Georgia (GE), Hungary (HU), Kosovo (XK), Latvia (LV), Lithuania (LT), Moldova (MD), North Macedonia (MK), Poland (PL), Romania (RO), Russia (RU), Serbia (RS), Slovakia (SK), Slovenia (SI), Ukraine (UA). The data used in the study was obtained from the IRENA database (International Renewable Energy Agency). Additionally, data from the World Bank were used for parameters concerning the potential of countries, such as population, GDP value, and GDP value per capita. The research period covered the years from 2011 to 2019. It is important to note that 2019 was the last year when complete research data were available. Adopting such a period is substantively justified. Before 2011, issues related to renewable energy production were not very much exposed. Especially in Europe, attention began to be paid to energy sources at the beginning of the second decade of the twenty-one century. In turn, 2019 was the last year before the COVID-19 pandemic, which could have distorted renewable energy production. During the pandemic, energy consumption has decreased in industrial plants but increased in households. At the end of 2021, considerable destabilisation in the energy market can be observed, such as a large increase in gas and oil prices, mainly from Russia. Under such conditions, the obtained results would include the influence of the factors mentioned. The main reason is the need for more complete data available for the past years. However, the unfavourable situation in the energy market may incentivise developing energy production from renewable sources.
The framework scheme of the research is shown in Figure 1. The first stage of the research presents the situation in countries concerning renewable energy production. Total production data were used. Such raw data only sometimes makes it possible to determine the significance and development of this production in individual countries. Countries differed in size, human population, and economic development. Therefore, we decided to calculate the rate of renewable energy production per person. This part aimed to present the leaders and outsiders in the renewable energy production field in Central and Eastern Europe countries.
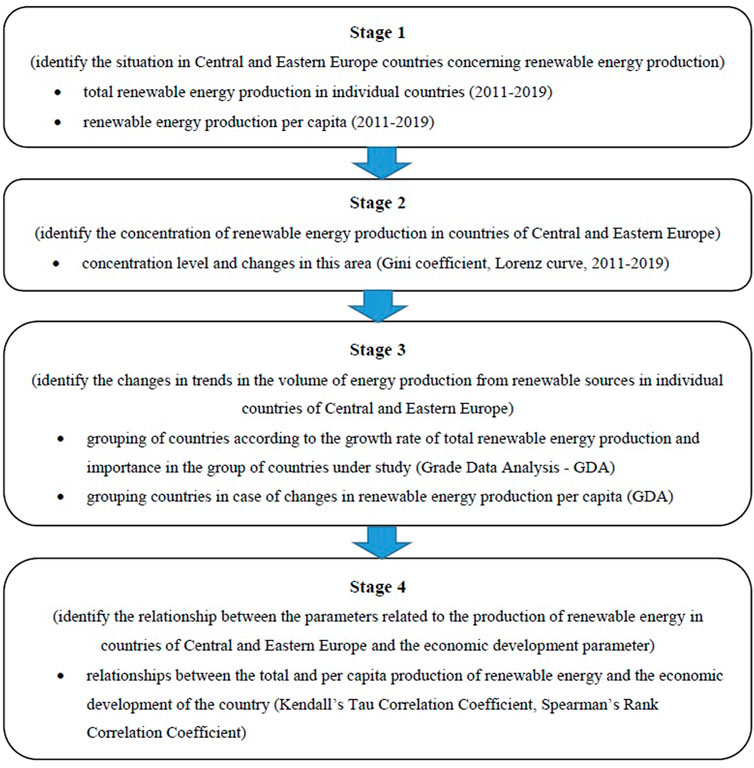
FIGURE 1. The framework scheme of the research.
In the second stage of the research, the concentration of renewable energy production in individual countries of Central and Eastern Europe was presented. Changes in this scope are also shown. The Gini coefficient was used to achieve this goal. In this case, it is a measure of the inequality of renewable energy production in the countries of Central and Eastern Europe. The Gini coefficient ranges from 0 to 1. If the Gini coefficient was equal to 0 in our study, it would mean that each country produces the same amount of renewable energy. If the Gini coefficient was equivalent to 1 in our research, it would mean that only one country has renewable energy and the rest do not. Thus, the closer the value of the Gini coefficient is to the value of 1, the greater the diversification of renewable energy production in the countries under study is. The Lorenz curve is a graphical presentation of the degree of concentration of the volume of renewable energy production in countries of Central and Eastern Europe.
Concentration ratios were calculated every 4 years (2011, 2015, 2019). Therefore, the results relate to the years from 2011 to 2019. This comparison provides an opportunity to determine the direction and pace of changes occurring in the concentration of the volume of renewable energy production in the group of Central and Eastern Europe countries.
The Gini coefficient is a measure of the unevenness (concentration) of the decomposition of a random variable. When the observations are presented in ascending order, the coefficient can be represented by the formula (Dixon et al., 1988):
where:
n-number of observations,
The Lorenz curve determines the degree of unevenness (concentration) of a one-dimensional random variable distribution (Dagum, 1980). With sorted observations yi, which are non-negative values,
where:
i-number of observation,
h - number of reference observations.
The Gini coefficient determines the surface between the Lorenz curve and a diagonal of a unit square multiplied by 2.
In the third stage, a method of multivariate data analysis was used, i.e., Grade Data Analysis to capture changes in trends in the volume of energy production from renewable sources in individual countries. The GCA algorithm (Grade Correspondence Analysis) allows creating groups, but in that way, which creates three objects that are characterised by the greatest possible differentiation among themselves. These groups are formed because of combining objects that ensure such differentiation, and for this purpose, a certain independence index Ro or Tau is optimised (Kowalczyk et al., 2004).
In the scientific literature, many suggestions can be found for constructing structure dissimilarity indicators. One of the examples can be the Minkowski metric, in which case, in a normed vector space, distances are used for this purpose (Rossi and Testa, 2018).
If we have two structures: x and y, where:
This measure surely meets two conditions:
1) The distance between objects with the same organisation is equal to 0, that is d (x,x) = 0
2) The distance between the Y object and the X object is the same as that between X and Y and is not less than 0, that is d (x,y) ≥ 0
However, one can have some questions as to the correctness of the fulfillment of the third requirement by the dissimilarity index:
3) The distance standard changes according to the transfer sensitivity adopted in the concentration indexes, where the increase in the value of the dissimilarity indicator at a constant transfer quantity is the greater the richerthe object to which the transfer was done.
In the case of this study of renewable energy production, it is about shifting the value of renewable energy production between years (the more years the changed, the greater the value of the dissimilarity indicator should be), because we are interested in which states have experienced faster growth in renewable energy production. The structure of the dissimilarity index of structures meeting condition 3 can then be based on the concentration indicator (Gini coefficient) and the Lorentz curve.
By analogy with the Lorentz curve, the differentiation of the Y structure to the X structure can be shown as a broken line connecting some points, the coordinates of which in this matter are successive cumulative structures, and the estimate of the dissimilarity of the Y structure to the X structure also by analogy - this moment with the Gini coefficient - is the measure ar.
where:
Visualisation of the structures was done with the use of overrepresentation maps. Overrepresentation is the ratio of the component structures (in this case the structures for individual states in periods) to the average value. As an average, we interpret the ratio of the sum of the quantities, e.g., renewable energy production in individual periods, to renewable energy production in the entire period under research for the total renewable energy production in countries of Central and Eastern Europe.
After determining the average values, we can calculate the so-called Overrepresentation indicators. For an ideal representation, the indicator is 1. Those calculated overrepresentation coefficients allow drawing the Overrepresentation map. In this study, the map of overrepresentation is a square with sides equal to 1, where the rows are countries of Central and Eastern Europe and the columns are renewable energy production in particular periods. Colours show overrepresentation (extreme black) or underrepresentation (extreme white). The map contains rows and columns of varying heights and widths:
• Height can be determined by the percentage share of the value of renewable energy production for each period to the amount of renewable energy production for the entire period.
• Width of the columns are the average structures of renewable energy production by countries of Central and Eastern Europe in the subject period.
The concepts described in the concentration curve, the ar index, and the overrepresentation map are precisely related to the Grade Data Analysis (GDA). As part of the Grade Data Analysis, certain quite complex operations are performed. The major issue in GDA is studying the heterogeneity of rows and columns and the aspiration to arrange them in the data matrix such to achieve maximum contrast between the outermost rows and columns. This aim is implemented by the GCA algorithm. It converts the rows and columns of the data matrix to magnify a certain dependency ratio. Only the rows are rearranged as the columns are in a chronological sequence. This dependency indicator is Spearman’s Rho or Kendall’s Tau Correlation Coefficient and depends mostly on the dissimilarity index ar. Based on these indices, clusters are built to maximise the differentiation between them. In contrast, the differentiation between two clusters is understood as the polarity between two objects formed with these clusters as the aggregate of the objects included in them.
In this case, the choice of the number of clusters depends on the number of observations (there are only 23). Therefore, it is a subjective choice of the authors.
The dynamics of changes in renewable energy production in general (but also for per capita) against the background of the entire research group can be presented using the defined overrepresentation maps. The figure shows the dynamics of renewable production orderly. In a map of this type, the change in the greyscale scale is important, where from dark to light means a slower pace in relation to the average pace of change in all surveyed countries. Conversely, the light to dark shift occurs when the pace is increased relative to the average of the countries of Central and Eastern Europe. The width of the line is closely related to the amount of energy produced from renewable sources. The order, in turn, shows countries from those with the weakest dynamics compared to the average to those with the strongest. The horizontal lines dividing the map into three parts, thus, divide all 23 countries into groups with a significantly higher rate of change than the average, not deviating from the average and at a slower pace than the average for the countries studied. It should be remembered that the overrepresentation map is formally a square with sides equal to 1 (in the figure the sides of the square are scaled 2:1 ratio). The centers of the lines on the map are the scores, which measure of ranges. Based on leathers, it is possible to rank countries depending on the strength of the dynamics of energy production growth.
In the fourth stage of the research, non-parametric tests were utilised to establish the correlation between the variables. The goal was to establish the relationship between the parameters related to the production of renewable energy and the economic development parameter. The first study is related to Kendall’s Tau Correlation Coefficient. It is concentrated on the difference between the probability that the two variables fall in a similar order (for the observed data) and the probability that they are disparate. This coefficient has values in the range <-1, 1>. Value 1 means full fit, value 0 no match of order, and value -1 means complete reverse. Kendall’s coefficient indicates not just the strength but also the direction of the relationship. It is the right tool for describing the similarity of the information set order. Kendall’s Tau correlation coefficient is estimated using the formula (Kendall, 1955):
The given formula estimates Kendall’s Tau based on a statistical sample. All possible pairs of the sample observations are combined, and then the pairs are divided into three possible categories:
P - compatible pairs, when the compared variables within two observations fluctuate in the same direction, i.e., either in the first observation both are greater than in the second, or both are smaller;
Q - incompatible pairs, when the variables change in the opposite direction, i.e., one of them is greater for this observation in the pair, for which the other is smaller;
T - related pairs when a variable has equal values in both observations.
Kendall’s Tau estimator is then calculated from the following formula:
Additionally,
where:
N- sample size
The pattern can be represented as the following:
The second non-parametric study is Spearman’s Rank Correlation Coefficient. It is used to describe the strength of the correlation of two variables. It is used to test the relationship between quantitative traits for a small quantity of observations. Spearman’s Rank Correlation Coefficient is estimated according to the formula (Spearman, 1904):
where:
di–differences between the ranks of the corresponding features xi and feature yi (i = 1, 2, …, n).
The correlation coefficient has values in the range -1 ≤ rs ≤ +1. A positive sign of the correlation coefficient means a positive correlation, whereas a negative sign indicates a negative correlation. The closer the modulus (complete value) of the correlation coefficient is to 1, the stronger the correlation between the examined variables.
Descriptive, tabular, and graphic methods were used to present the results.
Results
Renewable energy production in individual countries of central and Eastern Europe
The total renewable energy production worldwide from 2011 to 2019 increased by 58%. In the case of the examined countries of Central and Eastern Europe, the increase was only 28%. In Europe, the pace was similar to the global one because, in 2019, 51% more renewable energy was produced than in 2011. In the group of countries of Central and Eastern Europe covered by the research, the most renewable energy was produced in Russia (Figure 2). A result like this is not surprising because Russia is one of the largest countries in the world. Countries with a large area, such as Poland, Romania, and Ukraine, were also ranked next. A few fairly large countries are far away, such as Bulgaria (middle) and Belarus (third from last). Therefore, the size of the country was not a decisive criterion for producing renewable energy. The applied energy policy, access to new technologies, and investments in this area are essential.
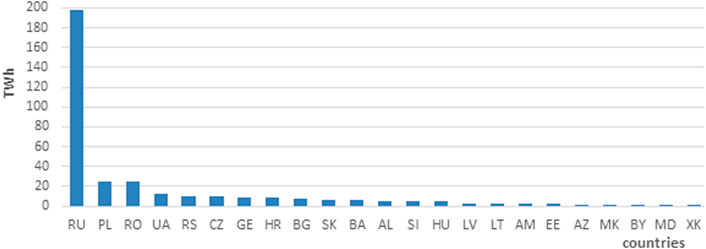
FIGURE 2. Production of energy from renewable sources in countries of Central and Eastern Europe in 2019.
Since the results for the production of total renewable energy were partially correlated with the size of the country, it was decided to conduct further analyses. Quite interesting results were obtained when comparing the results for countries of Central and Eastern Europe for energy production from renewable sources per capita (Figure 3). In 2019, Slovenia was the undisputed leader. Then, there were several countries with a relatively similar level of production per capita, such as Croatia, Georgia, Albania, Estonia, Latvia, Bosnia and Herzegovina, Russia, and Romania. The least renewable energy per capita was produced in Moldova, Belarus, and Kosovo. The largest countries, such as Russia, Poland, and Bulgaria, were less developed in producing renewable energy. The policy of the given countries and investments in technologies related to renewable energy production greatly influenced the results.
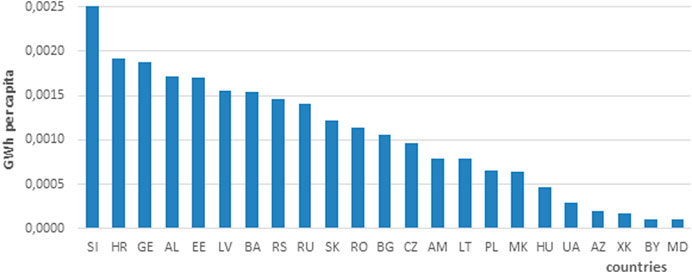
FIGURE 3. Production of energy from renewable sources per capita in countries of Central and Eastern Europe in 2019.
Changes in the concentration of renewable energy production in countries of central and Eastern Europe
The next stage of the research was to present the concentration of the volume of renewable energy production in individual countries and changes in this regard. The Gini coefficient was used to determine the concentration degree of the volume of renewable energy production. In 2011, the Gini coefficient calculated from the sample was 0.32, and the estimated coefficient for the population was 0.33. This meant a low concentration of the volume of renewable energy production in one or several countries of Central and Eastern Europe. In the following years, the degree of attention did not change. The existing differentiation was also presented using the Lorenz concentration curve (Figure 4). Among the top countries, Russia, Poland, and Romania are listed. In 2019, the top five countries (Russia, Poland, Romania, Ukraine, and Serbia) accounted for 80% of the volume of renewable energy production in countries of Central and Eastern Europe. The shares were below 3% in other countries; furthermore, in nine countries, even below 1%.
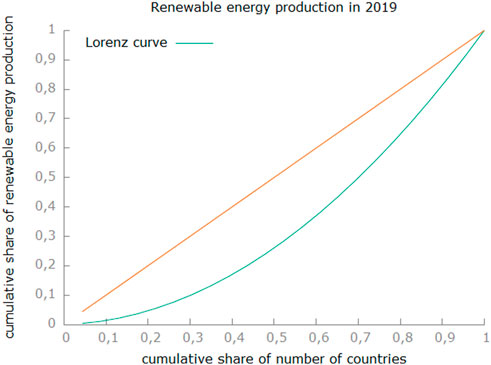
FIGURE 4. Lorenz concentration curves for volume of renewable energy production in countries of Central and Eastern Europe 2019.
The level and changes in total renewable energy production in countries of central and Eastern Europe
Figure 5 shows an overrepresentation map of renewable energy production in the case of Central and Eastern Europe countries from 2011 to 2019. In the analysed period, Russia was characterised by the highest production of renewable energy, which is not surprising given the size of the country. However, the growth rate of renewable energy production in this country over the 9 years was much lower than that in Estonia, Hungary, and Lithuania. The aforementioned countries developed faster in this respect. Bulgaria, Romania, Poland, Hungary, Estonia, and Lithuania belonged to the group with the fastest growth in the production of energy from renewable sources recently. The given countries were members of the EU. In turn, a slower pace of growth, compared to the average, was found in Azerbaijan, Ukraine, Armenia, Russia, Slovenia, Bosnia and Herzegovina, Moldova, and Serbia. The listed countries were not part of the European Union. The results obtained may indicate a more effective policy in the EU in the field of developing renewable energy production. The EU is putting a lot of emphasis on energy transformation and set targets that assume increasing the share of renewable energy. The disproportion in the coming years may deepen if the countries of Central and Eastern Europe outside the EU need to set strict targets related to increasing the share of renewable energy in the energy balance.
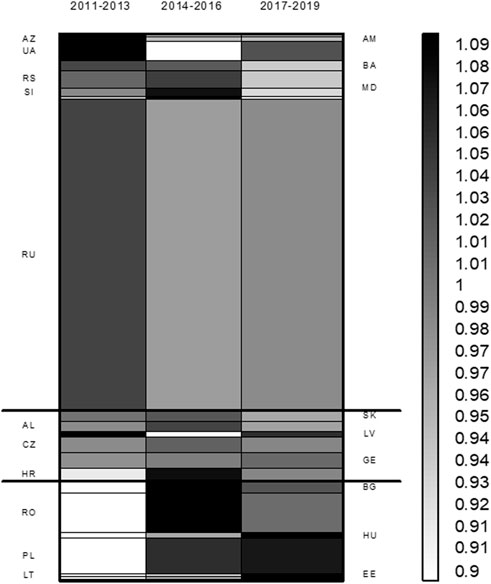
FIGURE 5. Dynamics of changes in renewable energy production in countries of Central and Eastern Europe in 2011–2019.
The rate of change for the volume of renewable energy production per capita was examined analogously (Figure 6). Among the countries surveyed, the countries with the highest growth in renewable energy production per capita included Bulgaria, Romania, Poland, Hungary, Estonia, Lithuania, and Kosovo. The lowest production growth rates were recorded in Azerbaijan, Ukraine, Armenia, Russia, Slovenia, Bosnia and Herzegovina, Moldova, and Serbia. These extreme groups were almost the same for renewable energy production. When calculating renewable energy production per person, Kosovo joined the group of the fastest-developing countries in this respect. However, Slovakia and Macedonia were among the countries with the lowest growth rates. A short period of research is a specific explanation for these similarities. There were no rapid or significant changes in the population at that time. This parameter was relatively stable.
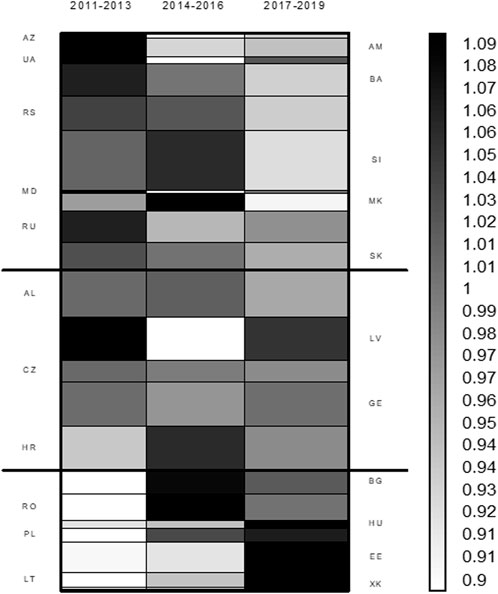
FIGURE 6. Dynamics of changes in renewable energy production per capita in countries of Central and Eastern Europe in 2011–2019.
The level and changes in renewable energy production per capita in countries of central and Eastern Europe
In the next stage, the types of sources were identified in the case of renewable energy production. The following overrepresentation map shows the differences in the use of individual renewable energy sources in individual countries (Figure 7). Hydropower production, which was a traditional type of renewable energy, predominated. Its importance in Russia, Bosnia and Herzegovina, Georgia, Armenia, Serbia, and Albania was significantly growing. In turn, solar energy production in Central and Eastern Europe countries was not significant. Obtaining energy from this source was developed only in Hungary, the Czech Republic, Bulgaria, Slovakia, Romania, Ukraine, and Slovenia. Nevertheless, this energy source’s importance was insignificant in all these countries. Geothermal energy, due to its rarity, is not a significant source of renewable energy. Few surveyed countries used geothermal sources for energy production, i.e., Romania and Russia. The research also considered sea energy, i.e., energy obtained from sea tides and transmitted by waves, related to salinity and temperature differences. The movement of water in the oceans creates deposits of kinetic energy; some of this energy can be used to generate electricity to power homes, transport and industry. In countries of Central and Eastern Europe, there is little use of this source for energy production. These were insignificant volumes. An important reason for this is the high expenditure related to acquiring this type of energy. Wind energy was developed in Hungary, Lithuania, Estonia, Poland, Bulgaria, Romania, Ukraine, and Croatia. The share of this energy is still small in producing renewable energy. Bioenergy obtained from solid biofuels and renewable waste, liquid biofuels, and biogas is an increasingly popular renewable energy source in Estonia, Poland, Belarus, Bulgaria, and Latvia. Based on the presented results, it can be concluded that there was a visible division between Central and Eastern Europe countries from Eastern Europe, that are EU member and non-EU member countries. In the first group, countries diversify renewable energy sources and invest, particularly in solar, wind, and bioenergy. Simultaneously, they are moving away from hydropower. Various types of subsidies and other forms of support from the European Union greatly impact the diversification of renewable energy sources. Energy transformation is one of the most important goals facing the EU and its member states. In the second group of countries, hydropower still dominates and is being developed. In principle, other energy sources are not being developed. These countries have followed the traditional approach to renewable energy.
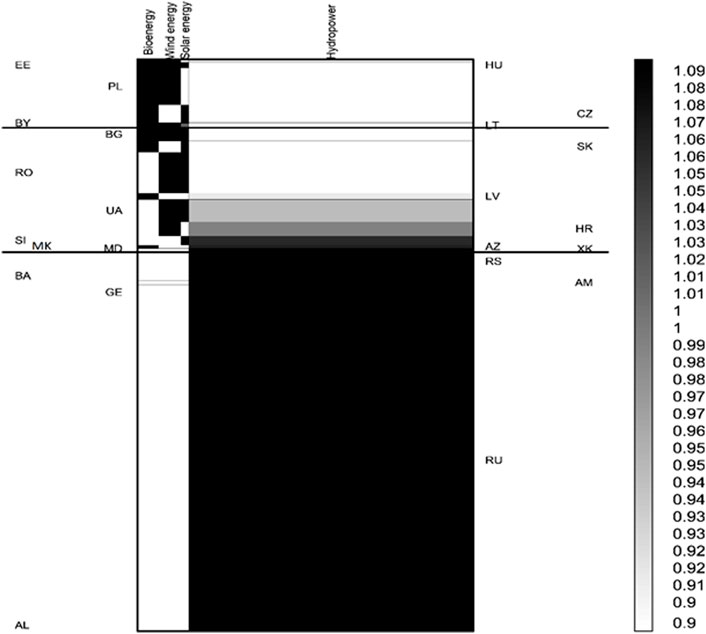
FIGURE 7. The use of various sources for renewable energy production in countries of Central and Eastern Europe in 2011–2019.
Considering the changes in renewable energy production from individual sources per person, the dependencies were similar to the total energy. The division into countries of Central and Eastern Europe that are EU members and non-EU countries was also visible (Figure 8). Single countries found themselves in different groups. Some differences may have been due to varying paces of population growth or decline in individual countries. Changes in the value of this parameter were usually not large. There are fewer disparities between countries when using the per capita renewable energy production index than the total renewable energy production. For example, in 2019, the least renewable energy was produced per person in Moldova and Belarus (about 0.001 GWh each), as well as in Kosovo and Azerbaijan (0.002 GWh). However, most of them are in Georgia and Slovenia (about 0.024 GWh each) and Croatia (0.021 GWh). As a rule, countries of Central and Eastern Europe that are EU members had better indicators than non-EU countries.
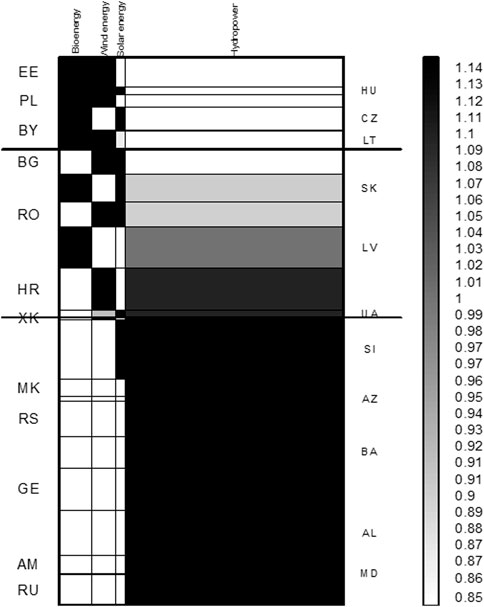
FIGURE 8. Use of various sources to produce renewable energy per capita in countries of Central and Eastern Europe in 2011–2019.
The relationship between the economic development of Central and Eastern European countries and the production of renewable energy
Kendall’s Tau correlation coefficient and Spearman’s Rank Correlation Coefficients were calculated to establish the relationship between the GDP per capita value and renewable energy production parameters (Table 1). p = 0.05 was adopted as the border value of the significance level. Significant results are marked in bold in the table. Correlation coefficients were calculated for individual countries of Central and Eastern Europe (23 countries) for the entire 2011–2019 period. The study attempted to check the correlation, which does not indicate that a given factor affects another, but a strong or weak relationship between them.
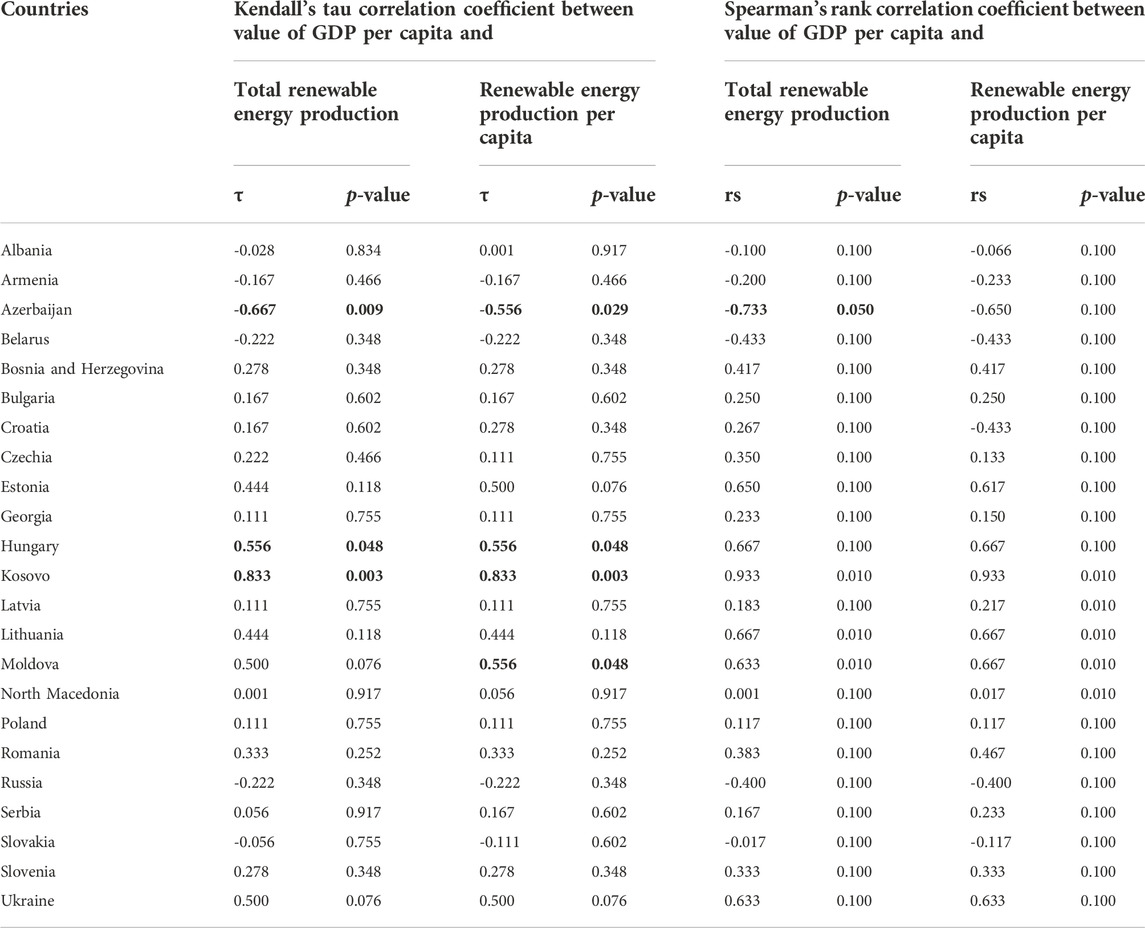
TABLE 1. Kendall’s Tau Correlation Coefficients and Spearman’s Rank Correlation Coefficients between the value of GDP per capita and the parameters of renewable energy production.
Only a few countries were found to have a significant relationship. There are quite strong negative relationships in Azerbaijan. In this country, GDP per capita fell after several years of growth. Renewable energy production was also unstable. The desired relationships were found for only two countries. In Hungary, there was a strong positive correlation between GDP per capita and renewable energy production in the total and per person. Such results were obtained in the case of Kendall’s Tau Correlation Coefficient test. Using Spearman’s Rank Correlation Coefficient, the results turned out to be insignificant. The situation was similar in the case of Kosovo. This time, in the case of Kendall’s test, a very close relationship between the tested parameters was obtained. In terms of values, Kosovo is an insignificant country, and even small investments in renewable energy production can increase large volumes. A significant positive relationship was found only in Moldova but in the case of the relation between GDP per capita and renewable energy consumption per capita. This result was achieved only for Kendall’s test. In most countries, a country’s economic development is not correlated with renewable energy production. It can therefore be concluded that the development of energy based on renewable energy sources in countries of Central and Eastern Europe does not depend on the pace of economic development of the country.
Discussion
In our research, we observed an insufficient development of renewable energy production in most countries of Central and Eastern Europe. Only a few countries have dynamically developed this type of energy. The EU countries are more developed in terms of producing energy from renewable sources. It is estimated that the EU could double the share of renewable energy in total energy production cost-effectively between 2015 and 2030. All the EU countries have the cost-effective potential to use more energy from renewable sources. In the EU countries, important sources of electricity are solar, photovoltaic, and wind energy. It is also estimated that biomass will remain the key renewable energy source in EU countries after 2030. (IRENA, 2018). Our research also confirmed that solar, wind, and bioenergy are important in the countries of Central and Eastern Europe of the EU. However, hydropower was abandoned. In non-EU countries of Central and Eastern Europe, the trend was reversed. Our results have been confirmed in other studies. Research on EU countries was conducted, among others, in the field of wind energy: Bórawski et al. (2020); solar energy: Castillo et al. (2016), and biomass: Banja et al. (2019). The structure of renewable energy in the countries of Central and Eastern Europe of the Western Balkans was studied by Pope et al. (2018). Hydropower is of great importance, and solar and wind energies are of a small extent, but biomass production was developed as well. In countries of Central and Eastern Europe, hydropower has become an important part of many sustainable development strategies (IHA, 2021). This is especially true of non-EU countries of Central and Eastern Europe, which have good conditions to implement this energy production. However, the example of Bosnia and Herzegovina shows that there is a long way from planning to implementation. Many projects were not implemented (Dogmus and Nielsen, 2019). Huđek et al. (2020) noted that in the countries of South-Eastern Europe (Slovenia, Croatia, Bosnia and Herzegovina, Serbia, and Montenegro), there had been a boom in the construction of hydropower plants, especially small ones. Tomczyk and Wiatkowski (2020) draw attention to the considerable variation in renewable energy production in individual countries of Central and Eastern Europe. For example, in Albania, all forms of renewable energy are produced from water. The problem in this country is an outdated hydropower network that depends upon modernisation. In contrast, hydropower is an additional renewable energy source in Estonia, alongside biofuels and wind energy. In Slovenia, hydropower accounts for around 40% of renewable energy. In Poland, hydropower is responsible for only 1% of the total energy production. Overall, it can be said that there is a large variation between the countries. Additionally, in the EU countries, much attention is paid to environmental issues (such as the destruction of fish habitats and deterioration of water quality), which causes resistance to the development of these projects (Leviet al., 2015). In other countries of Central and Eastern Europe, environmental issues are less significant (Schiemer et al., 2020). Environmental issues have a large impact on the development of hydropower. The presented review provides a substantive justification of the results obtained in our research. We noticed a clear division in terms of trends in energy production from different renewable sources. The structure of energy and the dynamics of changes in this respect were different in the countries of Central and Eastern Europe that are EU members than in the countries of Central and Eastern Europe that are not members of the EU.
The division into countries of Central and Eastern Europe that are EU members and a group of non-EU countries is natural. Potrafke (2010) found that market-oriented and right-wing governments were more active in deregulating the energy market. However, Chang and Berdiev (2011) and Biresselioglu and Karaibrahimoglu (2012) confirmed that left-wing governments favour regulating the energy sector. Wang et al. (2019) used multinational panel data covering 110 countries between 1995 and 2015. They stated that the left-wing ruling party was inhibiting the progress of technological innovation while the right-wing ruling party was promoting the emergence of new technologies. Such innovations are introduced, among others, in producing renewable energy. Studies by Chang et al. (2018) indicated that countries of Central and Eastern Europe differ from economically developed European countries in terms of energy efficiency. It is, therefore, necessary to consider the group of countries of Central and Eastern Europe and the countries of Western Europe separately. Aguirre and Ibikunle (2014) draw attention to the power of political lobbying in the traditional energy industry. This power is much greater in non-EU countries of Central and Eastern Europe. Russia is a very large exporter of gas and oil. Therefore, it is in Russia’s interest to make other countries dependent on their raw materials and to slowly develop renewable energy production. Such an approach may occur in non-EU countries of Central and Eastern Europe. In turn, Sovacool and Saunders (2014) found that the existence of industrial lobbying causes the inhibition of the development of energy production from renewable sources. According to Lucas et al. (2016), in European countries with a market economy that are EU members, the implementation of renewable energy sources may be caused by the desire to diversify energy sources rather than reduce dependence. Additionally, environmental aspects are more significant. According to Licastro and Sergi (2021), there are large differences between countries of Central and Eastern Europe that are EU members and those aspiring to membership. For example, in Croatia and Slovenia, the development of renewable energy production has been positive. However, Bosnia and Herzegovina and Serbia lack an appropriate policy in this area and awareness among people and companies. The presented literature review confirms the validity of our research. Additionally, it justifies the results obtained by us. The factor intensifying the energy transformation of Central and Eastern European countries was membership in the EU structures, in which sustainable and green development policy has a strategic place (Ossewaarde and Ossewaarde-Lowtoo, 2020). The European Green Deal assumes that high and growing energy efficiency should be accompanied by energy transformation, which will be carried out by increasing the share of renewable energy in total energy consumption. The goals are very ambitious and financially supported by the EU. Thanks to this, the production of renewable energy in the EU is growing rapidly. The plan assumed increasing the share of renewable energy in its total consumption to 20% in 2020 and to 32% in 2030 (Simionescu et al., 2020). Different energy policies are applied in Central and Eastern European countries that are not members of the EU. In general, the requirements and targets are too ambitious and investments in renewable energy are not adequately supported financially. This causes a difference between expectations and real possibilities. Overly ambitious targets have been adopted in the Western Balkan countries. It was assumed that in 2020 renewable energy should account for over 20% of total energy consumption, i.e., in Albania 38%, in Bosnia and Herzegovina 40%, in Kosovo 25%, North Macedonia 28%, Montenegro 33% and Serbia 27%. In fact, the share of renewable energy in the region only accounted for around 6% of total energy production (Đurašković et al., 2021). The political documents assumed that in 2020 the share of renewable energy in total energy production would be 21% in Armenia, 9.7% in Azerbaijan, 6% in Belarus, 20% in Moldova, 4% in Russia, and 11% in Ukraine. Georgia did not have developed goals and political documents for the development of production and consumption of renewable energy. As part of the energy policy in non-EU countries, the so-called feed-in tariffs, which guarantee producers of renewable energy a fixed level of prices per unit of energy produced. Net metering is less commonly used. In this solution, consumers who have installed their own electricity generation systems pay only for the net energy delivered from the plant. Some countries also use tenders, public procurement mechanisms whereby renewable energy capacity or supplies are procured from electricity producers through a competitive bidding process. Tax incentives are granted on the amount of electricity produced from renewable sources or on investments in the production of this energy. Virtually all Central and Eastern European countries had national renewable energy strategies. In non-EU countries, the problem was the lack of sufficient state incentives to invest in this type of energy. Tools and incentives were available, but these solutions were not effective (Novikau, 2019; Pablo-Romero et al., 2021; Đurašković, 2021). Economic affiliation had a great influence on the countries of Central and Eastern Europe. The EU member states developed better the production of renewable energy. The EU energy policy is obliged to do so. In turn, countries of Central and Eastern Europe outside the EU did not have such motivation; they agreed to depend on energy resources from Russia and, at the same time to be politically dependent.
Generally, many authors have dealt with the relationship between economic growth and energy consumption. These were both country-group studies conducted by Menegaki (2011) for 27 European countries and Apergis et al. (2010) for 19 developed and developing countries. Still, individual country studies can be found as well. Pao and Fu (2013) found a two-way causal relationship between renewable energy and economic growth (GDP per capita). Data for Brazil from 1980 to 2010 were used. Further examples are the studies by Bouyghrissi et al. (2021) for Morocco 1990–2014 and Pegkas (2020) for Greece 1990–2016. This topic has been well-researched. Therefore, the article’s authors dealt with another topic that has not yet been thoroughly researched, i.e., renewable energy production.
According to Armeanu et al. (2017), the development of renewable energy production–based on 28 EU countries–drives sustainable economic growth. The authors showed a positive relationship with GDP per capita, both in total and to individual types of renewable energy (biomass, hydropower, geothermal, wind, and solar) per capita GDP. It should be noted, however, that the relationships and impact were small. The research focused on the years 2003–2014. Our study covered only a few countries that are members of the EU and beyond. Developing renewable energy production has become necessary in the second decade of the 21st century. In our research, only a positive relationship was found in the case of Hungary, and for the remaining countries, the results were insignificant. In turn, Busu (2020) examined the impact of renewable energy production on EU countries’ economic growth from 2004 to 2017. The mentioned examination showed that the primary production of renewable energy had a statistically significant and positive impact on economic growth. Our research covers a different period and only a few EU countries. These kinds of reports were available only in the case of Hungary.
Przychodzen and Przychodzen (2020) researched transition countries in Central and Eastern Europe as well as in the Caucasus and Central Asia. The research covered the years 1990–2014, and it found that higher economic growth, rising unemployment and public debt acted as stimulators for renewable energy production. These results are somewhat contradictory because, for example, the rise in unemployment is assessed negatively, as is the increase in public debt. Only economic growth was positive. In our research, we considered the GDP per capita, which is an indicator of economic development. Additionally, we analysed the later period. The compositions of the studied countries also varied. In general, in our research, for most countries, no relationship was found between the economic development of the country and the production of renewable energy. We have identified the impact of public funding in stimulating the development of renewable energy sources. Marques et al. (2011) found that economic growth supports investment and renewable energy production in EU countries. However, in countries outside the EU, the opposite was true. In our research, we also noticed a difference between countries of Central and Eastern Europe in the EU and non-EU countries. Ultimately, however, the results were irrelevant for most countries of Central and Eastern Europe. Positive relations were obtained only in Hungary, Kosovo, and Moldova, while the relations were negative in the case of Azerbaijan. This shows that each country must be considered individually. Despite membership in the EU or other economic organisations, each country has specific conditions for developing renewable energy production. It is difficult to examine these conditions because many factors must be considered–political, economic, social, legal, environmental, and other relevant mentions could be still included.
On the one hand, higher GDP may allow regulatory costs to be supported to promote renewables. On the other hand, the costs of renewable technologies are usually higher than those of fossil fuels. This limits the growth of renewable energy production in developing countries. Countries with higher incomes are more likely to access or develop new technologies that are important for increased production and use of renewable energy. Economic factors mainly drive renewable energy production. A positive relationship between income and renewable energy production is therefore expected. Shaha et al. (2018) suggests that in countries where support for the renewable energy sector is low, investments in this sector will be more dependent on macroeconomic aspects. According to Sadorsky (2009), real national income is an important driver of the use of renewable energy in the most economically developed countries. According to Bamati and Raoofi (2020), the motivation of the country is also important. As a rule, developing countries are unable to develop renewable energy production due to the insufficient supply of modern technologies. In turn, in economically developed countries, the higher the level of innovative technological industries, the greater access to technology, affect the promotion of renewable energy production. The tightening of cooperation between developed and developing countries in the field of technology transfer may affect the development of renewable energy. This is the case with EU countries. The level of economic development and whether a country is in its early or late stage has an impact on the production of renewable energy. The lack of significant correlations between the value of GDP and GDP per capita and the production of renewable energy in our research may be due to differences in political and market incentives and insufficient technology transfer. Particularly, the non-EU countries of Central and Eastern Europe do not cooperate closely. Each country implements its own energy policy. According to Dunjic et al. (2016) the reasons for the uneven distribution of renewable energy production in European countries are, among others, different economic, climatic, hydrological and geological conditions.
Conclusion and recommendations
Conclusion
The conducted research allows for a few generalisations.
1) In the examined countries of Central and Eastern Europe, the production of energy from renewable sources was poorly concentrated. In 8 years, relatively few things have changed. The leaders were from the largest countries, such as Russia, Poland, Romania, Ukraine, and Serbia. When converting renewable energy production per capita, the order was different, as better results were obtained in smaller countries. Examples can be Slovenia, Albania, Georgia, and Croatia. Overall, it can be concluded that there were large disparities between countries.
2) The fastest growth in energy production from renewable sources was achieved in countries of Central and Eastern Europe that are EU members, and the lowest in non-EU countries. This division was even more visible when taking into account energy production per capita. The disproportion between groups of countries may deepen. Policy in the EU, to develop renewable energy production, has been more effective. It was one of the most important EU policies (hypothesis 1 was confirmed concerning the pace of changes in renewable energy production).
3) Hydropower production has been the dominant source of renewable energy in most countries of Central and Eastern Europe, especially non-EU countries. Additionally, in these countries, the production of energy from this source was increased. In other countries, the importance of this energy decreased. In the EU member countries of Central and Eastern Europe, the production of solar, wind, and bioenergy was developed. Thus, a clear division can be found in the direction of renewable energy development between groups of countries in Central and Eastern Europe (hypothesis 1 was confirmed concerning the structure of renewable energy sources).
4) Generally, in countries of Central and Eastern Europe, the development of energy based on renewable energy sources was not dependent on the pace of economic development of the country (hypothesis 2 was rejected).
Recommendations
The research carried out can be used by decision-makers dealing with shaping energy policy and allocating funds for investments in this area. Each country must approach the development of energy production from renewable sources individually. The results may be particularly important for countries lagging behind in the field of renewable energy. Renewable energy technology is expensive. Therefore, decision-makers in the countries of Central and Eastern Europe should develop the production of renewable energy from sources that are the easiest and cheapest to use. This is the only way to increase the production of renewable energy in developing countries. Research shows that there is no one way. The rulers should not force to obtain energy from sources that are poultry, just because it is fashionable. The countries have different economic, climatic, hydrological and geological conditions. An important aspect is also the creation of legal regulations and incentives that will favor the production of renewable energy. There is a need to promote renewable energy in societies, especially in developing countries, where economic growth is often more important than environmental protection.
Subsequent research may concern the relationship between the implemented energy policy in given countries of Central and Eastern Europe and the development of energy production from renewable sources. Researchers can also investigate the relationship between subsidising investments in renewable energy and increasing renewable energy production. the analysis also covers the per capita level. Then it will be possible to compare countless countries (e.g., Russia, Poland) with insignificant ones (e.g., Macedonia, Lithuania).
Data availability statement
Publicly available datasets were analyzed in this study. This data can be found here: https://www.irena.org/statistics.
Author contributions
TR: Conceptualization, methodology, software, validation, formal analysis, investigation, resources, data curation, supervision, project administration; TR, GK, LO, AP, PB, AB-B, BG, PG, ASi, ASz, and MD: writing–original draft preparation, writing–review and editing; TR and GK: visualisation; All authors have read and agreed to the published version of the manuscript.
Funding
This research was funded in 1/7 part by National Science Centre, Poland, grant number: 2021/43/B/HS4/00422.
Conflict of interest
The authors declare that the research was conducted in the absence of any commercial or financial relationships that could be construed as a potential conflict of interest.
Publisher’s note
All claims expressed in this article are solely those of the authors and do not necessarily represent those of their affiliated organizations, or those of the publisher, the editors and the reviewers. Any product that may be evaluated in this article, or claim that may be made by its manufacturer, is not guaranteed or endorsed by the publisher.
References
Aguirre, M., and Ibikunle, G. (2014). Determinants of renewable energy growth: A global sample analysis. Energy policy 69, 374–384. doi:10.1016/j.enpol.2014.02.036
Agyekum, E. B., Kumar, N. M., Mehmood, U., Panjwani, M. K., Alhelou, H. H., Adebayo, T. S., et al. (2021). Decarbonize Russia—a best–worst method approach for assessing the renewable energy potentials, opportunities and challenges. Energy Rep. 7, 4498–4515. doi:10.1016/j.egyr.2021.07.039
Apergis, N., Payne, J. E., Menyah, K., and Wolde-Rufael, Y. (2010). On the causal dynamics between emissions, nuclear energy, renewable energy, and economic growth. Ecol. Econ. 69 (11), 2255–2260. doi:10.1016/j.ecolecon.2010.06.014
Armeanu, D. Ş., Vintilă, G., and Gherghina, Ş. C. (2017). Does renewable energy drive sustainable economic growth? Multivariate panel data evidence for EU-28 countries. Energies 10 (3), 381. doi:10.3390/en10030381
Asmelash, E., Prakash, G., Gorini, R., and Gielen, D. (2020). “Role of IRENA for global transition to 100% renewable energy,” in Accelerating the transition to a 100% renewable energy era (Cham: Springer), 51–71.
Assembly, U. G. (2015). Transforming our world: The 2030 agenda for sustainable development, 21 October 2015 (Vol. 16301).
Baloch, Z. A., Tan, Q., Kamran, H. W., Nawaz, M. A., Albashar, G., and Hameed, J. (2021). A multi-perspective assessment approach of renewable energy production: Policy perspective analysis. Environ. Dev. Sustain. 24, 2164–2192. doi:10.1007/s10668-021-01524-8
Bamati, N., and Raoofi, A. (2020). Development level and the impact of technological factor on renewable energy production. Renew. Energy 151, 946–955. doi:10.1016/j.renene.2019.11.098
Banja, M., Sikkema, R., Jégard, M., Motola, V., and Dallemand, J. F. (2019). Biomass for energy in the EU–The support framework. Energy Policy 131, 215–228. doi:10.1016/j.enpol.2019.04.038
Biresselioglu, M. E., and Karaibrahimoglu, Y. Z. (2012). The government orientation and use of renewable energy: Case of Europe. Renew. Energy 47, 29–37. doi:10.1016/j.renene.2012.04.006
Bórawski, P., Bełdycka-Bórawska, A., Jankowski, K. J., Dubis, B., and Dunn, J. W. (2020). Development of wind energy market in the European Union. Renew. Energy 161, 691–700. doi:10.1016/j.renene.2020.07.081
Bouyghrissi, S., Berjaoui, A., and Khanniba, M. (2021). The nexus between renewable energy consumption and economic growth in Morocco. Environ. Sci. Pollut. Res. 28 (5), 5693–5703. doi:10.1007/s11356-020-10773-5
Brodny, J., and Tutak, M. (2020). Analyzing similarities between the European union countries in terms of the structure and volume of energy production from renewable energy sources. Energies 13 (4), 913. doi:10.3390/en13040913
Busu, M. (2020). Analyzing the impact of the renewable energy sources on economic growth at the EU level using an ARDL model. Mathematics 8 (8), 1367. doi:10.3390/math8081367
Castillo, C. P., e Silva, F. B., and Lavalle, C. (2016). An assessment of the regional potential for solar power generation in EU-28. Energy policy 88, 86–99. doi:10.1016/j.enpol.2015.10.004
Chang, C. P., and Berdiev, A. N. (2011). The political economy of energy regulation in OECD countries. Energy Econ. 33 (5), 816–825. doi:10.1016/j.eneco.2011.06.001
Chang, C. P., Wen, J., Dong, M., and Hao, Y. (2018). Does government ideology affect environmental pollutions? New evidence from instrumental variable quantile regression estimations. Energy Policy 113, 386–400. doi:10.1016/j.enpol.2017.11.021
Chapman, S., and Meliciani, V. (2018). Explaining regional disparities in Central and Eastern Europe: The role of geography and of structural change. Econ. Transit 26 (3), 469–494. doi:10.1111/ecot.12154
Dagum, C. (1980). The generation and distribution of income, the Lorenz curve and the Gini ratio. Econ. Appliquée 33, 327–367.
Damijan, J., Kostevc, Č., and Rojec, M. (2018). Global supply chains at work in Central and Eastern European countries: Impact of foreign direct investment on export restructuring and productivity growth. Econ. Bus. Rev. 20 (2), 237–267. doi:10.15458/85451.66
2009Directive 2009 /28/EC of the European parliament and of the Council of 23 april 2009 on the promotion of the use of energy from renewable sources and amending and subsequently repealing directives 2001/77/EC and 2003/30/EC. Official J. Eur. Union 2009, 5.6.2009.
Dixon, P. M., Weiner, J., Mitchell-Olds, T., and Woodley, R. (1988). Bootstraping the Gini coefficient of inequality. Ecology 69, 1307. doi:10.2307/1941290
Dogmus, Ö. C., and Nielsen, J. Ø. (2019). Is the hydropower boom actually taking place? A case study of a South east European country, Bosnia and Herzegovina. Renew. Sustain. Energy Rev. 110, 278–289. doi:10.1016/j.rser.2019.04.077
Dunjic, S., Pezzutto, S., and Zubaryeva, A. (2016). Renewable energy development trends in the Western Balkans. Renew. Sustain. Energy Rev. 65, 1026–1032. doi:10.1016/j.rser.2016.05.051
Đurašković, J., Konatar, M., and Radović, M. (2021). Renewable energy in the western Balkans: Policies, developments and perspectives. Energy Rep. 7, 481–490. doi:10.1016/j.egyr.2021.07.104
2009Financing the green transition: The European green deal investment plan and just transition mechanism. 14/01/2020 Retrieved, from the World Wide Web:: https://ec.europa.eu/regional_policy/en/newsroom/news/2020/01/14-01-2020-financing-the-green-transition-the-european-green-deal-investment-plan-and-just-transition-mechanism.
Fouquet, D., and Johansson, T. B. (2008). European renewable energy policy at crossroads—focus on electricity support mechanisms. Energy policy 36 (11), 4079–4092. doi:10.1016/j.enpol.2008.06.023
Gunnarsdóttir, I., Davidsdottir, B., Worrell, E., and Sigurgeirsdóttir, S. (2021). Sustainable energy development: History of the concept and emerging themes. Renew. Sustain. Energy Rev. 141, 110770. doi:10.1016/j.rser.2021.110770
Huđek, H., Žganec, K., and Pusch, M. T. (2020). A review of hydropower dams in Southeast Europe–distribution, trends and availability of monitoring data using the example of a multinational Danube catchment subarea. Renew. Sustain. Energy Rev. 117, 109434. doi:10.1016/j.rser.2019.109434
IHA (2021). 2021 hydropower status report. Sector trends and insights. London, United Kingdom: International Hydropower Association.
IRENA (2019a). Climate change and renewable energy: National policies and the role of communities, cities and regions (report to the G20 climate sustainability working group (CSWG)). Abu Dhabi: International Renewable Energy Agency.
IRENA (2019b). Global energy transformation: A roadmap to 2050. 2019 edition. Abu Dhabi: International Renewable Energy Agency.
IRENA (2020). Renewable energy prospects for central and SouthSouth-Eastern Europe energy connectivity (CESEC). Abu Dhabi: International Renewable Energy Agency.
IRENA (2018). Renewable energy prospects for the European union, European commission. Abu Dhabi: International Renewable Energy Agency.
IRENA (2019c). Transforming the energy system – and holding the line on the rise of global temperatures. Abu Dhabi: International Renewable Energy Agency.
Ji, Q., and Zhang, D. (2019). How much does financial development contribute to renewable energy growth and upgrading of energy structure in China? Energy Policy 128, 114–124. doi:10.1016/j.enpol.2018.12.047
Jimborean, R., and Kelber, A. (2017). Foreign direct investment drivers and growth in Central and Eastern Europe in the aftermath of the 2007 global financial crisis. Comp. Econ. Stud. 59 (1), 23–54. doi:10.1057/s41294-016-0018-9
Karatayev, M., Lisiakiewicz, R., Gródek-Szostak, Z., Kotulewicz-Wisińska, K., and Nizamova, M. (2021). The promotion of renewable energy technologies in the former Soviet bloc: Why, how, and with what prospects? Energy Rep. 7, 6983–6994. doi:10.1016/j.egyr.2021.10.068
Khan, K. A., Hasan, M., Islam, M. A., Alim, M. A., Asma, U., Hassan, L., et al. (2018). A study on conventional energy sources for power production. Int. J. Adv. Res. Innov. Ideas Educ. 4 (4), 214–228.
Ki-Moon, B. (2011). Sustainable energy for all: A vision statement. New York: United Nations Organization. Available online under www. sustainableenergyforall. org (Last accessed July 31, 2014).
Klessmann, C., Held, A., Rathmann, M., and Ragwitz, M. (2011). Status and perspectives of renewable energy policy and deployment in the European Union—what is needed to reach the 2020 targets? Energy policy 39 (12), 7637–7657. doi:10.1016/j.enpol.2011.08.038
Klessmann, C. (2009). The evolution of flexibility mechanisms for achieving European renewable energy targets 2020—Ex-ante evaluation of the principle mechanisms. Energy Policy 37 (11), 4966–4979. doi:10.1016/j.enpol.2009.06.065
Kowalczyk, T., Pleszczyńska, E., and Ruland, F. (2004): Grade models and methods for data analysis with applications for the analysis of data populations. Berlin Heidelberg New York: Springer-Verlag, serie: Studies in Fuzziness and Soft Computing vol. 151. ISBN 978-3-540-21120-4.
Levi, L., Jaramillo, F., Andričević, R., and Destouni, G. (2015). Hydroclimatic changes and drivers in the Sava River Catchment and comparison with Swedish catchments. Ambio 44 (7), 624–634. doi:10.1007/s13280-015-0641-0
Liang, X. (2016). Emerging power quality challenges due to integration of renewable energy sources. IEEE Trans. Ind. Appl. 53 (2), 855–866. doi:10.1109/tia.2016.2626253
Licastro, A., and Sergi, B. S. (2021). Drivers and barriers to a green economy. A review of selected balkan countries. Clean. Eng. Technol. 4, 100228. doi:10.1016/j.clet.2021.100228
Lucas, J. N. V., Francés, G. E., and González, E. S. M. (2016). Energy security and renewable energy deployment in the EU: Liaisons dangereuses or virtuous circle? Renew. Sustain. energy Rev. 62, 1032–1046. doi:10.1016/j.rser.2016.04.069
Mao, G., Liu, X., Du, H., Zuo, J., and Wang, L. (2015). Way forward for alternative energy research: A bibliometric analysis during 1994–2013. Renew. Sustain. Energy Rev. 48, 276–286. doi:10.1016/j.rser.2015.03.094
Marinaș, M. C., Dinu, M., Socol, A. G., and Socol, C. (2018). Renewable energy consumption and economic growth. Causality relationship in Central and Eastern European countries. PloS one 13 (10), e0202951. doi:10.1371/journal.pone.0202951
Marques, A. C., Fuinhas, J. A., and Manso, J. P. (2011). A quantile approach to identify factors promoting renewable energy in European countries. Environ. Resour. Econ. (Dordr). 49 (3), 351–366. doi:10.1007/s10640-010-9436-8
Menegaki, A. N. (2011). Growth and renewable energy in Europe: A random effect model with evidence for neutrality hypothesis. Energy Econ. 33 (2), 257–263. doi:10.1016/j.eneco.2010.10.004
Muhammad, A. A., Arshed, N., and Kousar, N. (2017). Renewable energy consumption and economic growth in member of OIC countries. Eur. Online J. Nat. Soc. Sci. 6 (1), 111.
Novikau, A. (2019). Conceptualizing and achieving energy security: The case of Belarus. Energy Strategy Rev. 26, 100408. doi:10.1016/j.esr.2019.100408
Ossewaarde, M., and Ossewaarde-Lowtoo, R. (2020). The EU’s green deal: A third alternative to green growth and degrowth? Sustainability 12 (23), 9825. doi:10.3390/su12239825
Owusu, P. A., and Asumadu-Sarkodie, S. (2016). A review of renewable energy sources, sustainability issues and climate change mitigation. Cogent Eng. 3 (1), 1167990. doi:10.1080/23311916.2016.1167990
Pablo-Romero, M. P., Sánchez-Braza, A., and Galyan, A. (2021). Renewable energy use for electricity generation in transition economies: Evolution, targets and promotion policies. Renew. Sustain. Energy Rev. 138, 110481. doi:10.1016/j.rser.2020.110481
Pao, H. T., and Fu, H. C. (2013). Renewable energy, non-renewable energy and economic growth in Brazil. Renew. Sustain. Energy Rev. 25, 381–392. doi:10.1016/j.rser.2013.05.004
Papież, M., Śmiech, S., and Frodyma, K. (2018). Determinants of renewable energy development in the EU countries. A 20-year perspective. Renew. Sustain. Energy Rev. 91, 918–934. doi:10.1016/j.rser.2018.04.075
Paska, J., and Surma, T. (2014). Electricity generation from renewable energy sources in Poland. Renew. Energy 71, 286–294. doi:10.1016/j.renene.2014.05.011
Pegkas, P. (2020). The impact of renewable and non-renewable energy consumption on economic growth: The case of Greece. Int. J. Sustain. Energy 39 (4), 380–395. doi:10.1080/14786451.2019.1700261
Potrafke, N. (2010). Does government ideology influence deregulation of product markets? Empirical evidence from OECD countries. Public Choice 143 (1-2), 135–155. doi:10.1007/s11127-009-9494-z
Przychodzen, W., and Przychodzen, J. (2020). Determinants of renewable energy production in transition economies: A panel data approach. Energy 191, 116583. doi:10.1016/j.energy.2019.116583
Rodríguez-Monroy, C., Mármol-Acitores, G., and Nilsson-Cifuentes, G. (2018). Electricity generation in Chile using non-conventional renewable energy sources—a focus on biomass. Renew. Sustain. Energy Rev. 81, 937–945. doi:10.1016/j.rser.2017.08.059
Rokicki, T., and Perkowska, A. (2020). Changes in energy supplies in the countries of the visegrad group. Sustainability 12, 7916. doi:10.3390/su12197916
Rokicki, T., and Perkowska, A. (2021c). Diversity and changes in the energy balance in EU countries. Energies 14, 1098. doi:10.3390/en14041098
Rokicki, T., Perkowska, A., Klepacki, B., Bórawski, P., Bełdycka-Bórawska, A., and Michalski, K. (2021b). Changes in energy consumption in agriculture in the EU countries. Energies 14, 1570. doi:10.3390/en14061570
Rokicki, T., Ratajczak, M., Bórawski, P., Bełdycka-Bórawska, A., Gradziuk, B., Gradziuk, P., et al. (2021a). Energy self-subsistence of agriculture in EU countries. Energies 14, 3014. doi:10.3390/en14113014
Rossi, G. C., and Testa, M. (2018). Euclidean versus Minkowski short distance. Phys. Rev. D. 98 (5), 054028. doi:10.1103/physrevd.98.054028
Sadorsky, P. (2009). Renewable energy consumption, CO2 emissions and oil prices in the G7 countries. Energy Econ. 31 (3), 456–462. doi:10.1016/j.eneco.2008.12.010
Schiemer, F., Beqiraj, S., Drescher, A., Graf, W., Egger, G., Essl, F., et al. (2020). The vjosa river corridor: A model of natural hydro-morphodynamics and a hotspot of highly threatened ecosystems of European significance. Landsc. Ecol. 35 (4), 953–968. doi:10.1007/s10980-020-00993-y
Shah, I. H., Hiles, C., and Morley, B. (2018). How do oil prices, macroeconomic factors and policies affect the market for renewable energy? Appl. energy 215, 87–97. doi:10.1016/j.apenergy.2018.01.084
Simionescu, M., Păuna, C. B., and Diaconescu, T. (2020). Renewable energy and economic performance in the context of the European Green Deal. Energies 13 (23), 6440. doi:10.3390/en13236440
Sineviciene, L., Sotnyk, I., and Kubatko, O. (2017). Determinants of energy efficiency and energy consumption of Eastern Europe post-communist economies. Energy & Environ. 28 (8), 870–884. doi:10.1177/0958305x17734386
Sovacool, B. K., and Saunders, H. (2014). Competing policy packages and the complexity of energy security. Energy 67, 641–651. doi:10.1016/j.energy.2014.01.039
Spearman, C. (1904). The proof and measurement of association between two things. Am. J. Psychol. 15 (1), 72–101. doi:10.2307/1412159
Szeberényi, A. (2017). Environmentally conscious lifestyle analysis among high school and university students in a Hungarian rural town of the heves county. Visegrad J. Bioeconomy Sustain. Dev. 6 (2), 74–78. doi:10.1515/vjbsd-2017-0013
Szeberényi, A. (2021). “Examiming the main areas of environmental awareness, sustainability and clean energy,”. Editors Guce Daniel, Uygun Hayri, Gujrati Rashmi, and edited (Southampton, United Kingdom: Tradepreneur Global Academic Platform), 458, 258–274.Sustain. Dev. Goals.
Tareen, W. U. K., Anjum, Z., Yasin, N., Siddiqui, L., Farhat, I., Malik, S. A., et al. (2018). The prospective non-conventional alternate and renewable energy sources in Pakistan—a focus on biomass energy for power generation, transportation, and industrial fuel. Energies 11 (9), 2431. doi:10.3390/en11092431
The European Green Deal Communication from the commission to the European parliament. Brussels: The European Council, The Council. The European Economic and Social Committee and The Committee of The Regions. COM/2019/640 final https://ec.europa.eu/info/sites/info/files/european-green-deal-communication_en.pdf.
Tomczyk, P., and Wiatkowski, M. (2020). Challenges in the development of hydropower in selected European countries. Water 12 (12), 3542. doi:10.3390/w12123542
United Nations Organization (1998). Kyoto protocol to the united nations framework convention on climate change.
United Nations Organization (2002). Report of the World summit on sustainable development. [Technical report]Retrieved, A/CONF.199/20*, Johannesburg, from the World Wide Web: http://www. un. org/esa/sustdev/documents/agenda21/english/agenda21chapter18. htm.
Keywords: renewable energy production, hydropower, changes in energy production, energy policy, concentration of renewable energy production, energy transformation
Citation: Rokicki T, Koszela G, Ochnio L, Perkowska A, Bórawski P, Bełdycka-Bórawska A, Gradziuk B, Gradziuk P, Siedlecka A, Szeberényi A and Dzikuć M (2022) Changes in the production of energy from renewable sources in the countries of Central and Eastern Europe. Front. Energy Res. 10:993547. doi: 10.3389/fenrg.2022.993547
Received: 13 July 2022; Accepted: 15 November 2022;
Published: 28 November 2022.
Edited by:
Shiwei Yu, China University of Geosciences Wuhan, ChinaReviewed by:
Kaushik Bandyopadhyay, Indian Institute of Management Lucknow, IndiaKrzysztof Kud, Rzeszow University of Technology, Poland
Copyright © 2022 Rokicki, Koszela, Ochnio, Perkowska, Bórawski, Bełdycka-Bórawska, Gradziuk, Gradziuk, Siedlecka, Szeberényi and Dzikuć. This is an open-access article distributed under the terms of the Creative Commons Attribution License (CC BY). The use, distribution or reproduction in other forums is permitted, provided the original author(s) and the copyright owner(s) are credited and that the original publication in this journal is cited, in accordance with accepted academic practice. No use, distribution or reproduction is permitted which does not comply with these terms.
*Correspondence: Tomasz Rokicki, tomasz_rokicki@sggw.edu.pl