The relationship between electricity consumption, trade, and GDP and the effect of COVID-19: a panel ARDL approach on the Visegrad countries
 Erginbay Uğurlu
 Irena Jindřichovská
- 1Department of Economics and Finance, Besyol Mh. Istanbul Aydin University, Istanbul Aydın University, Istanbul, Türkiye
- 2Department of Trade and Finance, Czech University of Life Sciences Prague, Prague, Czechia
The aim of the study is to explore the linkage between electricity consumption, international trade and GDP during the COVID-19 pandemic in a sample of the Visegrad Four (V4) countries. The study uses data from the period of 2010 Q1–2021 Q3. Applying the panel-pooled mean group-autoregressive distributed lag (PMG-ARDL) model, we evaluate both long-run and short-run linkages among electricity consumption, trade, GDP, and the COVID-19 pandemic. We tested both the long-run and short-run linkages among electricity consumption, trade, GDP, and a COVID-19 dummy variable for the Visegrad countries. The main contribution of this study to the literature is testing the effect of COVID-19 on electricity demand by considering trade and GDP for the Visegrad countries. Our empirical findings show that there is no long-term causal relationship among these variables for the Visegrad countries. But, on the other hand, even if the trade variable is not significant in the long run, it is significant in the short run and for the cross-section models as it concerns the policy implications stemming from this exceptional and unique situation. We learned that it is difficult to frame any viable policy implications from such an extraordinary situation when many states have not tested their ad hoc measures. The best way, we consider, would be to renew trade and improve production before the next crisis. Nonetheless, in the area of technology, this painful period brought faster digitalization in all segments and the rationing of natural resources.
1 Introduction
Electricity is a vital input for human life and production; it is essential for the production and service sectors, and it is one of the main inputs for economic growth. However, in the previous 2 years, the COVID-19 pandemic has been the principal constraint in many sectors, from health to art. Governments were forced to impose lockdowns to minimize the spread of the disease, and many previously imposed measures continue to affect economies to date. Electricity consumption was also significantly affected due to the effect of lockdowns on production and trade. These activities were significantly curbed to minimize human contact. In general, the first effect of COVID-19 was seen in a rapid shrinking of international trade and reducing the functioning of supply chains. Naturally, this was followed by changes in the demand for services and products.
Furthermore, as a result, the world’s energy consumption decreased. Therefore, the relationship between shrinking electricity consumption and COVID-19 is an important accompanying indicator affecting world industry and the general population. By applying a panel-pooled mean group-autoregressive distributed lag (PMG-ARDL) model, we evaluate both the long-run and short-run linkages between electricity consumption, trade, GDP, and a COVID-19 dummy variable for the Visegrad countries during the period of 2010 Q1–2021 Q3. The region of the Visegrad Four was selected as a representative of transitional countries which had previously developed in the Eastern Bloc. In addition, we hope to find some contrasts between traditional capitalist economies and previously centrally planned economies.
Nevertheless, the main contribution of this study to the literature is to test the COVID-19 effect on electricity demand by considering trade and GDP for the Visegrad countries. Our empirical findings show that there is no long-term causal relationship among these variables for the Visegrad countries. But even if the trade variable is not significant in the long run, it is significant in the short run and for the cross-section models. Moreover, the COVID-19 dummy variable is significant in both the panel short-run and cross-section country-based short-run models. Finally, the dummy variable shows that the COVID-19 measures had a negative effect on electricity consumption.
The study’s theoretical framework is based on the EU’s strategic objective of energy efficiency. Energy use decreased in 2009 and 2010 compared to 2007. The increase in energy efficiency creates structural effects and leads to stagnation. Energy efficiency is a strategic objective for the EU because it may undeniably help to reduce electricity consumption through the adoption of new, highly energy-efficient technologies (Soava et al., 2021).
If there is a causality between a country’s GDP and electricity consumption, this means that energy conservation policies are the correct choice for the country and show that the country has not become dependent on energy for growth and development (Kumar Narayan and Singh, 2007).
If electricity consumption causes economic growth, then growth will be impacted by measures that promote a decrease in power use. If electricity consumption does not cause economic growth or if economic growth causes consumption then policies to conserve electricity will not have any effect on the expansion of the economy (Ciarreta and Zarraga, 2010).
After the coronavirus, SARS-CoV-2, which has been named COVID-19, emerged in Wuhan, China, the social and economic life of the world was abruptly affected. Governments around the world imposed preventive restrictions to stop the spread of the virus. Some of these restrictions still continue in some countries. Along with the containment measures, all governments implemented fiscal and monetary packages and supporting measures for their citizens (IMF, 2021). The majority of countries’ economies experienced imposed lockdowns, and this led to a decrease in production and energy consumption. The decline in production caused a reduction in the world’s GDP. As expected, these steps affected energy consumption, the primary necessity for production and life. The pandemic measures were expected to decrease energy use in production, although on the other hand, they may have increased household energy consumption. Another significant effect of the lockdown measures could be detected in international trade (Adam, Henstridge, and Lee, 2020; Jindrichovska, Ugurlu, and Thalassinos, 2020; Meier and Pinto, 2020; Hayakawa and Mukunoki, 2021; Pei, de Vries, and Zhang, 2021). For example, Jindrichovska, Ugurlu, and Thalassinos (2020) showed that, after the emergence of COVID-19, there was a significant decrease in international trade.
Regarding China, one of the world’s largest trade partners for virtually all continents and trade blocs, there was a 41% decrease in its volume of exports when comparing February 2020 to February 2019 (Pei et al., 2021). There was a slump in the world’s international trade. Hayakawa and Mukunoki (2021) find a detrimental effect of COVID-19 on trade for exports from 34 countries to 173 countries. By decreasing international trade, the world economy faced a scarcity of intermediate and final goods, thus leading to a global decrease in supply and demand, reducing countries’ GDP. Furthermore, concerning the future outlook, the World Bank report (World Bank, 2020) projects a seven per cent decrease in advanced economies in 2020. Also, the report asserts that global trade is expected to have collapsed faster in 2020 than during the global financial crisis. Eaton et al. (2016) and Baldwin and Tomiura (2020) show that adverse demand shocks reduce spending on durable products more than on non-durable ones. Moreover, the pandemic created financial risks, making it difficult for investors to find a safe haven and to invest productively with sufficient certainty (Wei and Han, 2021).
To help protect the economy from the destructive effects of COVID-19, developed economies such as the United States, United Kingdom, and EU member countries adjusted their monetary and fiscal policies (Chen et al., 2021; IMF, 2021). The EU is an important trade partner on the world stage and also an important economic power. After the UK’s exit from the EU (Brexit), European countries were expected to encounter an inevitable economic fallout (Kierzenkowski et al., 2016). Nevertheless, with the United Kingdom leaving the EU, other countries started to gain more importance, such as the Visegrad Group countries (Göllner, 2018; Monika, 2019). Historically, the Visegrad group’s main aim was to cooperate on accession to the European Union, to become members of the EU, and then, after becoming members, to integrate within the EU countries. The Visegrad Four (V4) countries aim to diversify their energy sources, increase foreign trade and attract more FDI (Dorożyński and Kuna-Marszałek, 2016; Su et al., 2018). Uğurlu and Jindřichovská (2022) investigated international trade among the Visegrad countries and found that there was a structural break at the beginning of the COVID-19 pandemic.
In this paper, we aim to investigate the effects of COVID-19 on the relationship between GDP and international trade on electricity consumption for the Visegrad Group countries, which are important EU members and have emerged from previously transitional economies.
The first contribution of the paper to the literature is to investigate the effect of COVID-19 using a dummy variable for the Visegrad countries. The second contribution is that we estimate both long-run and short-run relationships by using the pooled mean (PMG) estimator of (Pesaran and Shin, 1995; Pesaran et al., 1999) to characterize the relationship. The study’s major limitation is the short life span of testing relevant to it, the unknown situation, and the ad hoc reactions to COVID-19, which decreased energy consumption. However, there were also positive expectations of future renewal after the end of the COVID-19 crisis. These positive expectations were finally destroyed by the continuing unrest and war in Ukraine.
The paper is organized as follows: Section 2 provides a review of the literature. Section 3 describes the model and data. Section 4 presents the empirical approaches and results. Section 5 discusses the results, provides a conclusion, and points out the study’s limitations.
2 Literature review
2.1 Energy consumption GDP and environmental impact
Energy source consumption and the countries’ income or economic growth are widely investigated in the used literature. Magazzino, Porrini, Fusco and Schneider (2021a) explored the linkages between information and communications technology (ICT), electricity use and environmental pollution within the EU. The authors detect adverse environmental effects of ICT and suggest that energy-saving policies must be carefully implemented so as not to hinder economic growth. Furthermore, Magazzino, Mele, Morelli and Schneider (2021) investigated the link between ICT penetration, electricity consumption, economic growth, urbanization, and pollution in a sample of 25 OECD countries. The authors discovered that Internet usage emerges as a substantial CO2 generator. The authors discuss the potential policy measures.
A further link between ICT, electricity consumption, air pollution, and economic growth in EU countries was explored by Magazzino, Mele and Schneider (2020). The authors concentrated on the French transport sector, which relies heavily on oil products. Consumption of these fuels induces harmful health effects, which are particularly evident in urban areas. Evidence was brought from three major French cities. The authors explored the linkage to COVID-19-related deaths.
Energy source consumption and the countries’ income or economic growth are widely investigated in the used literature. Magazzino, Porrini, Fusco and Schneider (2021b) explored the linkages between ICT, electricity use and environmental pollution within the EU. The authors detect adverse environmental effects of ICT and suggest that energy-saving policies must be carefully implemented so as not to hinder economic growth.
Energy production, consumption and its environmental effects are some of the main interests of governments after the Rio 1992 and Kyoto 1997 UN conferences (Chichilnisky, 2010; Uğurlu, 2019). Energy is also one of the goals of the Visegrad Declaration (1991), the goal being cooperation in linking energy interests.
Several research papers have been published on the relationship between energy consumption and GDP. Krkošková (2021) investigates energy consumption and economic growth in the V4 countries from 2005 to 2009 using quarterly data. The author uses time series models for each country and finds that the relationship between energy and GDP is negative in Slovakia, positive in Czechia and Hungary, and with no relationship in Poland. Szlavik and Sebestyen Szep (2007) investigated the same relationship using a decoupling indicator and concluded that the energy intensity of the V4 countries reduced dramatically after the regime change. In the long run, it allows for economic expansion with a lower energy growth rate. Kasperowicz and Štreimikienė (2016) investigate energy consumption and economic growth for the V4 countries and the 14 countries of the “old” European Union member countries1. The interest in energy consumption and GDP relationship goes back nearly a half-century.
After the publication of this paper, there was an increasing interest in this topic. Researchers started to investigate the relationship between energy and its components, such as electricity, oil, etc. [see (Mozumder and Marathe, 2007; Abbasi, Abbas, and Tufail, 2021; Adekoya, 2021)]. Different types of energy sources and different kinds of income proxy variables have been used by employing different econometric techniques. The results are controversial. Some papers find no relationship (Cheng, 1995; Soytas and Sari, 2003); however, the majority of the papers find a relationship. We can divide those papers which find relationships into two groups: uni-directional relationships (Yu and Choi, 1985; Masih and Masih, 1998; 1996; Soytas and Sari, 2003) and bi-directional relationships (Masih and Masih, 1996; Soytas and Sari, 2003; Morimoto and Hope, 2004)2. Furthermore, in the literature, another topic is the relationship between electricity consumption and GDP. We have the same groups, such as no relationship and a uni-directional relationship (Shiu and Lam, 2004; Altinay and Karagol, 2005; Wolde-Rufael, 2006; Yoo, 2006; Chen et al., 2007; Mozumder and Marathe, 2007; Squalli, 2007; Yuan et al., 2007; Narayan, Narayan, and Smyth, 2008; Bianco et al., 2014) and a bi-directional relationship (Jumbe, 2004; Oh and Lee, 2004; Yoo, 2006; Magazzino, 2014). The authors conclude that energy consumption is positively related to economic growth, and this relationship is more efficient in Visegrad countries than in the other 14 EU countries. Uğurlu (2022) investigates the renewable energy and CO2 emission relationship for the V4 countries and finds a significant decreasing effect of renewable energy on CO2 emission.
Because trade, income, and energy consumption have been increasing globally over the past 3 decades, researchers take energy consumption, exports, and imports into account (Sadorsky, 2011). As we stated above, international trade affects production through the intermediate goods trade and affects production by the increasing demand of consumers in foreign countries. Thus, it is linked to the output of the countries. Again, as stated above, output produces energy needs, and energy consumption increases as the corresponding output increases. In this research, we take into consideration electricity as energy. It is used in both the production of small firms and corporations and in human life, supporting the household consumption of goods and services. Because of the devices we use in our lives, electricity is one of the most vital energy sources. In other words, electricity is one of the main inputs in production and a necessity of human life. The relationship between energy/electricity consumption and GDP, trade and other macroeconomic variables has been widely analyzed in literature for many different regions, i.e., the United States, South Africa, OECD countries, etc.
Sadorsky (2012, 2011) uses energy consumption and investigates the effect of real exports per capita on it for the Middle East and South America, respectively. Ghani (2012) uses energy demand as a dependent and trade liberalization as an independent variable. Sadorsky (2011) employs panel data analyses of eight Middle Eastern countries and finds a positive relationship between trade and energy. Ghani (2012) uses several countries with different models and finds different directions (negative-positive) of relationships between trade and energy consumption. Dedeoğlu and Kaya (2013) examine the relationship between energy use, output and trade for a panel of 25 OECD countries and indicate that promoting exports enhances energy use. Topcu and Payne (2018) identify energy use as a function of per capita GDP, energy prices and trade openness. The authors examine 34 OECD countries and find a significant and positive relationship.
During COVID-19, electricity demand fell by more than 20% in some countries because of government measures, but renewable energy grew (IEA, 2020). Therefore, global household electricity consumption increased by 40% (WEF, 2020). Also, in Turkey, there was a switch in electricity consumption from the service and production sectors to homes, supermarkets, and hospitals (Bulut, 2020). Consequent to these developments in the economy, estimating the effect of COVID-19 on energy sources and the economy is very noteworthy.
The four Central European neighboring countries of the V4 constitute a formal political group with some financial features and follow shared economic goals with varying degrees of success (Cabada, 2018). These four governments frequently collaborate when making internal and external policy decisions. It is crucial to look at the circular economies of the nations (Lacko, Hajduová, and Zawada, 2021). The GDP figures of the V4 countries are quite close to each other, and GDP development growth in the Czech Republic was similar to that of Slovakia. Regarding all the indicators, the Czech Republic has the best position among the V4 countries. Regarding GDP per capita, the Human Development Index, the Index of Economic Freedom and the Global Competitiveness Index GCI and IEF, the Czech Republic has the best position among the V4 countries (Ivanová and Masárová, 2018).
Only 2 years have passed since the emergence of COVID-19. Our aim is to recognize and measure the effect of the pandemic on some variables. If we study only annual data, we will have only two observations after COVID-19. Therefore, we use quarterly, monthly, or more frequent data to have more data and to see the effect more robustly. The variables we are working on are macroeconomic variables and are generally calculated quarterly or monthly. Because we have the GDP in independent variables, we use quarterly data from 2010 Q1 to 2021 Q3. The period includes the period before the lockdown going back the last 10 years and, after the lockdown, goes to the latest available data.
2.2 Effect of COVID-19 on electricity consumption
In addition to the existence of widespread research on the relationship between electricity consumption and GDP, there is newly developing literature on the effect of COVID-19 on electricity consumption (see Table 1). The outbreaks caused a reduction in total energy demand, but household consumption increased during the lockdown (Aruga, Islam, and Jannat, 2020). Iancu, Darab and Cirstea (2021) investigated the energy consumption and GDP relationship by comparing three periods: the first period being the 2008–2012 financial crisis and the post-crisis recovery period. The second is the 2013–2019 economic growth period, and the third is the 2020 Q1-2020 Q3 pandemic period. The authors find that, during the 2008 to 2012 period, there was no relationship between GDP and electricity consumption, contrary to previous papers. The paper finds an increase in electricity consumption in the pandemic period produced from RES and a decrease in electricity produced from coal.
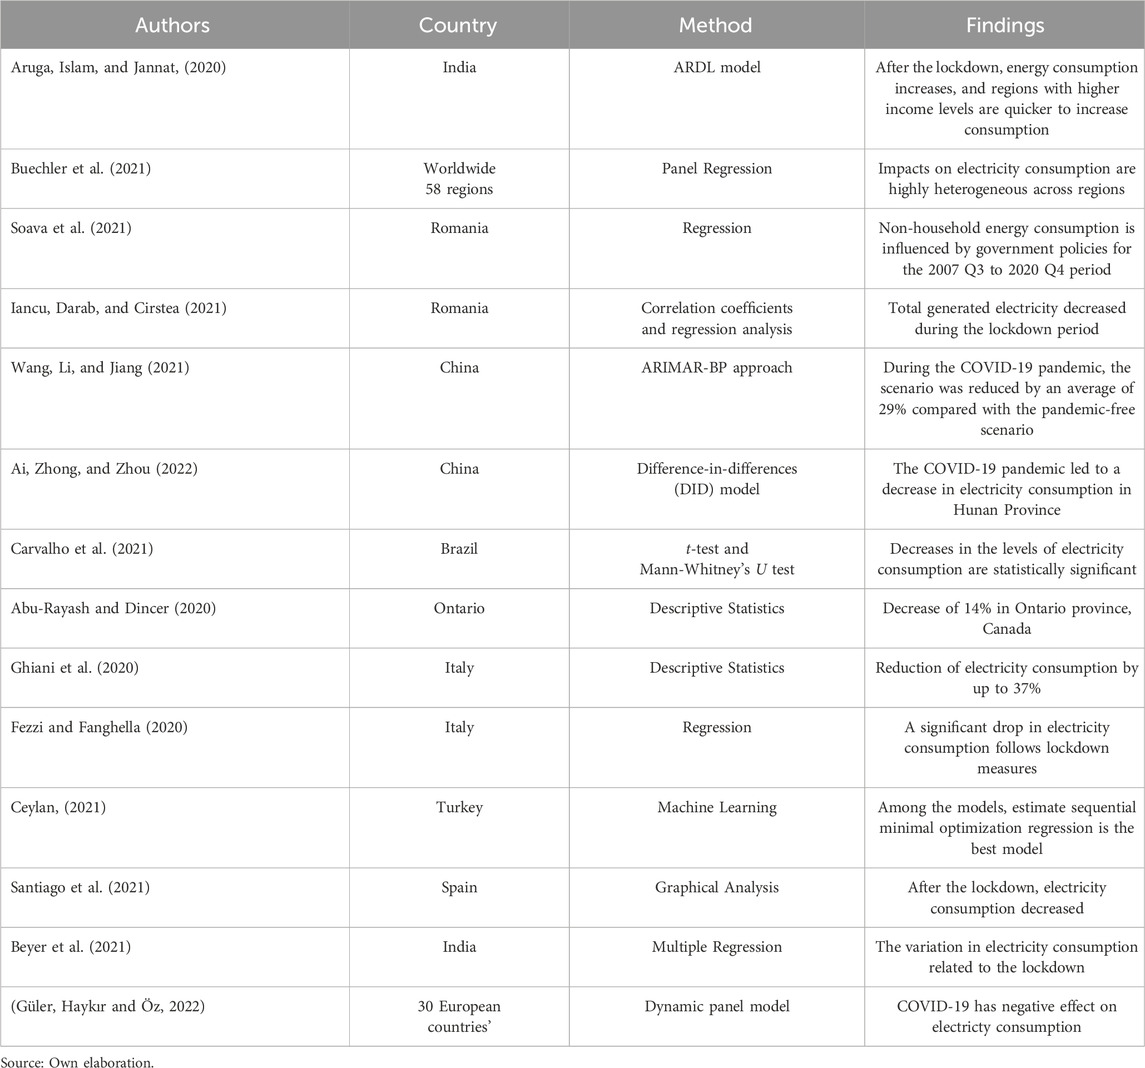
TABLE 1. Summary of literature review (the effect of COVID-19 on electricity consumption).
Soava et al. (2021) is another paper that explored Romania and finds that COVID-19 had a negative effect on electricity consumption. Ghiani et al. (2020) focus on gross electricity production from renewable energy sources like hydro, wind, solar, geothermal, and biomasses. The authors aim to measure the impact on the electricity consumption of these sources and their pricing. They find that the pandemic caused a reduction in consumption and immediately affected the day-ahead electricity market.
The Ai et al. (2022) and Wang et al. (2021) studies concentrate on China and the Hunan province. Wang et al. (2021) estimate autoregressive integrated moving averages (ARIMA) and a backpropagation neural network (BP) for the simulation of electricity consumption. The simulation results support the evidence of a reduction in electricity consumption. Ai et al. (2022) conclude that electricity consumption in the Hunan Province decreased by 27.8% during COVID-19 using the DID model, and this decrease is calculated as an approximately 121.187-billion-yuan economic loss. In addition, Santiago et al. (2021) collected data from the Spanish Power System Operator (www.ree.es) and performed detailed analyses using electricity consumption and generation data. After the lockdown, Spain experienced a 13.49 percent decrease in electricity consumption compared to the same time in the previous 5 years (2019–2015). This decline has primarily affected working days, with a 14.53 percent decrease, although weekends have also seen a 10.62 percent decrease. As a result, there has been a decrease in the amount of electricity used.
Fezzi and Fanghella (2020) estimate a regression model using time series data. The independent variables used in the model are six dummy variables identifying the day of the week, two dummy variables identifying official public holidays, and one dummy variable identifying the COVID-19 years (2020) and temperature. The dependent variable is electricity load. The temperature variable’s coefficient demonstrates that a major portion of heating has little effect on power consumption. Consumption declines dramatically during weekends, according to dummy variables based on the day of the week and public holidays. The COVID-19 dummy exhibits a statistically significant and negative coefficient, indicating that COVID-19 may be traced back to the 11th week. Carvalho et al. (2021) present a descriptive analysis of the Brazilian energy system and its subsystems (Northeast, North, South, and Southeast-Midwest) and use hypothesis testing to compare the period before the isolation and the period after the isolation; the differences between the periods cannot be rejected. Finally, Buechler et al. (2021) point out that GDP and electricity consumption are insignificant in the recovery period for 58 countries/regions from January-October 2020.
Ceylan (2021) uses machine learning to assess the effect of COVID-19 on electricity usage. The results suggest that the SMOReg approach is a reliable and resilient method for estimating short-term electricity demand in any crisis. Electricity usage is declining mainly in commerce and the manufacturing industries.
As it concerns more recent relevant publications the authors Bahmanyar, Estebsari, and Ernst (2020) compare electricity consumption in European countries in light of their pandemic measures. The authors find differences in consumption between countries with severe restrictions and countries with less restrictive measures. Furthermore, paper by Güler, Haykır and Öz (2022) concentrates on the impact of the COVID-19 pandemic on electricity consumption and economic growth nexus using 30 European countries’ using quarterly data between 2015Q1 and 2021Q3. The authors use dummy variables as equal to one when the sample period is between 2020Q1 and 2021Q3 in the full period and 2020Q1 - 2020Q3 in the “strict confinement periode”, and zero otherwise. The results reveal that there is an even stronger negative impact of electricity consumption on economic growth due to the pandemic mitigation strategies such as lockdowns and business shutdowns that cause people to intensely consume residential electricity.
Halbrügge et al. (2021) analysed how the German and other European electricity systems behaved during the COVID-19 pandemic and they find that the first wave of the COVID-19 pandemic led to decreases in electricity demand and a rising share of Renewable Energy Sources in various countries. Various flexibility options during the COVID-19 pandemic and a relatively higher grid capacity resulting from decreased electricity consumption may have contributed to grid stability. Buechler et al. (2021), research how the COVID-19 pandemic has altered electricity consumption. The authors quantify changes in electricity consumption in 58 different countries/regions around the world from January-October 2020. The paper examines how those changes relate to government restrictions, health outcomes, GDP, mobility metrics, and electricity sector characteristics in different countries. Results show that stricter government restrictions and larger decreases in mobility (particularly retail and recreation) are most tightly linked to decreases in electricity consumption.
Prol and Sungmin (2020) explore the impact of measures to contain COVID-19. The study shows that the cumulative decline in electricity consumption within the 5 months following the stay-home orders ranges between 3% and 12% in the most affected EU countries and United States states. At the same time, the study shows that the relationship between measures of stringency and daily decline in electricity consumption is nonlinear. Huang and Gou (2022) explore the energy demand changes during COVID-19 in particular they search the impact of the restriction and easing policies on the energy consumption of public buildings in Scotland, United Kingdom, results show that the COVID-19 restriction has a greater impact on the electricity reduction in the first year of the pandemic than that in the second year. The results allow to develop more realistic energy demand policies based on public building types.
The previous literature shows that there is a relationship between GDP and energy consumption. However, we can observe different effects in different regions and different periods. The research on the COVID-19 period is not vast in this respect, but several researchers have studied this topic, and the common result is a decrease in electricity consumption at the beginning of the pandemic. The motivation for this present study is to look more closely at these effects in the Visegrad Four. There are but few studies in the literature investigating the effect of COVID-19 on the relationship between macroeconomic variables and energy consumption. Hence our motivation to investigate the impact of COVID-19 on the relationship between GDP and the international trade on electricity consumption for the countries of the Visegrad Group. These Visegrad Four (V4) countries, consisting of Czechia, Hungary, Poland, and Slovakia, are important EU members and also transitional economies.
3 Model and data
3.1 Model and methodology
In this paper, our aim is to see both long-run and short-run dynamics by using a panel data set of the variables. To see short-run and long-run dynamics together the main technique is cointegration regression. However, to estimate the cointegration model the data have to be in the same order of integration level. If the variables are not in the same order of integration level, one of the methodologies we can use is the panel ARDL model, therefore, we use the panel ARDL.
The ARDL methodology is the most often used methodology for similar studies. We used the same steps as (Attiaoui and Boufateh, 2019; Hotak et al., 2020; Nyeadi, 2023), who constructed their empirical application starting with the first-generation unit root tests and then cointegration tests (such as Pedroni and Kao, 1999) and the PMG model. Hotak et al. (2020) state that the reason for using the PMG model is “in addition, the possible correlation between the mean-differenced independent variables and the white noise term may cause standard autoregressive distributed lag (ARDL) models to suffer from biased estimators in panel data models with fixed effects. To mitigate such an issue, this study follows the methods of several studies, such as (Bekun et al., 2019; Sarkodie and Strezov, 2019), and applies the panel PMG-ARDL model, which is a combination of ARDL (p,q) models and PMG estimators (Pesaran et al., 1999).
We use the panel autoregressive distributed lag (ARDL) model, which allows for estimating the cointegration model among variables that are not in the same order (Ampofo et al., 2021). The ARDL model is proposed by (Pesaran and Shin, 1995). Kahouli (2017) states four advantages of the ARDL approach: 1) not having the same order integrated series compulsorily, 2) not having endogeneity problems, and it is more reliable than Johansen and Juselius’s cointegration for small sample properties 3) the ARDL procedure captures an appropriate number of lags in the data generating process, particularly in general for a specific process. 4) the ARDL procedure employs a single reduced-form equation.
(Isiksal and Assi, 2022) use a Pooled Mean Group estimation developed by (Pesaran et al., 1999) and defined it as “The PMG is mainly preferred since it allows the short-run responses to be flexible and unrestricted across groups while imposing restrictions by pooling individual groups in the long run. That is, the likelihood-based PMG estimator constrains the elasticity of the long run to be equal across all panels, which results in consistent and efficient estimates only when homogeneity restriction is confirmed” (Isiksal and Assi, 2022, page 5).
(Pesaran et al., 1999) start by estimating ARDL (p,q,q, … ,q) the model which is below
where
We aim to investigate GDP, trade, and the COVID-19 effect on electricity consumption. The basic representation of our model is:
where
The empirical analysis starts with unit root testing; unit root tests determine the stationarity level of the data. To prevent spurious regression in the model, we have to use the same order integrated values. To determine the integration level of the data, some unit root tests were proposed. After unit root testing, the next step is checking cointegration among the variables to establish a long-run association among the variables. The last step is decided based on the cointegration test results. After the cointegration test, if the decision is the estimation of the error correction model, long-run and short-run models will be estimated. The main step is the unit root test step; if the data have the same integration level, we use the VEC or VAR model; if the data do not have the same integration level, we use the ARDL model.
For the short-run model, the basic representation of the model is as follows:
where ECT is the error correction term that shows the short-run disequilibrium of the long-run deviations.
3.2 Data
Our study uses the quarterly panel data of the Visegrad countries for the period of 2010 Q1 to 2021Q1. The data are collected from Eurostat; the GDP is Gross domestic product at market prices GDP (2010 = 100)3, ELEC is monthly electricity consumption4 (Gigawatt-hour), and TRADE is monthly Volume index (2015 = 100)5. ELEC and TRADE data are collected as monthly data, and they are converted to quarterly data using EViews. Because trade is an index variable, we use it as a level series. Contrary to trade, GDP and ELEC variables have high values and considerable variation and the data are seasonal. Therefore at first we seasonally adjusted6 (_SA shows the data is seasonally adjusted data) all the data we use, then took their logarithm. The abbreviations are LGDP and LELEC (because the short abbreviation “SA” is not added to the abbreviation). For the measure of the COVID-19 effect, we define the impulse dummy variable (DC).
There are different types of dummy variables (Lütkepohl, Saikkonen, and Trenkler, 2004; Brüggemann and Lütkepohl, 2006). Define two types of dummy variables; the shift dummy and the impulse dummy. While the impulse dummy takes 1 for the break and zero elsewhere, the shift dummy takes 1 during the break. In this paper, the dummy variable DC takes 1 in 2020 Q2 and 0 otherwise, based on (Ugurlu and Jindřichovská, 2022). In (Ugurlu and Jindřichovská, 2022), the authors find that the shift dummy is statistically significant and has a negative effect on trade for the V4 countries for monthly data. Because the data period is a monthly period, the dummy variable takes 12,020 M4, but, in this research, we use quarterly data, and the corresponding date is 2020 Q2. The selected shift date is determined based on the date of the first COVID-19 case in the countries and lockdown dates. The first case of COVID-19 was reported on 1 March 2020, in Czechia, on 4 March 2020, in Hungary, on 4 March 2020, in Poland, and on 13 March 2020, in Slovakia (IMF, 2021). In Hungary, a state of emergency was declared on March 11; in Poland, the government’s first containment measures were introduced in March.
Therefore, the model is as follows:
A graphical representation of the data is presented in Figure 1. Because the GDP variable is seasonally and calendar-adjusted data, it is very smooth, and it is very clear there is a break in 2020. However, the ELEC and TRADE variables are not seasonally adjusted; that is why we can see seasonal movements in the graphs; we seasonally adjusted these data using STL Decomposition.
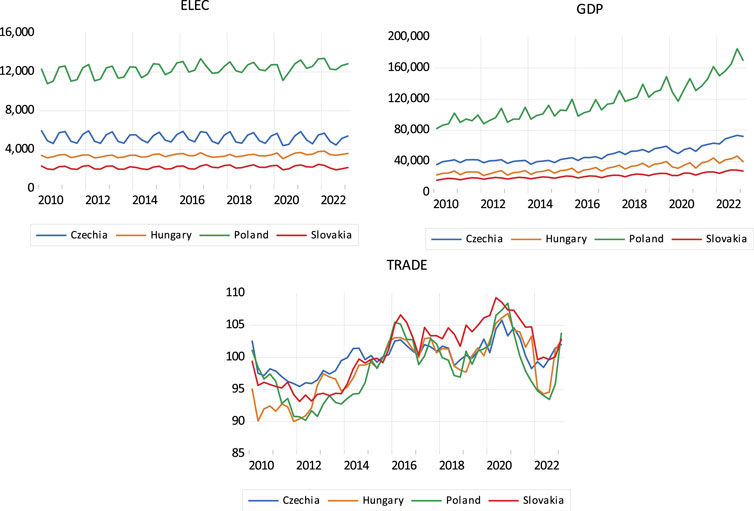
FIGURE 1. Graphs of the used variables.
The following Table 2 presents descriptive statistics of the collected and used variables. The values of the seasonally adjusted variables show that there is no high seasonality. This finding is statistically significant, and after the logarithm of the variables was taken, the volatility of the series decreased.
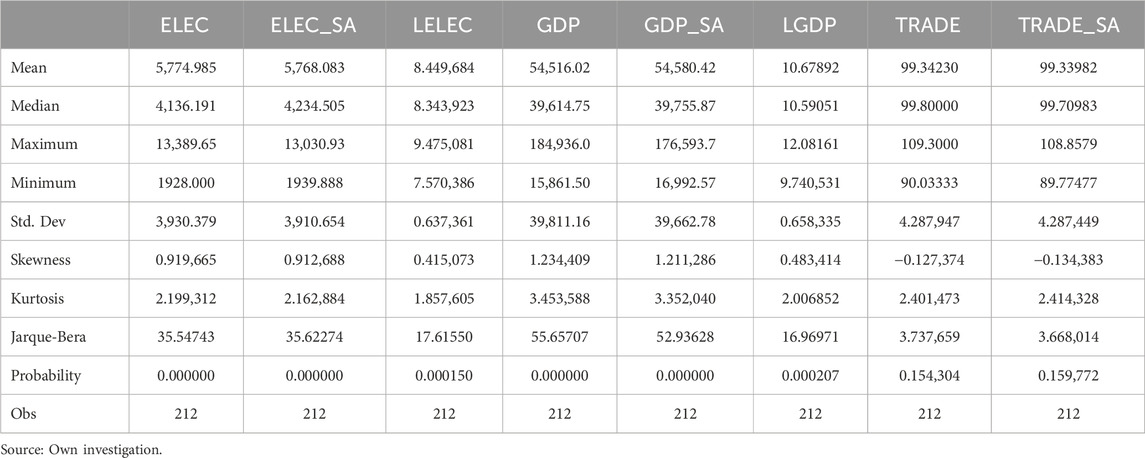
TABLE 2. Descriptive statistics.
Table 2 shows descriptive statistics of the variables collected, calculated, and used in the model. The number of observations is 212, and standard deviations are the indicator of the volatility of the variables. It is obvious that electricity consumption has the lowest volatility, and we did not use its logarithm.
4 Empirical application results
The empirical application starts with calculating the basic relationship among the variables. Table 3 shows the correlation coefficients between the three variables used in the study. The table shows that LGDP and LELEC have a positive high and a statistically significant correlation. TRADE_SA and LGDP variables have a insignificant correlation coefficient. However, the weak relationship between independent variables indicates that the multicollinearity between variables is not an important level. Our expectation is a low correlation between dependent variables and a high correlation between dependent and independent variables.
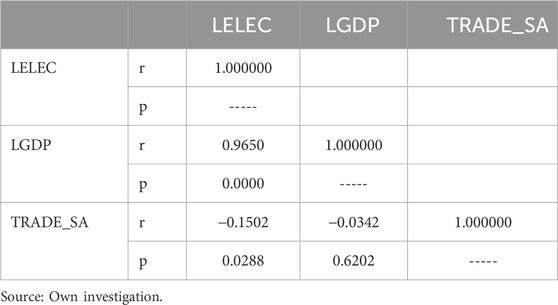
TABLE 3. Correlation matrix.
Different panel-unit root tests can be used in panel studies which are split in two groups that are first generation panel unit root tests and second generation panel unit root tests. Before choosing one, detecting the cross-sectional dependencies of the variables is important step. The use of second-generation panel-unit testing should be made in the case of cross-sectional dependencies. We use Breusch and Pagan (1980) LM test, Pesaran (2004) scaled LM test, Baltagi et al. (2012) bias-corrected scaled LM test and Pesaran (2004) CD test to test cross-sectional dependency and the results are presented in Table 4.
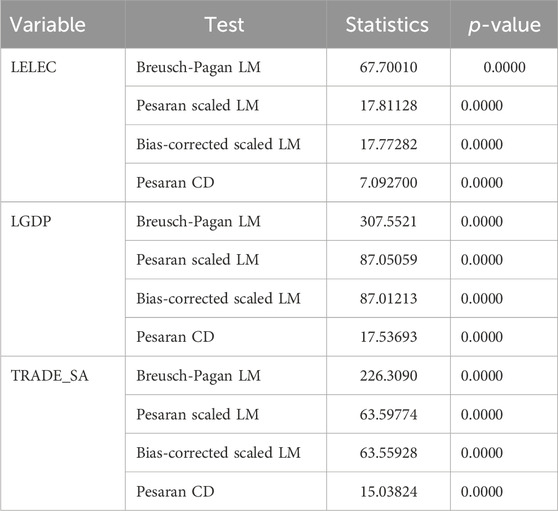
TABLE 4. Cross-sectional dependency test.
The null hypothesis of the test is there is no cross-sectional dependency. That is why we reject the null hypothesis, we proceed with the analysis by employing the second-generation panel unit root tests. We use CIPS (Pesaran, 2007) test to detect unit root of the variables.
The unit root test results show that (Table 5) LELEC nad LGDP variables are I (1) and TRADE_SA is I (0), thus the variables are not at the same integration level. In this situation, the ARDL model has been a widely used method; it can be employed regardless of whether the series is I (1) or I (0) (Uğurlu and Jindřichovská, 2022).
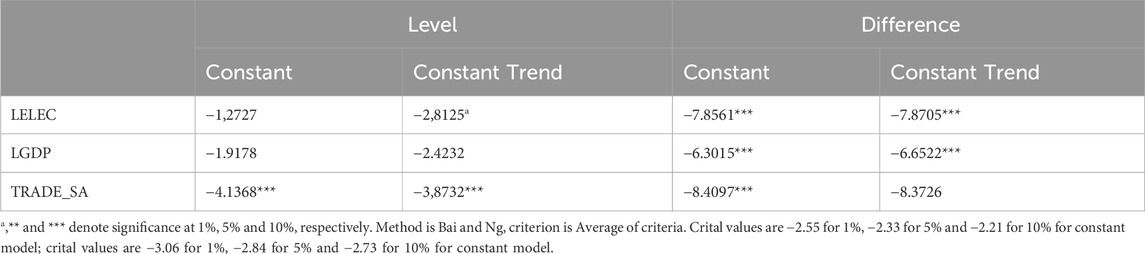
TABLE 5. CIPS unit root test.
Pesaran et al. (1999) introduce the PMG estimation, which suggests the heterogeneity of the short-run coefficients, while long-run coefficients are restricted to be identical and homogeneous for all regions of the panel.
Table 6 reports the PMG-ARDL (6,6,6) model results for the long-run estimates and the short-run dynamics of electricity with respect to real GDP and trade are presented in Table 7. In the table we do not present lagged variables to simplify the output.
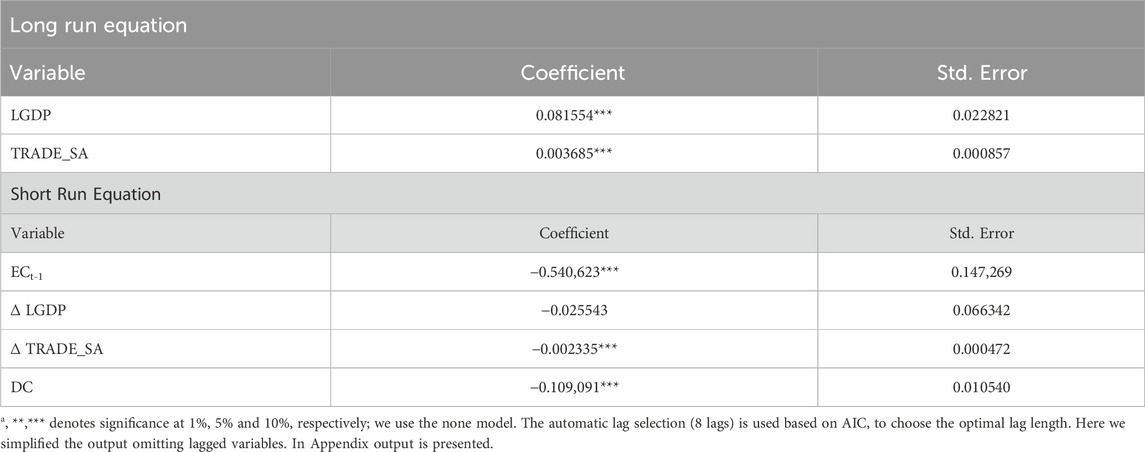
TABLE 6. PMG-ARDL (6,6,6) (dependent variable LELEC).
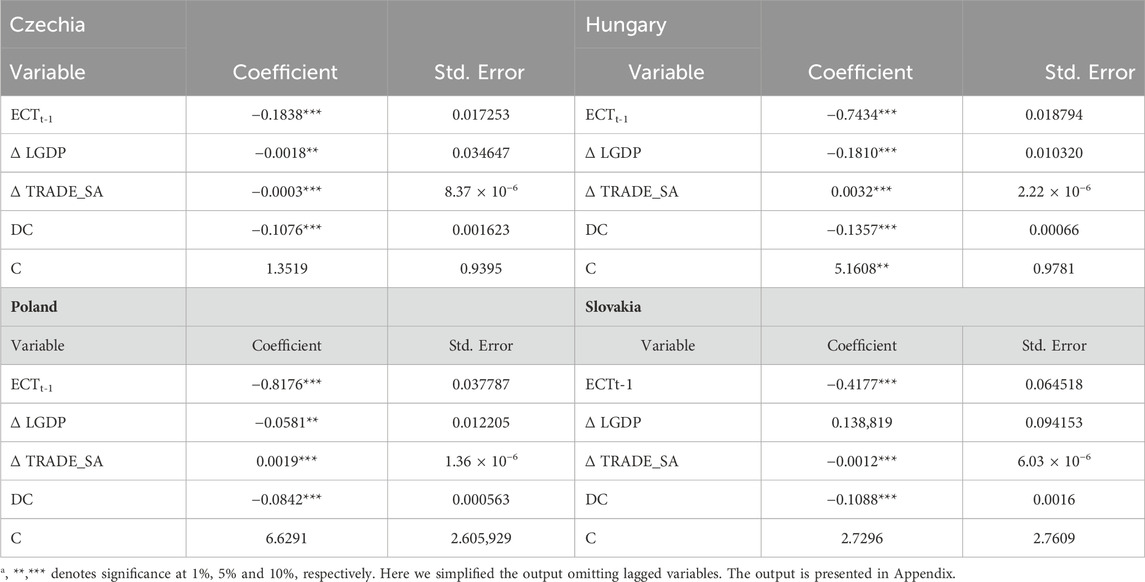
TABLE 7. Short-run results by country (dependent variable LELEC).
The study uses the Akaike information criterion (AIC) to select the optimal model by employing long-run and short-run associations among variables, which is shown in Figure 2. The robustness of the errors is presented in the Supplementary Appendix.
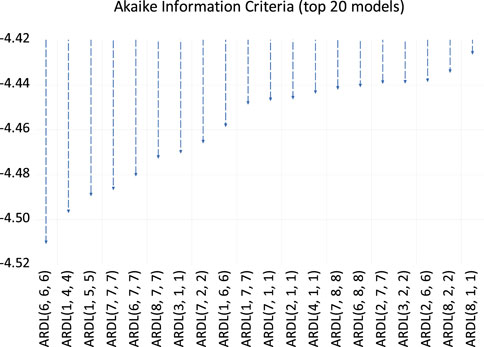
FIGURE 2. ARDL model selection criterion. Source: Authors’ calculation.
The results show that the correction term (ECT) is negative and significant, indicating that the error correction mechanism works. In the long-run model, real GDP and trade has a significant positive effect in the long run. In the short-run model, trade is significant but GDP is not significant. However in the appendix some of lagged variables of the GDP is significant and some lagged trade values are not significant. Contrary to the positive impact in Sadorsky (2011) and Dedeoğlu and Kaya (2013), Topcu and Payne (2018), and the negative impact for some countries in Ghani (2012), we find no significant effect for V4. However, GDP and DC are significant at a one per cent level. Real GDP positively affected electricity consumption in the short run, and the COVID-19 dummy has a negative effect on electricity consumption. The finding of the relationship between GDP and electricity consumption is supported by Aruga et al. (2020), Masih and Masih (1998), Soytas and Sari (2003), Yu and Choi (1985), Masih and Masih (1996); Morimoto and Hope (2004). Finally, the negative COVID dummy coefficient is supported by Iancu et al. (2021), Ai et al. (2022), Abu-Rayash and Dincer (2020), and Fezzi and Fanghella (2020).
When we take into consideration the cross-section base and the short-run models, all the coefficients in Table 7 are significant. The GDP variable in Czechia and Poland is significant at the five per cent level, and the constants are significant at the five per cent level significance in all models except for the Czechia. Tradevariable significant in allthe models but it is negative in Czechia and Poland and positive in Hungary and Poland. Dummy variable is significant and negative in all the countries models which is expected. In all models, the error correction term is negative, which indicates that the short-run model is valid. While trade negatively affects electricity consumption in Czechia and Slovakia, in Hungary and Poland the effect is positive. However, GDP has a positive impact only in Hungary. These results mean that there is a short-run relationship in the countries between GDP, electricity consumption, trade, and electricity consumption. For trade, we saw significant results in all the countries, but the direction is not the same.
The different results for the countries are explained by their GDP and trade patterns. For example, the Czech Republic is the main import partner of Slovakia and Poland, and the Czech Republic’s main export partner is Slovakia. Hungary has significantly lower values than the other three countries (Uğurlu and Jindřichovská, 2022). Moreover, the GDP per capita of the Czech Republic is higher than the other three member countries. These kinds of differences cause different country-based results. Finally, in all cross-section models, the coefficient of the COVID-19 dummy is negative, indicating that the lockdown effects decreased electricity consumption in the V4.
5 Discussion
The results show that the relationship between electricity consumption and GDP is not straightforward. Furthermore, it has recently been affected by the war in the Ukraine, which naturally impacts neighboring countries. In this study, we have concentrated on the relations within the Visegrad Four, which has a relatively long history. Extending the focus to the broader region, we should also include other neighboring countries which have formed the Bucharest Nine (B9) since November 2015. This new political block was established after the Russian invasion of the Ukraine. All members of the B9 were either part of the former Soviet Union (USSR) or members of the defunct Soviet-led Warsaw Pact. Until recently, these countries used energy imported from Russia. Further impact can also be observed in the Three Seas Initiative, which represents a more economically tuned collaboration Cabada (2018); Schmidt, (2017).
These countries’ governments commonly work together to decide on internal and exterior policies; therefore, it is important to closely examine their circular economies (Lacko et al., 2021). The V4 nations’ GDPs are somewhat comparable with one another. The Czech Republic’s GDP growth rate was similar to Slovakia’s. The Czech Republic is the V4 nation with the best standing across all metrics. The Czech Republic holds the top spot among the V4 countries in terms of GDP per capita, Human Development Index, Index of Economic Freedom, and Global Competitiveness IndexGCI and IEF (Ivanová and Masárová, 2018).
The existing literature on electricity consumption and GDP is vast, and different independent variables are used in the literature. For example, the GDP and trade effect was investigated in some of the papers in the literature. In this paper, we add a new variable, which is the effect of COVID-19, to the papers that investigate the relationship between trade and electricity consumption. The question we aim to answer is: What is the consequence of government measures and the COVID-19 lockdown on electricity consumption?
During the COVID-19 period, we saw a rapid decrease in GDP, trade, and employment rates. This reduction was seen for all types of economies, whether they are developed, developing or underdeveloped countries. In this study, we focus on the Visegrad Group. The four countries are Czechia, Hungary, Poland, and Slovakia. The group is a platform for the cooperation of these four Central European countries. One of the goals of the cooperation is to link energy markets.
Furthermore, as members of the European Union, they should establish three key energy priorities: lowering import dependency, mitigating climate change, and enhancing competitiveness. This study is probably a unique paper on the Visegrad countries because of its estimating the effects of COVID-19 on energy consumption. Extending the focus to the Three Seas Initiative would be worthwhile in the following research, as it is a similar grouping focusing on non-economic and environmental aspects Waisová (2018). This initiative is supported mainly by Poland, the largest and most populous country of the V4 block.
In this presented model, we explored the relationship between the all-independent variables that are significant in all models. Moreover, the error correction terms are negative, showing that short-run dynamics work. While trade negatively affects electricity consumption in Poland and Hungary, the effect is positive in Czechia and Slovakia. GDP positively impacts all countries and has a positive effect in the long run in all V4 countries. However, trade behavior changes based on the country. Whereas in Hungary and Poland, international trade increases electricity consumption, in Czechia and Slovakia, international trade decreases electricity consumption. We can see that the effects may differ significantly in countries with a similar history, even in the same block.
6 Conclusion and policy implications
The all-independent variables in all models are significant in all models. Moreover, the error correction terms are negative, showing that short-run dynamics work. While trade negatively affects electricity consumption in Poland and Hungary, in Czechia and Slovakia, the effect is positive. GDP has a positive impact on all countries. GDP has a positive effect in the long run in all V4 countries. However, trade behavior changes based on the country. Whereas in Hungary and Poland, international trade increases electricity consumption, in Czechia and Slovakia, international trade decreases electricity consumption.
In this research, we focused on comparing the periods before and after the COVID-19 pandemic. We started in 2010—the first observation is from 2010 Q1—and the last published quarterly data is from 2021 Q3. The variables are seasonally and calendar-adjusted GDP (constant), monthly electricity consumption and trade. Because GDP is seasonally adjusted, we use seasonally adjusted electricity consumption and trade data. Also, because of the high variability of GDP and electricity consumption, we used the logarithm of GDP and the logarithm of electricity consumption. The last variable is the impulse dummy of the COVID-19 lockdown, which takes 1 in 2020:Q2 and 0 otherwise.
The unit root test results show that the series are not at the same integration level. Therefore, we decided to use the ARDL bounds test approach. In the last step, we estimated both long- and short-run models for panel data and for each country. The significant error correction term shows the significant long-run relationship among variables. In the long run, GDP and trade are significant and positively affect electricity consumption. In the short-run cross-country model, all coefficients except GDP in Slovakia are significant. In these models, error correction terms are negative and significant. For example, in Poland and Hungary, trade effects positively; in Czechia and Slovakia, the effect of trade is negative, GDP has a positive impact on all the countries except Slovakia in the short-run., and the dummy variable is significant and negative in all countries. The contradictory results between the long-run and short-run models may be caused by the big differences in the trade volumes of the countries. Similarly, previous researchers find different relationships for different regions in their panel data studies. The COVID-19 pandemic was an unexpected and abrupt crisis, and its effect was severe initially. Because of these features of the crisis, it was hard to take precautions before the crisis; therefore, the adverse impact on economies spread to energy consumption.
One of the main aims of the paper is to test the COVID-19 effect. The results showed that COVID-19 negatively affected electricity consumption in all the estimated models. We learned from this situation that it is difficult to frame any country-specific policy implications as all countries experienced previously unknown crisis conditions with no clear guidelines for optimizing their responses. In our opinion, a conservative strategy would have been the best suited to help countries to recover from the effects of sometimes costly ad hoc measures adopted during the most critical times. However, this painful crisis brought the positive results of improving online communication and the better use of digitalization, an initiative which had already begun earlier as the EU innovation strategy. The digital future strategy clearly seems to be a promising way forward.
Further research into the relationship between electricity consumption, trade, and GDP can use more independent variables to understand the impact of each selected variable on electricity consumption. Also, further studies can use annual data to investigate the relationship. This study’s particular limitations are the use of the latest data, which is 2021 Q1, and the main macroeconomic variables. In future research, we recommend broadening the area to include the effects on neighboring countries besides the Visegrad Four.
Data availability statement
The original contributions presented in the study are included in the article/Supplementary Material, further inquiries can be directed to the corresponding author.
Author contributions
Conceptualization, EU and IJ; methodology, EU; validation, IJ and EU; formal analysis, EU and IJ; investigation, EU; resources, EU; data curation, EU; writing–original draft preparation, IJ and EU; writing–review and editing, EU and IJ; visualization, EU; supervision, IJ; project administration, IJ; funding acquisition, IJ. All authors contributed to the article and approved the submitted version.
Funding
The APC was funded by the Czech University of Life Sciences, Prague.
Acknowledgments
The authors would like to express their thanks to the reviewers of the paper and the academic editors of the journal for their guidance and helpful comments.
Conflict of interest
The authors declare that the research was conducted in the absence of any commercial or financial relationships that could be construed as a potential conflict of interest.
Publisher’s note
All claims expressed in this article are solely those of the authors and do not necessarily represent those of their affiliated organizations, or those of the publisher, the editors and the reviewers. Any product that may be evaluated in this article, or claim that may be made by its manufacturer, is not guaranteed or endorsed by the publisher.
Supplementary material
The Supplementary Material for this article can be found online at: https://www.frontiersin.org/articles/10.3389/fenrg.2023.1141847/full#supplementary-material
Footnotes
1Belgium, Denmark, Germany, Ireland, Spain, France, Italy, Luxembourg, Netherlands, Austria, Portugal, Finland, Sweden, the United Kingdom.
2Because some of the researchers take into account more than one country in their paper, they find different results for different countries. We put some of the papers in more than one group because of this situation. For example, (Soytas and Sari, 2003) find non-cointegration for Indonesia and Poland, uni-directional causality.
3GDP: GDP and main components (output, expenditure and income) [NAMQ_10_GDP__custom_1751626] Chain linked volumes (2010), million euro. Source: Eurostat https://ec.europa.eu/eurostat/databrowser/view/namq_10_gdp/default/table?lang=en
4ELEC: Supply, transformation and consumption of electricity - monthly data [NRG_CB_EM__custom_1752834] Gigawatt-hour. Source: Eurostat https://ec.europa.eu/eurostat/databrowser/view/NRG_CB_EM__custom_1752834/default/tableSupply, transformation and consumption of electricity - monthly data [NRG_CB_EM__custom_1752834]
5EU27 (from 2020) international trade - monthly data EI_ETEU27_2020_M__custom_1751889] Trade value in million EURO. Source: Eurostat https://ec.europa.eu/eurostat/databrowser/view/EI_ETEA_M__custom_6984381/default/table?lang=en
6Using STL Decomposition option of EViews.
References
Abbasi, K. R., Abbas, J., and Tufail, M. (2021). Revisiting electricity consumption, price, and real GDP: a modified sectoral level analysis from Pakistan. Energy Policy 149, 112087. February. doi:10.1016/j.enpol.2020.112087
Abu-Rayash, A., and Dincer, I. (2020). Analysis of the electricity demand trends amidst the COVID-19 coronavirus pandemic. Energy Res. Soc. Sci. 68, 101682. October. doi:10.1016/j.erss.2020.101682
Adam, C., Henstridge, M., and Lee, S. (2020). After the lockdown: macroeconomic adjustment to the COVID-19 pandemic in sub-saharan Africa. Oxf. Rev. Econ. Policy 36, S338–S358. Supplement_1. doi:10.1093/oxrep/graa023
Adekoya, O. B. (2021). Revisiting oil consumption-economic growth nexus: resource-curse and scarcity tales. Resour. Policy 70, 101911. March. doi:10.1016/j.resourpol.2020.101911
Ai, H., Zhong, T., and Zhou, Z. (2022). The real economic costs of COVID-19: insights from electricity consumption data in hunan Province, China. Energy Econ. 105, 105747. January. doi:10.1016/j.eneco.2021.105747
Altinay, G., and Karagol, E. (2005). Electricity consumption and economic growth: evidence from Turkey. Energy Econ. 27 (6), 849–856. doi:10.1016/j.eneco.2005.07.002
Ampofo, G. M. K., Cheng, J., Bosah, P. C., Edwin Twum, A., and Senadzo, P. (2021). Nexus between total natural resource rents and public debt in resource-rich countries: a panel data analysis. Resour. Policy 74, 102276. December. doi:10.1016/j.resourpol.2021.102276
Aruga, K., Islam, Md M., and Jannat, A. (2020). Effects of COVID-19 on Indian energy consumption. Sustainability 12 (14), 5616. doi:10.3390/su12145616
Attiaoui, I., and Boufateh, T. (2019). Impacts of climate change on cereal farming in Tunisia: a panel ARDL–PMG approach. Environ. Sci. Pollut. Res. 26 (13), 13334–13345. doi:10.1007/s11356-019-04867-y
Baldwin, R., and Tomiura, E. (2020). Thinking ahead about the trade impact of COVID-19. Econ. Time COVID- 19, 59–71.
Baltagi, B. H., Feng, Q., and Kao, C. (2012). A Lagrange multiplier test for cross-sectional dependence in a fixed effects panel data model. J. Econ. 170 (1), 164–177. doi:10.1016/j.jeconom.2012.04.004
Bekun, F. V., Alola, A. A., and Sarkodie, S. A. (2019). Toward a sustainable environment: nexus between CO2 emissions, resource rent, renewable and nonrenewable energy in 16-EU countries. Sci. Total Environ. 657, 1023–1029. doi:10.1016/j.scitotenv.2018.12.104
Beyer, R. C. M., Franco-Bedoya, S., and Galdo, V. (2021). Examining the economic impact of COVID-19 in India through daily electricity consumption and nighttime light intensity. World Dev. 140, 105287. April. doi:10.1016/j.worlddev.2020.105287
Bianco, V., Manca, O., Nardini, S., and Minea, A. A. (2014). An analysis of the electricity sector in Romania. Energy Sources, Part B Econ. Plan. Policy 9 (2), 149–155. doi:10.1080/15567241003792366
Breusch, T. S., and Pagan, A. R. (1980). The Lagrange multiplier test and its applications to model specification in econometrics. Rev. Econ. Stud. 47 (1), 239–253. doi:10.2307/2297111
Brodny, J., and Tutak, M. (2021). The comparative assessment of sustainable energy security in the Visegrad countries. A 10-year perspective. J. Clean. Prod. 317, 128427. doi:10.1016/j.jclepro.2021.128427
Brüggemann, R., and Lütkepohl, H. (2006). A small monetary system for the euro area based on German data. J. Appl. Econ. 21 (6), 683–702. doi:10.1002/jae.864
Buechler, E., Powell, S., Sun, T., Astier, N., Zanocco, C., Bolorinos, J., et al. (2021). Global changes in electricity consumption during COVID-19. IScience 25, 103568. December. doi:10.1016/j.isci.2021.103568
Bulut, M. (2020). Analysis of the covid-19 impact on electricity consumption and production. Sakarya Univ. J. Comput. Inf. Sci. 3 (3), 283–295. doi:10.35377/saucis.03.03.817595
Cabada, L. (2018). The Visegrad cooperation in the context of other central European cooperation formats. Polit. Central Eur. 14 (2), 165–179. doi:10.2478/pce-2018-0014
Carvalho, M., Mello Delgado, D. B. D., Marques de Lima, K., de Camargo Cancela, M., Alves dos Siqueira, C., and Leandro Bezerra de Souza, D. (2021). Effects of the COVID-19 pandemic on the Brazilian electricity consumption patterns. Int. J. Energy Res. 45 (2), 3358–3364. doi:10.1002/er.5877
Ceylan, Z. (2021). The impact of COVID-19 on the electricity demand: a case study for Turkey. Int. J. Energy Res. 45 (9), 13022–13039. doi:10.1002/er.6631
Chen, C., Shi, Yu, Zhang, P., and Ding, C. (2021). A cross-country comparison of fiscal policy responses to the COVID-19 global pandemic. J. Comp. Policy Analysis Res. Pract. 23 (2), 262–273. doi:10.1080/13876988.2021.1878885
Chen, S.-T., Kuo, H.-I., and Chen, C.-C. (2007). The relationship between GDP and electricity consumption in 10 asian countries. Energy Policy 35 (4), 2611–2621. doi:10.1016/j.enpol.2006.10.001
Cheng, B. S. (1995). An investigation of cointegration and causality between energy consumption and economic growth. J. Energy Dev. 21 (1), 73–84.
Choi, I. (2001). Unit root tests for panel data. J. Int. Money Finance 20 (2), 249–272. doi:10.1016/S0261-5606(00)00048-6
Ciarreta, A., and Zarraga, A. (2010). Economic growth-electricity consumption causality in 12 European countries: a dynamic panel data approach. Energy Policy 38 (7), 3790–3796. doi:10.1016/j.enpol.2010.02.058
Dedeoğlu, D., and Kaya, H. (2013). Energy use, exports, imports and GDP: new evidence from the OECD countries. Energy Policy 57, 469–476. June. doi:10.1016/j.enpol.2013.02.016
Dorożyński, T., and Kuna-Marszałek, A. (2016). Investment attractiveness. The case of the Visegrad group countries. Comp. Econ. Res. Central East. Eur. 19 (1), 117–138. doi:10.1515/cer-2016-0007
Eaton, J., Kortum, S., Neiman, B., and Romalis, J. (2016). Trade and the global recession. Am. Econ. Rev. 106 (11), 3401–3438. doi:10.1257/aer.20101557
Fezzi, C., and Fanghella, V. (2020). Real-time estimation of the short-run impact of COVID-19 on economic activity using electricity market data. Environ. Resour. Econ. 76 (4), 885–900. doi:10.1007/s10640-020-00467-4
Ghani, G. M. (2012). Does trade liberalization effect energy consumption? Energy Policy 43, 285–290. April. doi:10.1016/j.enpol.2012.01.005
Ghiani, E., Galici, M., Mureddu, M., and Pilo, F. (2020). Impact on electricity consumption and market pricing of energy and ancillary services during pandemic of COVID-19 in Italy. Energies 13 (13), 3357. doi:10.3390/en13133357
Göllner, R. T. (2018). The visegrád group – a rising star post-brexit? Changing distribution of power in the European council. Open Political Sci. 1 (1), 1–6. doi:10.1515/openps-2017-0001
Hayakawa, K., and Mukunoki, H. (2021). The impact of COVID-19 on international trade: evidence from the first shock. J. Jpn. Int. Econ. 60, 101135. June. doi:10.1016/j.jjie.2021.101135
Hotak, S., Islam, M., Kakinaka, M., and Kotani, K. (2020). Carbon emissions and carbon trade balances: international evidence from panel ARDL analysis. Environ. Sci. Pollut. Res. 27 (19), 24115–24128. doi:10.1007/s11356-020-08478-w
Iancu, I. A., Cosmin, P. D., and Stefan, D. C. (2021). The effect of the COVID-19 pandemic on the electricity consumption in Romania. Energies 14 (11), 3146. doi:10.3390/en14113146
IEA (2020). Global energy review 2020 – analysis. Paris, France: IEA. Available at: https://www.iea.org/reports/global-energy-review-2020.
Im, K.So, Hashem Pesaran, M., and Shin, Y. (2003). Testing for unit roots in heterogeneous panels. J. Econ. 115 (1), 53–74. doi:10.1016/S0304-4076(03)00092-7
IMF (2021). Policy responses to COVID19. IMF. Available at: https://www.imf.org/en/Topics/imf-and-covid19/Policy-Responses-to-COVID-19.
Isiksal, A. Z., and Assi, A. F. (2022). Determinants of sustainable energy demand in the European economic area: evidence from the PMG-ARDL model. Technol. Forecast. Soc. Change 183, 121901. doi:10.1016/j.techfore.2022.121901
Ivanová, E., and Jana, M. (2018). Performance evaluation of the Visegrad group countries. Econ. Research-Ekonomska Istraživanja 31 (1), 270–289. doi:10.1080/1331677X.2018.1429944
Jindrichovska, I., Ugurlu, E., and Thalassinos, E. I. (2020). Exploring the trend of Czech FDIs and their effect to institutional environment. Int. J. Econ. Bus. Adm. VIII (1), 94–108. doi:10.35808/ijeba/411
Jumbe, C. B. L. (2004). Cointegration and causality between electricity consumption and GDP: empirical evidence from Malawi. Energy Econ. 26 (1), 61–68. doi:10.1016/S0140-9883(03)00058-6
Kahouli, B. (2017). The short and long run causality relationship among economic growth, energy consumption and financial development: evidence from South mediterranean countries (SMCs). Energy Econ. 68, 19–30. October. doi:10.1016/j.eneco.2017.09.013
Kasperowicz, R., and Štreimikienė, D. (2016). Economic growth and energy consumption: a comparison of comparative analysis of V4 and “old” EU countries. J. Int. Stud. 9 (2), 181–194. doi:10.14254/2071-8330.2016/9-2/14
Kierzenkowski, R., Nigel Pain, E. R., and Sanne, Z. (2016). The economic consequences of brexit: a taxing decision. Paris: OECD. doi:10.1787/5jm0lsvdkf6k-en
Krkošková, R. (2021). Causality between energy consumption and economic growth in the V4 countries. Technol. Econ. Dev. Econ. 27 (4), 900–920. doi:10.3846/tede.2021.14863
Kumar Narayan, P., and Singh, B. (2007). The electricity consumption and GDP nexus for the Fiji Islands. Energy Econ. 29 (6), 1141–1150. doi:10.1016/j.eneco.2006.05.018
Lacko, R., Hajduová, Z., and Zawada, M. (2021). The efficiency of circular economies: a comparison of visegrád group countries. Energies 14 (6), 1680. doi:10.3390/en14061680
Levin, A., Lin, C.-Fu, and James Chu, C.-S. (2002). Unit root tests in panel data: asymptotic and finite-sample properties. J. Econ. 108 (1), 1–24. doi:10.1016/S0304-4076(01)00098-7
Lütkepohl, H., Saikkonen, P., and Trenkler, C. (2004). Testing for the cointegrating rank of a VAR process with level shift at unknown time. Econometrica 72 (2), 647–662. doi:10.1111/j.1468-0262.2004.00505.x
Maddala, G. S., and Wu., S. (1999). A comparative study of unit root tests with panel data and a new simple test. Oxf. Bull. Econ. Statistics 61, 631–652. S1. doi:10.1111/1468-0084.0610s1631
Magazzino, C. (2014). Electricity demand, GDP and employment: evidence from Italy. Front. Energy 8 (1), 31–40. doi:10.1007/s11708-014-0296-8
Magazzino, C., Mele, M., Morelli, G., and Schneider, N. (2021b). The nexus between information technology and environmental pollution: application of a new machine learning algorithm to OECD countries. Util. Policy 72, 101256. doi:10.1016/j.jup.2021.101256
Magazzino, C., Mele, M., and Schneider, N. (2020). The relationship between air pollution and COVID-19-related deaths: an application to three French cities. Appl. Energy 279, 115835. doi:10.1016/j.apenergy.2020.115835
Magazzino, C., Porrini, D., Fusco, G., and Schneider, N. (2021a). Investigating the link among ICT, electricity consumption, air pollution, and economic growth in EU countries. Energy Sources, Part B Econ. Plan. Policy 16 (11-12), 976–998. doi:10.1080/15567249.2020.1868622
Masih, A. M. M., and Masih., R. (1996). Energy consumption, real income and temporal causality: results from a multi-country study based on cointegration and error-correction modelling techniques. Energy Econ. 18 (3), 165–183. doi:10.1016/0140-9883(96)00009-6
Masih, A. M. M., and Masih, R. (1998). A multivariate cointegrated modelling approach in testing temporal causality between energy consumption, real income and prices with an application to two asian LDCs. Appl. Econ. 30 (10), 1287–1298. doi:10.1080/000368498324904
Monika, B. M. (2019). Great expectations or misplaced hopes? The role of the visegrád group in the brexit process. Europe-Asia Stud. 71 (8), 1261–1284. doi:10.1080/09668136.2019.1643825
Morimoto, R., and Hope, C. (2004). The impact of electricity supply on economic growth in Sri Lanka. Energy Econ. 26 (1), 77–85. doi:10.1016/S0140-9883(03)00034-3
Mozumder, P., and Marathe, A. (2007). Causality relationship between electricity consumption and GDP in Bangladesh. Energy Policy 35 (1), 395–402. doi:10.1016/j.enpol.2005.11.033
Narayan, P. K., Narayan, S., and Smyth, R. (2008). Are oil shocks permanent or temporary? Panel data evidence from crude oil and NGL production in 60 countries. Energy Econ. 30 (3), 919–936. doi:10.1016/j.eneco.2007.07.005
Nyeadi, J. D. (2023). The impact of financial development and foreign direct investment on environmental sustainability in Sub-Saharan Africa: using PMG-ARDL approach. Econ. Research-Ekonomska Istraživanja 36 (2), 2106270. doi:10.1080/1331677X.2022.2106270
Oh, W., and Lee, K. (2004). Causal relationship between energy consumption and GDP revisited: the case of korea 1970–1999. Energy Econ. 26 (1), 51–59. doi:10.1016/S0140-9883(03)00030-6
Pedroni, P. (1999). Critical values for cointegration tests in heterogeneous panels with multiple regressors. Oxf. Bull. Econ. Statistics 61, 653–670. S1. doi:10.1111/1468-0084.0610s1653
Pei, J., de Vries, G., and Zhang, M. (2021). International trade and covid-19: city-level evidence from China's lockdown policy. J. Regional Sci. 62, 670–695. doi:10.1111/jors.12559
Pesaran, M. H. (2004). General diagnostic tests for cross section dependence in panels. Camb. Work. Pap. Econ. 435, 1–41. doi:10.1007/s00181-020-01875-7
Pesaran, M. H. (2007). A simple panel unit root test in the presence of cross section dependence. J. Appl. Econ. 22, 265–312. doi:10.1002/jae.951
Pesaran, M. H., and Shin, Y. (1995). “An autoregressive distributed lag modelling approach to cointegration analysis,” in Cambridge working papers in economics. Cambridge working papers in economics (Faculty of Economics, University of Cambridge), 9514. Available at: https://ideas.repec.org/p/cam/camdae/9514.html.
Pesaran, M. H., Shin, Y., and Smith, R. J. (2001). Bounds testing approaches to the analysis of level relationships. J. Appl. Econ. 16 (3), 289–326. doi:10.1002/jae.616
Pesaran, M. H., Shin, Y., and Smith, R. P. (1999). Pooled mean group estimation of dynamic heterogeneous panels. J. Am. Stat. Assoc. 94 (446), 621–634. doi:10.1080/01621459.1999.10474156
Peter, P. (2004). Panel cointegration: asymptotic and finite sample properties of pooled time series tests with an application to the ppp hypothesis. Econ. Theory 20 (3), 597–625. doi:10.1017/S0266466604203073
Sadorsky, P. (2011). Trade and energy consumption in the Middle East. Energy Econ. 33 (5), 739–749. doi:10.1016/j.eneco.2010.12.012
Sadorsky, P. (2012). Energy consumption, output and trade in South America. Energy Econ. 34 (2), 476–488. doi:10.1016/j.eneco.2011.12.008
Santiago, I., Moreno-Munoz, A., Quintero-Jiménez, P., Garcia-Torres, F., and Gonzalez-Redondo, M. J. (2021). Electricity demand during pandemic times: the case of the COVID-19 in Spain. Energy Policy 148, 111964. January. doi:10.1016/j.enpol.2020.111964
Sarkodie, S. A., and Strezov, V. (2019). Effect of foreign direct investments, economic development and energy consumption on greenhouse gas emissions in developing countries. Sci. Total Environ. 646, 862–871. doi:10.1016/j.scitotenv.2018.07.365
Schmidt, A. (2017). From intermarium to the three Seas initiative–regional integrations in central and eastern europe and the Hungarian foreign policy. Politeja-Pismo Wydz. Stud. Międzynarodowych i Polit. Uniw. Jagiellońskiego 14 (51), 165–189. doi:10.12797/politeja.14.2017.51.09
Shiu, A., and Lam, P.-L. (2004). Electricity consumption and economic growth in China. Energy Policy 32 (1), 47–54. doi:10.1016/S0301-4215(02)00250-1
Soava, G., Mehedintu, A., Sterpu, M., and Grecu, E. (2021). The impact of the COVID-19 pandemic on electricity consumption and economic growth in Romania. Energies 14 (9), 2394. doi:10.3390/en14092394
Soytas, U., and Sari, R. (2003). Energy consumption and GDP: causality relationship in G-7 countries and emerging markets. Energy Econ. 25 (1), 33–37. doi:10.1016/S0140-9883(02)00009-9
Squalli, J. (2007). Electricity consumption and economic growth: bounds and causality analyses of OPEC members. Energy Econ. 29 (6), 1192–1205. doi:10.1016/j.eneco.2006.10.001
Su, W., Zhang, D., Zhang, C., Abrhám, J., Simionescu, M., Yaroshevich, N., et al. (2018). Determinants of foreign direct investment in the Visegrad group countries after the EU enlargement. Technol. Econ. Dev. Econ. 24 (5), 1955–1978. doi:10.3846/tede.2018.5487
Szlavik, J., and Tekla Sebestyen, S. 2007 "Delinking of energy consumption and economic growth in the visegrad group." Geogr. Tech. 12 (2): 139–149. doi:10.21163/GT_2017.122.12
Topcu, M., and Payne, J. E. (2018). Further evidence on the trade-energy consumption nexus in OECD countries. Energy Policy 117, 160–165. June. doi:10.1016/j.enpol.2018.03.007
Uğurlu, E. (2022). Impacts of renewable energy on CO2 emission: evidence from the Visegrad group countries. Polit. Central Eur. 18 (2), 295–315. doi:10.2478/pce-2022-0013
Uğurlu, E., and Jindřichovská, I. (2022). Effect of COVID-19 on international trade among the Visegrad countries. J. Risk Financial Manag. 15 (2), 41. doi:10.3390/jrfm15020041
Waisová, Š. (2018). The environmental situation in the Visegrad Region: neglect and insufficient cooperation in the face of serious environmental threats. Polit. Central Eur. 14 (2), 57–73. doi:10.2478/pce-2018-0009
Wang, Q., Li, S., and Jiang, F. (2021). Uncovering the impact of the COVID-19 pandemic on energy consumption: new insight from difference between pandemic-free scenario and actual electricity consumption in China. J. Clean. Prod. 313, 127897. September. doi:10.1016/j.jclepro.2021.127897
WEF (2020). These 3 charts show what COVID-19 has done to global energy demand. World Economic Forum. Available at: https://www.weforum.org/agenda/2020/08/covid19-change-energy-electricity-use-lockdowns-falling-demand/.
Wei, X., and Han, L. (2021). The impact of COVID-19 pandemic on transmission of monetary policy to financial markets. Int. Rev. Financial Analysis 74, 101705. March. doi:10.1016/j.irfa.2021.101705
Wolde-Rufael, Y. (2006). Electricity consumption and economic growth: a time series experience for 17 african countries. Energy Policy 34 (10), 1106–1114. doi:10.1016/j.enpol.2004.10.008
World Bank (2020). Global economic prospects, june 2020. Washington, DC: World Bank. doi:10.1596/978-1-4648-1553-9
Yoo, S.-H. (2006). The causal relationship between electricity consumption and economic growth in the ASEAN countries. Energy Policy 34 (18), 3573–3582. doi:10.1016/j.enpol.2005.07.011
Yu, E. S. H., and Choi., J.-Y. (1985). The causal relationship between energy and gnp: an international comparison. J. Energy Dev. 10 (2), 249–272.
Keywords: electricity consumption, COVID-19, Pandemic, foreign trade, panel ARDL
Citation: Uğurlu E and Jindřichovská I (2024) The relationship between electricity consumption, trade, and GDP and the effect of COVID-19: a panel ARDL approach on the Visegrad countries. Front. Energy Res. 11:1141847. doi: 10.3389/fenrg.2023.1141847
Received: 10 January 2023; Accepted: 22 December 2023;
Published: 11 January 2024.
Edited by:
Fulvio Fontini, University of Padua, ItalyReviewed by:
Jiri Neubauer, University of Defence, CzechiaGiuseppe Scandurra, Parthenope University of Naples, Italy
Copyright © 2024 Uğurlu and Jindřichovská. This is an open-access article distributed under the terms of the Creative Commons Attribution License (CC BY). The use, distribution or reproduction in other forums is permitted, provided the original author(s) and the copyright owner(s) are credited and that the original publication in this journal is cited, in accordance with accepted academic practice. No use, distribution or reproduction is permitted which does not comply with these terms.
*Correspondence: Irena Jindřichovská, jindrichovska@pef.czu.cz