Forest emissions reduction assessment from airborne LiDAR data using multiple machine learning approaches
 Shize Qin1
  Bo Yang
 Kaiwei Zhu
- 1Institute of Energy, Environment and Economy, Tsinghua University, Beijing, China
- 2China Forestry Group Corporation, Beijing, China
- 3Institute of Nuclear and New Energy Technology, Tsinghua University, Beijing, China
Objective: This study aims to evaluate the accuracy of different modeling methods and tree structural parameters extracted from airborne LiDAR for estimating carbon emissions reduction and assess their reliability as Certified Emission Reduction (CER) assessment techniques.
Methods: LiDAR data was collected from an afforestation project in Beijing, China. Various modeling methods, including statistical regression and machine learning algorithms, were used to estimate biomass and carbon emissions reduction. The models were evaluated under two schemes: tree-species-specific modeling scheme (Scheme 1) and all-sample modeling scheme (Scheme 2) using cross-validation and compared with ground-based estimations and pre-estimated emission reductions.
Results: Totally, the biomass estimation models in scheme 1 showed better accuracy than scheme 2. In scheme 1, The Random Forest (RF) and Cubist models achieved the highest prediction accuracy (R2 = 0.89, RMSE = 22.87 kg, CV RMSE = 52.00 kg), followed by GDBT and Cubist, with SVR and GAM performing the weakest. In scheme 2, Cubist model had the highest accuracy (R2 = 0.75, RMSE = 33.95 kg, CV RMSE = 36.05 kg), followed by RF and GBDT, with SVR and GAM performing the weakest. LiDAR-based estimates of carbon emissions reduction were closer to ground-based estimations and higher than pre-estimated values.
Conclusion: This study demonstrates that LiDAR-based models using tree structural parameters can accurately assess carbon emissions reduction. The models outperformed traditional methods in terms of cost and accuracy. Considering tree species in the modeling process improved the accuracy of the models. LiDAR technology has the potential to be a reliable assessment technique for carbon emissions reduction in forestry projects. The pre-trained models can be used for multiple predictions, reducing the cost of carbon sink surveys. Overall, LiDAR-based models provide a promising approach for assessing carbon emissions reduction and can contribute to mitigating climate change.
1 Introduction
Mitigating climate change relies on Carbon Dioxide Removal (CDR) (van Vuuren et al., 2013; Kriegler et al., 2018). To meet the climate objective of restricting global climate change to 1.5°C–2°C, as stated by the Intergovernmental Panel on Climate Change (IPCC), the assessments of most models depend on the large-scale deployment of CDR technologies, and the dependence on CDR technologies increases with the delay of the emission peak (Roe et al., 2019).
Afforestation, reforestation (A/R), and forest management are important CDR technologies, capturing atmospheric CO2 through forests and sequestering it in biomass. According to the mitigation measures based on the land sector provided by the Parties to the Paris Agreement in their Nationally Determined Contributions, A/R and forest management contribute about one-third of the emission reduction potential (Roe et al., 2019), thus playing a key role in mitigating climate change. As a nature-based solution, afforestation provides many ecological and environmental benefits beyond carbon capture and sequestration, and therefore has received widespread attention and has been carried out on a large scale.
A/R and forest management, as a CDR technology, have the primary risk associated with the accuracy and robustness of forest emissions reduction assessment techniques. Using the Clean Development Mechanism (CDM) outlined in the Kyoto Protocol as an illustration, afforestation/reforestation projects necessitate the certification of emission reduction (CER) credit quotas throughout their implementation. A key step is to verify the emission reductions by combining the carbon sequestration before and after the project implementation. However, erroneous estimates of emission reductions may cause the suspension of CERs and mislead the evaluation of afforestation emission reduction projects for mitigating the impacts of climate change. Currently, the traditional carbon emission reduction assessment method is to carry out field measurements on typical plots of forests at the single-tree scale, and to model and evaluate the overall emission reductions according to the emission reductions of the plots with the same characteristics. However, the traditional method relies on labor-intensive single-tree measurements, which require a huge amount of time and labor costs, and its accuracy depends on the representativeness and quantity of the plot selection. This may lead to erroneous estimates of carbon emissions reduction, thereby causing the failure of CDR technologies.
The increasing prevalence of Light Detection and Ranging (LiDAR) has facilitated the accurate assessment of forest carbon sinks in recent years. LiDAR sensors can penetrate the forest canopy within a low-altitude range to extract high-density point clouds, capturing the morphology of large forest areas and the structural characteristics representing individual tree structures in a short period. These structural features are related to the biomass of trees. Establishing a model linking tree structural parameters and biomass makes evaluating the biomass and carbon sequestration of individual tree-scale plots feasible. Therefore, it is very suitable for assessing the carbon emissions reduction of large-scale afforestation. A considerable amount of research uses airborne LiDAR to extract and derive parameters to assess tree biomass and carbon storage. For example, Gleason and Im (2012) used crown parameters and various machine learning methods to predict the above-ground biomass of forests. Li et al. (2014) used regression statistics and machine learning modeling methods to estimate the relationship between the crown parameters extracted by airborne LiDAR and forest biomass. Lin et al. (2016) used multiple linear regression to establish the relationship between the tree crown and related competitive index exported by airborne LiDAR and the above-ground carbon storage of forests. Nie et al. (2017) employed a nonlinear correlation to establish the connection between visual indicators, tree structure parameters derived from airborne LiDAR, and the above-ground biomass of forests. However, to our knowledge, no study has yet comprehensively compared the usability of various models in assessing forest carbon emissions reduction.
In this study, we evaluated the accuracy of estimating carbon emissions reduction using tree structural parameters extracted from airborne LiDAR point clouds with five modeling methods. We compared the accuracy of these methods as Carbon Emission Reduction (CER) assessment methods. The modeling methods include Generalized Additive Models, the Cubist method, Random Forest (RF) algorithm, Gradient Boosted Regression Trees (GBRT), and Support Vector Regression (SVR). Two modeling schemes (tree-species-specific modeling scheme and the all-sample modeling scheme) were established to explore the effect of tree species-specific modeling in forest biomass and carbon emissions reduction estimation. Our results indicate that all carbon emission reduction models established by the tree structural parameters captured by airborne LiDAR have significant advantages in carbon emission reduction assessments compared to traditional methods.
2 Methods
2.1 Study area
The data for this study was obtained from an afforestation project in Beijing, China, developed in accordance with China Certified Emission Reduction (CCER) standards (https://www.ccer.com.cn/). The relevant specific information has been elaborated on in previous studies. (Qin et al., 2022).In brief, the project’s geographical coordinates are 39°37′-39°40′N and 115°54′-115°58′E, encompassing a total area of 311.35 ha (Figure 1). Table 1 provides information on the prominent tree species within the project area, along with the 60-year crediting emission reductions achieved by the project.
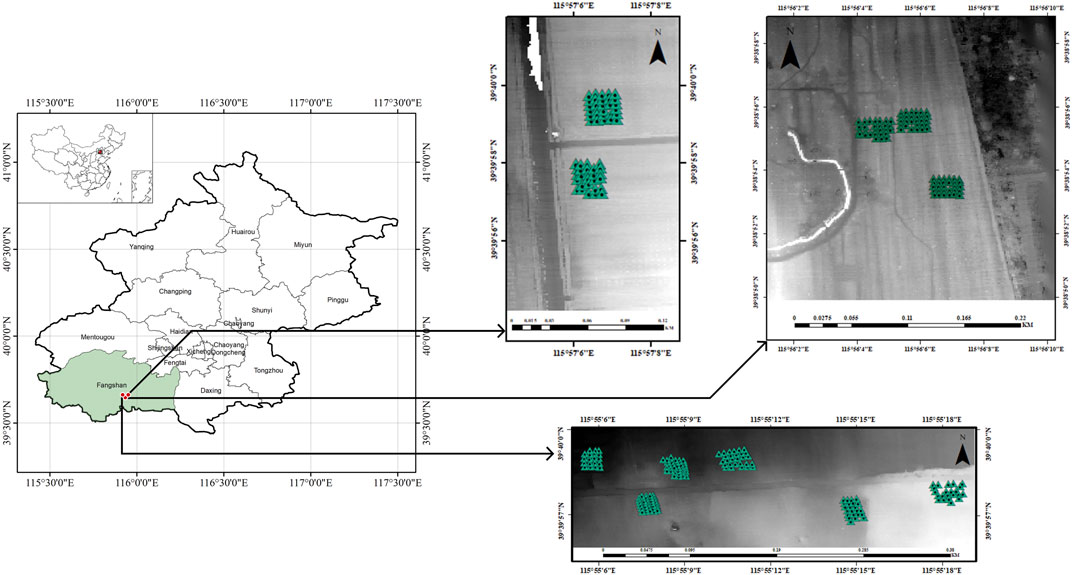
FIGURE 1. Location of the study area.

TABLE 1. Summary of the project.
2.2 LiDAR data
2.2.1 LiDAR data collection and processing
Airborne LiDAR data was collected using an unmanned aerial vehicle (UAV) equipped with a RIEGL VUX-1LR LiDAR system. LiDAR data was acquired using this device, the parameters for the equipment to carry out operations, including pulse rate, beam divergence, altitude, flying speed, average point density, ranging accuracy, point cloud horizontal accuracy, and point cloud vertical accuracy, are all detailed in Table 2.
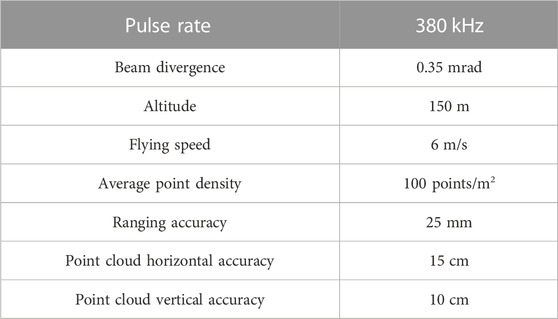
TABLE 2. Characteristics of the LiDAR data collection.
The processing of Airborne LiDAR data involved four primary stages. Initially, we cleaned the raw LiDAR data to eliminate noise using a technique based on the elevation frequency histogram. The processed point clouds were classified into the ground and non-ground points using the adaptive triangulation network filter algorithm. Following was the generation of a digital terrain model (DTM) and a digital surface model (DSM) using ground and canopy points with a 1 m grid size. To eliminate the influence of topography, the elevation was subtracted from the DTM, resulting in a canopy height model (CHM) and normalized point clouds.
2.2.2 Individual tree segmentation and LiDAR metrics extraction
This research detected individual trees from normalized point clouds using normalized cut (Ncut) segmentation (Shi and Malik, 2000; Reitberger et al., 2009). The process consisted of three key steps: firstly, identifying local maxima in the Canopy Height Model (CHM) to gain prior knowledge of tree positions; secondly, employing Ncut segmentation for initial canopy segmentation; and finally, the local maximum was replaced with the global maximum, incorporating canopy shape and a minimum number of canopy points as constraint conditions. By implementing the Ncut segmentation method, the leakage rate of individual tree detection was minimized, ensuring precise identification. These outcomes determined the count of individual trees within the airborne LiDAR data coverage area. The study area’s straightforward plantation led to an exceptionally high segmentation accuracy of 98.6%. (Qin et al., 2022).
After obtaining the point cloud data of each tree by individual tree segmentation, normalized point clouds of each tree were utilized to calculate LiDAR feature parameters, serving as proxies for forest biomass, as presented in Table 3. These were: 1) height-related parameters, including 10th–99th percentiles of height, tree height (maximum height), mean height, standard deviation of height, and coefficient of variation of height; 2) the number of the points.
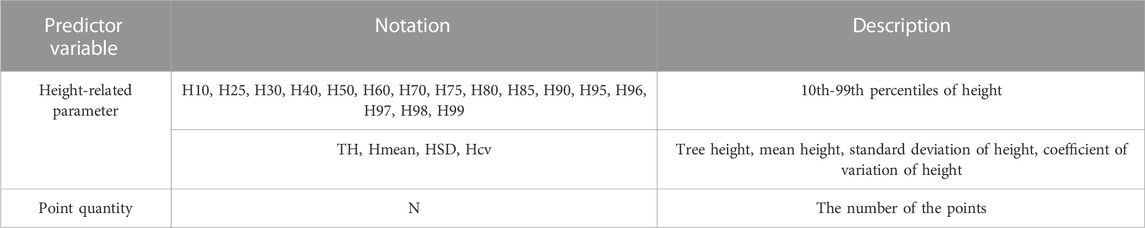
TABLE 3. LiDAR feature parameters.
2.3 Field data collection and processing
Eleven randomly selected plots encompassing the primary tree species listed in Table 1 were subjected to field measurements. Each plot ranged in size from 0.02 to 0.04 ha and contained between 20 and 40 trees. A cumulative area of 0.3 ha, including 303 trees, was chosen to establish species-specific biomass estimation models. Furthermore, the tree height (TH) and diameter at breast height (DBH) were manually measured individually.
2.4 Ground-based biomass estimation
The above-ground biomass was calculated by substituting the measured TH and DBH into the species-specific allometry equation from the project design document (PDD) (Supplementary Table S1). The study employed the default root-shoot ratio (Supplementary Table S1) to convert above-ground biomass to below-ground biomass, enabling the determination of total tree biomass for all plots.
2.5 LiDAR-based biomass estimation
To validate the effectiveness of separate modeling of differentiated tree species in biomass estimation, we designed the following two schemes: The tree-species-specific modeling scheme (Scheme 1) and the all-sample modeling scheme (Scheme 2). In Scheme 1, LiDAR-based biomass estimation models were built at the tree species level. These models were established from the LiDAR point cloud metrics and corresponding individual tree biomass for each tree species. In Scheme 2, LiDAR-based biomass estimation models were built for all 303 tree samples without tree species differentiation. Several regression models were used for each of the two schemes.
2.5.1 Regression model
Regression models include one statistical regression method, a generalized additive model, and four machine learning models, including Random Forest, Cubist, SVR, and Gradient Boosting.
(1) The Generalized Additive Model (GAM) is a flexible statistical modeling technique widely used in forestry data measurement. It extends the Generalized Linear Model by allowing nonlinear relationships between the response and predictor variables, making it ideal for complex forestry data (Wood, 2017). GAMs have been used to accurately predict forest attributes, such as tree height, diameter, and biomass (Maltamo et al., 2012). They can also easily handle large datasets, making them a preferred choice for forest inventory estimation (Hastie and Tibshirani, 1990). Furthermore, due to their flexibility, GAMs can be used for other forestry-related tasks, such as disease detection and species classification (Leathwick et al., 2006).
In our study, GAM was adopted, but considering the strong collinearity of our radar characteristic parameters, we first calculated VIF and eliminated the variables with VIF greater than 5.
(2) Random Forest: Random Forest is a powerful machine learning algorithm extensively used in forestry data measurement. It operates by constructing a multitude of decision trees during training and outputting the class, that is, the mode of the classes or mean prediction of the individual trees (Cutler et al., 2007). Random Forest has been successfully used to predict various forestry attributes, such as tree height, diameter, and biomass, with high accuracy (Prasad et al., 2006). Its ability to handle high-dimensional data and its robustness to outliers is instrumental in forest inventory estimation (Liaw and Wiener, 2002). The algorithm’s inherent feature importance estimation capability is valuable for identifying significant predictors in forestry studies.
(3) Cubist: Cubist is a rule-based machine learning algorithm for constructing predictive models, particularly effective in forestry data measurement. It excels in handling large datasets, making it ideal for predicting forest attributes such as tree height, volume, and biomass. Cubist’s ability to handle nonlinear relationships and interactions between variables enhances its accuracy in predicting forest variables (Palmer et al., 2011). Its robustness and flexibility make it a preferred choice for forest inventory estimation, as it can accommodate different data types and provide interpretable results (Stojanova et al., 2010).
(4) SVR: Support Vector Regression (SVR) is a powerful machine learning algorithm for predicting forest measurements in forestry data. It is based on Support Vector Machines (SVM) principles but adapted for regression problems. SVR is beneficial in handling high-dimensional and nonlinear data, making it ideal for complex forestry datasets. It has been successfully used in various forestry applications, such as predicting tree height, diameter, and biomass. The effectiveness of SVR can be optimized by choosing the appropriate kernel function and tuning its parameters. Vapnik (1999) proposed the original SVR algorithm, and subsequent research has demonstrated its application in forestry (Maltamo et al., 2005; Hudak et al., 2012; Zhang and Kovacs, 2012).
Consistent with the GAM model, the collinearity of SVR also needs to be considered, and the input parameters are selected according to the criterion that VIF is greater than 5.
(5) Gradient Boosting: Gradient Boosting (GDBT) is an advanced machine learning algorithm effectively applied in forestry data measurement. It employs an ensemble of weak prediction models, typically decision trees, to improve the accuracy of predictions on forest attributes such as tree height, diameter, and biomass (Moisen et al., 2006). The algorithm’s strength is minimizing bias and variance, providing more accurate and reliable predictions (Hastie et al., 2009). Due to its flexibility and adaptability, Gradient Boosting has been used in various forestry applications, including forest inventory estimation, disease detection, and species classification (Cutler et al., 2007).
(6) All of the above models were developed in Python sklearn module. Among them, Random Forest, GDBT, and SVR algorithms were implemented in sklearn using RandomForest module, GradientBoostingRegressor module and SVR module, GAM was implemented in pyGAM library using LinearGAM module, Cubist was implemented in cubist library using the Cubist module. In GAM and machine learning algorithms, the hyperparameters of the model have a direct impact on the prediction results. Therefore, an optimal set of hyperparameters should be tuned for each algorithm to obtain the best model performance. In this study, we employed a grid search technique to perform hyperparameter tuning automatically. The hyperparameter tuning process was performed using the Grid Search CV module in sklearn. The hyperparameter types, parameter grids and optimal parameters set for each model are shown in Supplementary Table S4.
2.5.2 Model assessment
This study did the cross-validation in all of the models. Cross-validation, a widely recognized statistical technique, is crucial in assessing and comparing the performance of differentalgorithms. It ensures that each observation can be used for validation (Refaeilzadeh et al., 2009). In data mining and machine learning, empirical and theoretical evidence supports the suitability of k-fold cross-validation for model evaluation and selection due to its ability to provide an almost unbiased estimate while eliminating the need for manual intervention.
Our study employed 4-fold cross-validation for model training and validation, adhering to its established efficacy and credibility. To compare the performance of different models, we compare the average root mean square error (RMSE), Relative Root Mean Squared Error (rRMSE) and R-square (R2).
2.6 Assessment of project emissions reduction
To validate the emissions reduction accuracy stated in the PDD, this study calculated the biomass carbon stock of the sample species within the project boundary. This involved summing the single-tree biomass obtained using the aforementioned methods and comparing the results with the values reported in the PDD. The total carbon stock (c) (kg) of the sample species, which can approximate the cumulative emissions reduction since project implementation, was derived from the total biomass (b) (kg) using the default carbon fraction (cf = 0.5) provided by the IPCC. The relevant calculation methods are in the Supplement Material.
3 Results
3.1 Biomass estimation results under different schemes
The results of the model performance under the two schemes, as well as scatter plots of the predicted and measured values of the models, are illustrated in Figure 2. As shown in Figure 2, Scheme 1 represents the model trained at the tree species level to estimate single-tree biomass, with its evaluation accuracy designated as the assessment accuracy for the total population of single trees. Based on the R2, RMSE and CV RMSE of the model cross-validation results, the RF model achieved the highest prediction accuracy (R2 = 0.89, RMSE = 22.87 kg, CV RMSE = 52.00 kg), followed by GDBT (R2 = 0.85, RMSE = 26.58 kg, CV RMSE = 49.60 kg) and Cubist (R2 = 0.85, RMSE = 26.11 kg, CV RMSE = 56.51 kg), with SVR (R2 = 0.73, RMSE = 35.08 kg, CV RMSE = 53.94 kg) and GAM (R2 = 0.76, RMSE = 33.42 kg, CV RMSE = 66.91 kg) performing the weakest.
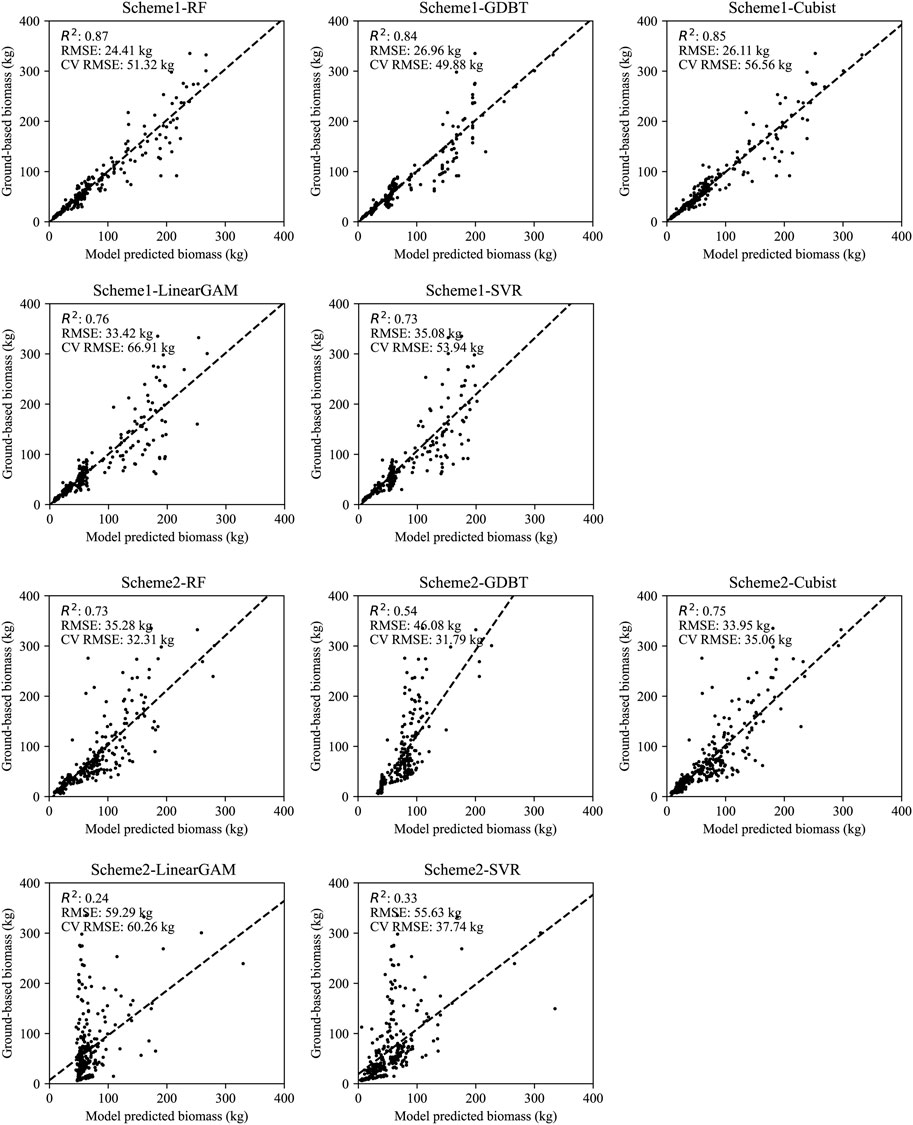
FIGURE 2. The predictive values and observed values of Scheme 1 and Scheme 2, where RMSE and CV RMSE, respectively represent the overall predictive accuracy of the model and the predictive accuracy of cross-validation.
Compared to Scheme1, Scheme2, which disregards the differences in tree species for model training, overall performs weaker than the tree species-specific models. Among them, the Cubist model performed the best (R2 = 0.75, RMSE = 33.95 kg, CV RMSE = 36.05 kg), followed by RF (R2 = 0.72, RMSE = 35.90 kg, CV RMSE = 32.37 kg) and GBDT (R2 = 0.54, RMSE = 46.06 kg, CV RMSE = 33.55 kg), with SVR (R2 = 0.33, RMSE = 55.63 kg, CV RMSE = 37.74 kg) and GAM (R2 = 0.24, RMSE = 59.29 kg, CV RMSE = 60.26 kg) once again performing the weakest.
Further comparison of the rRMSE of the model cross-validation results (Table 4) showed that there were significant differences in the predictive accuracy between tree species in scheme 1. Apart from the GAM models, K. paniculata achieved the highest predictive accuracy among all tree species with the lowest rRMSE (10.2% in RF, 10.3% in GDBT, 9.6% in Cubist and 12.1% in SVR), while A. davidiana had the lowest prediction accuracy with the highest rRMSE (79.6% in RF, 81.1% in GDBT, 86.7% in Cubist and 87.5% in SVR). The rRMSE of most tree species predicted by GAM was close to 100%, indicating that this model has a significant error for this study’s data set and method. However, this model did not perform the worst among all tree species. Its predictive ability for R. pseudoacacia was higher than SVR. The rRMSE in Scheme 2 was consistent with the model capability in Scheme 1, but the rRMSE of GDBT was the lowest (72.0%), better than RF (75.5%), and the worst performance was still GAM (97.1%).
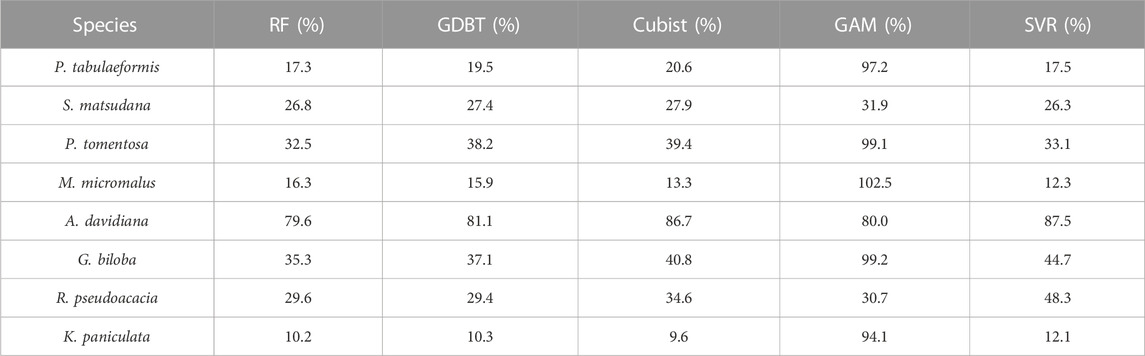
TABLE 4. rRMSE of the prediction of single-tree biomass for each tree species in the cross-validation of all models in Scheme 1.
3.2 Variable importance analysis of the biomass estimation models
The variable importance of the optimal model was analysed using the permutation_importance module in the sklearn package. Permutation_importance is a method that uses a value domain of 0-1 dimensionless values to indicate the importance of each variable for the prediction results. In this study, based on the importance values of all variables in the prediction models, the variables with feature importance greater than 0.1 in the prediction process were selected as important variables. The important variables of the optimal model of Scheme1 and Scheme2 model under each algorithm are shown in Table 5.
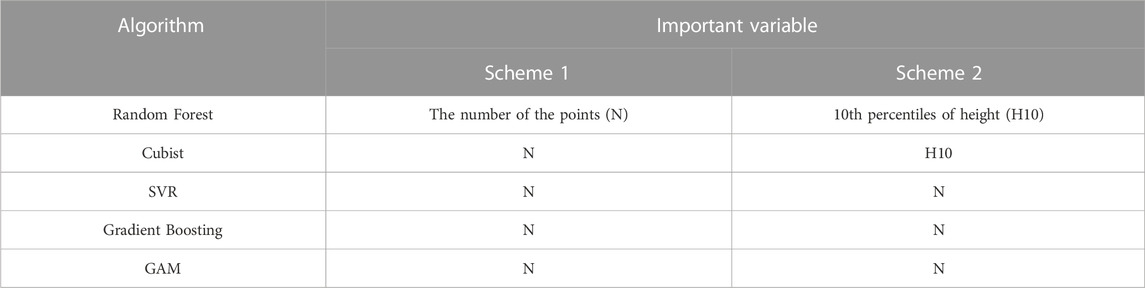
TABLE 5. Variable importance of the biomass estimation models in Scheme 1 and Scheme 2.
As shown in Table 5, the number of points (N) was the most important variable in all of the biomass estimation models for Scheme 1. In Scheme 2, the 10th percentile of height (H10) was the most important variable in RF and GBDT, while N was the most important in Cubist, SVR and GAM. The results of variable importance analyses indicated that the number of points had the most significant effect on biomass estimation, followed by the 10th relative percentile of height.
3.3 Comparison of carbon emission reduction estimation results among Scheme 1, Scheme 2, ground-based estimation, and PDD estimation
In order to be consistent with the categorization of carbon emissions reduction estimated by PDD, the eight tree species evaluated in this study were divided into six categories. Among them, M. micro malus and A. davidiana were classified as other tree species. At the same time, K. paniculata and R. pseudoacacia were merged into one category as R. pseudoacacia because they belong to the same category.
As shown in Figure 3, in Scheme 1, aside from the GAM and SVR, all other methods showed high consistency with the results of ground-based estimation across all categories. The performance of the methods in Scheme 2 varied among different tree species, with no scheme maintaining accuracy across all categories. The most unstable among them was GAM, which had significant deviations in all categories except for P. tomentosa. In the overall evaluation of carbon emissions, RF, GDBT, and Cubist performed the best. The carbon emissions they estimated were highly consistent with ground-based estimation results in both Scheme 1 and Scheme 2. However, the results of GAM and SVR differed from the ground-based estimation results in both schemes. Nevertheless, all LiDAR-based estimates of emission reductions were closer to ground-based estimations (Supplementary Table S2), and higher than those estimated by PDD (Supplementary Table S3).
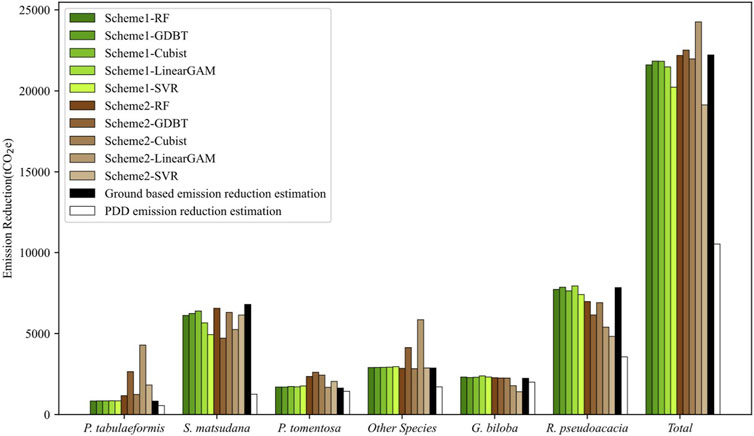
FIGURE 3. Carbon emission estimation result comparison among Scheme 1, Scheme 2, ground-based estimation result, and PDD estimation result.
4 Discussion
For the selected CCER projects, both Scheme 1, targeted at specific tree species, and Scheme 2, based on all samples, were more accurate than the estimated emission reduction results, and LiDAR technology provides a faster sampling method. Therefore, using LiDAR technology to evaluate CER projects is feasible as an alternative assessment method for implementing afforestation and reforestation carbon sink emission reduction projects. The predictions of carbon emission reduction by Scheme 1 and Scheme 2 were both better than the method adopted by PDD (Project Design Document). Among all models, RF (Random Forest) and Cubist performed superiorly in both Scheme 1 and Scheme 2, which is consistent with other research results (Feng et al., 2017; Li et al., 2018), followed by GBDT (Gradient Boosting Decision Tree) and SVR (Support Vector Regression). We do not recommend using GAM for biomass assessment. Although it performs better in the project than the original plan, it significantly differs from ground-based estimates (Figure 2).
The requirement of single tree biomass prediction for biomass prediction based on LiDAR data is less than the prediction at the single tree scale in the prediction scale of carbon emission reduction accounting. Among them, the best-performing RF model had an rRMSE of up to 79.6% in the prediction results of the A. davidiana tree species. However, in assessing carbon emission reduction, the estimation results of this tree species were very close to ground-based estimation results. The reason may be that when assessing carbon emission reduction, the results of all plots will be traced back to the carbon layer scale. Therefore, it can be regarded as a plot-level calculation, which may offset the error of single trees in the plot. For specific tree species, ignoring the plot surveys and model training of the tree species can also meet the needs of carbon emission reduction assessment, which will undoubtedly reduce the cost of large-scale deployment of afforestation and reforestation carbon emission reduction projects, thereby enhancing the operability of CER projects.
For carbon emission reduction assessment technology, the reliability and transferability of the model are of great importance. In Scheme 1 and Scheme 2, the RF models generated based on the training set have the coefficients of variation of RMSE in S. matsudana, P. tomentosa, and R. pseudoacacia of 15.6%, 25.8%, and 25.4%, respectively. Considering the small sample size of the training set, this demonstrates the model’s high robustness. Therefore, the performance of the RF model has a good performance in the dimension of transferability, which is consistent with the conclusions of previous studies (Gleason and Im, 2012; Tompalski et al., 2019). However, the robustness of the model varies greatly between different tree species, even within the same model. Among them, P. tomentosa showed higher robustness in all tree species except SVR, with the coefficient of variation of RMSE in cross-validation between 7.7%–25.8%. At the same time, G. biloba and A. davidiana had coefficients of variation of RMSE over 100% in RF, Cubist, and SVR (Table 6). However, the prediction accuracy of G. biloba was not the worst compared to other tree species (Table 4).
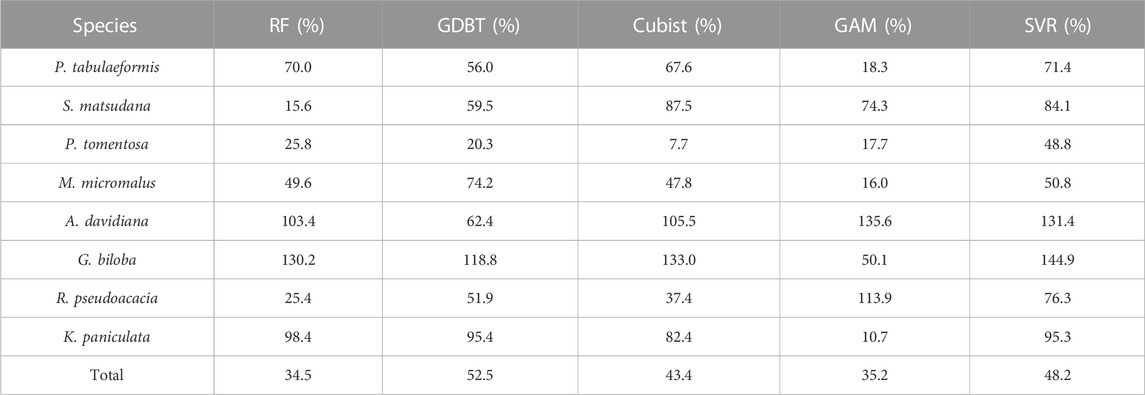
TABLE 6. Variance of the root mean square error (RMSE) in cross-validation for Scheme 1 and Scheme 2.
Previous studies have also used LiDAR technology and allometric growth equation to estimate forest biomass. These studies used some machine learning algorithms and built relatively robust models. Torre-Tojal et al. (2022) used a random forest (RF) estimation technique to estimate forest biomass (Pinus radiata). The models were applied in a municipality with more than 5,000 ha of the species under study, and the biomass predictions were compared to those predicted by the Basque Government. Furthermore, they also used cross-validation to train and test the RF models (R2 > 0.7). Li et al. (2014) used airborne LiDAR data in Huntington Wildlife Forest, located in Adirondack Park. They employed seven modeling methods to estimate biomass and carbon stock. Boosted regression trees performed the best in model calibration, while support vector regression and ordinary least squares performed slightly better in model validation. Gleason and Im (2012) also discussed the estimation of forest biomass using machine learning approaches and airborne LiDAR data. They focused on evaluating different models for estimating biomass at both individual tree and plot levels. Although there are many similar studies, our study innovatively compares multiple models based on whether tree species are distinguished and finds that tree species-specific modeling can greatly improve model accuracy. In the previous study, we used the ordinary least square method for fitting, and combined with the findings of this study, distinguishing tree species can indeed greatly improve the fitting accuracy (Qin et al., 2022). A possible reason for this result is that tree species-specific modeling can reduce the error and uncertainty of forest biomass estimation due to heterogeneity in forest structure, thus improving the prediction accuracy.
Another highlight of this study is that we not only assessed biomass but also calculated carbon emissions reduction. Consistent with previous studies, we used multiple regression models and found that the emissions reduction estimated using LiDAR for the chosen project was twice as high as the initial anticipation by the project developers prior to implementation (Qin et al., 2022). More noteworthy, Scheme 2 adopted in this study does not distinguish tree species, but the results of carbon sink estimation are still similar to those of Scheme 1 for tree species differentiation. This is of great practical significance for promoting the use of airborne LiDAR in Forestry Carbon Sequestration Projects, as the airborne LiDAR alone has been ineffective in identifying tree species (Sasaki et al., 2012; Guimarães et al., 2020). These models exhibit satisfactory precision in sample plots with species-specific field investigations, and they also have more real advantages over previous methods in sample plots without species-specific investigations. Furthermore, the machine learning models established based on sample plots are reusable and can be well understood and adopted by forestry professionals for carbon sink measurements. Using these pre-trained models for multiple predictions significantly reduces the per-instance cost of forestry carbon sink surveys.
Our study still has some limitations. On the one hand, the samples we used for machine learning modeling are not large enough, which is also the reason why our CV RMSE is relatively large. On the other hand, the collinearity of the covariables of the GAM model is strong, so the characteristic parameters may be insufficient, which may also be the reason for the poor performance of GAM.
5 Conclusion
Our results show that all carbon emission reduction models established by tree structural parameters acquired by airborne LiDAR have significant advantages compared to traditional carbon emission reduction assessment methods. Among them, the carbon emission reduction assessment model established by the Species-specified scheme combined with RF performed the best and most robust assessment method. Based on these results, we believe that the emission reduction assessment models established by airborne LiDAR can serve as an alternative to traditional methods, both in terms of cost and accuracy.
Data availability statement
The raw data supporting the conclusion of this article will be made available by the authors, without undue reservation.
Author contributions
SQ and KZ formulated the idea. SQ completed the writing of the paper. YC and BY collected and processed data. KZ supervised and completed the revision of the paper. All authors contributed to the article and approved the submitted version.
Funding
The author(s) declare financial support was received for the research, authorship, and/or publication of this article. This work was funded by the Project of Industry-University-Research cooperation between Tsinghua University and China Forestry Group Corporation on Forestry carbon sink development.
Conflict of interest
YC and BY are employed by the company China Forestry Group Corporation.
The authors declare that this study received funding from China Forestry Group Corporation. The funder had the following involvement in the study: provided basic data and participated in the coordination of data collection.
The remaining authors declare that the research was conducted in the absence of any commercial or financial relationships that could be construed as a potential conflict of interest.
Publisher’s note
All claims expressed in this article are solely those of the authors and do not necessarily represent those of their affiliated organizations, or those of the publisher, the editors and the reviewers. Any product that may be evaluated in this article, or claim that may be made by its manufacturer, is not guaranteed or endorsed by the publisher.
Supplementary material
The Supplementary Material for this article can be found online at: https://www.frontiersin.org/articles/10.3389/fenrg.2023.1252882/full#supplementary-material
References
Cutler, D. R., Edwards, T. C., Beard, K. H., Cutler, A., Hess, K. T., Gibson, J., et al. (2007). Random forests for classification in ecology. Ecology 88 (11), 2783–2792. doi:10.1890/07-0539.1
Feng, Y. F., Lu, D. S., Chen, Q., Keller, M., Moran, E., Nara dos-Santos, M., et al. (2017). Examining effective use of data sources and modeling algorithms for improving biomass estimation in a moist tropical forest of the Brazilian Amazon. Int. J. Digital Earth 10 (10), 996–1016. doi:10.1080/17538947.2017.1301581
Gleason, C. J., and Im, J. (2012). Forest biomass estimation from airborne LiDAR data using machine learning approaches. Remote Sens. Environ. 125, 80–91. doi:10.1016/j.rse.2012.07.006
Guimarães, N., Pádua, L., Marques, P., Silva, N., Peres, E., and Sousa, J. J. (2020). Forestry remote sensing from unmanned aerial vehicles: A review focusing on the data, processing and potentialities. Remote Sens. 12 (6), 1046. doi:10.3390/rs12061046
Hastie, T. J., and Tibshirani, R. J. (1990). Generalized additive models. Boca Raton, FL, USA: Chapman & Hall/CRC.
Hastie, T., Tibshirani, R., Friedman, J. H., and Friedman, J. H. (2009). The elements of statistical learning: Data mining, inference, and prediction. New York: Springer.
Hudak, A. T., Strand, E. K., Vierling, L. A., Byrne, J. C., Eitel, J. U., Martinuzzi, S., et al. (2012). Quantifying above-ground forest carbon pools and fluxes from repeat LiDAR surveys. Remote Sens. Environ. 123, 25–40. doi:10.1016/j.rse.2012.02.023
Kriegler, E., Luderer, G., Bauer, N., Baumstark, L., Fujimori, S., Popp, A., et al. (2018). Pathways limiting warming to 1.5° C: A tale of turning around in no time? Philosophical Trans. R. Soc. A Math. Phys. Eng. Sci. 376 (2119), 20160457. doi:10.1098/rsta.2016.0457
Leathwick, J. R., Elith, J., Francis, M. P., Hastie, T., and Taylor, P. (2006). Variation in demersal fish species richness in the oceans surrounding New Zealand: an analysis using boosted regression trees. Mar. Ecol. Prog. Ser. 321, 267–281. doi:10.3354/meps321267
Li, D., Gu, X., Pang, Y., Chen, B., and Liu, L. (2018). Estimation of forest aboveground biomass and leaf area index based on digital aerial photograph data in northeast China. Forests 9 (5), 275. doi:10.3390/f9050275
Li, M., Im, J., Quackenbush, L. J., and Liu, T. (2014). Forest biomass and carbon stock quantification using airborne LiDAR data: A case study over Huntington Wildlife forest in the Adirondack park. IEEE J. Sel. Top. Appl. Earth Observations Remote Sens. 7 (7), 3143–3156. doi:10.1109/jstars.2014.2304642
Liaw, A., and Wiener, M. (2002). Classification and regression by random Forest. R. news 2 (3), 18–22. https://journal.r-project.org/articles/RN-2002-022/.
Lin, C., Thomson, G., and Popescu, S. C. (2016). An IPCC-compliant technique for forest carbon stock assessment using airborne LiDAR-derived tree metrics and competition index. Remote Sens. 8 (6), 528. doi:10.3390/rs8060528
Maltamo, M., Mehtätalo, L., Vauhkonen, J., and Packalén, P. (2012). Predicting and calibrating tree attributes by means of airborne laser scanning and field measurements. Can. J. For. Res. 42 (11), 1896–1907. doi:10.1139/x2012-134
Maltamo, M., Packalén, P., Yu, X., Eerikäinen, K., Hyyppä, J., and Pitkänen, J. (2005). Identifying and quantifying structural characteristics of heterogeneous boreal forests using laser scanner data. For. Ecol. Manag. 216 (1-3), 41–50. doi:10.1016/j.foreco.2005.05.034
Moisen, G. G., Freeman, E. A., Blackard, J. A., Frescino, T. S., Zimmermann, N. E., and Edwards, T. C. (2006). Predicting tree species presence and basal area in Utah: A comparison of stochastic gradient boosting, generalized additive models, and tree-based methods. Ecol. Model. 199 (2), 176–187. doi:10.1016/j.ecolmodel.2006.05.021
Nie, S., Wang, C., Zeng, H., Xi, X., and Li, G. (2017). Above-ground biomass estimation using airborne discrete-return and full-waveform LiDAR data in a coniferous forest. Ecol. Indic. 78, 221–228. doi:10.1016/j.ecolind.2017.02.045
Palmer, A., Jiménez, R., and Gervilla, E. (2011). “Data mining: machine learning and statistical techniques,” in Knowledge-oriented applications in data mining (BoD–Books on Demand), 373–396.
Prasad, A. M., Iverson, L. R., and Liaw, A. (2006). Newer classification and regression tree techniques: bagging and random forests for ecological prediction. Ecosystems 9 (2), 181–199. doi:10.1007/s10021-005-0054-1
Qin, S., Nie, S., Guan, Y., Zhang, D., Wang, C., and Zhang, X. (2022). Forest emissions reduction assessment using airborne LiDAR for biomass estimation. Resour. Conservation Recycl. 181, 106224. doi:10.1016/j.resconrec.2022.106224
Refaeilzadeh, P., Tang, L., and Liu, H. (2009). “Cross-validation,” in Encyclopedia of database systems. Editors L. Liu, and M. T. Özsu (New York, NY, USA: Springer), 532–538.
Reitberger, J., Schnörr, C., Krzystek, P., and Stilla, U. (2009). 3D segmentation of single trees exploiting full waveform LIDAR data. ISPRS J. Photogrammetry Remote Sens. 64 (6), 561–574. doi:10.1016/j.isprsjprs.2009.04.002
Roe, S., Streck, C., Obersteiner, M., Frank, S., Griscom, B., Drouet, L., et al. (2019). Contribution of the land sector to a 1.5 C world. Nat. Clim. Change 9 (11), 817–828. doi:10.1038/s41558-019-0591-9
Sasaki, T., Imanishi, J., Ioki, K., Morimoto, Y., and Kitada, K. (2012). Object-based classification of land cover and tree species by integrating airborne LiDAR and high spatial resolution imagery data. Landsc. Ecol. Eng. 8, 157–171. doi:10.1007/s11355-011-0158-z
Shi, J., and Malik, J. (2000). Normalized cuts and image segmentation. IEEE Trans. pattern analysis Mach. Intell. 22 (8), 888–905. doi:10.1109/34.868688
Stojanova, D., Panov, P., Gjorgjioski, V., Kobler, A., and Džeroski, S. (2010). Estimating vegetation height and canopy cover from remotely sensed data with machine learning. Ecol. Inf. 5 (5), 256–266. doi:10.1016/j.ecoinf.2010.03.004
Tompalski, P., White, J. C., Coops, N. C., and Wulder, M. A. (2019). Demonstrating the transferability of forest inventory attribute models derived using airborne laser scanning data. Remote Sens. Environ. 227, 110–124. doi:10.1016/j.rse.2019.04.006
Torre-Tojal, L., Bastarrika, A., Boyano, A., Lopez-Guede, J. M., and Grana, M. (2022). Above-ground biomass estimation from LiDAR data using random forest algorithms. J. Comput. Sci. 58, 101517. doi:10.1016/j.jocs.2021.101517
van Vuuren, D. P., Deetman, S., van Vliet, J., van den Berg, M., van Ruijven, B. J., and Koelbl, B. (2013). The role of negative CO2 emissions for reaching 2 °C—Insights from integrated assessment modelling. Clim. Change 118, 15–27. doi:10.1007/s10584-012-0680-5
Vapnik, V. (1999). The nature of statistical learning theory. Berlin, Germany: Springer science & business media.
Wood, S. N. (2017). Generalized additive models: An introduction with R. Boca Raton, FL, USA: Chapman and Hall/CRC.
Keywords: forest emissions reduction, airborne LiDAR, machine learning, tree species, certified emission reduction
Citation: Qin S, Chen Y, Yang B and Zhu K (2023) Forest emissions reduction assessment from airborne LiDAR data using multiple machine learning approaches. Front. Energy Res. 11:1252882. doi: 10.3389/fenrg.2023.1252882
Received: 11 July 2023; Accepted: 05 September 2023;
Published: 20 September 2023.
Edited by:
Joan Ramón Morante, Energy Research Institute of Catalonia (IREC), SpainReviewed by:
Shaobo Xia, Changsha University of Science and Technology, ChinaFeng Cheng, Yunnan Normal University, China
Copyright © 2023 Qin, Chen, Yang and Zhu. This is an open-access article distributed under the terms of the Creative Commons Attribution License (CC BY). The use, distribution or reproduction in other forums is permitted, provided the original author(s) and the copyright owner(s) are credited and that the original publication in this journal is cited, in accordance with accepted academic practice. No use, distribution or reproduction is permitted which does not comply with these terms.
*Correspondence: Kaiwei Zhu, zhukaiwei@tsinghua.edu.cn