Subdividing end-use energy consumption based on household characteristics and climate conditions: insights from urban China
 Tian Wang
 Qinfeng Zhao
 Weijun Gao
 Xiujuan He
- 1Innovation Institute for Sustainable Maritime Architecture Research and Technology, Qingdao University of Technology, Qingdao, China
- 2Faculty of Environmental Engineering, The University of Kitakyushu, Kitakyushu, Japan
Rapidly increasing household energy consumption poses significant challenges to global warming mitigation and the transition to low-carbon economies, particularly in China. This paper addresses this issue by introducing a comprehensive segmentation model which effectively subdivides household energy usage into five end-uses: cooking/hot water, heating, cooling, lighting, and power. The segmentation model uncovers compelling insights into urban end-use energy consumption patterns across China and variations among provinces. We observe a consistent increase in urban household end-use energy consumption and per capita energy consumption levels over the past decade. Heating and cooking/hot water emerge as the dominant contributors to household energy consumption, accounting for 26% and 40% of the total, respectively. Furthermore, it is found that higher levels of urbanization and improved living conditions are positively correlated with increased power energy consumption. The declining number of household members, primarily due to the prevalence of nuclear families, has resulted in higher energy end-use, particularly in both developed and underdeveloped economic areas. This paper serves as a valuable foundation for understanding and quantifying household end-use energy consumption. The findings contribute to a more comprehensive understanding of energy consumption patterns, facilitating a cleaner and more sustainable transformation of energy consumption structures.
1 Introduction
Excessive energy consumption and rapid growth of carbon emissions are becoming important global issues (Zhao et al., 2023a). In the face of continuously increasing energy pressure and climate crisis (Jiang et al., 2022), energy saving is expanding from the industrial sector to many aspects of social life. Household energy consumption caused by people’s daily behaviors and activities is an important source of global energy consumption, accounting for about 35% (IEA, 2020). The energy consumption of the household sector in China has reached 18,080 PJ, accounting for 13% of the total energy consumption. It is already the second largest energy consuming sector after industry in China (Nie and Kemp, 2014). China’s household energy consumption serve as an important driver of growth in total national energy consumption (S. Wang et al., 2021), and it is a major contributor to incremental carbon emissions and enhanced air pollution (Reyes, 2021; Zhang et al., 2021).
The issue of energy sustainability in Chinese household sector has attracted a lot of attention. One of them is the exploration of household energy consumption characteristics as well as structural shifts. These include fossil fuel (H. Han et al., 2018; Pachauri and Jiang, 2008); electricity demand (Murata et al., 2008) and renewable energy development (G. Ali et al., 2019; Bloch et al., 2015). The discussion about the characteristics of direct and indirect energy consumption in households and its environmental impact is also one of the hot topics. (Zhao et al., 2012; Wang and Zhang, 2015; Ding et al., 2017). The second is a study of the end-use energy consumption of households and the key drivers. It is possible to maximize the understanding of household energy use characteristics (Daioglou et al., 2012) and effectively guide the energy saving behavior of residents (Lee and Song, 2022b). It can be considered that clarifying the characteristics of energy consumption and the end-use energy of households are the primary tasks in achieving energy saving in households.
In existing research on the end-use energy of households, the main approach is based on statistical data and household surveys. The continuous time series and extensive coverage of statistical yearbook data enable the analysis of long-term energy use changes and the impact of demand (You et al., 2021), but few studies have decomposed energy consumption into different end uses. Most studies are based on microdata such as questionnaires or actual measurements, due to limited data accessibility and the inability to update it quickly, the research scope of such studies is usually limited to specific regions or cities (Zhou et al., 2009; Dianshu et al., 2010), single or few energy variable or consumption end-use (Zhou and Teng, 2013; He et al., 2022), it is not able to measure the change in energy consumption at a macro level. Secondly, due to varying levels of economic development, energy consumption behaviors, resource conditions, and climate conditions differ significantly across different regions. Energy consumption exhibits clear spatial clustering patterns. Energy consumption inequality has become an undeniable issue that cannot be ignored (Shi, 2019). Among them, the urban-rural gap has become a starting point for many scholars’ research (Niu et al., 2014; Xu et al., 2016). However, few studies have attempted to explore the interprovincial perspective (Zhang et al., 2023). How to reasonably subdivide the energy end-use and analyze the energy consumption behavior of households has become an urgent problem to be solved.
While the rapid development of urbanization has driven up the living standards and incomes of residents, it has also led to a high concentration of energy consumption in Chinese urban areas. This is due to the large-scale concentration of population in cities and the expansion of residential space (Zhao et al., 2023b). The rise in income elasticity is often accompanied by an increase in the variety, prevalence and use of household appliances (Lei et al., 2022), which also changes the lifestyle and consumption habits of residents. From 2010 to 2019, the energy consumption of urban households increased from 3,624.7 PJ to 6486.58 PJ, exceeding 60% of the total energy consumption of the residential sector (CESY, 2021). China’s 14th Five-Year Plan defines a vision to achieve the development of “Four Modernizations” by 2035. This not only stimulates China’s urbanization to continue to advance rapidly and energy consumption continues to grow, but also puts forward requirements for industry-wide energy conservation and carbon saving. Managing energy consumption in China’s urban areas will be challenging (Zhang et al., 2018). Climate environment, population distribution, energy industry development, etc., also affect the change of household energy consumption in different regions of China (Jiang et al., 2023). How to effectively analyze household energy consumption differences and control energy consumption growth in urban areas has become major challenges.
This paper aims to address this research gap by developing a comprehensive segmentation model for household end-use energy consumption in urban China. This model based on statistical yearbook data by introducing elements such as household characteristics, economic level, and climatic conditions to reflect the temporal and spatial changes of household end-use energy consumption in urban China. The specific objectives are as follows: 1) To analyze urban household end-use energy consumption patterns and trends over the past decade; and to identify the main contributors to household energy consumption and their respective shares. 2) To assess the impact of geographic climate on energy consumption, particularly for heating and cooling. 3) To explore the relationship between the level of urban development, lifestyle changes, and power energy consumption. 4) To discuss the impact of changes in household structure on energy end-use in developed and underdeveloped economic regions. Introducing household characteristics into energy consumption accounting and analysis is the innovation of this study, which helps to subdivide household end-use energy more accurately, further understand the characteristics of household energy consumption and provide a basis for formulating related policies.
2 Methodology and materials
2.1 Measurement and classification
The term“energy end-use” as employed in this paper refers to the energy directly consumed by residents in their household activities. End-use energy encompasses primary energy sources such as coal, electricity, gasoline and gas. When accounting for end-use energy, various factors need to be taken into account, including the combustion efficiency of the energy source, the technological advancement of household equipment, and the penetration of city gas, among others. To derive comprehensive insights into household end-use energy consumption, it is imperative to initially discern the specific energy types in use and attribute them to specific end-use activities.
In this paper, the types of energy in the household sector from the China Energy Statistics Yearbook are summarized into five categories: coal, liquefied petroleum gas (LPG), natural gas, electricity, and heat.
For the choice of major household equipment, the first is fossil fuel consuming equipment including gas stoves, coal stoves and central heating systems. The second is the appliances including microwave ovens (MO), water heaters (WH), range hoods (RH), rice cookers (RC), electric fans (EF), air conditioners (AC), computers C), refrigerators R), TVs (TV), washing machines (WM), and lamps L).
Considering the differences in the scope of the study, energy type, and equipment selection, various insights have emerged regarding the division of household end-use sectors, as detailed in Table 1. This paper classifies urban household end-use energy consumption into five end-uses: cooking and hot water, heating, cooling, lighting and power. Power is the electricity that keeps household appliances that are not used for heating and production running.
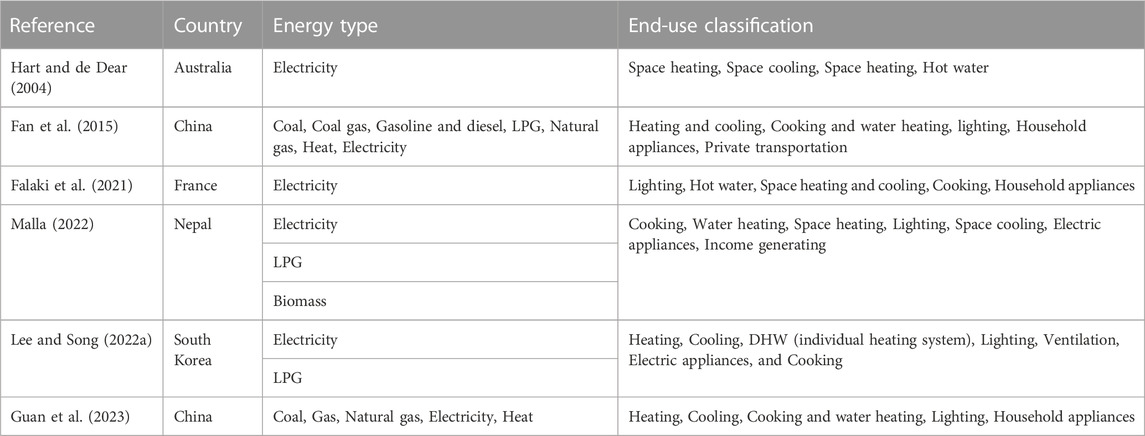
TABLE 1. The classification of Household end-use.
Based on the above process, the selected fuel energy, household appliances and equipment, and end-use activities will be matched one by one, and the results are detailed in Figure 1. PART Ⅰ, PART Ⅱ, PART Ⅲ represent three different types of energy supply. PARTⅠand PARTⅡare mixed energy supply. PART Ⅰ is Cooking/hot water, the main energy types are coal, natural gas, LPG and electricity. PART Ⅱ is heating, the main energy sources are heat, coal and electricity. PART III is a consumption end-use that relies on electricity, including cooling, power, and lighting.
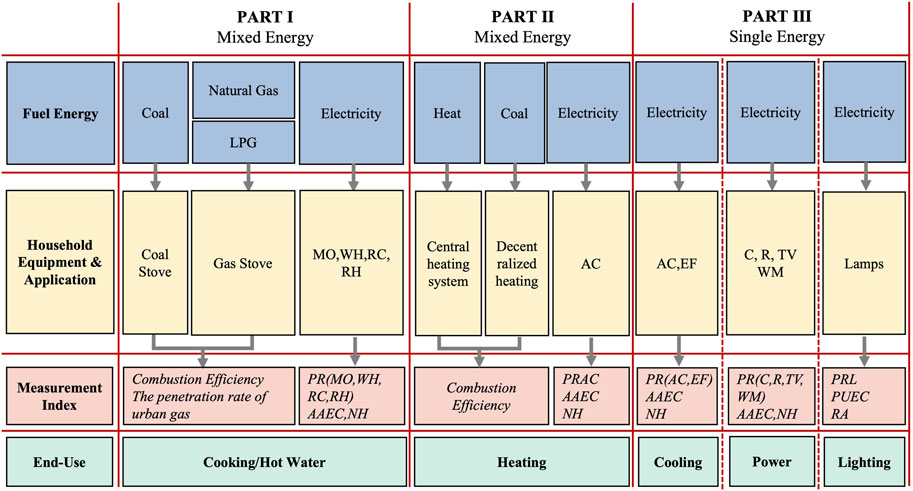
FIGURE 1. Energy end-use consumption in urban household.
2.2 Subdivide model of household end-use consumption
Building a numerical model is one of the effective methods to estimate the household end-use energy consumption (Matsumoto, 2016). According to the identified measurement indicators and the obtained relevant data, developed models for household end-use energy consumption in urban areas of China. In this study, the total end-use energy consumption of urban households can be calculated by formula (1).
Where,
2.2.1 Cooking and Hot water
Cooking/hot water in households usually relies on coal stoves or gas stoves, RC, WH, RH and MO. The calculation of its end-use energy consumption is complex due to the existence of a mixed supply of multiple energy sources. All natural gas and LPG consumed by households are considered to be used for cooking and hot water. And the energy end-use for cooking activities needs to be converted by the combustion efficiency of the gas stove.
In urban areas where natural gas is not fully penetrated, coal is assumed to be the fuel source for household cooking. This can be calculated based on the penetration of urban gas and the combustion efficiency of coal stoves. The energy consumption of other appliances, RC, WH, RH and MO are based on the penetration of the appliance, the average annual energy consumption and the number of households. The energy end-use for cooking/hot water in urban households is calculated by the following formula (2), formula (3), formula (4), formula (5), formula (6).
Where,
2.2.2 Heating
The heating approaches in Chinese urban households mainly include centralized thermal heating, decentralized heating using coal or gas, and air conditioner heating. Centralized heating is an important heating method in northern China and can be estimated based on the total heat consumption and the combustion efficiency of the equipment. Gas heating will be ignored in this study due to its low penetration rate. Decentralized heating mainly considers coal consumption, which is estimated by the salvage value of coal consumed in the kitchen/hot water. Air conditioner heating is calculated based on the penetration rate of air conditioners, the average annual energy consumption, the number of households and residence area. The energy consumption of the Heating can be calculated by formula (7).
Where,
2.2.3 Cooling
Household cooling, lighting and power consume a large amount of electricity. Among them, cooling energy consumption comes from the use of AC and EF in hot weather, and lighting energy consumption can be deduced from the penetration of lamps, per unit area of energy consumption and residential area. Power mainly contains the energy consumption of four types of common household end-use devices: TV, R, WM, and C. The energy consumption of household appliances is also derived from the average annual energy consumption, the penetration rate of the appliances, and the number of households.
The calculation of cooling, lighting and power energy consumption in urban households is shown in formulas (8), formulas (9), formulas (10).
Where,
Where,
Where,
2.2.4 Calculation of household end-use energy consumption in provincial
In terms of energy consumption for regional heating, the data in the statistical yearbook only reflects the central heating of urban households in each province. It is not possible to confirm the usage habits of household appliances during heating and cooling. Considering the differences in climate, we introduced the number of degree days as a condition for calculating the electric energy consumption for urban household heating and cooling in each province. Degree days is a general indicator to reflect climate change human comfort, mainly divided into Heating Degree Days (HDD18,°C day) and Cooling Degree Days (CDD26, °C day). HDD18 and CDD26 can objectively evaluate the energy demand for heating and cooling in urban households (Bhatnagar et al., 2018) (K. Lee et al., 2014). The formula is as follows (11) and (12).
The end-use energy consumption results for centralized and decentralized heating, cooking/hot water, lighting, and power for urban households in each province we can still obtain from formulas (2), formulas (3), formulas (4), formulas (5), formulas (6), formulas (9), formulas (10).
Where,
The formula for calculating the electric energy consumption of heating and cooling in urban households in each province is as follows (13) (14).
Where,
2.3 Data sources
2.3.1 Data collection
In this paper, the Statistical Yearbook Data is an important support for conducting the study. The national urban household energy consumption data for 2010 - 2019 are taken from the national energy balance sheet in the China Energy Statistical Yearbook, it includes national scale and provincial scale. Moreover, the data on urban population, the number of households, the penetration rate of household appliances, per capita income and GDP, and residential area involved in the promotion of the study were obtained from the China Statistical Yearbook, as well as from the statistical yearbooks of 30 provinces (excluding Tibet, Hong Kong, Macao, and Taiwan).
Other data relevant to the study, including data related to energy fuel combustion efficiency, power of household appliances, and data related to climatic conditions, were obtained mainly from other energy statistical reports, social publications, and government public information websites. Some important data and sources of access are shown in Table 2.

TABLE 2. Date sources.
2.3.2 Data processing
In estimating the electricity consumption of household appliances, the average annual electricity consumption (AAEC) is a very important indicator, but it is not directly available. In the (Murata et al., 2008) study, a method is proposed that can calculate this indicator using the power of the appliance as well as the annual usage time. For other related data, such as per unit area energy consumption of lamps, per unit area energy consumption of air conditioners, etc., the main reference is (Jiang and Wu, 2010). The data sources are presented in Table 2. Table 3 shows the average annual electricity consumption of all household appliances, as well as the per unit area electricity consumption.
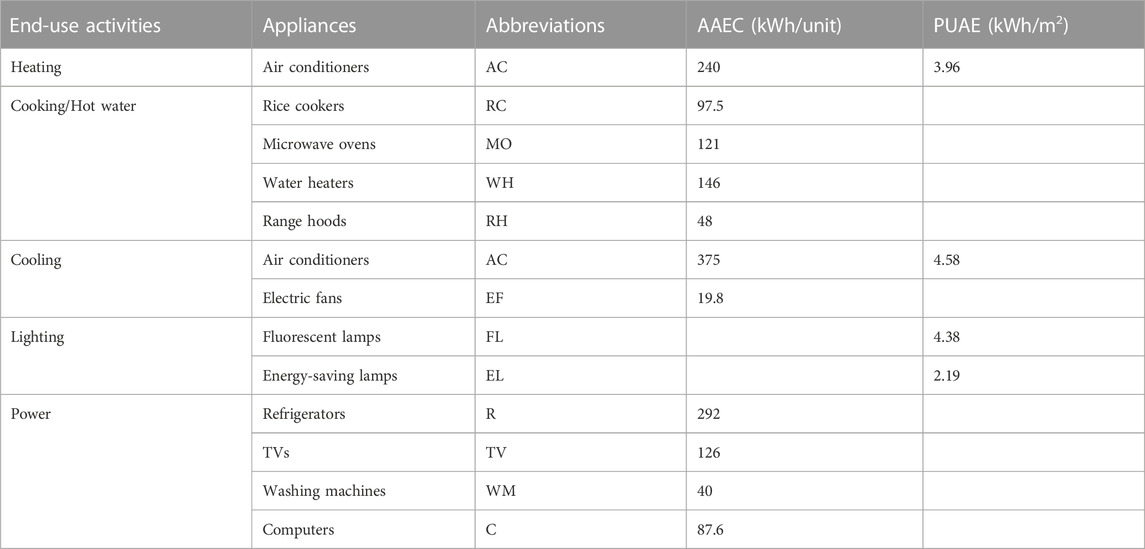
TABLE 3. Household appliances.
In Supplementary Table A1, the abbreviations for the names of the provinces are detailed, as well as the results of HDD18, CDD26 for urban areas in province for 2019, calculated based on formula (13)(14). The 30 provinces were divided into 7 regions based on geographical distribution to explore the impact of climate and economic development on household energy consumption.
2.4 Inference factor of household end-use energy consumption
To effectively set and achieve the goal of energy saving and emission reduction in households in various regions, it is necessary to analyze the influencing factors that cause differences in household end-use energy consumption. The factors of household energy consumption are complex and variable.
Household size as well as its composition play an important role in the change of residential energy consumption (Brounen et al., 2012). Secondly, the effect of high household income on energy consumption is positive, and in particular has a significant relationship between electricity consumption behavior (Bridge et al., 2016; Ali et al., 2019). The rapid urbanization is driving changes in the lifestyle and standard of living of residents, and with it comes high energy consumption due to the expansion of housing areas and the increase in appliances (Romero-Jordán and del Río, 2022). Household cooling and heating demand is more sensitive to changes in weather patterns (Fan et al., 2019). In addition to this, many studies have confirmed the variation of ambient temperature on the energy consumption of household appliances (Harrington et al., 2018; Campagnolo and De Cian, 2022).
Although previous studies have explored the determinants of household energy consumption from several perspectives, there are relatively few analyses based on different end-use activities. Second, most studies have not yet provided an explanation for the factors responsible for spatial energy consumption differences. In this paper, 10 main independent variable factors are intercepted from four aspects: economic level, household characteristics, urban development, and climatic conditions, respectively. Based on the analysis results of household end-use energy consumption in urban areas in 2019, the extent of its impact on energy end-use in different regions was examined separately. Table 4 details all the indicators as well as the abbreviations, which are taken from the Chinese Statistical Yearbook (CSY, 2020).
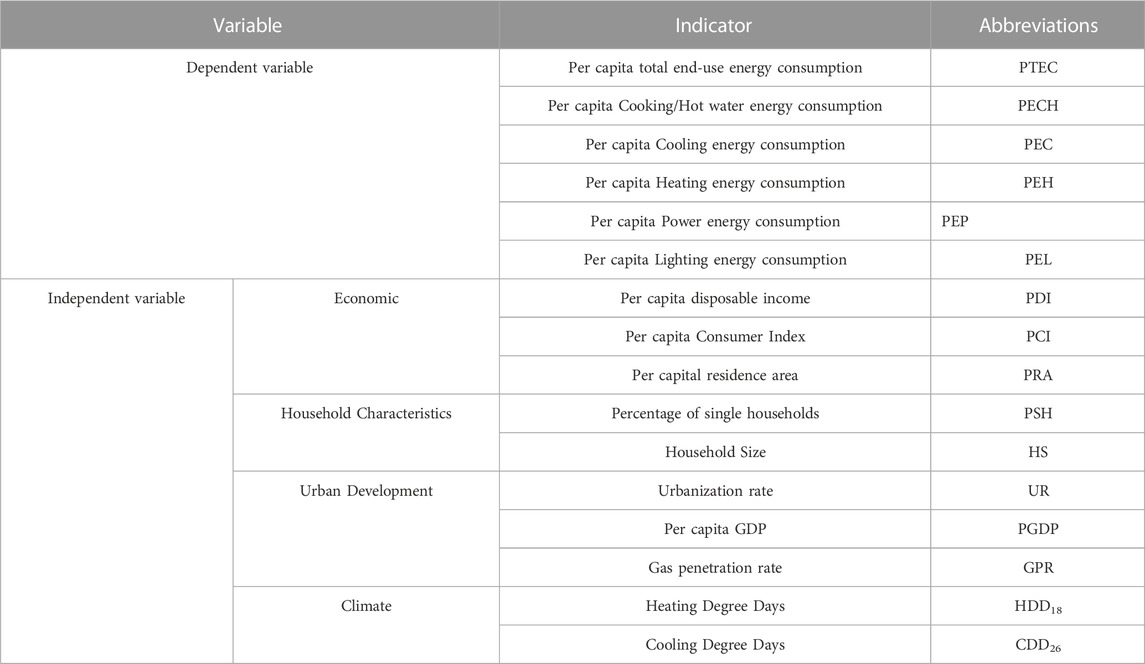
TABLE 4. List of relevant variables influencing household end-use energy consumption.
3 Result and analysis
3.1 Energy consumption in urban household
As shown in Figure 2, over the last 10 years, the total energy consumption of urban household in China has continued to increase. It increased from 3,624.7 PJ in 2010–6486.6 PJ in 2019, with an average annual growth rate of 6.7%. The per capita energy consumption increased from 5.41 GJ/person to 7.65 GJ/person, a growth rate of about 41%. Except for coal, the consumption of the other four energy increased, with natural gas having the most prominent growth rate of 8.65%, followed by the consumption of electricity and heat with growth rates of 7.73% and 7.46%, respectively. The per capita electricity consumption in urban areas increased from 445.5 kWh/person to 688.1 kWh/person, an increase of 1.54 times. LPG shows a trend of increasing and then decreasing, with the highest consumption in 2017, followed by a yearly decrease.

FIGURE 2. The change of urban household energy consumption.
In addition to the increase in total consumption, the structure of energy use in the urban household sector is also gradually moving in the direction of cleanliness. The share of coal in household energy is continues to decline, accounting for only 2.7% of household coal consumption in 2019. Electricity and gas has become the main energy of urban household, accounting for more than 70% of the total.
3.2 Energy consumption of urban household end-use activities
The increase in total energy consumption and the change in energy structure of urban households in China are closely related to the end-use energy consumption activities. Based on the calculation results obtained from Formulas (2), Formulas (3), Formulas (4), Formulas (5), Formulas (6), Formulas (7), Formulas (8), Formulas (9), Formulas (10), the end-use energy consumption characteristics of urban households are analyzed and the results are shown in Figure 3.
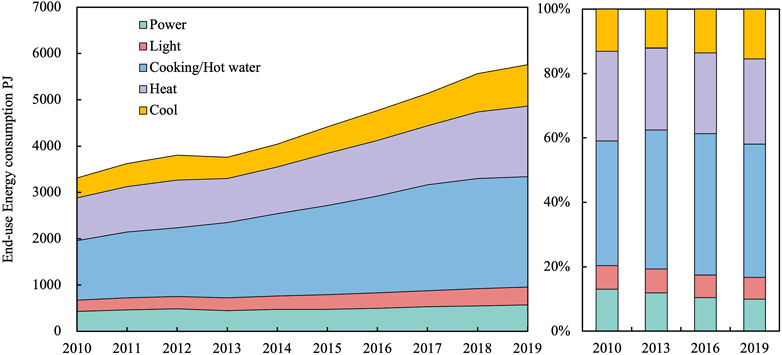
FIGURE 3. The structure of end-use energy consumption in urban household.
From 2010 to 2019, the end-use energy consumption of urban households increased by 2,443 PJ, the Per capita energy consumption increased from 4.94 GJ/person to 6.79 GJ/person. In a period of rapid growth from 2014 to 2018, with an annual growth rate of 7.3%. Total energy consumption in the cooking/hot water grew by 1,101 PJ, and was the largest contributor to the increase in energy consumption, which explains the rapid growth in natural gas energy consumption in urban households. The heating energy consumption increased by 660 PJ, but per capita energy consumption did not show a significant change. This is followed by cooling energy consumption, which increased by 458 PJ in total and 62.8% in per capita cooling energy consumption.
Energy consumption for cooking/hot water as well as heating nearly 70% of the total household energy consumption and is the most important energy consumption activity in urban households. Among them, cooking/hot water accounts for nearly 40%, and the share is gradually increasing. Heating energy consumption has maintained a steady growth, but its share has decreased.
Cooling, power, and lighting are the largest contributors to the increase in household electricity consumption. The concentration of population in cities, the growth of urban households, and new consumers contributing to the development of the household appliance market. As an essential energy-consuming household appliance, refrigerators account for more than half of household power consumption.
3.3 Regional characteristics of household end-use energy consumption
The end-use energy consumption and per capita consumption of urban households were determined for 2019 in 30 provinces. Using the national average energy consumption as a reference point, a preliminary assessment of the end-use energy consumption levels in these 30 provinces was conducted. As shown in Figure 4, the dashed line represents the national average per capita energy consumption level, which stands at 22.39 GJ/household. The yellow region indicates provinces with consumption levels below the national average, while the blue region represents provinces with consumption levels above the national average. The size of each colored region represents the extent of deviation from the national average.
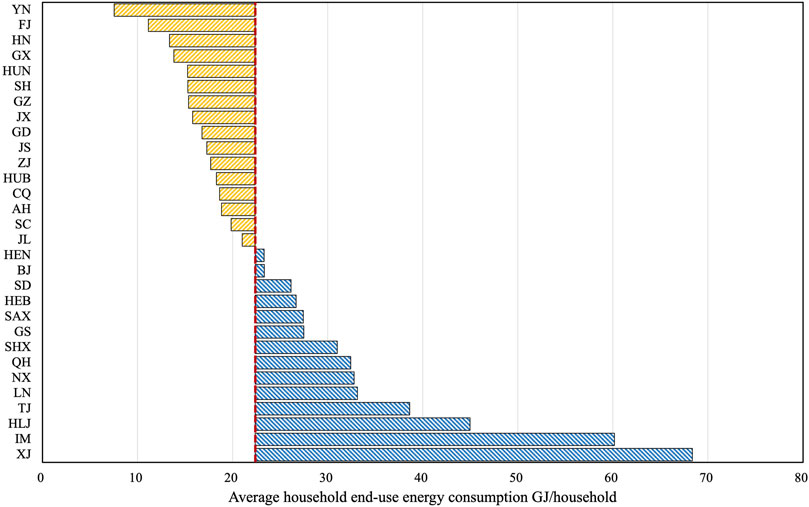
FIGURE 4. Average household end-use energy consumption levels by province.
Taking the national average as the reference point, the average household energy consumption among urban households shows a distinct regional distribution pattern, characterized by lower consumption levels in the southern areas and higher levels in the northern areas. The difference in energy consumption can be attributed primarily to variations in heating energy demands resulting from differing climatic conditions. This phenomenon is particularly pronounced in the provinces of the northeast and northwest regions, which experience severe winters. In provinces like HLJ and IM, the average household energy consumption exceeds the national average by a factor of two or more. Conversely, in central regions such as AH and HB, as well as southwestern regions such as CQ and SC, the average household energy consumption is slightly lower than the national level. In economically developed and highly urbanized regions such as the Yangtze River Delta and GD exhibit relatively lower average household energy consumption levels, primarily due to the higher number of urban households. In regions characterized by slower urbanization, such as YN and GX, display significantly lower average household energy consumption levels compared to the national benchmark.
Based on the initial observations, the consumption characteristics of household end-use energy consumption in different regions, and the structure of energy use are further analyzed.
3.3.1 Cooking and Hot water
The decomposition results of cooking/hot water energy consumption of urban households in different regions are detailed in Figure 5. The column chart indicates the variability of total end-use energy and the structure of energy use, while the point distribution indicates the variability of average household energy use.
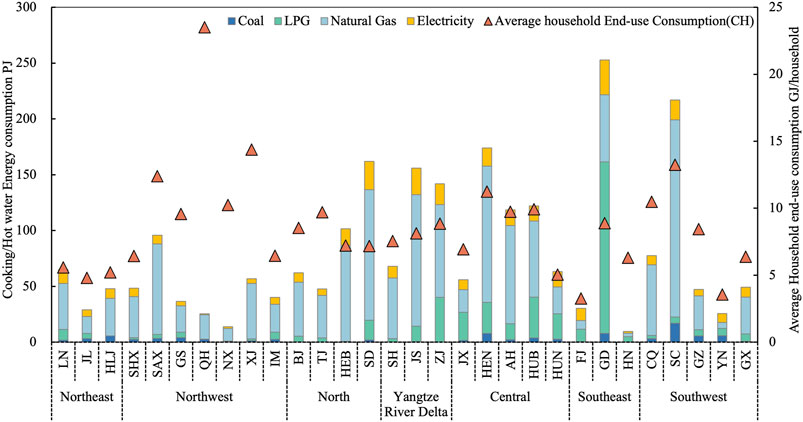
FIGURE 5. Differences in cooking and hot water energy consumption of urban household.
In terms of total regional consumption, Central has the highest household end-use energy, accounting for about 22% of the national total, followed by Southwest and North with 17% and 16%, respectively, and Northeast with the lowest share of total energy use at 6%. In terms of provincial performance, GD has the highest total energy use, and almost 90% of Southeast’s cooking/hot water energy use is from GD. The next is SC, with a total cooking/hot water energy use of 216 PJ, accounting for about 9% of the national total. In the second tier, HEN, SD, JS, have a total cooking/hot water energy use of almost all over 150 PJ. This is closely related to the highly dense population in urban areas. In contrast, HN and NX have very little energy consumption.
Areas with higher average household energy consumption level are typically concentrated in provinces characterized by relatively slower urbanization development and smaller household members. This phenomenon is most pronounced in the provinces of the Northwest region. QH exhibits a remarkably high average household cooking consumption of 23.5 GJ/household, XJ and SAX follow closely behind. SC is the only province that ranks high in both total energy consumption and average household cooking consumption. Its average household cooking consumption is 13.24 GJ/household, ranking second only to QH and XJ.
The energy consumption structure for household cooking and hot water is complex. With the popularization of urban gas appliances and the improvement of infrastructure, natural gas and LPG have become the most important energy sources for household cooking activities, accounting for over 80% of the total energy consumption. Electricity follows next, representing 13% of the energy mix. In North and Yangtze River Delta, the household cooking energy structure consists of natural gas and electricity, and natural gas consumes nearly one-third of the national total. LPG is the primary energy supply for cooking activities in the Southeast region, and its total consumption is the highest of all regions. The Southwest region consumes the highest amount of coal for cooking in the country, accounting for approximately 36% of the national total.
3.3.2 Heating
The “high in the north and low in the south” is an important regional difference in household heating energy consumption in urban areas of China. As shown in Figure 6, Northwest, Northeast and North are the regions with high concentration of heating energy consumption. Due to the high geographical latitude, the winter temperature is low and lasts for a long time, and the demand for heating is high in order to maintain a comfortable indoor living environment. Among them, the heating energy consumption of HLJ, SD, IM and LN far exceeds that of other provinces. The heating energy consumption of the four provinces accounts for almost half of the national total. Among them, HLJ has the highest total heating energy consumption of 338.16 PJ. IM has the highest average household energy consumption at 50.36 GJ/household. Compared to other high-latitude provinces, SD has a relatively suitable climate and temperature environment in winter, but a large number of urban households leads to a high demand for heating.

FIGURE 6. Differences in heating energy consumption of urban household.
In terms of the energy structure of heating, urban centralized thermal heating is a type of heating unique to northern China, accounting for more than 70% of energy use. Central areas mainly have decentralized heating using coal as fuel, such as heating stoves. The Yangtze River Delta, Southwest and Southeast have a subtropical monsoon climate with low demand for winter heating and rely mainly on air conditioning, with over 70% of air conditioning heating coming from these regions.
3.3.3 Cooling
From Figure 7, it is evident thathousehold cooling energy consumption is mainly concentrated in the southern regions and areas characterized by a high degree of economic development. This concentration is attributable to several factors.
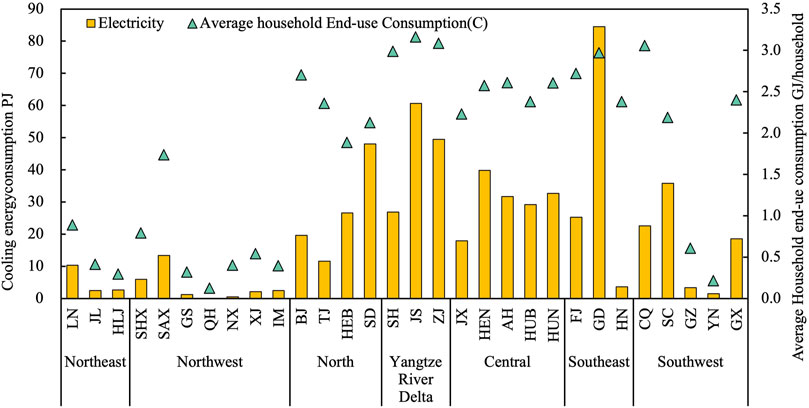
FIGURE 7. Differences in cooling energy consumption and the relationship with climatic conditions.
In regions with relatively cooler summer temperatures, households exhibit a lower demand for cooling, resulting in significantly reduced total cooling energy consumption in the northeastern and northwestern regions compared to other areas. Conversely, GD positioned at a lower latitude and experiencing hotter and more extended summers, demonstrate notably higher cooling energy consumption compared to other provinces. It is worth noting that, unlike household heating, the central provinces also show a higher demand for cooling energy consumption.
Regarding average household energy consumption levels, the results for the northeast and northwest regions closely mirror those observed for total energy consumption. In the more developed provinces of ZJ, SH, JS and BJ, the average household energy consumption level surpass those in regions at the same latitude. In addition to climatic factors, this disparity may be attributed to a superior material infrastructure and a greater emphasis on achieving a higher standard of comfortable living, potentially contributing to the elevated cooling energy consumption in these areas.
3.3.4 Lighting and Power
Figure 8 shows the differences in energy consumption for power and lighting within urban households. Concerning the regional distribution of total power energy consumption, the provinces are ranked as follows: Central, Yangtze River Delta, North, Southeast, Southeast, Southwest and Northeast, in descending order. The Yangtze River Delta region, being China’s most economically developed and robust region, significantly ahead of other regions in terms of average household energy consumption. Aside from this, the average household energy consumption levels in other provinces are relatively uniform. The balanced development of urbanization is gradually diminishing the disparities in economic income and consumption levels among regions.
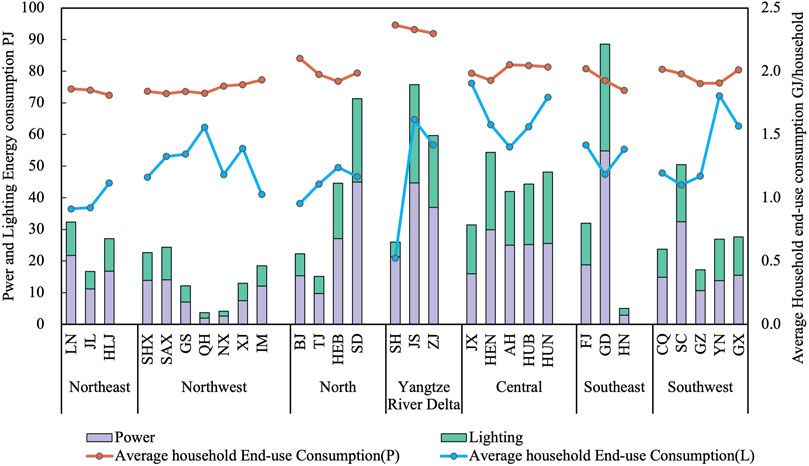
FIGURE 8. Differences in Lighting and Power energy consumption of Urban household.
The lighting energy consumption of urban households is directly related to the residential area. SH and BJ, as China’s first-tier cities, have a high degree of urbanization leading to a denser population distribution and the per capita residential area much lower than the national average residential level. This factor primarily contributes to their lower average household lighting energy consumption levels.
4 Discussion
4.1 Household energy structure transition and development
From the perspective of household energy consumption structure, the share of coal in household energy has been significantly decreased and continues to decline. Natural gas is rapidly gaining prominence in household energy consumption due to its advantages, including low emissions and high efficiency. The combination of “electricity” and “gas” has become the predominant energy structure for urban households, accounting for over 70% of the total consumption. This shift signifies a transition towards cleaner sources within urban households, aligning with the goal of achieving a more sustainable and low-carbon energy structure. This transformation undoubtedly contributes to the realization low-carbon development goals in the household sector and reducing environmental pollution. This perspective is further supported by Zou’s study (Zou et al., 2018).
There are multiple factors contributing to the change in energy consumption structure. The Chinese government has implemented a series of policies to control coal consumption and promote the development of renewable energy sources. These policies aim to shift away from coal and encourage the adoption of cleaner and renewable energy options (L. Li and Taeihagh, 2020; Tao et al., 2021). The transformation and upgrading of urbanization and the development plans for sustainable low-carbon economy have also driven the transition of urban areas towards clean energy sources (Hepburn et al., 2021). Natural gas has a positive impacts on economic development and is considered an optimal choice for achieving energy transition and reducing carbon emissions (Cesur et al., 2017; Li et al., 2019). The Chinese government has also implemented a number of projects such as coal-to-gas conversion to promote the development of the natural gas industry. (Jiang et al., 2020; Guo et al., 2022).
4.2 End-use activities and its factor
Figure 9 shows the correlation between per capita end-use energy consumption in urban households and the independent variables. The correlation coefficients and significant relationships are shown in detail in Supplementary Table A2.

FIGURE 9. Factors influencing the difference in energy consumption of household end-use.
4.2.1 Cooking/hot water
Cooking/hot water usage constitute essential components of daily energy consumption activities within Chinese households, with the rich culinary culture encouraging households to dedicate relatively more time to cooking (Zheng et al., 2014). In the study conducted by (Lee and Song, 2022b), the household size of and household income are identified as pivotal factors influcing cooking energy consumption. However, this study does not show the determinants related to the spatial differences affecting household cooking energy consumption. This may be due to the inconsistency in the division of end-use energy consumption and the study regions. Additionally, in the study by (Lee and Song, 2022b), only the energy consumption of cooking appliance was considered, and data on the consumption of fossil fuels such as coal and natural gas were not included.
Cooking/hot water is indispensable as the basis of productive household life. In terms of provinces, cooking/hot water energy consumption is significantly higher in SC and GD, which is strongly related to differences in cooking habits and behaviors of residents. This view was also confirmed in a study by (Hager and Morawicki, 2013).
In the analysis of influencing factors, HDD18, CDD26 and GPR show trends that affect cooking/hot water consumption. This indicates that climatic conditions influence regional variations in hot water demand (Meireles et al., 2022). The popularity of gas can make household cooking/hot water activities more convenient and promote energy consumption (NDRC, 2022). PSH exhibits a positive correlation with PECH, indicating that in cities with a higher proportion of single-person households, household cooking activities are more dispersed, resulting in increased energy consumption intensity.
4.2.2 Power
Similar to cooking/hot water, the household characteristics is an important factor in power consumption. PSH shows a positive correlation with the level of household energy consumption, while an increase in HS demonstrates a significant negative correlation with per capita energy consumption. Single-person households often imply higher per capita energy consumption. This also suggests that the reduction in household size and the increase in the number of single-person households have led to the growth in total households, thereby promoting the increase in energy consumption.
The reasons for changes in family characteristics are multiple. Uneven economic development and population mobility are also significant factors contributing to this phenomenon. In regions such as ZJ, SH, GD, rapid economic development has attracted migrant workers. Single-person households account for nearly 30% of the total households in these areas, with household sizes lower than the national average. In contrast, in the northeastern regions, the outflow of a large number of employed individuals has exacerbated population aging, leading to an increase in single elderly households living alone (Liu et al., 2020). This is an important factor causing household downsizing. With social changes and shifts in family values, traditional notions of “four generations under one roof” and “three generations living together” have been abandoned. Additionally, the rise of individualistic thinking has contributed to smaller average household sizes. According to the data from the seventh National Population Census (NBS, 2021), the average household size in China dropped to 2.62 people, breaking the pattern of the “three-person household.”
Economic development and the level of urban development also have a significant impact on household power consumption (Huang and Matsumoto, 2021). PCI and PDI contribute to the growth in energy consumption with correlation coefficients of 0.798 and 0.81, respectively. This phenomenon is more pronounced in highly urbanized areas such as BJ and SH. Areas with higher levels of urban development tend to represent higher household incomes, and higher income elasticity promotes an increase in the types, penetration, and utilization of household appliances (Lei et al., 2022), which also changes the lifestyle and consumption habits of residents, and resulting in higher consumption demand. This also reflects how increasing the share of energy-efficient appliances is an important initiative to address environmental impacts in the era of household electrification (Baldini et al., 2018).
4.2.3 Heating and cooling
In the correlation coefficient analysis, a significant positive correlation was found between HDD18 and PEH. Climate variation plays a crucial role in explaining the disparity in energy consumption for heating in urban households. Centralized thermal heating systems are prevalent in northern Chinese cities due to low winter temperatures and prolonged winter seasons, aimed at ensuring a comfortable indoor living environment (M. Fan et al., 2020), However, this feature also leads to high energy consumption levels.
Household cooling energy consumption exhibits a significant positive correlation with CDD26 and a negative correlation with HDD18. In general, regions with higher CDD26 tend to exhibit increased demand for household cooling energy consumption. Apart from climate-related factors, urban development and household income levels are also important factors contributing to disparities in cooling energy consumption (Al-Hinti and Al-Sallami, 2017). The findings reveal that both PGDP and PDI display a significant positive correlation with PEC, with correlation coefficients of 0.728 and 0.676, respectively. Cooling energy consumption is primarily calculated based on electricity usage for air conditioning during the summer season, and the ownership rate of air conditioning in households depends on the level of urban development and household income in different regions. Typically, economically advanced areas characterized by high levels of urbanization, there is also higher purchasing power for air conditioning, resulting in higher cooling energy consumption in households. In terms of household characteristics, PSH also shows a positive correlation with cooling energy consumption, indicating that regions with a higher proportion of single-person households tend to experience higher per capita cooling energy consumption. This also explains the concentration of cooling energy consumption in the Yangtze River Delta region.
4.3 Opportunities and challenges for household energy efficiency
In the analysis of various types of energy consuming equipment for cooking, it was found that most of the cooking activities in Chinese urban households rely on the use of gas equipment, which accounts for more than 80% of the total cooking energy consumption, while the energy consumption of electrical equipment only accounts for about 13%, this is consistent with (X. Han et al., 2022). Energy policies have a significant impact on the choice of household cooking fuels. Effective fiscal policies can effectively reduce the demand for coal and facilitate the energy transition (Doggart et al., 2020). Improving stoves and combustion efficiency through technological interventions is one of the effective measures to reduce energy consumption (Sinton et al., 2004; Furszyfer Del Rio et al., 2020). Second, promoting the shift towards electrification of household cooking is an effective way to promote energy efficiency and emission reduction in the household sector (Garimella et al., 2022).
The impact of global climate change and extreme cold weather combined with a desire for a higher quality of life standard has led to a growing call for central heating in urban areas, especially in the south-central region. This poses a higher challenge for the sustainable development of urban energy in the future. Coal is still the main source of centralized district heating in China. How to rapidly promote the development of district clean heating and establish a modern energy system is the key to the sustainable development of Chinese cities (Curtis et al., 2020; Azhgaliyeva et al., 2021). Coal-fired power plant cogeneration can effectively reduce costs in the centralized heat supply sector while meeting the demand for heat to a greater extent (Du et al., 2023). In addition to improving the efficiency of energy utilization and taking measures such as purifying emissions, it is also important to promote the development of clean heating and heat sources such as electric heating, air source heat pumps and water source heat pumps (Amirkhizi and Jensen, 2020).
The influence of hot summer weather has increased the intensity of use of cooling equipment such as air conditioners in southern regions and is more concentrated in economically developed regions such as the southeast coast. This view is also supported by (Hu et al., 2017; Zhu et al., 2023). Promoting energy-efficient electric fans and energy-efficient inverter air conditioners is an important way to reduce energy consumption in urban households for cooling. Second, renewable energy is identified as having a key role to play in improving the energy efficiency and cooling quality of refrigeration systems such as household refrigerators and air conditioners (Aridhi et al., 2016).
The expansion of housing area (S. S. S. Ali et al., 2021) and the increase in income directly contribute to households owning more electrical appliances, which increase the electrical load (Parikh and Parikh, 2016; Curtis, 2021). As the size of single-person households continues to grow, household sizes are expected to further decrease in the future. Due to the personalization of living spaces and the presence of multiple energy-consuming devices, smaller households often face higher per capita energy consumption, thereby increasing the overall demand for energy resources (Ala-Mantila et al., 2016).
The growing electricity load in the household sector is making higher demands on the power sector in terms of energy transformation and cost reduction. One effective means is to increase investment in electric power technology research and development and provide subsidies for renewable energy electricity9/28/23 1:52:00 a.m.The energy efficiency labeling for appliances is considered to be an effective tool for reducing electricity use (Gillingham and Palmer, 2014; Biglia et al., 2020). The Chinese government is actively promoting the energy efficiency Labeling for refrigerators, a policy that will have a huge potential for energy saving (Nie et al., 2021). Secondly, (Apipuchayakul and Vassanadumrongdee, 2020), believed that replacing energy efficient lamps and developing intelligent lighting systems will significantly reduce the lighting energy consumption of buildings.
In China, standby energy use is responsible for about 10% of total electricity use in urban household (Meier et al., 2004). Improving the energy efficiency of household appliances through technical approaches and promotes residents to develop good habits in using electrical appliances, thus reducing the waste of standby energy. It offers great potential for energy saving in household power (Broberg and Kazukauskas, 2021).
5 Conclusion and outlook
This paper is based on data from the China Energy Statistical Yearbook (2010–2019) and aims to explore the structure and trends of household energy consumption in urban areas. We establish a segmented model of end-use energy consumption to calculate and analyze the consumption characteristics and spatial distribution differences of household end-use energy consumption in urban areas. Finally, we discuss the fsctors contributing to differences in end-use energy consumption, considering economic level, climate conditions, household characteristics, and urban development, by employing the Pearson correlation coefficient.
In the past decade, there has been a continuous increase in total household energy consumption and per capita energy consumption in urban areas of China. The energy structure has been further shifting towards cleaner sources, resulting in a dominant energy composition of electricity and gas. In terms of the structure of household end-use energy consumption, cooking/hot water account for about 40% of the total, followed by heating and cooling at 26% and 15%, respectively, with power and lighting accounting for a relatively low share of energy consumption.
The household end-use energy characteristics differ across regions. One important finding of this paper is the influence of household characteristics on cooking/hot water and power energy consumption. The growth in total urban household energy consumption can be attributed to the increased share of single-person households and smaller household sizes. Climatic conditions are the main reason for regional differences in household energy consumption for heating and cooling. Secondly, the economic conditions of households and the level of urbanization also impact end-use energy consumption, reflecting residents’ higher pursuit of a comfortable lifestyle.
Urban energy sustainable development has imposed higher demands on energy structure transformation and household energy conservation. Families have been gradually transitioning to the era of electrification, and with the scarcity of traditional energy sources and environmental pollution concerns, it is crucial to accelerate the development and utilization of renewable energy sources like wind and hydro energy while further optimizing the power supply structure. Furthermore, the future trend involves expanding centralized urban heating, necessitating an elevated level of diversification and cleanliness in the heating energy structure.
The study was conducted based on statistical yearbook data, and its data does not reflect the penetration of small home appliances. However, as residents put forward a higher pursuit of living environment, small or smart appliances are becoming an indispensable part of household life. In the future, it will consider combining actual measurements or survey research to address this limitation.
Data availability statement
The original contributions presented in the study are included in the article/Supplementary Material, further inquiries can be directed to the corresponding authors.
Author contributions
TW: Conceptualization, Data curation, Investigation, Methodology, Visualization, Writing–original draft, Writing–review and editing. QZ: Funding acquisition, Methodology, Software, Visualization, Writing–original draft, Writing–review and editing. WG: Conceptualization, Funding acquisition, Supervision, Writing–review and editing. XH: Software, Writing–review and editing.
Funding
The author(s) declare financial support was received for the research, authorship, and/or publication of this article. This work was supported by International Science and Technology Cooperation Project of the Ministry of Housing and Urban-Rural Development, China (2020-H-002) and the Kitakyushu Innovative Human Resource and Regional Development Program (JST grant code: JPMJSP2149).
Conflict of interest
The authors declare that the research was conducted in the absence of any commercial or financial relationships that could be construed as a potential conflict of interest.
Publisher’s note
All claims expressed in this article are solely those of the authors and do not necessarily represent those of their affiliated organizations, or those of the publisher, the editors and the reviewers. Any product that may be evaluated in this article, or claim that may be made by its manufacturer, is not guaranteed or endorsed by the publisher.
Supplementary material
The Supplementary Material for this article can be found online at: https://www.frontiersin.org/articles/10.3389/fenrg.2023.1267975/full#supplementary-material
References
Al-Hinti, I., and Al-Sallami, H. (2017). Potentials and barriers of energy saving in Jordan’s residential sector through thermal insulation. JORDAN J. Mech. INDUSTRIAL Eng. 11 (3), 141–145.
Ala-Mantila, S., Ottelin, J., Heinonen, J., and Junnila, S. (2016). To each their own? The greenhouse gas impacts of intra-household sharing in different urban zones. J. Clean. Prod. 135, 356–367. doi:10.1016/j.jclepro.2016.05.156
Ali, G., Yan, N., Hussain, J., Xu, L., Huang, Y., Xu, S., et al. (2019). Quantitative assessment of energy conservation and renewable energy awareness among variant urban communities of Xiamen, China. Renew. Sustain. Energy Rev. 109, 230–238. doi:10.1016/j.rser.2019.04.028
Ali, S. S. S., Razman, M. R., Awang, A., Asyraf, M. R. M., Ishak, M. R., Ilyas, R. A., et al. (2021). Critical determinants of household electricity consumption in a rapidly growing city. SUSTAINABILITY 13 (8), 4441. doi:10.3390/su13084441
Amirkhizi, T. S., and Jensen, I. G. (2020). Cost comparison and optimization of gas electric hybrid heat pumps. WILEY Interdiscip. REVIEWS-ENERGY Environ. 9 (3). doi:10.1002/wene.370
Apipuchayakul, N., and Vassanadumrongdee, S. (2020). Factors affecting the consumption of energy-efficient lighting products: exploring purchase behaviors of Thai consumers. SUSTAINABILITY 12 (12), 4887. doi:10.3390/su12124887
Aridhi, E., Abbes, M., and Mami, A. (2016). Solutions based on renewable energy and technology to improve the performance of refrigeration systems. J. Renew. Sustain. ENERGY 8 (6). doi:10.1063/1.4972297
Azhgaliyeva, D., Mishra, R., Karymshakov, K., Kerimray, A., and Kapsalyamova, Z. (2021). What determines coal consumption for residential heating in Kazakhstan and the Kyrgyz Republic? Australas. J. Environ. Manag. 28 (4), 410–432. doi:10.1080/14486563.2021.1989328
Baldini, M., Trivella, A., and Wente, J. W. (2018). The impact of socioeconomic and behavioural factors for purchasing energy efficient household appliances: a case study for Denmark. ENERGY POLICY 120, 503–513. doi:10.1016/j.enpol.2018.05.048
Bhatnagar, M., Mathur, J., and Garg, V. (2018). Determining base temperature for heating and cooling degree-days for India. J. Build. Eng. 18, 270–280. doi:10.1016/j.jobe.2018.03.020
Biglia, A., Gemmell, A. J., Foster, H. J., and Evans, J. A. (2020). Energy performance of domestic cold appliances in laboratory and home environments. ENERGY 204, 117932. doi:10.1016/j.energy.2020.117932
Bloch, H., Rafiq, S., and Salim, R. (2015). Economic growth with coal, oil and renewable energy consumption in China: prospects for fuel substitution. Econ. Model. 44, 104–115. doi:10.1016/j.econmod.2014.09.017
Bridge, B. A., Adhikari, D., and Fontenla, M. (2016). Household-level effects of electricity on income. Energy Econ. 58, 222–228. doi:10.1016/j.eneco.2016.06.008
Broberg, T., and Kazukauskas, A. (2021). Information policies and biased cost perceptions—the case of Swedish residential energy consumption. ENERGY POLICY 149, 112095. doi:10.1016/j.enpol.2020.112095
Brounen, D., Kok, N., and Quigley, J. M. (2012). Residential energy use and conservation: economics and demographics. Eur. Econ. Rev. 56 (5), 931–945. doi:10.1016/j.euroecorev.2012.02.007
Campagnolo, L., and De Cian, E. (2022). Distributional consequences of climate change impacts on residential energy demand across Italian households. Energy Econ. 110, 106020. doi:10.1016/j.eneco.2022.106020
Cesur, R., Tekin, E., and Ulker, A. (2017). Air pollution and infant mortality: evidence from the expansion of natural gas infrastructure. Econ. J. 127 (600), 330–362. doi:10.1111/ecoj.12285
Curtis, J. (2021). Household attributes associated with peak period domestic appliance loads. HELIYON 7 (7), e07559. doi:10.1016/j.heliyon.2021.e07559
Curtis, J., Tovar, M. A., and Grilli, G. (2020). Access to and consumption of natural gas: spatial and socio-demographic drivers. ENERGY POLICY 143, 111614. doi:10.1016/j.enpol.2020.111614
Daioglou, V., van Ruijven, B. J., and van Vuuren, D. P. (2012). Model projections for household energy use in developing countries. ENERGY 37 (1), 601–615. doi:10.1016/j.energy.2011.10.044
Dianshu, F., Sovacool, B. K., and Minh Vu, K. (2010). The barriers to energy efficiency in China: assessing household electricity savings and consumer behavior in Liaoning Province. Energy Policy 38 (2), 1202–1209. doi:10.1016/j.enpol.2009.11.012
Ding, Q., Cai, W., Wang, C., and Sanwal, M. (2017). The relationships between household consumption activities and energy consumption in China—an input-output analysis from the lifestyle perspective. Transformative Innovations a Sustain. Future – Part II 207, 520–532. doi:10.1016/j.apenergy.2017.06.003
Doggart, N., Ruhinduka, R., Meshack, C. K., Ishengoma, R. C., Morgan-Brown, T., Abdallah, J. M., et al. (2020). The influence of energy policy on charcoal consumption in urban households in Tanzania. ENERGY Sustain. Dev. 57, 200–213. doi:10.1016/j.esd.2020.06.002
Du, B., Liu, P., and Li, Z. (2023). Coal power plants transition based on joint planning of power and central heating sectors: a case study of China. Energy 283, 129108. doi:10.1016/j.energy.2023.129108
Falaki, F., Merabtine, A., and Martouzet, D. (2021). A Spatio-Temporal Analysis of electric appliance end-use demand in the residential sector: case study of Tours (France). Sustain. CITIES Soc. 65, 102635. doi:10.1016/j.scs.2020.102635
Fan, J. L., Hu, J. W., and Zhang, X. (2019). Impacts of climate change on electricity demand in China: an empirical estimation based on panel data. Energy 170, 880–888. doi:10.1016/j.energy.2018.12.044
Fan, J. L., Yu, H., and Wei, Y. M. (2015). Residential energy-related carbon emissions in urban and rural China during 1996–2012: from the perspective of five end-use activities. Energy Build. 96, 201–209. doi:10.1016/j.enbuild.2015.03.026
Fan, M., He, G., and Zhou, M. (2020). The winter choke: coal-Fired heating, air pollution, and mortality in China. J. Health Econ. 71, 102316. doi:10.1016/j.jhealeco.2020.102316
Furszyfer Del Rio, D. D., Lambe, F., Roe, J., Matin, N., Makuch, K. E., and Osborne, M. (2020). Do we need better behaved cooks? Reviewing behavioural change strategies for improving the sustainability and effectiveness of cookstove programs. Energy Res. Soc. Sci. 70, 101788. doi:10.1016/j.erss.2020.101788
Garimella, S., Lockyear, K., Pharis, D., El Chawa, O., Hughes, M. T., and Kini, G. (2022). Realistic pathways to decarbonization of building energy systems. Joule 6 (5), 956–971. doi:10.1016/j.joule.2022.04.003
Gillingham, K., and Palmer, K. (2014). Bridging the energy efficiency gap: policy insights from economic theory and empirical evidence. Rev. Environ. Econ. Policy 8, 18–38. doi:10.1093/reep/ret021
Guan, X., Guo, S., Xiong, J., Jia, G., and Fan, J. L. (2023). Energy-related CO2 emissions of urban and rural residential buildings in China: a provincial analysis based on end-use activities. J. Build. Eng. 64, 105686. doi:10.1016/j.jobe.2022.105686
Guo, X., Cai, X., Liu, J., Liu, C., Cheng, Z., Gao, B., et al. (2022). Natural gas exploration progress of sinopec during the 13th Five-Year Plan and prospect forecast during the 14th Five-Year Plan. Nat. Gas. Ind. B 9 (2), 107–118. doi:10.1016/j.ngib.2021.08.022
Hager, T. J., and Morawicki, R. (2013). Energy consumption during cooking in the residential sector of developed nations: a review. Food Policy 40, 54–63. doi:10.1016/j.foodpol.2013.02.003
Han, H., Wu, S., and Zhang, Z. (2018). Factors underlying rural household energy transition: a case study of China. Energy Policy 114, 234–244. doi:10.1016/j.enpol.2017.11.052
Han, X., Poblete-Cazenave, M., Pelz, S., and Pachauri, S. (2022). Household energy service and home appliance choices in urban China. Energy Sustain. Dev. 71, 263–278. doi:10.1016/j.esd.2022.09.021
Harrington, L., Aye, L., and Fuller, B. (2018). Impact of room temperature on energy consumption of household refrigerators: lessons from analysis of field and laboratory data. Appl. Energy 211, 346–357. doi:10.1016/j.apenergy.2017.11.060
Hart, M., and de Dear, R. (2004). Weather sensitivity in household appliance energy end-use. ENERGY Build. 36 (2), 161–174. doi:10.1016/j.enbuild.2003.10.009
He, J., Qing, C., Guo, S., Zhou, W., Deng, X., and Xu, D. (2022). Promoting rural households’ energy use for cooking: using Internet. Technol. Forecast. Soc. Change 184, 121971. doi:10.1016/j.techfore.2022.121971
Hepburn, C., Qi, Y., Stern, N., Ward, B., Xie, C., and Zenghelis, D. (2021). Towards carbon neutrality and China’s 14th Five-Year Plan: clean energy transition, sustainable urban development, and investment priorities. Environ. Sci. Ecotechnology 8, 100130. doi:10.1016/j.ese.2021.100130
Hu, S., Yan, D., Guo, S., Cui, Y., and Dong, B. (2017). A survey on energy consumption and energy usage behavior of households and residential building in urban China. ENERGY Build. 148, 366–378. doi:10.1016/j.enbuild.2017.03.064
Huang, Y., and Matsumoto, K. (2021). Drivers of the change in carbon dioxide emissions under the progress of urbanization in 30 provinces in China: a decomposition analysis. J. Clean. Prod. 322, 129000. doi:10.1016/j.jclepro.2021.129000
Jiang, H. D., Liu, L. J., Dong, K., and Fu, Y. W. (2022). How will sectoral coverage in the carbon trading system affect the total oil consumption in China? A CGE-based analysis. Energy Econ. 110, 105996. doi:10.1016/j.eneco.2022.105996
Jiang, H. D., Purohit, P., Liang, Q. M., Liu, L. J., and Zhang, Y. F. (2023). Improving the regional deployment of carbon mitigation efforts by incorporating air-quality co-benefits: a multi-provincial analysis of China. Ecol. Econ. 204, 107675. doi:10.1016/j.ecolecon.2022.107675
Jiang, H., Dong, X., Jiang, Q., and Dong, K. (2020). What drives China’s natural gas consumption? Analysis of national and regional estimates. Energy Econ. 87, 104744. doi:10.1016/j.eneco.2020.104744
Jiang, Y., and Wu, X. (2010). Annual report on China building energy efficiency. Beijing: China Architecture Building Press.
Lee, K., Baek, H. J., and Cho, C. (2014). The estimation of base temperature for heating and cooling degree-days for South Korea. J. Appl. Meteorology Climatol. 53 (2), 300–309. doi:10.1175/JAMC-D-13-0220.1
Lee, S. J., and Song, S. Y. (2022a). Determinants of residential end-use energy: effects of buildings, sociodemographics, and household appliances. Energy Build. 257, 111782. doi:10.1016/j.enbuild.2021.111782
Lee, S. J., and Song, S. Y. (2022b). Time-series analysis of the effects of building and household features on residential end-use energy. Appl. Energy 312, 118722. doi:10.1016/j.apenergy.2022.118722
Lei, M., Cai, W., Liu, W., and Wang, C. (2022). The heterogeneity in energy consumption patterns and home appliance purchasing preferences across urban households in China. Energy 253, 124079. doi:10.1016/j.energy.2022.124079
Li, L., and Taeihagh, A. (2020). An in-depth analysis of the evolution of the policy mix for the sustainable energy transition in China from 1981 to 2020. Appl. Energy 263, 114611. doi:10.1016/j.apenergy.2020.114611
Li, Z. G., Cheng, H., and Gu, T. Y. (2019). Research on dynamic relationship between natural gas consumption and economic growth in China. Struct. Change Econ. Dyn. 49, 334–339. doi:10.1016/j.strueco.2018.11.006
Liu, J., Yang, Q., Zhang, Y., Liu, J., and Jiang, X. (2020). Comparison of double-dose vs standard-dose oseltamivir in the treatment of influenza: a systematic review and meta-analysis. Sci. Geogr. Sin. 40 (6), 918–926. doi:10.1111/jcpt.13203
Malla, S. (2022). An outlook of end-use energy demand based on a clean energy and technology transformation of the household sector in Nepal. Energy 238, 121810. doi:10.1016/j.energy.2021.121810
Matsumoto, S. (2016). How do household characteristics affect appliance usage? Application of conditional demand analysis to Japanese household data. ENERGY POLICY 94, 214–223. doi:10.1016/j.enpol.2016.03.048
Meier, A., Lin, J., Liu, J., and Li, T. (2004). Standby power use in Chinese homes. Energy Environ. Resid. Build. China 36 (12), 1211–1216. doi:10.1016/j.enbuild.2003.10.011
Meireles, I., Sousa, V., Bleys, B., and Poncelet, B. (2022). Domestic hot water consumption pattern: relation with total water consumption and air temperature. Renew. Sustain. Energy Rev. 157, 112035. doi:10.1016/j.rser.2021.112035
Murata, A., Kondou, Y., Hailin, M., and Weisheng, Z. (2008). Electricity demand in the Chinese urban household-sector. Appl. Energy 85 (12), 1113–1125. doi:10.1016/j.apenergy.2007.05.008
NBS (2021). Seventh national Census. China: National Bureau of Statistics of China. Avaliable At: http://www.stats.gov.cn/.
NDRC (2022). City gas pipelines and other aging renewal implementation plan (2022-2025). General Office of the State Council of the People’s Republic of China. Avaliable At: https://www.gov.cn/zhengce/content/2022-06/10/content_5695096.htm.
Nie, H., and Kemp, R. (2014). Index decomposition analysis of residential energy consumption in China: 2002–2010. Appl. Energy 121, 10–19. doi:10.1016/j.apenergy.2014.01.070
Nie, H., Zhou, T., Lu, H., and Huang, S. (2021). Evaluation of the efficiency of Chinese energy-saving household appliance subsidy policy: an economic benefit perspective. Energy Policy 149, 112059. doi:10.1016/j.enpol.2020.112059
Niu, H., He, Y., Desideri, U., Zhang, P., Qin, H., and Wang, S. (2014). Rural household energy consumption and its implications for eco-environments in NW China: a case study. Renew. Energy 65, 137–145. doi:10.1016/j.renene.2013.07.045
Pachauri, S., and Jiang, L. (2008). The household energy transition in India and China. ENERGY POLICY 36 (11), 4022–4035. doi:10.1016/j.enpol.2008.06.016
Parikh, K. S., and Parikh, J. K. (2016). Realizing potential savings of energy and emissions from efficient household appliances in India. Energy Policy 97, 102–111. doi:10.1016/j.enpol.2016.07.005
Reyes, A. (2021). Revealing the contribution of informal settlements to climate change mitigation in Latin America: a case study of isidro fabela, Mexico city. Sustainability 13 (21), 12108. doi:10.3390/su132112108
Romero-Jordán, D., and del Río, P. (2022). Analysing the drivers of the efficiency of households in electricity consumption. Energy Policy 164, 112828. doi:10.1016/j.enpol.2022.112828
RUC (2016). Chinese household energy consumption research report 2015 (National Academy of Development and Strategy, Renmin University of China). Avaliable At: http://nads.ruc.edu.cn/upfile/file/20160524085312_906914_35342.pdf.
Shi, X. (2019). Inequality of opportunity in energy consumption in China. Energy Policy 124, 371–382. doi:10.1016/j.enpol.2018.09.029
Sinton, J. E., Smith, K. R., Peabody, J. W., Yaping, L., Xiliang, Z., Edwards, R., et al. (2004). An assessment of programs to promote improved household stoves in China. Energy Sustain. Dev. 8 (3), 33–52. doi:10.1016/S0973-0826(08)60465-2
Tao, Y., Wu, Y., Zhou, J., Wu, M., Wang, S., Zhang, L., et al. (2021). How to realize the effect of air pollution control? A hybrid decision framework under the fuzzy environment. J. Clean. Prod. 305, 127093. doi:10.1016/j.jclepro.2021.127093
Wang, S., Sun, S., Zhao, E., and Wang, S. (2021). Urban and rural differences with regional assessment of household energy consumption in China. Energy 232, 121091. doi:10.1016/j.energy.2021.121091
Wang, W., and Zhang, M. (2015). Direct and indirect energy consumption of rural households in China. Nat. Hazards 79 (3), 1693–1705. doi:10.1007/s11069-015-1921-5
Xu, X., Han, L., and Lv, X. (2016). Household carbon inequality in urban China, its sources and determinants. Ecol. Econ. 128, 77–86. doi:10.1016/j.ecolecon.2016.04.015
You, K., Yu, Y., Li, Y., Cai, W., and Shi, Q. (2021). Spatiotemporal decomposition analysis of carbon emissions on Chinese residential central heating. Energy Build. 253, 111485. doi:10.1016/j.enbuild.2021.111485
Zhang, J., Yu, B., and Wei, Y. M. (2018). Heterogeneous impacts of households on carbon dioxide emissions in Chinese provinces. Appl. Energy 229, 236–252. doi:10.1016/j.apenergy.2018.07.110
Zhang, M., Ding, S., Pang, J., and Wang, W. (2021). The effect of indirect household energy consumption on PM 2.5 emission in China: an analysis based on CLA method. J. Environ. Manag. 279, 111531. doi:10.1016/j.jenvman.2020.111531
Zhang, M., Liu, J., Liu, L., and Zhou, D. (2023). Inequality in urban household energy consumption for 30 Chinese provinces. Energy Policy 172, 113326. doi:10.1016/j.enpol.2022.113326
Zhao, Q., Gao, W., Su, Y., and Wang, T. (2023a). Carbon emissions trajectory and driving force from the construction industry with a city-scale: a case study of Hangzhou, China. Sustain. Cities Soc. 88, 104283. doi:10.1016/j.scs.2022.104283
Zhao, Q., Gao, W., Su, Y., Wang, T., and Wang, J. (2023b). How can C&D waste recycling do a carbon emission contribution for construction industry in Japan city? Energy Build. 298, 113538. doi:10.1016/j.enbuild.2023.113538
Zhao, X., Li, N., and Ma, C. (2012). Residential energy consumption in urban China: a decomposition analysis. ENERGY POLICY 41, 644–653. doi:10.1016/j.enpol.2011.11.027
Zheng, X., Wei, C., Qin, P., Guo, J., Yu, Y., Song, F., et al. (2014). Characteristics of residential energy consumption in China: findings from a household survey. ENERGY POLICY 75, 126–135. doi:10.1016/j.enpol.2014.07.016
Zhou, S., and Teng, F. (2013). Estimation of urban residential electricity demand in China using household survey data. Energy Policy 61, 394–402. doi:10.1016/j.enpol.2013.06.092
Zhou, Z., Wu, W., Wang, X., Chen, Q., and Wang, O. (2009). Analysis of changes in the structure of rural household energy consumption in northern China: a case study. Renew. Sustain. Energy Rev. 13 (1), 187–193. doi:10.1016/j.rser.2007.05.006
Zhu, M., Huang, Y., Wang, S. N., Zheng, X., and Wei, C. (2023). Characteristics and patterns of residential energy consumption for space cooling in China: evidence from appliance-level data. Energy 265, 126395. doi:10.1016/j.energy.2022.126395
Keywords: household end-use, energy consumption, subdivide model, urban area China, household characteristics
Citation: Wang T, Zhao Q, Gao W and He X (2023) Subdividing end-use energy consumption based on household characteristics and climate conditions: insights from urban China. Front. Energy Res. 11:1267975. doi: 10.3389/fenrg.2023.1267975
Received: 27 July 2023; Accepted: 03 October 2023;
Published: 13 October 2023.
Edited by:
Maria Cristina Piccirilli, University of Florence, ItalyReviewed by:
Hong-Dian Jiang, China University of Geosciences, ChinaJay Zarnikau, The University of Texas at Austin, United States
Copyright © 2023 Wang, Zhao, Gao and He. This is an open-access article distributed under the terms of the Creative Commons Attribution License (CC BY). The use, distribution or reproduction in other forums is permitted, provided the original author(s) and the copyright owner(s) are credited and that the original publication in this journal is cited, in accordance with accepted academic practice. No use, distribution or reproduction is permitted which does not comply with these terms.
*Correspondence: Qinfeng Zhao, zhaoqinfeng0122@163.com; Weijun Gao, gaoweijun@me.com