Yaw misalignment in powertrain degradation modeling for wind farm control in curtailed conditions
 Farid Khazaeli Moghadam
 Zhen Gao
 Valentin Chabaud
 Spyridon Chapaloglou3
- 1Department of Marine Technology, Norwegian University of Science and Technology, Trondheim, Norway
- 2School of Naval Architecture, Ocean and Civil Engineering, Shanghai Jiao Tong University, Shanghai, China
- 3Energy Systems Department, SINTEF Energy Research, Trondheim, Norway
A framework characterizing the degradation of wind turbines for use in multiple-input damage-aware farm control is suggested. The focus is on the fatigue damage of the powertrain (drivetrain + generator) system, but the methodology may be extended to other components. A database of steady-state damage analyses for different operating conditions (average wind speeds, turbulence levels, power demands, and yaw misalignment angles) using aero-hydro-servo-elastic simulations is first generated. Then, a weighted damage index based on probabilistic long-term fatigue damage analysis of the powertrain system components is suggested and used to represent degradation at the farm level for control purposes. The focus is on curtailed conditions where the farm controller dispatches power commands to individual turbines in order to track a demanded power reference (rather than seeking to maximize power) at the farm level. As a secondary objective, the controller seeks to mitigate degradation through a smart combination of power commands and yaw offset angles, making use of the weighted degradation index. The potential of the proposed approach is demonstrated through a case study on the TotalControl Reference Wind Power Plant in a FLORIS-based simulation framework. The proposed farm controller is compared with the conventional one without damage mitigation feature and with damage mitigation but without yaw angle as the control input. It is found that combining yawing and downregulation effectively slows down degradation on the main bearing and powertrain as a whole.
1 Introduction
Enhancing the cost-effectiveness of offshore wind is unanimously cited as essential to solve the energy crisis, and the importance of optimizing the operation and maintenance of wind farms is underscored. Regarding operation, an aspect that takes increasing space in wind farm operators’ economics is the provision of ancillary services to grid operators. In particular, farm curtailment services for secondary (directly asked by the grid operator) or tertiary (through intraday bidding in electricity markets) frequency support is expected to increase dramatically as the penetration of intermittent energy sources (wind and solar) into the grid increases (Yasuda et al., 2022; Wiser et al., 2023). In this context, wind farms are asked to provide a desired power below the maximum available in the wind, leaving some freedom in how individual turbine power outputs should be dispatched. Maintenance, on the other hand, refers more to the degradation of wind energy systems over time, associated with repair and downtime costs, which is all the more acute as wind farms move further from the shore. Recent literature has developed digital twin models based on simulation or operational data for monitoring the health condition and optimizing the operation of the various electrical, mechanical, and structural systems of wind turbines and power plants (Xia and Zou, 2023; Moghadam and Nejad, 2022; van Dinter et al., 2022). A powertrain system consisting of the gearbox, shafts, main bearings, back-to-back (BTB) frequency converter, generator, and rotor is on average responsible for approximately 50% of wind turbine total failures and downtime (Pfaffel et al., 2017). Among these, powertrain components such as bearings and gearbox are prone to fatigue damage, which greatly depends on how much power the turbine is asked to produce (Moghadam et al., 2023). This lays the motivation behind this study, as a way to reduce the levelized cost of energy (LCOE) of wind power, combining wind farm curtailment with degradation mitigation by smart power dispatch to influence the remaining useful lifetime of powertrain components, in order to reduce maintenance costs while making profit from ancillary service provision.
However, this requires a multidisciplinary and multiscale simulation framework for development and analysis. In particular, complexity has to be reduced by using a simple indicator for degradation, avoiding the requirement for running turbine- and component-scale models at the farm level. To this end, Moghadam et al. (2023) suggested a mapping between the damage index and operating conditions (wind speed, turbulence intensity, and power set point) based on turbine-level simulations and a quasi-static degradation model. High-fidelity physics-based (state-space models of varying degrees of complexity with constant/time-variant lumped parameters (Moghadam et al., 2021; Zhang et al., 2021; Moghadam and Desch, 2023), multi-body (Peeters et al., 2006) and finite element (Hart et al., 2020), and data-driven (random forest; Azzam et al., 2022) models and artificial neural network (Azzam et al., 2021) have been used in the literature to estimate loads on powertrain components, but the overall complexity sets a limit to their applicability. Higher fidelity would also be beneficial regarding the effect of wake on powertrain, especially when wake flow impacts only part of the downstream turbine’s rotor as has been identified by van Binsbergen et al. (2020) using FAST.Farm simulations featuring the dynamic wake meandering model were carried out by Madsen et al. (2010). Again, with complexity as the limiting factor and with farm-level use in mind, Moghadam et al. (2023) modeled wake-added turbulence as a simple increase in turbulence intensity in the ambient wind spectrum as recommended by the IEC standard IEC 61400-1:2019 (2019). This way, wake-added turbulence is readily encompassed by adjusting turbulence intensity as an input parameter when reading in the database.
Another multidisciplinary bottleneck lies in modeling local wind variations between turbines, since they drive the local available power that is a key input to power dispatch—setting an upper bound to the individual set points. Variations in mean wind speed due to wake-induced velocity deficit are typically readily included in available farm simulation tools. Farm-wide wind fluctuations due to turbulence are, however, not trivial to include, although their effect on power dispatch is tremendous. The mid-fidelity approach used in Moghadam et al. (2023) is based on models for synthetic turbulence generation that have been specifically developed for farm-wide applications (Chabaud, 2023, based on Sørensen et al., 2008).
Damage mitigation in curtailed operations is receiving increasing attention in the literature (Knudsen et al., 2015; Stock et al., 2020; Merz et al., 2021; Sood et al., 2023). However, the powertrain has not been the focus as modeling fatigue damage on its components requires multidisciplinary collaboration and a change of metric from damage-equivalent load to fatigue damage (Moghadam et al., 2023; Sood et al., 2023). Also, modeling wind fluctuations has been either simplistic (based on frozen turbulence assumption, only valid at the turbine level) or exceedingly costly (based on large eddy simulations, LES), limiting the studies’ validity or flexibility, respectively.
Yaw angle offset control has always been used in the context of power maximization: the basic use is to follow wind direction and reduce misalignment, and the advanced use is wake steering to reduce wake losses on downstream turbines. In this context, the influence of yaw misalignment on drivetrain loads has been studied by Cardaun et al. (2019) and van Binsbergen et al. (2020), where the authors showed that yaw misalignment does not necessarily have a negative impact; however, a combination with the farm power curtailment controller has not been studied. This work adds a new dimension to the previous study by Moghadam et al. (2023), showing how yaw angle offset and power-tracking active controllers can cooperate at the farm level to reduce fatigue damage and spread it among turbines. To this end, a powertrain fatigue damage analysis is performed considering different power set points and yaw offset angles in addition to wind conditions. The resulting damage database is utilized for tuning the farm controller gains. The potential of the proposed control scheme is then demonstrated in case studies.
The main contributions of this article are
•developing a powertrain system fatigue damage database that encompasses yaw misalignment angle variations in addition to wind field and demand variations,
•designing a power tracking and yaw angle offset coordinated controller by using the developed database to enhance the load mitigation feature of the farm controller, and
•demonstrating the use of the database within the proposed farm controller and its potential to steer farm-wide degradation.
The article is organized as follows: the database approach, the farm controller, and the utilization of the database are described in Section 2; the results related to database generation and demonstration are discussed in Section 3; and finally, the article is concluded in Section 4.
2 Methodology
2.1 Database generation
The methodology described in Moghadam et al. (2023) with yaw misalignment added is shown in Figure 1. The powertrain system damage database as a function of wind speed, turbulence intensity, power demand, and yaw misalignment angle is created by turbine-level aero-hydro-servo-elastic simulations in NREL’s OpenFAST—the servo part uses a custom version of the DTU wind energy controller (Meng et al., 2020; Hansen and Henriksen, 2013) featuring active power derating; the hydro part is not included at this stage and left as further work. The steps are
•generating input turbulent wind field by NREL’s TurbSim with desired mean wind speed and turbulence intensity,
•running the aero-hydro-servo-elastic simulation with the desired power command and yaw misalignment angle to obtain global powertrain loads,
•propagating these loads to powertrain subcomponents using a quasi-static approach,
•calculating the load and stress of each subcomponent, and
•calculating the fatigue damage of each subcomponent and the weighted damage index.
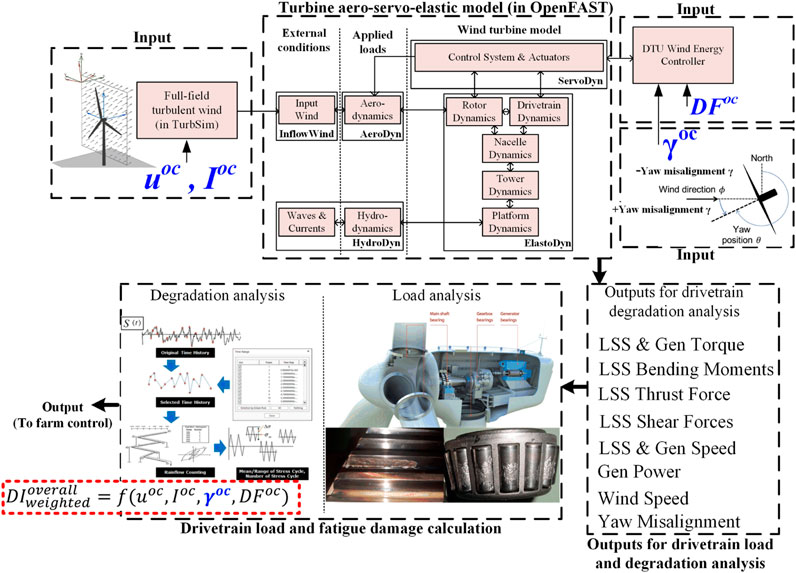
FIGURE 1. Powertrain damage vs. wind speed, yaw misalignment angle, and power demand database generation by single-turbine simulation (adapted from Moghadam et al., 2023).
The last step is based on a powertrain degradation model, further detailed in the following:
•The physics-based quasi-static model proposed by Moghadam et al. (2023) is employed.
•The load elements of the bearings and gears of the powertrain, then the equivalent load of the bearings and maximum stress of the gears are calculated.
•The load calculation is carried out based on the types of components, basic geometrical parameters, powertrain input loads, and safety factors from ISO 281 and ISO 6336 standards.
•Rainflow cycle counting and Miner’s rule are applied to calculate the fatigue damage of the gears.
•Load–duration–distribution and Miner’s rule are applied to calculate the fatigue damage of the bearings.
The database created by turbine-level simulations establishes the damage index (an index that represents the long-term fatigue damage of all the drivetrain components) as a function of environmental (average wind speed and turbulence intensity) and operational (generated power and yaw misalignment angle) variables. The wake effect for individual turbines is considered by the reduced mean wind speed and the increased wake-induced turbulence intensity. When used in farm control, it is desirable to characterize degradation via a scalar quantity, here called the damage index. Depending on the control objective, the damage index may be specific to a single powertrain component or aggregated over all components. In the latter case, a weighted damage index may be used based on the vulnerability of each component. In this article, a simple weighting is suggested based on probabilistic long-term fatigue damage analysis:
where uoc, Ioc, and γoc are, respectively, the mean value of wind speed, the turbulence intensity, and the yaw misalignment angle during the operating condition oc during the time interval t.
2.2 Farm control and database utilization
The wind farm controller coordinates the operation of the turbine’s active power—through pitch angle and generator torque—and yaw controllers within the farm to meet the power demand while steering degradation. The proposed farm power tracking controller is an adapted version from Moghadam et al. (2023); Merz et al. (2021) now augmented with a yaw angle offset component. The integration of the powertrain degradation database to the farm controller is shown in Figure 2, featuring the yaw angle offset as an additional control input for the damage mitigation function.
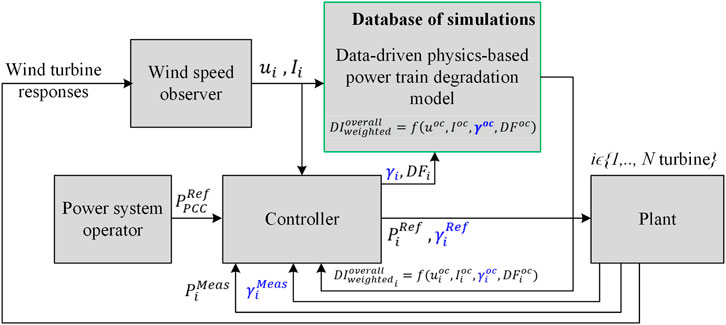
FIGURE 2. Utilization of powertrain degradation database with the additional wake steering dimension for the farm power tracking controller design (adapted from Moghadam et al., 2023).
The wind farm control layout is presented in Figure 3. A distributed architecture based on individual PI regulators and time-adaptive gains is adopted. The wind farm controller is responsible for dispatching the turbines’ power, Pc,i(t), such that the reference wind farm power, at the point of common coupling (PCC), Ppcc(t), is tracked. Each individual turbine controller (TC) consists of a feedforward term and a feedback loop, as shown in Figure 3. The former defines the bulk part of the PCC power reference requested from the i-th turbine through the gain λi1(t). The latter uses the farm output power error at the PCC, ϵpcc(t), by first dispatching between turbine regulators through the gains λi2(t) and then using it to compensate for the tracking errors through the proportional and integral feedback gains, KP and KI, respectively. It is worth mentioning that the power-sharing quality is directly affected by the locally available power, Pa,i(t), and smart anti-windup mechanisms are necessary to prevent sudden power injections due to changing inflow conditions from weather, turbulence, and wakes (ui(t)). The participation of each turbine in tracking the farm power output is adjusted based on the turbine’s accumulated damage and through time-dependent gains λij(t) (see Section 2), which are also communicated among the turbines and encapsulate information from the database of the weighted damage index (see Section 2.1). The additional decision feature that is included, when compared to Moghadam et al. (2023), allows for setting the yaw angle offset of the damaged turbine(s), γi(t), to the value corresponding to the lowest possible damage accumulation, under specified environmental and operational conditions (power dispatch). In this sense, the updated damage database, which includes the extra dimension of the yaw angle offset, is used instead, further enhancing the damage mitigation capabilities for the damaged turbines. The adaptive gains λij(t) (j ∈ {1, 2}) are defined as
where N is the number of turbines of the farm, and
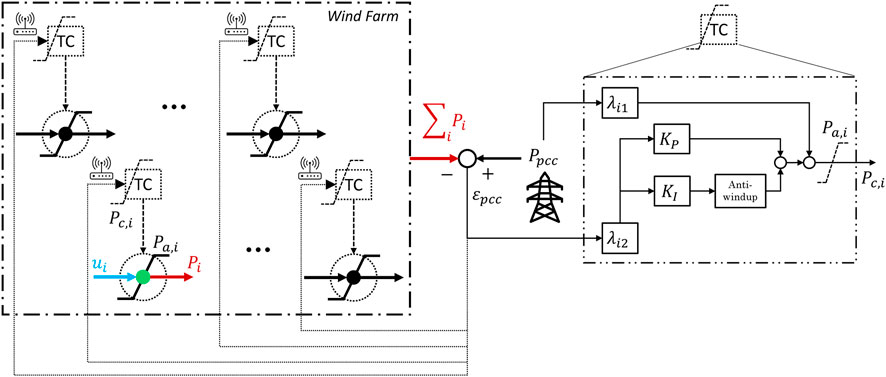
FIGURE 3. Wind farm control configuration and schematic of the distributed controller.
The yaw angle controller is an open-loop add-on. Optimal yaw misalignment values are first found, then translated to yaw angle offset commands considering wind direction1. Losses induced by yaw misalignment are compensated through the PI feedback of the power dispatch control loop. Note that yaw angle control is not meant to increase power production on downstream turbines through wake steering in this context. Wake deflection is not the focus and is included in the modeling framework only as a side effect. The wake effects are modeled through the simulation framework presented in Moghadam et al. (2023), employing a modified, quasi-steady version of NREL’s FLORIS farm flow model, which is capable of capturing the effect of the derating commands to the turbines.
3 Results and discussion
3.1 Case study
The conditions of the case study simulated to generate the database are listed as follows:
•The turbine model is DTU 10 MW reference wind turbine (Bak et al., 2013) fixed-bottom installed on a reference monopile as shown in Figure 4. The 10 MW powertrain system design, configuration, and selection of the subcomponents for the fatigue damage analysis are based on Moghadam and Nejad (2020), Wang et al. (2020), and Moghadam et al. (2023);
•Design Load Case (DLC) 1.2 from IEC 61400-1 IEC 61400-1:2019 (2019) (fatigue damage in normal operation) with wind field parameters adjusted to offshore conditions using IEC 61400-3 IEC 61400-3-1:2019 (2019);
•In the simulations, the average wind speed changes from 4 to 25 m/s in steps of 3 m/s with the resolution of 1 m/s between 7 and 13 m/s, which is the region that is rated with a high chance of occurrence. Effective turbulence intensity or the turbulence intensity by taking into consideration the wake-added turbulence changes from 0% to 32% in steps of 8%. This range is selected based on the results reported by Frandsen (2007). The derating factor DF changes from 0% to 100% in steps of 25%. Yaw misalignment angle changes from −20° to +20° in steps of 10°.
•For each case, six independent 1-h wind field realizations, with the first 10 min removed, are run. In total, 9,000 independent simulations have been run.
•The weighted damage index is calculated using a simple weighted integral along the wind speed only (other dimensions are fixed to their input value) using a standard probability distribution from IEC 61400-1:2019 (2019), wind turbine class I.
•Standard settings in FLORIS are used, i.e., the Gauss and GCH wake model with default parameters (Laboratory, 2023).
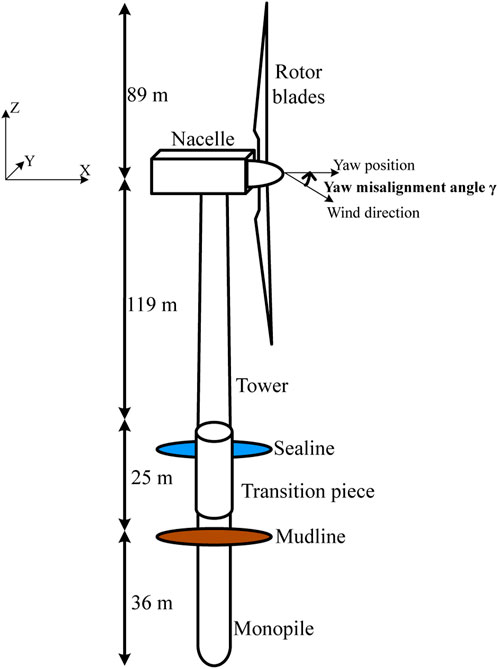
FIGURE 4. DTU 10 MW reference wind turbine installed on a reference monopile.
3.2 Controller performance
The performance of the DTU controller featuring derating functionality is shown in Figure 5, which shows how the rotor speed and pitch regulators cooperate at different wind speeds and yaw misalignment angles to achieve different values of power demand. In this figure, ωrot is the average rotor speed and β is the average blade pitch angle. As seen, the yaw misalignment angle has a negligible influence on the controller’s operating state.
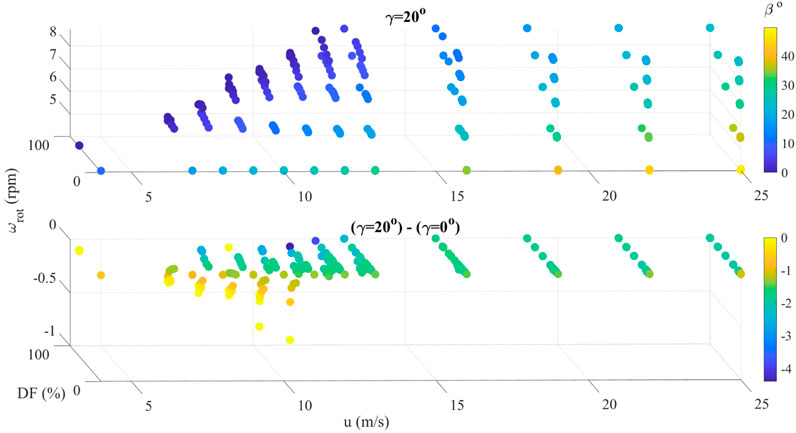
FIGURE 5. DTU controller performance in different yaw misalignment angles.
3.3 Powertrain degradation analysis
Figure 6 shows the selected time series of dynamic equivalent loads of the bearings (the gearbox-side main bearing, the gearbox high-speed shaft drive end bearing, and the generator non–drive end bearing) and contact and root bending stresses of the gears (the planet gears of the first planetary gear stage) as a function of the average wind speed, turbulence, yaw misalignment angle, and power demand variations. It can be seen that yaw misalignment has the largest influence on the main bearing load in terms of both mean value and oscillation amplitude. Further investigation showed that the main shaft bending moment around the z-axis (yaw moment) is the main contributor.
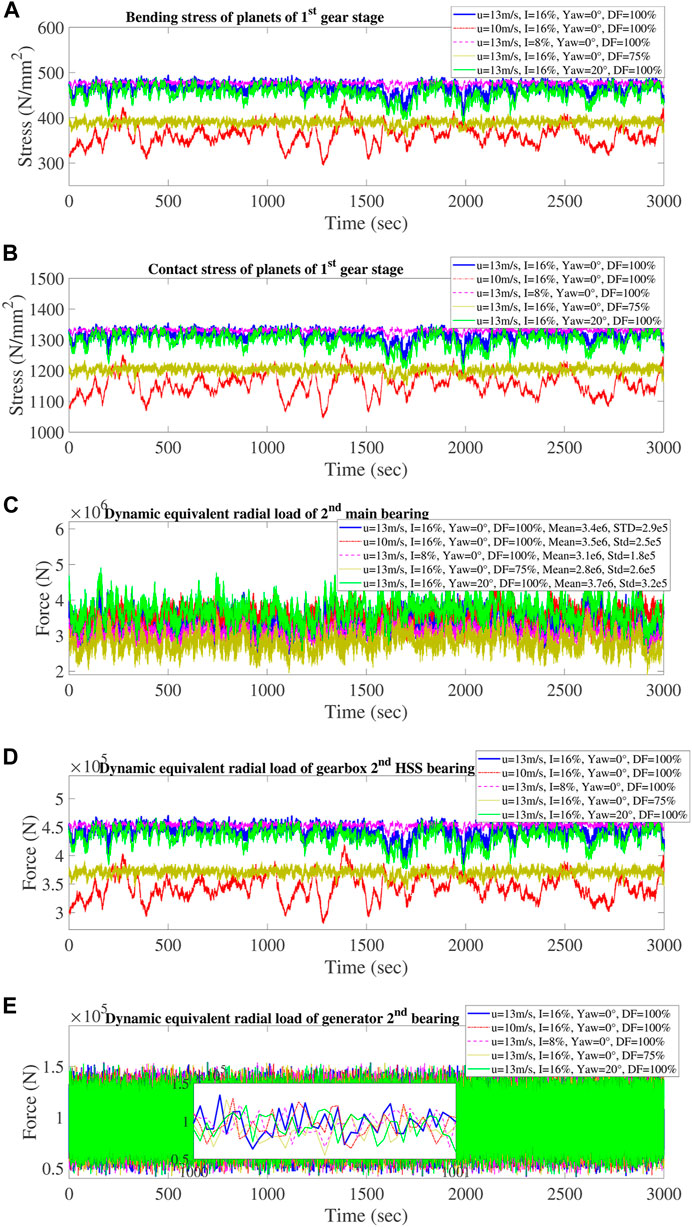
FIGURE 6. Estimated powertrain components load and stress for different load conditions. (A) Bending stress for the planet gears—stage 1. (B) Contact stress for the planet gears—stage 1. (C) Main bearing MB-B equivalent radial dynamic load. (D) Gearbox bearing HSS-DE equivalent radial dynamic loads. (E) Generator bearing GEN-NDE equivalent radial dynamic load.
The results of the long-term fatigue damage analysis of the powertrain system are shown in Figure 7. This sets the base for selecting the weight factors αi in Section 2.1 to calculate the weighted average damage index. In practice, the main bearings dominate damage in most operating conditions. At very high wind speeds, the planet gears take over. The contributions from the other components to the damage index are minor.
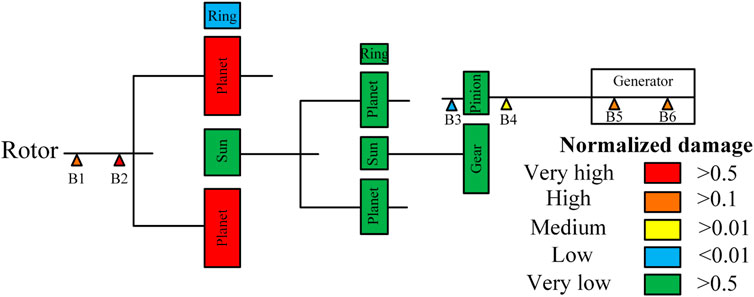
FIGURE 7. Vulnerability map of the powertrain while taking into consideration the wake steering controller.
3.4 Turbine-level database
A global overview of the degradation database mapping the damage index to operating conditions is shown in Figure 8, which maps the weighted damage index of the powertrain under consideration to mean wind speed, turbulence intensity, derating factor, and yaw misalignment angle. The damage ratio in this figure is defined as the ratio of the weighted damage index at a non–zero yaw misalignment over its zero yaw misalignment value. It shows the conditions when yawing is beneficial or detrimental, strongly depending on the yawing direction. The rotational direction of the rotor is the same for positive and negative yaw misalignment angles. As a result, the angle of attack for each blade cross-section due to the combined effect of the inflow velocity and the rotational velocity will be different for positive and negative yaw angles. This gives different induced velocities and the resulting aerodynamic forces on the blade cross-sections. As a result, the drivetrain fatigue damages are also different for positive and negative yaw angles, as shown in Figure 9.
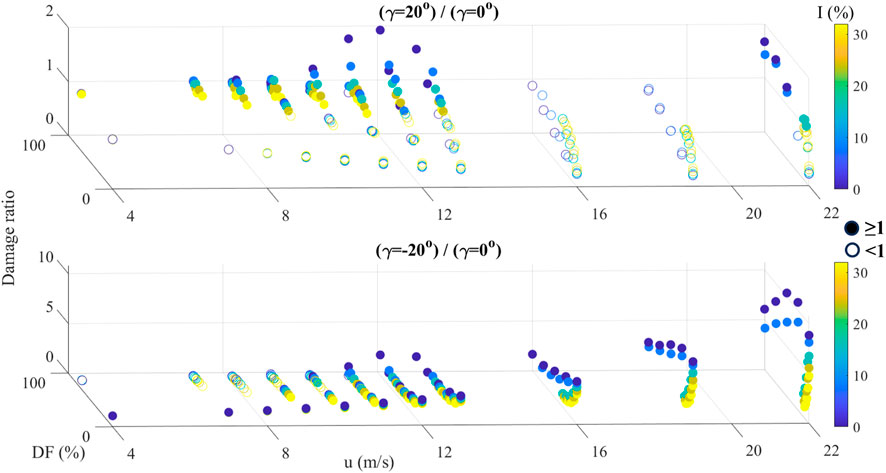
FIGURE 8. Powertrain weighted damage index vs. mean wind speed, turbulence intensity, power demand, and yaw misalignment conditions. Plain/hollow markers show conditions when yawing is detrimental/beneficial, respectively, regarding the overall powertrain fatigue damage.
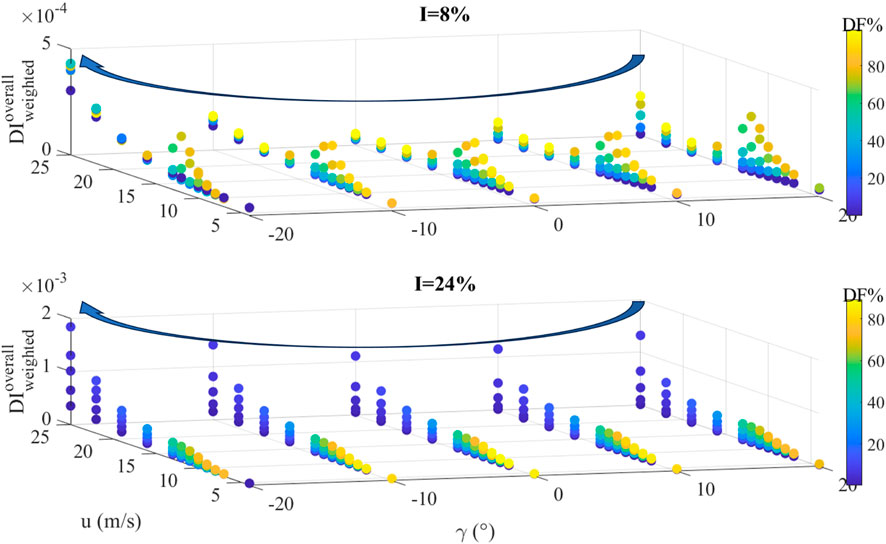
FIGURE 9. 3D sensitivity analysis to see the influence of yaw misalignment angle on the powertrain damage for a wide range of wind speed variations.
Figure 9 shows the normal operation (not downregulated) case in more detail, where it is clear that yawing in any direction would mostly increase damage. However, by crossing observations with Figure 8, it is seen that in highly downregulated conditions, yawing may prove beneficial. This may in turn be exploited by the farm controller to reduce damage whenever the demand is met, as demonstrated in Section 3.5. Multiple damage indices for a given wind speed and yaw angle in Figure 9 are associated with the different values of power demand. As the farm is operating in the power curtailment mode of operation, the power set point and therefore the generated power of each turbine can be different from the available power.
To gain an understanding of how each parameter participates in the damage, a sensitivity analysis is performed, with results as presented in Figure 10. Figure 10B shows that damage increases as turbulence intensity increases, as expected. Figure 10A shows that the damage index increases as the mean wind speed increases up to the rated mean wind speed 11.4 m/s, due to the increased mean thrust force and its effect on main bearing damage. After the rated wind speed is reached, there is a mitigating trend in the overall damage attributed to the reduction of thrust force (both mean value and fluctuations) through pitch control. For high wind speeds and/or turbulence intensities, gears dominate damage—the damage of gears is mainly driven by mean torque and torque oscillations, not thrust—showing a different damage pattern increasing linearly with demanded power. More interesting is the relationship between damage and yaw misalignment angle shown in Figure 10C, depicting in more detail the preliminary observations on a possible reduction of damage through yawing in downregulated conditions. It shows that the combined effect of downregulating and yawing is nontrivial and cannot be generalized in a simple control law; case-by-case lookup in the database should be used in the farm controller.
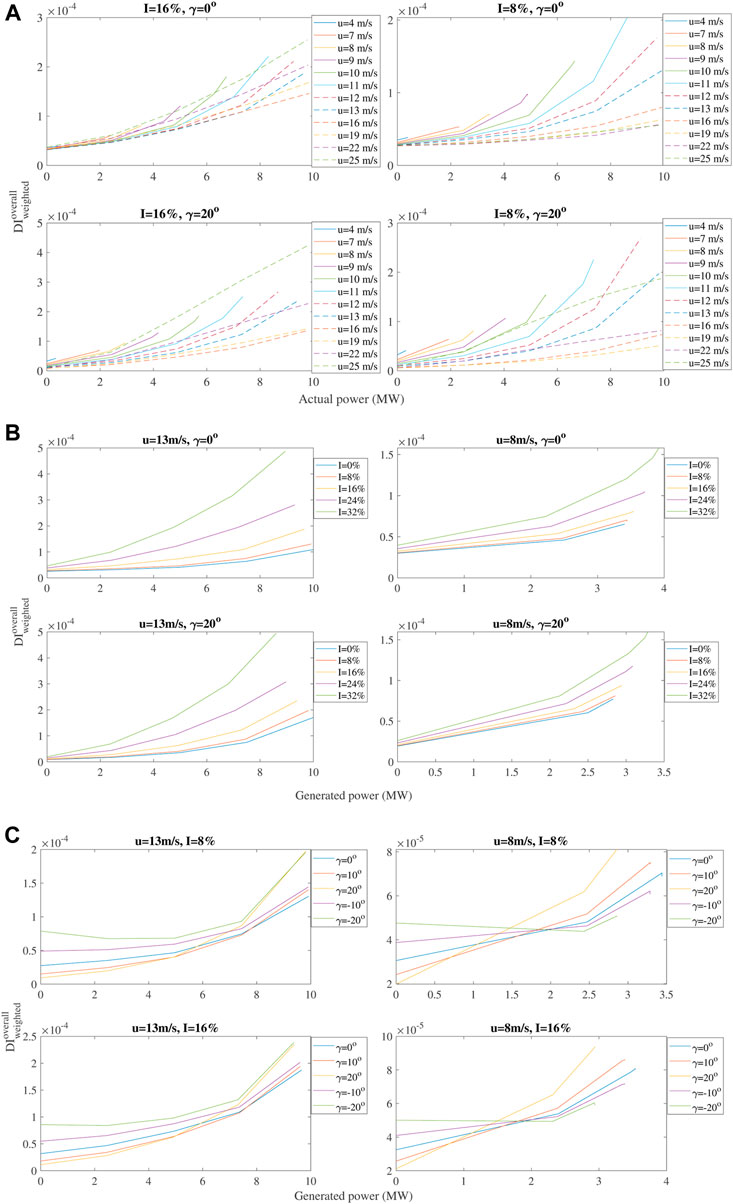
FIGURE 10. Powertrain fatigue damage vs. turbine-generated power sensitivity analysis. (A) Damage index vs. generated power at different wind speeds. (B) Damage index vs. generated power at different turbulence intensities. (C) Damage index vs. generated power at different yaw misalignment angles.
3.5 Applications in farm control
The same setup as used in Moghadam et al. (2023) has been chosen for comparability:
•Turbine layout: 32 turbines, staggered, 5-diameter spacing (Andersen et al., 2018).
•Wind speed: 12.4 m/s—damage is largely dominated by the main bearing.
•Wind direction: North, i.e., perpendicular to dominant (featuring maximum wake effect, eight rows with 5D spacing, starting from turbines T29 to T32).
•Wind fluctuations: obtained from the model of Sørensen et al. (2008) and Vigueras-Rodríguez et al. (2010, 2012).
•Tunable mapping functions gi: same for both i ∈ {1, 2} readings.
It introduces an affine re-scaling of the damage index DIi, which ensures that turbines with low DIi values will contribute more to the power tracking task (gi takes values closer to 1), while turbines with higher DIi values will contribute less (gi takes values closer to 0.5) and with a minimum contribution that is lower bound by half of the turbine’s naive contribution (without any damage information). This tuning is not cost-optimized and only devised for qualitative demonstration purposes. The sup and inf operators represent the supremum and infimum for the set DIi.
The goal is to show how the yaw angle can be used by the controller as an additional control input to improve the fatigue mitigation feature. In total, 18 simulations are run corresponding to two control objective scenarios, three control methods, and three curtailment profiles. The two control objective scenarios are
•Scenario 1: All turbines are equally damaged. The objective is to reduce the overall damage and spread it evenly over the turbines. This case has a high cost-saving potential but would require a global cost–benefit analysis that includes all turbine components.
•Scenario 2: One particular turbine (turbine 1) is damaged. The objective is to minimize further damage on this turbine only. This case is particularly relevant as powertrain components typically show early signs of failure, motivating the use of damage mitigating control to influence the remaining lifetime and coordinate with maintenance actions, thus reducing downtime.
The three control methods are
•Method 1: No fatigue damage mitigation (equalLambdas),
•Method 2: Fatigue damage mitigation without yaw angle control as in Moghadam et al. (2023) (loadMitigation),
•Method 3: Fatigue damage mitigation with yaw angle control (loadMitigation yaw).
The three curtailment profiles correspond to constant power references equal to 0.2, 0.5, and 0.8 per unit (pu) of the installed farm power (320 MW).
Power dispatch commands follow the control scheme in Figure 3 and are updated every minute. Yaw angle commands are selected to yield minimum damage on the turbine(s) of interest (all in scenario 1 and only turbine 1 in scenario 2) and updated every 10 min, following the quasi-steady update rate of the waked flow field, by the simulation framework described in Section 2.2.
Results for scenario 1 are shown in Figure 11 with one subfigure per curtailment profile. It can be seen that power dispatch only can even out damage between upstream and downstream turbines but does not significantly reduce overall damage. Adding the yaw degree of freedom, on the other hand, aims at decreasing damage and is particularly efficient in heavily curtailed conditions, which is consistent with the database simulation results.
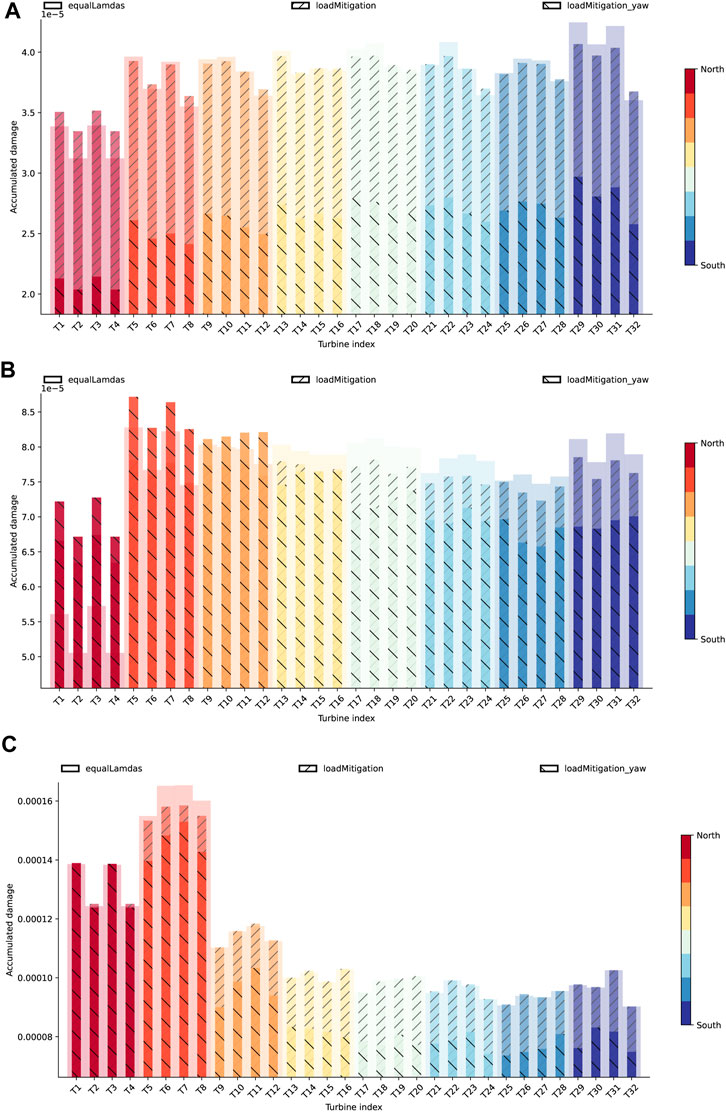
FIGURE 11. Distribution of accumulated damage over the farm turbines under different operational strategies. (A) Farm reference power level 0.2 pu (north wind, 12.4 m/s). (B) Farm reference power level 0.5 pu (north wind, 12.4 m/s). (C) Farm reference power level 0.8 pu (north wind, 12.4 m/s).
Results for scenario 2 are shown in Figures 12, 13, where the power dispatch (moving average) and the corresponding time evolution of the damage accumulation for the damaged turbine can be observed. Initially, Ppcc is naively distributed among the turbines. After the first control update based on the database at 600 s (because it requires information from the last 10 min), the farm controller has realized that it can track Ppcc with less contribution from the damaged turbine, and turbine 1 is re-dispatched to lower power levels. Both versions of the farm controller calculate the same powerdispatch plan for turbine 1, as observed from the moving average of the power dispatch in Figure 12A. However, since the proposed, enhanced version can also set the yaw angle of turbine 1 to a proper value, at the end of the simulation period, turbine 1 has accumulated less damage (solid purple line in Figure 12) than the case without a yaw angle offset (dashed green line in Figure 12). On the contrary, the naive approach that does not consider any damage information (solid red lines in Figure 12) instructs a different power dispatch plant for turbine 1, which would result in even higher damage accumulation by the end of the simulation. The simulated case’s corresponding optimal yaw angle offset sequence (adopted only by the controller version with yaw information) is presented in Figure 12B.
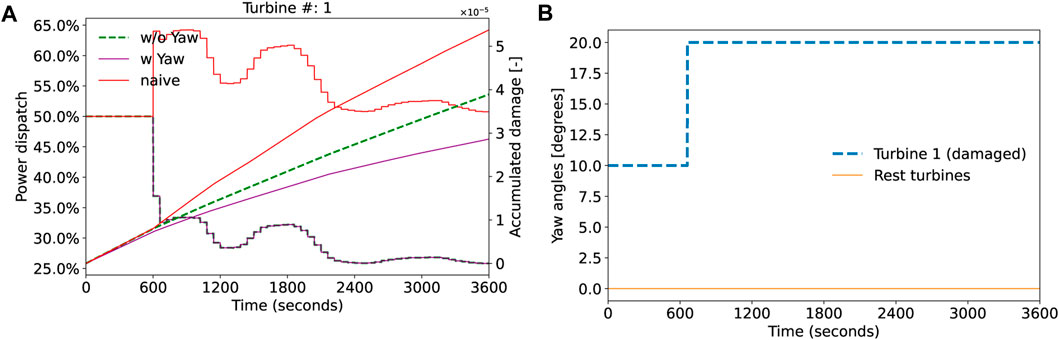
FIGURE 12. Wind farm simulation and effects of the wind farm controller on the damaged turbine (farm reference level 0.5 pu). (A) Power dispatch (moving average) and damage accumulation. (B) Yaw angle offset (case with Yaw).
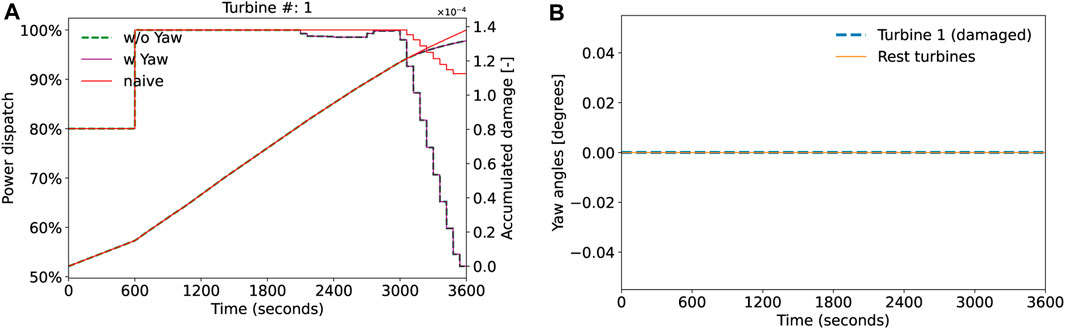
FIGURE 13. Wind farm simulation and effects of the wind farm controller on the damaged turbine (farm reference level 0.8 pu). (A) Power dispatch (moving average) and damage accumulation. (B) Yaw angle offset (case with Yaw).
Similar results were also observed for the case of farm reference power level 0.2 pu, and in general, for relatively lower values of farm reference power (equivalently higher levels of curtailment). For relatively higher values of farm reference power, however, the effectiveness of the proposed control scheme is lower. To illustrate this, we present the wind farm simulation results for the case of farm reference power 0.8 pu, shown in Figure 13, and following the same format as for the case of 0.5 pu (Figure 12). As can be observed, in this case, the power dispatch for the damaged turbine (turbine 1) is the same for both versions of the controller (with and without yaw), and for most of the simulation period, they are even the same with the naive approach. This is primarily because the requested farm power is relatively high when compared to the available, for this case, considering the pessimistic wind direction (north wind) that is associated with the largest impact from the wake effect. It is only at the last part of the simulation period that the farm controller can re-dispatch turbine 1 since the farm output can be tracked with less turbine 1 contribution. This is shown in Figure 13A, where the power decreases to lower values after 3,000 s. However, the decrease for the controller versions that take into account the damage is much more significant when compared to the naive approach, and as a consequence of this, the accumulated damage for the turbine is slightly lower than the naive approach by the end of the simulation. Again, the corresponding optimal yaw angle offset sequence is presented in Figure 13B. In this case, we observe that no offset yaw angle is decided, meaning that both versions of the controller (with and without yaw) are identical, which also justifies the identical damage accumulation for both versions, as depicted in Figure 13A. This observation is in line with the updated results of the damage database when including the yaw misalignment capability, where for higher turbine-generated power (lower derating levels), the effect of the yaw on turbine damage (based on the weighted damage index) becomes less significant.
4 Conclusion
A methodology characterizing powertrain fatigue damage for use in farm control is suggested. This study focuses on the effect of yaw misalignment, enabling yaw angle control at the farm level for damage mitigation purposes. It complements previous work on powertrain degradation modeling for multi-objective farm control in curtailed conditions, where it was shown how the damage on individual turbines may be steered while tracking a below-maximum power reference from the grid operator by acting on the power set points sent to individual turbines (the so-called power dispatch). The farm controller makes use of a database mapping operating conditions (wind speed, turbulence intensity, power set point, and yaw misalignment) to an overall indicator of powertrain degradation. It is built from numerous aero-servo-elastic turbine simulations feeding a quasi-static degradation model of each powertrain component—bearings and gears—following design standards, whose results are assembled to give a single metric for degradation. It is found that yawing-downregulated—asked to produce less power than available—turbines may further reduce damage, especially for the main bearing. This finding is then exploited in farm-level case studies with various levels of curtailment, where the farm controller reacts to local wind variations from turbulence and wakes, with power tracking as a primary objective and damage mitigation as a secondary objective. This demonstration of damage-aware farm control shows the benefit of adding the yaw degree of freedom to the load mitigation functionality.
These results are readily valuable when the objective is to reduce downtime on a damaged upstream turbine showing early signs of failure in a powertrain component. Future work will be devoted to quantifying uncertainty in the database by using high-fidelity models for wake effects and including the fatigue damage of other turbine systems, namely, blades, pitch bearings, and support structure, focusing particularly on combined yawing and downregulation. This will enable the extension of the proposed farm control methodology to holistic farm-wide lifetime extension and optimal maintenance planning purposes.
Data availability statement
To access the raw data of this research please contact the corresponding author at farid.k.moghadam@ntnu.no.
Author contributions
FK: Writing–original draft. ZG: Writing–review and editing. VC: Writing–original draft. SC: Writing–original draft.
Funding
The authors declare financial support was received for the research, authorship, and/or publication of this article. Open access funding was provided by NTNU, the Norwegian University of Science and Technology. This project has received funding from the Norwegian Research Council in the project CONWIND: Research on smart operation control technologies for offshore wind farms (grant no. 304229).
Conflict of interest
The authors declare that the research was conducted in the absence of any commercial or financial relationships that could be construed as a potential conflict of interest.
Publisher’s note
All claims expressed in this article are solely those of the authors and do not necessarily represent those of their affiliated organizations, or those of the publisher, editors, and reviewers. Any product that may be evaluated in this article, or claim that may be made by its manufacturer, is not guaranteed or endorsed by the publisher.
Footnotes
1In this study, the wind direction was kept constant in farm-level simulations, so the yaw angle offset commands and yaw misalignment input in the database are equivalent.
References
Andersen, S. J., Madariaga, A., Merz, K., Meyers, J., Munters, W., and Rodriguez, C. (2018). Reference wind power plant d1. 03.
Azzam, B., Schelenz, R., and Jacobs, G. (2022). Sensor screening methodology for virtually sensing transmission input loads of a wind turbine using machine learning techniques and drivetrain simulations. Sensors 22, 3659. doi:10.3390/s22103659
Azzam, B., Schelenz, R., Roscher, B., Baseer, A., and Jacobs, G. (2021). Development of a wind turbine gearbox virtual load sensor using multibody simulation and artificial neural networks. Forsch. Ing. 85, 241–250. doi:10.1007/s10010-021-00460-3
Bak, C., Zahle, F., Bitsche, R., Kim, T., Yde, A., Henriksen, L., et al. (2013). The dtu 10-mw reference wind turbine. DTU Library, Denmark: Danish Wind Power Research. 2013; Conference date: 27-05-2013 Through 28-05-2013.
Cardaun, M., Roscher, B., Schelenz, R., and Jacobs, G. (2019). Analysis of wind-turbine main bearing loads due to constant yaw misalignments over a 20 years timespan. Energies 12, 1768. doi:10.3390/en12091768
Chabaud, V. (2023). Synthetic turbulence modelling for offshore wind farm engineering models using coherence aggregation. Wind Energy. doi:10.1002/we.2875
Frandsen, S. (2007). Turbulence and turbulence-generated structural loading in wind turbine clusters
Hansen, M. H., and Henriksen, L. C. (2013). Basic DTU wind energy controller. Tech. Rep. DTU Wind Energy No.0028.
Hart, E., Clarke, B., Nicholas, G., Kazemi Amiri, A., Stirling, J., Carroll, J., et al. (2020). A review of wind turbine main bearings: design, operation, modelling, damage mechanisms and fault detection. Wind Energy Sci. 5, 105–124. doi:10.5194/wes-5-105-2020
IEC 61400-1:2019 (2019). Iec 61400-1:2019: Wind energy generation systems, Part 1: Design requirements. Geneva, Switzerland: Standard, International Electrotechnical Commission.
IEC 61400-3-1:2019 (2019). Iec 61400-3-1:2019: Wind energy generation systems, Part 3-1: Design requirements for fixed offshore wind turbines. Standard. Geneva, Switzerland: International Electrotechnical Commission.
Knudsen, T., Bak, T., and Svenstrup, M. (2015). Survey of wind farm control—power and fatigue optimization. Wind Energy 18, 1333–1351. doi:10.1002/we.1760
Madsen, H. A., Larsen, G. C., Larsen, T. J., Troldborg, N., and Mikkelsen, R. (2010). Calibration and validation of the dynamic wake meandering model for implementation in an aeroelastic code.
Meng, F., Lio, W., and Barlas, T. (2020). DTUWEC: an open-source DTU wind energy controller with advanced industrial features. J. Phys. Conf. Ser. (Online) 1618, 022009. doi:10.1088/1742-6596/1618/2/022009
Merz, K., Chabaud, V., Garcia-Rosa, P. B., and Kolle, K. (2021). “A hierarchical supervisory wind power plant controller,” in Journal of Physics: Conference Series (IOP Publishing), vol. 2018, Ancona, Italy, 20–22 June 2018.012026
Moghadam, F. K., Chabaud, V., Gao, Z., and Chapaloglou, S. (2023). Power train degradation modelling for multi-objective active power control of wind farms. Forsch. Im. Ingenieurwes. 87, 13–30. doi:10.1007/s10010-023-00617-2
Moghadam, F. K., and Desch, N. (2023). Life cycle assessment of various pmsg-based drivetrain concepts for 15 mw offshore wind turbines applications. Energies 16, 1499. doi:10.3390/en16031499
Moghadam, F. K., and Nejad, A. R. (2020). Evaluation of pmsg-based drivetrain technologies for 10-mw floating offshore wind turbines: pros and cons in a life cycle perspective. Wind Energy 23, 1542–1563. doi:10.1002/we.2499
Moghadam, F. K., and Nejad, A. R. (2022). Online condition monitoring of floating wind turbines drivetrain by means of digital twin. Mech. Syst. Signal Process. 162, 108087. doi:10.1016/j.ymssp.2021.108087
Moghadam, F. K., Rebouças, G. F. d. S., and Nejad, A. R. (2021). Digital twin modeling for predictive maintenance of gearboxes in floating offshore wind turbine drivetrains. Forsch. Im. Ingenieurwes. 85, 273–286. doi:10.1007/s10010-021-00468-9
Peeters, J. L., Vandepitte, D., and Sas, P. (2006). Analysis of internal drive train dynamics in a wind turbine. Wind Energy An Int. J. Prog. Appl. Wind Power Convers. Technol. 9, 141–161. doi:10.1002/we.173
Pfaffel, S., Faulstich, S., and Rohrig, K. (2017). Performance and reliability of wind turbines: a review. energies 10, 1904. doi:10.3390/en10111904
Sood, I., del Fosse et d’Espierres, C., and Meyers, J. (2023). Quasi-static closed-loop wind-farm control for combined power and fatigue optimization. Available at: https://arxiv.org/pdf/2305.11710.pdf.
Sørensen, P., Cutululis, N. A., Vigueras-Rodríguez, A., Madsen, H., Pinson, P., Jensen, L. E., et al. (2008). Modelling of power fluctuations from large offshore wind farms. Wind Energy An Int. J. Prog. Appl. Wind Power Convers. Technol. 11, 29–43. doi:10.1002/we.246
Stock, A., Cole, M., Leithead, W., and Amos, L. (2020). “Distributed control of wind farm power set points to minimise fatigue loads,” in 2020 American Control Conference (ACC), Denver, Colorado, USA, 1-3 July 2020 (IEEE), 4843–4848.
van Binsbergen, D. W., Wang, S., and Nejad, A. R. (2020). Effects of induction and wake steering control on power and drivetrain responses for 10 mw floating wind turbines in a wind farm. In Journal of Physics: Conference Series (IOP Publishing), vol. 1618, 022044.
van Dinter, R., Tekinerdogan, B., and Catal, C. (2022). Predictive maintenance using digital twins: a systematic literature review. Inf. Softw. Technol. 151, 107008. doi:10.1016/j.infsof.2022.107008
Vigueras-Rodríguez, A., Sørensen, P., Cutululis, N. A., Viedma, A., and Donovan, M. (2010). Wind model for low frequency power fluctuations in offshore wind farms. Wind Energy 13, 471–482. doi:10.1002/we.368
Vigueras-Rodríguez, A., Sørensen, P., Viedma, A., Donovan, M. H., and Lázaro, E. G. (2012). Spectral coherence model for power fluctuations in a wind farm. J. Wind Eng. Industrial Aerodynamics 102, 14–21. doi:10.1016/j.jweia.2011.12.006
Wang, S., Nejad, A. R., and Moan, T. (2020). On design, modelling, and analysis of a 10-mw medium-speed drivetrain for offshore wind turbines. Wind Energy 23, 1099–1117. doi:10.1002/we.2476
Wiser, R., Bolinger, M., Hoen, B., Millstein, D., Rand, J., Barbose, G., et al. (2023). Land-based wind market report: 2023 edition. Tech. Rep. Berkeley, CA (United States): Lawrence Berkeley National Laboratory LBNL.
Xia, J., and Zou, G. (2023). Operation and maintenance optimization of offshore wind farms based on digital twin: a review. Ocean. Eng. 268, 113322. doi:10.1016/j.oceaneng.2022.113322
Yasuda, Y., Bird, L., Carlini, E. M., Eriksen, P. B., Estanqueiro, A., Flynn, D., et al. (2022). Ce (curtailment–energy share) map: an objective and quantitative measure to evaluate wind and solar curtailment. Renew. Sustain. Energy Rev. 160, 112212. doi:10.1016/j.rser.2022.112212
Keywords: database, fatigue damage, powertrain, farm control, power tracking, curtailment, yaw misalignment
Citation: Khazaeli Moghadam F, Gao Z, Chabaud V and Chapaloglou S (2024) Yaw misalignment in powertrain degradation modeling for wind farm control in curtailed conditions. Front. Energy Res. 11:1272967. doi: 10.3389/fenrg.2023.1272967
Received: 04 August 2023; Accepted: 22 December 2023;
Published: 19 January 2024.
Edited by:
Stefano Leonardi, The University of Texas at Dallas, United StatesReviewed by:
Hanlin Wang, Hiroshima University, JapanChristian Santoni, Stony Brook University, United States
Copyright © 2024 Khazaeli Moghadam, Gao, Chabaud and Chapaloglou. This is an open-access article distributed under the terms of the Creative Commons Attribution License (CC BY). The use, distribution or reproduction in other forums is permitted, provided the original author(s) and the copyright owner(s) are credited and that the original publication in this journal is cited, in accordance with accepted academic practice. No use, distribution or reproduction is permitted which does not comply with these terms.
*Correspondence: Farid Khazaeli Moghadam, farid.k.moghadam@ntnu.no