Multiple-layer energy management strategy for charging station optimal operation considering peak and valley shaving
 Bin Qian1,2
  Song Ke
- 1Electric Power Research Institute, China Southern Power Grid Co., Ltd, Guangzhou, Guangdong, China
- 2Guangdong Provincial Key Laboratory of Intelligent Measurement and Advanced Metering of Power Grid, China Southern Power Grid Co., Ltd, Guangzhou, Guangdong, China
- 3Zhaoqing Power Supply Bureau of Guangdong Power Grid Co., Ltd, Zhaoqing, Guangdong, China
- 4Hubei Engineering and Technology Research Center for AC/DC Intelligent Distribution Network, School of Electrical Engineering and Automation, Wuhan University, Wuhan, Hubei, China
- 5School of Electrical Engineering and Automation, Wuhan University, Wuhan, Hubei, China
Existing vehicle-to-grid (V2G) applications are aimed at the power grid and the government. It is difficult for charging stations (CSs) to execute the schedules in real time. To figure out the multiple-layer energy management from the perspective of CS, the dispatch potential assessment model is constructed based on the EV users’ charging demand and Minkowski summation. And the optimal energy management schedule model of CS with ESS is proposed considering peak shaving and valley filling under the time-in-use tariff. Besides, the real-time charging control model of EVs in CS is designed under the premise of meeting the charging needs. The simulation results show that the proposed strategy can promote CS operation revenues and track the scheduling plan of CS. The arbitrage of tariffs and peak shaving ancillary services are realized while the charging loads of CSs are smoothed by the charging/discharging of ESS. The proposed strategy is applicable for the CS aggregators and can help the grid operators for dispatch schedules.
1 Introduction
Electric vehicles (EVs) have been developed rapidly, but their charging load will burden the power grid. However, EVs can store power, and the charging behavior can be guided and controlled (Ahmadian et al., 2020). In recent research, there have been many papers that focus on vehicle-to-grid (V2G) applications (Ke et al., 2022) and policies to support EV owners and charging station (CS) aggregators (Mao et al., 2018).
V2G strategies involve many factors, such as EV ownership, charging characteristics (Yang et al., 2017), user charging habits, CS configuration, distribution network capacity, multi-level charging management (Heilmann and Friedl, 2021), grid network planning, and macro policies (Wu et al., 2020). There have been many studies on V2G applications. In Mozafar et al. (2018), the power exchange for V2G is calculated using the constant power method to discharge the energy at the workplace. In Ke et al. (2023), a model predictive control strategy is designed for the charging station, and CS is reconfigured as a virtual synchronous generator. In Raoofat et al. (2017), wind power is smoothed by the hierarchical controller for the demand response of EVs. The exact approach for charging EVs is proposed to promote the stability of microgrids (Shams et al., 2019). These researchers have paid attention to the V2G control strategies for the promotion of power grid stability (Nikam and Kalkhambkar, 2021). Moreover, the V2G services are implemented through EV owners, CSs, and aggregators. All of these entities are sensitive to profits and costs.
Therefore, strong and stable targets accompanied by purchase price incentives and flexible benefits are needed to promote EVs and CS participation in the ancillary services. In addition, more attention should be paid to raising EV consumers’ awareness about V2G (Kester et al., 2018), and the development of energy storage in CSs will unlock new possibilities for V2G services (Shaukat et al., 2018). The profits of CS aggregators, grid operators, and EV users are coordinated in Zhou and Sun (2020) with multi-objective optimization. A favorable charging strategy for each grid-connected EV is designed in Tiwari et al. (2020) to satisfy both load profile smoothening and the economic and social interests of EV owners. These optimization models and energy management strategies are in terms of the grid or multiple entities, including EV owners, the government, power grid operators, and CS aggregators. Since the cost of retrofitting charging piles and charging control are borne by CS aggregators, CS aggregators are the protagonists of EV real-time charging control. Using charging tariff compensation and maximizing the benefits of CSs is the only way to maximize charging load shifting in practice.
Furthermore, energy storage can be equipped in CSs to cope with the time-sharing tariff (Nikam and Kalkhambkar, 2021; W et al., 2018). In Liu et al. (2023), energy management is integrated with photovoltaics and the energy storage system (ESS). Charging prices are clarified with the types of EVs. In ZHANG and GU (2017), the designed energy management system of CS with photovoltaics and ESS can deal with both off-grid and grid-connected operations to improve the economy and stability of the grid. When the charging load of CS has reached and even exceeded the planning capacity, CS tends to configure ESS to escalate the regulation capacity of CSs and satisfy the increasing charging demand of EVs (Koolman et al., 2021). In Rehman et al. (2021), the optimization model of an extremely fast CS is proposed to size ESS. How to realize the peak shaving auxiliary service of CSs and the real-time charging control of EVs by taking into account the randomly arriving and charging demands of EVs and the ESS configured in CSs still needs further research.
The current operation efficiency of CSs is low, and the profitability is poor (Wu et al., 2019), which does not match the trend of large-scale development of EVs and the dynamic electricity market price. The charging management and pricing strategy of CS based on the mean-field game theory is designed (Lin et al., 2023). In order to design the energy management system for CSs, Shafie-Khah et al. (2018) proposed the innovative two-level model, the first of which models EVs’ characteristics, including EV owners’ uncertainties. The second layer allows these CS aggregators to participate in energy reservation and regulation distribution markets by optimally managing their EVs. However, the flexible electricity price and the randomness of EV users’ arrival and charging demand make it impossible to apply the energy management system exactly to CS. The coordination with ESS is also complicated with the peak shaving, valley filling, and the power supply in CS. In order to promote EVs to participate in the transaction of electricity market, the decentralized transactive energy mechanisms for EVs and distributed energy resources (DERs) have been researched, such as bilateral trading and the auctioning mechanism between aggregators and EVs (Qi et al., 2023), decentralized mechanism for transactive energy control (Pan et al., 2020), and peer to peer (P2P) electricity trading (Yang et al., 2022; Lyu et al., 2021). However, the aforementioned studies are carried out from the perspective of the EV scheduling strategy and transaction mechanism, taking into account the blockchain, privacy security, and other factors in the decentralized transaction. Moreover, these studies do not take into account the impact of the randomness of EV users on the proposed scheduling plan in the process of real-time scheduling control. In other words, the actual charging process of EVs is difficult to be carried out in full accordance with the transaction mechanism and obtained optimal dispatch schedule.
Therefore, CS aggregators need to develop a daily energy management system in multiple layers considering the equipped ESS. On one hand, CSs need to act as loads to purchase power from the grid to meet the charging requirements of EVs. On the other hand, they can also act as a controllable source of power to the grid to provide auxiliary services for peak shaving and valley filling. ESS in CS can assist in tracking the scheduling plan. Moreover, it can also carry out peak and valley arbitrage. It is necessary to construct a comprehensive energy management strategy from the perspective of the CS aggregator to cope with the stochasticity of user charging and ancillary services from the grid. Thus, the support ability and profitability for charging demand and CS operation can be guaranteed. The main contributions of this paper are as follows:
(1) The dispatch potential assessment model is designed based on the EV users’ charging demand and Minkowski summation. The dispatchability of the EV group in CS is estimated to serve as the model basis for subsequent dispatch planning and charging control models.
(2) The optimal energy management strategy of CS with ESS considers the peak shaving and valley filling under the time-in-use tariff. The ESS in CS assists in tracking dispatch schedules and is also controlled for arbitrage. The dispatch schedules are generated to maximize the profits of CS. The CS aggregator makes the capacity declaration in the ancillary service market with the generated dispatch schedule.
(3) The real-time charging control model of EVs in CS is proposed. Under the premise of meeting the charging needs of EV users, the charging power and duration of EVs in CS are appropriately regulated to promote the operating revenues of CS. Therefore, market clearing is achieved, and the real-time regulation of CS is aligned with the optimized schedules for energy management.
The remaining chapters of this paper are organized as follows: in Section 2, the dispatch potential assessment model of EV users is presented. In Section 3, the optimal energy management strategy of CS with ESS considering peak shaving and valley filling is proposed under the time-in-use tariff. The real-time charging control model of EVs in CS is constructed in Section 4. Section 5 presents the simulation results and discussion. The conclusions are summarized in Section 6.
2 Dispatch potential estimation model of EV users
To participate in the electricity ancillary service market, the dispatchable capacity needs to be defined for CSs, including regulated power and regulated capacity. Thus, a computational model of the dispatchable capacity of EV clusters within a CS is developed as follows.
2.1 Minkowski summation
In the Minkowski sum theory, the variable space is considered an Euclidean space, where each variable is a vector with a dimension equal to that of the variable space. By combining these vectors linearly, a new vector can be obtained, whose length represents the overall contribution of all variables. The Minkowski sum is a summation method applied to the Euclidean space to find the space expansion set of multiple variables with the same definition domain (Lee et al., 1998; Lien, 2008), and its basic expression is shown in Eq. 1.
where
The premise of the Minkowski summation is that the two variable spaces, A and B, have the same definition domain, and their physical nature is the expansion set of multiple spaces (Yan and Chirikjian, 2015). As shown in Figure 1, after Minkowski’s summation of the two variable spaces a and b, the envelope of the variable sums A and B can be obtained. This idea can be used to aggregate clusters of flexible resources, such as EVs, into a generalized energy storage device.
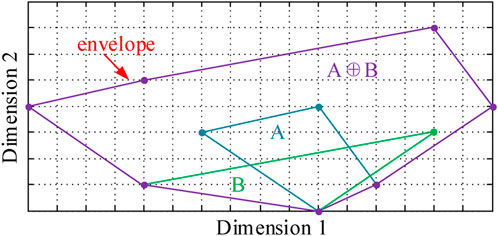
FIGURE 1. Schematic representation of Minkowski summation.
2.2 CS dispatchability estimation method
Although different EVs are connected to the grid at different periods, the Boolean variables can extend the EV’s grid-connection decision-making behavior to the same time-defined domain. Thus, EVs in CS can be equated to the controllable load with the help of the Minkowski sum. When using the Minkowski sum to aggregate the charging demand parameters and schedulable capacity of EVs, it can maintain the EV users’ own constraints.
For EV users’ travel, the uncertainty is described by the following parameters: initial SoC, upper and lower limits of expected SoC, and expected arrival and departure time (Ke et al., 2022). In this way, the maximum power of the charging pile and the battery capacity of the EVs are fixed. At first, the mathematical model of a single EV is as follows:
where the subscript v is the EV number and Xv,t denotes the state of EV v in period t. When the value is 1, it means that EV is in CS; otherwise, the EV has not arrived or left. Tvarrival and Tvleave denote the period when EV arrives and leaves CS, respectively. pv,tc denotes the charging power of EV, and
The characteristics of the EV arrival time, leaving time, and the period staying in the CS are taken into account, and the envelope space is obtained using the Minkowski additive processing equation as follows:
where sv,arrival, and sv,leave denote the initial charge of EV and the charge when it leaves CS, respectively.
Definition.
where
The Minkowski summation is essentially projecting the variable space of an individual EV into a hypercube space, while preserving the constraints between the variables reduces the dimensionality of the model by compressing an EV into a generalized energy storage device. The hypercube space contains all feasible charging and dispatchability decisions for the EV cluster, and the parameters of the generalized storage device
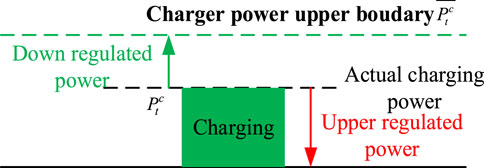
FIGURE 2. CS dispatchable power schematic representation.
3 Optimal schedule model of CS with ESS
There is a high degree of stochasticity in the charging behavior of EVs at CSs. When CSs are equipped with ESS, CS aggregators need to develop a daily dispatch plan in conjunction with the grid and ESS. On one hand, CSs purchase power from the grid to meet the charging demand of EVs. On the other hand, they can also act as a controllable source of power to the grid to provide auxiliary services for peak and valley shaving. ESS equipped in CS can assist the CS to track the optimal scheduling plan. Moreover, it can also carry out peak and valley arbitrage. Under the premise of meeting the charging needs of EV users, the charging power and duration of EVs in CS can also be appropriately adjusted to promote the operating revenues of CS. Therefore, an optimization model study is carried out to obtain the optimal charging scheduling model of CS. The dispatch schedule is optimized and further declared to the higher grid and the electricity market.
3.1 CS operation revenue objectives
By analyzing the access conditions and requirements for CSs to participate in the power purchase market, the profitability and optimization allocation methods of the energy management system are obtained with the equipped ESS. The operation revenues of CSs are promoted when the CS meets the threshold for participation in ancillary services. The optimal dispatch schedule includes the schedule profiles of CS, the charging and discharging schedules of ESS for peak and valley shaving, and the power supply for CS and arbitrage.
The charging dispatchable capacity of the CS’s EV user clusters, i.e., the adjustable boundary, as well as the configuration scheme of chargers and ESS in CS, are determined. Based on this, the total charging power of CS needs to be constrained within the adjustable boundary to establish an intraday dispatch model. In other words, CS operators need to satisfy the constraints on the power scheduling plan, charging piles, and ESS in CS when formulating the power scheduling plan. The maximum revenue of CS is taken as the objective of the optimal scheduling strategy, and the specifics of the intraday charging scheduling model are constructed as follows:
CS operation revenue objective function W is modeled in Eq. 15.
where W1 is the ESS maintenance cost, W2 is the cost of purchasing electricity for CSs, W3 is the ESS arbitrage benefits, W4 is the ancillary service capacity compensation benefits, and W5 is the EV charging benefits.
In detail, the expressions of W1–W5 are as follows:
1) ESS maintenance cost W1:
where closs is the loss cost of charging and discharging unit power of ESS, RMB/MWh; ηstoc and ηstod are the efficiencies of charging and discharging of ESS, and Pt,stoc is the part of electricity purchased by CS for charging energy storage, i.e., the charging power of ESS. Pt,stod,in, Pt,stod,arb, and Pt,stod,+ are the charging power of ESS used for charging EVs in CS, the discharging power of ESS used for energy arbitrage, and the discharging power of ESS used for auxiliary service of peak shaving in the time period, respectively.
2) Cost of purchasing electricity for CSs W2:
where pte is the commercial and industrial tariff for the time period; Pt,CSb is the power purchased by CS during the non-auxiliary service time period; and Pt,CSb,- is the amount of electricity used by CS to participate in the valley filling auxiliary service during the time period t.
3) Benefits of ESS arbitrage W3:
where Pt,stod,arb and Pt,stod,+ are the discharging power of ESS used for energy arbitrage and the discharging power of ESS used for auxiliary service of peak shaving in the time period t, respectively.
4) Ancillary services capacity compensation benefit W4:
where δt+ and δt- are the compensatory prices for peak shaving auxiliary services and valley filling auxiliary services at time period t, respectively. Pt,CSb,+ and Pt,CSb,- are the power capacity of CS in peak shaving and valley filling auxiliary services.
5) EV charging benefit W5:
where pt,fp and pt,sp are the EV charging price of fast chargers and slow chargers, respectively. Pt,fp and Pt,sp are the total charging power capacity of fast chargers and slow chargers in the time period t, respectively.
Therefore, the optimal schedule plan is obtained for CS aggregators, considering the ESS arbitrage and peak and valley shaving, as well as the charging load. Capacity declaration refers to the situation where the aggregator participating in the power market transaction needs to predict and declare the trading capacity on the previous day. The revenues of the CS operation are promoted, and the obtained optimal dispatch schedule of CSs can be used for the declaration of capacity in the electricity market.
3.2 Charger constraints
To catch the optimal dispatch schedule, the chargers and ESS in CS are constrained by the configurations and dispatchability. The constraints are as follows:
1) Dispatchability boundary of charging load constraints:
where Dtmin and Dtmax are the down boundary and upper boundary of the dispatchable charging load in CS, respectively. ηfpc and ηspc are the charging efficiency of fast chargers and slow chargers in CS, respectively. Pt,fp and Pt,sp are the total charging power capacity of fast chargers and slow chargers in the time period t, respectively.
2) Charging power constraints of fast chargers and slow chargers:
where Pfpmax and Pspmax are the maximum charging power of fast chargers and slow chargers, respectively. nfp and nsp are the configured number of fast chargers and slow chargers, respectively.
3) Baseline load constraints:
where Dt is the baseline load of CS in time period t.
4) Power balance constraints in CS:
where Pbt,CS is the purchased power of CS in the non-ancillary services period t and Pb,-t,CS is the power capacity of CS in valley filling. Pt,stod,in is the discharging power of ESS for the EV charging load in CS. Pt,stoc is the charging power of ESS in time period t. Therefore, the summation of the power purchased by CS during the non-ancillary service time, the power participating in the valley filling ancillary services, and the power discharged from ESS used for charging EVs in CS is equal to the summation of the total charging power of the fast chargers, the total charging power of the slow chargers, and the charging power of ESS in CS.
3.3 ESS constraints
3.3.1 ESS charging power capacity constraints
The maximum power of ESS is proportional to the capacity, and α is the proportional coefficient. The constraint is given in Eq. 26.
where Pt, csto is part of the power purchased by CS during the period t to charge ESS, α is the power-to-capacity ratio of ESS, i.e., it is assumed that the charging and discharging power of ESS is directly proportional to the capacity, and Ssto is the capacity of ESS configured in CS.
3.3.2 ESS discharging power constraints
where Pt,stod,in, Pt,stod,arb, and Pt,stod,+ are the charging power of ESS used for charging EVs in CS, the discharging power of ESS used for energy arbitrage, and the discharging power of ESS used for auxiliary service of peak shaving in period t, respectively.
3.3.3 ESS power transfer balance constraints
where Et,sto is the charge of ESS in period t. ηstoc and ηstod are the charging and discharging efficiencies, respectively. E0,sto is the initial state of charge (SoC) when the dispatch begins. β is the ratio between the initial SoC and the capacity of ESS.
3.3.4 ESS state of charge safety constraints
To maintain the SoC of the ESS in a steady and safe operation state, SoC is supposed to stay in the ideal interval to increase the recycling life and reduce the operation and maintenance costs.
where γsto- and γsto+ are the safety lower boundary and safety upper boundary of ESS, respectively.
3.3.5 ESS state logic constraints
where Eqs 31, 32 are used for avoidance of simultaneous charging and discharging of ESS. Eqs 33, 34 are used to avoid a situation where a CS operator purchases power from the grid, while ESS discharges to the grid. M is a sufficiently large positive real number. κt,sto and κt are Boolean variables.
3.4 Peak and valley shaving constraints
3.4.1 Regulated power/capacity access constraints for CS participation in the ancillary services market
where
where T- is the set of valleys filling ancillary service periods and κt− is the corresponding Boolean variable.
Eqs 38, 39 enable the configured ESS capacity to meet the regulated power and regulated capacity access conditions for CS participation in the valley filling ancillary services market.
3.4.2 Peak shaving constraints of CS
where Eqs 40, 41 are used to avoid a situation where a CS purchases power from the grid to charge ESS while participating in peak shaving ancillary services. Eq. 42 constrains CS’s participation in peak shaving ancillary services to the sum of charging load reductions and ESS discharges. κt+ represents the corresponding Boolean variables.
3.4.3 Valley filling constraints of CS
where Eqs 44, 45 are used to avoid a situation where a CS sells power to the grid by discharging ESS while participating in valley filling ancillary services. Eq. 46 constrains CS’s participation in valley filling ancillary services to the incremental amount of power purchased from the grid by CS. κt- represents the corresponding Boolean variables.
The dispatch framework of CS aggregators to participate in the ancillary services is shown in Figure 3. When CS participates in peak shaving and valley filling, the guiding signal is the corresponding time–tariff peak–valley price declared by the dispatching center. The constraints considered in the strategy proposed in this paper are mainly related to constraints such as the status of the EVs and the dispatch schedule of CS. Therefore, the energy management of CS equipped with ESS can be modeled, and the optimal schedule plan of CS is obtained by solving the optimization model. EV users will sign the charging service agreements with the aggregator, and the aggregator will declare the dispatchability capacity to the dispatch center. Then, the dispatch center will allocate the dispatch commands to the energy management system of CS. Meanwhile, the aggregator platform will help the energy management system of CS to cope with the optimal dispatch schedule and real-time control.
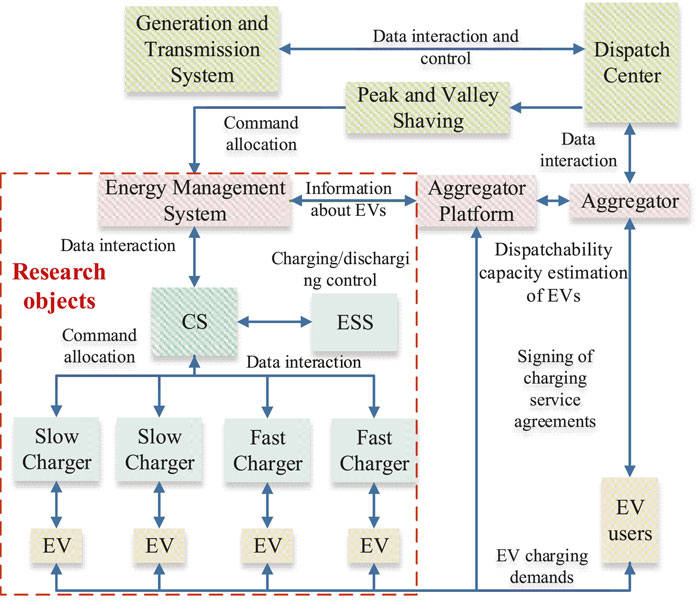
FIGURE 3. Dispatch framework of CS aggregators to participate in the ancillary services.
4 Real-time charging control model of EVs in CS
When the CS operates to track the optimal dispatch schedule, inaccuracies may occur because of the randomness of the EV users’ charging behaviors. Therefore, in order to promote the accuracy of schedule tracking and maximize the operating revenues of CS, it is necessary to design a corresponding real-time charging control model for EVs in the CS. The arrival/leaving time, charging demand of EVs, information on the electricity price, and charging and discharging status of ESS in the CS are taken into account in the control model. Under the premise of meeting the charging demand of EV users, the appropriate adjustment of the charging power and duration of the EVs is required in the actual operation of CS. Moreover, it can provide CS with the regulation margin to participate in the ancillary service, such as shaving the peaks and filling up the valleys.
Therefore, the real-time charging control model for EVs in the CS is established. The minimization of the operation cost of CS is the control objective. The dispatch scheduling tracking errors, states of the chargers, ESS, and EV charging demand satisfaction are taken as the constraints of the control model.
4.1 Energy management constraints
The CS operation revenue objectives are similar to the objectives in Section 3 A. However, the variables Pt,stoc, Pt,CSb, and Pt,CSb−; Pt,CSb,+, Pt,stod,in, and Pt,stod,arb; and Pt,stod,+, Pt,fp, and Pt,sp are the real-time values. The values are determined by the number of incoming EVs in CS and their charging demands. During the charging control, the chargers and the power balance constraints are explained in the following section.
4.1.1 Fast charger power constraint
where Pt,f_ch is the total charging power of fast chargers in period t, nfp is the number of fast chargers configured in CS, and Pfpmax is the maximum charging power of fast chargers.
4.1.2 Slow charger power constraint
where Pt,s_ch is the total charging power of slow chargers in period t, nsp is the number of slow chargers configured in CS, and Pspmax is the maximum charging power of slow chargers.
4.1.3 EV chargers’ power balance constraints
where Pit,cha is the charging power of the ith EV in period t.
The ESS constraints are similar to Section 3 C. The only difference is the variables, which are real-time values instead of schedule values.
4.1.4 CS power purchase and sale balance constraints
where Bt is the purchased power of the CS charging load, Bt,ad2 is the purchased power of CS for valley filling, St,dis1 is the discharging power of ESS for EVs’ charging, and St,cha is the charging power of ESS for arbitrage and valley filling.
4.1.5 CS dispatch plan following constraints
where St,cha is the charging power of ESS, and LB_Pt,loadcs and UB_Pt,loadcs are the lower and upper boundaries of the schedule plan curve of the CS, respectively.
4.2 EV users’ charging demand constraints
4.2.1 SoC of the EV transformation constraint
where EEV is the battery capacity of EV,
4.2.2 Charging power of the EV constraint by chargers
where Nt is the amount of parking EVs in CS at period t. The charging power of all EVs is equal to the power of chargers.
4.2.3 SoC expectation constraint
where tout is the period when ith EV leaves CS, SoCtouti is the SoC of ith EV when it leaves, and SoCei is the expected SoC of ith EV.
4.3 Flowchart of CS optimal energy management
Therefore, as shown in Figure 4, the optimal energy management for CS is realized in the following procedure. The energy management consists of two parts. The first part is the optimal schedule, and the second is the real-time charging control.
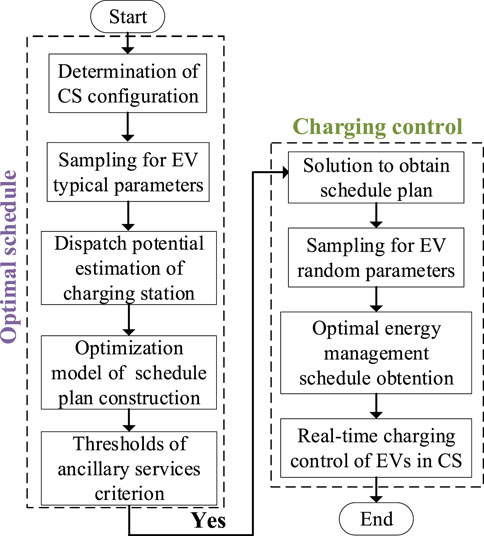
FIGURE 4. Flowchart of CS optimal energy management.
In the optimal schedule, the configuration of CS is determined, including the capacity of ESS and the number of fast chargers and slow chargers. Next, the EV typical parameters are sampled, and the dispatch potential of CS is estimated. Thus, CS can be judged whether to participate in the ancillary services. When CS reaches the threshold of ancillary services, the solution of CS daily schedule plan optimization can be obtained by business solvers, such as Gurobi and Cplex. In the real-time charging control, the EV random parameters, including the EV battery states and expected charging behaviors, are collected from the EV users to analyze the random EV charging demands, and the real-time intraday dispatch is supposed to approach the optimal schedule plan. Thus, the real-time charging control model is solved for optimal energy management schedule obtention, and EVs can be charged to their expected SoC while the revenues of CS can be optimized.
5 Simulation results and discussions
5.1 Simulation scenarios and parameters
In this section, the parameters of the CS model are obtained by the normal distributions. The parameters of EVs and CS are shown in Table 1. The dispatchability of CS is estimated first. Then, the optimal schedule plan of CS with ESS is obtained by the proposed method. The configuration of CS is shown in Table 2, and p is the basic EP. Finally, the model parameters of real-time charging control are shown in Table 3, including the incoming EVs and ESS. The real-time dispatch and control are realized to follow the schedule plan and promote the revenues of the CS aggregators. In all simulation scenarios, the time interval is 15 min.

TABLE 1. EV and CS parameters for dispatchability estimation.
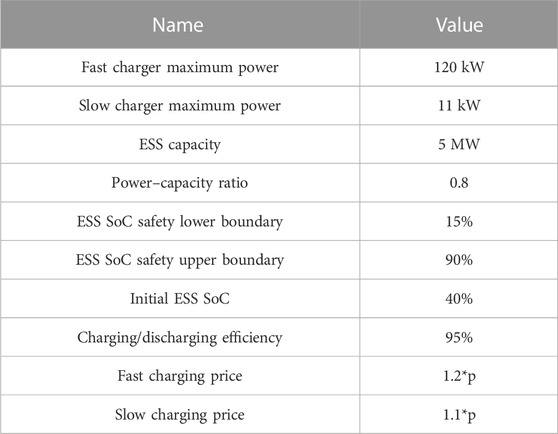
TABLE 2. CS configuration parameters.
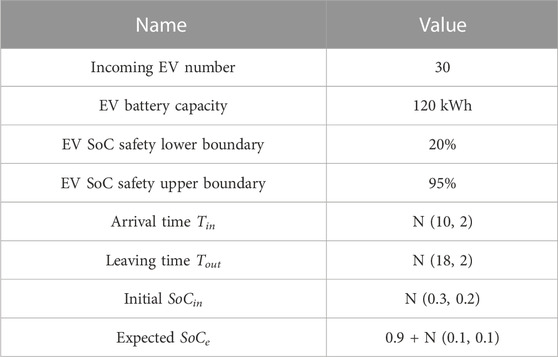
TABLE 3. EV parameters for real-time control.
5.2 Simulation results and discussions
5.2.1 CS modeling
It is assumed that 100 EVs enter and exit CS throughout the day. The real-time energy boundaries and maximum power of CS are obtained, and the results are shown in Figures 5, 6.
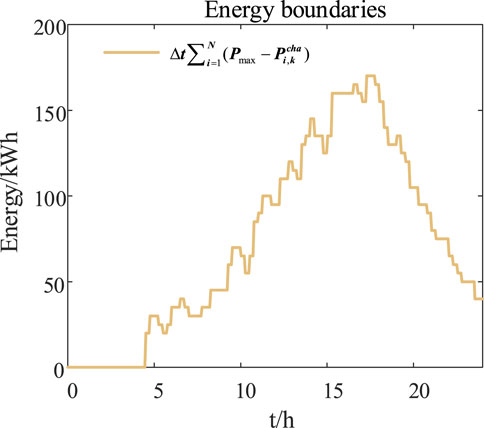
FIGURE 5. Real-time dispatchable energy boundary of CS.
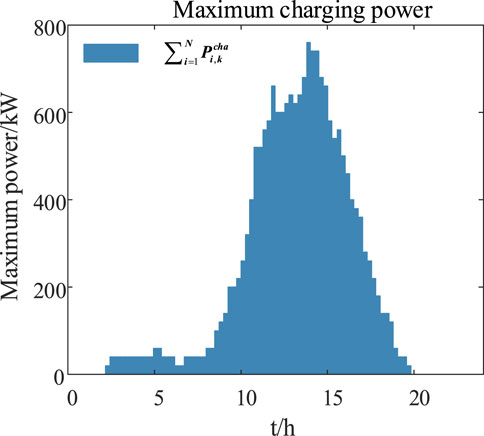
FIGURE 6. Real-time dispatchable power boundary of CS.
5.2.2 Optimal dispatch schedule
According to the basic EP, peak, and valley shaving compensation EP shown in Figure 7, the optimal schedule model of the CS is solved by Gurobi to develop an intraday dispatch plan, the results of which are shown in Figures 8–11.
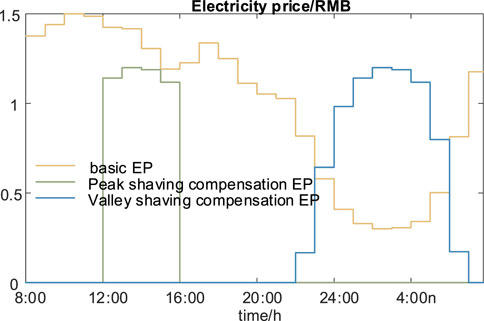
FIGURE 7. Electricity price.
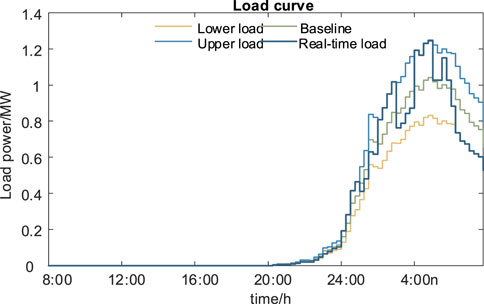
FIGURE 8. Day scheduled load curves of CS.
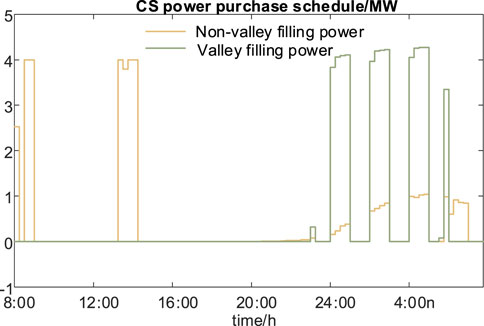
FIGURE 9. CS power purchase schedule.
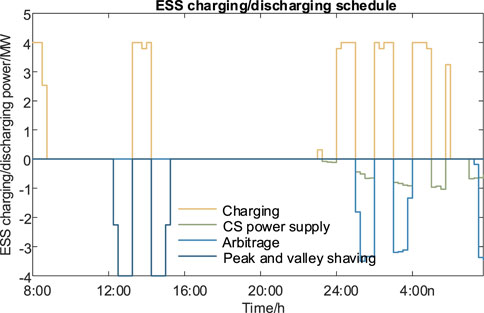
FIGURE 10. ESS charging–discharging schedule.
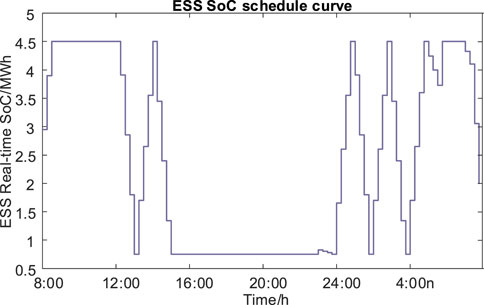
FIGURE 11. SoC of the ESS schedule curve.
Based on the power purchase tariffs, and the upper and lower bounds under the baseline load, the daily load dispatch curves for CS are obtained in Figure 8. The optimal schedule curve is between the upper and lower bounds of the baseline load. Furthermore, a power purchase and sale plan for CS and a charging and discharging plan for ESS are developed to enable charging scheduling at CS, as shown in Figures 9, 10. The corresponding SoC of the equipped ESS is shown in Figure 11. ESS can realize the arbitrage, peak–valley shaving, and charging power supply of CS.
5.2.3 Real-time control
Using the real-time control model, CS can realize the tracking of dispatch scheduling, the charging and discharging plan of ESS in CS, as well as the charging of the EV users in CS. However, the premise that the charging process of EV users is fully controllable is difficult to achieve. Therefore, real-time charging control is designed to track the CS scheduling plan and optimize the operation and energy management of CS when EV users are partially controllable. The charging and discharging control of equipped ESS is controlled by coordinating with the EV’s charging load. Furthermore, ESS is also controlled for arbitrage, peak shaving, and valley filling ancillary services.
The optimal schedule plan is fundamental to real-time control during intraday dispatch. The proposed model is solved with the parameters in Table 3 to obtain the real-time charging control results of EV in CS, as shown in Figures 12–17. In Figure 12, the real-time dispatch of CS includes the non-valley filling power purchase, which is the power for ESS charging and EV charging. The peak shaving power sale is the discharging power of ESS to the grid. The valley shaving power purchase is the charging power of ESS and the chargers from the grid. Thus, the real-time states and power of ESS are shown in Figure 13.
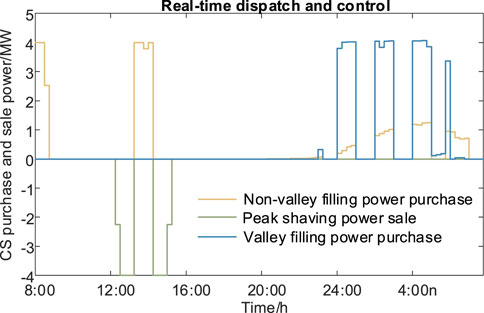
FIGURE 12. Real-time dispatch of CS.
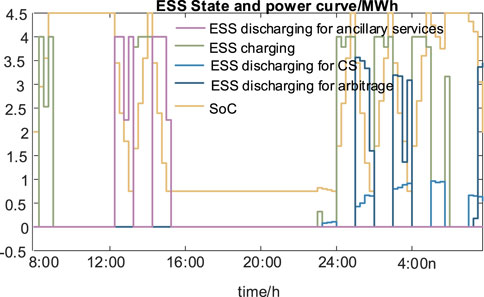
FIGURE 13. Real-time state and power curves of ESS.
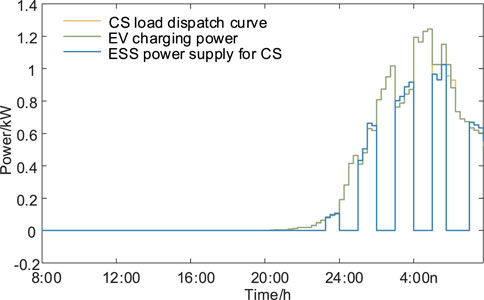
FIGURE 14. Real-time CS dispatch curve following.
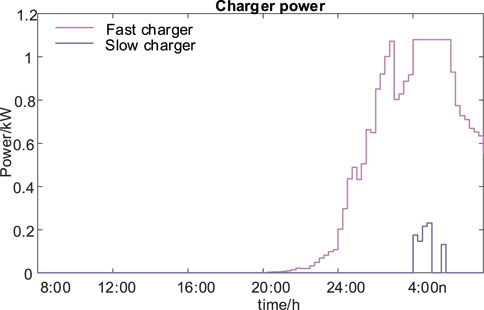
FIGURE 15. Real-time fast/slow charger power.
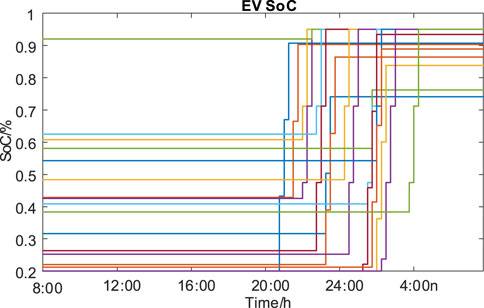
FIGURE 16. Real-time EV SoC.
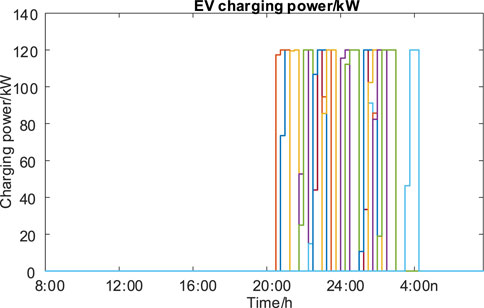
FIGURE 17. Real-time EV charging power.
As shown in Figure 14, the real-time scheduling curves of the purchase and sale of electricity in CS are determined by the given CS load curves, as well as the corresponding real-time charging and discharging curves of ESS and real-time power curves of ESS. The control models satisfy the power demand of CS and provide the peak-peaking filling auxiliary services. Furthermore, based on the arrival and departure time of each EV and the SoC-related parameters, the charging power versus SoC variation curve is obtained, as shown in Figures 15, 16. The charging process of EV is precisely controlled to cope with the dispatch demands of CS EMS and the charging demands of EV.
All the simulations are carried out by the Gurobi solver via a desktop with 11th Gen Intel (R) Core (TM) i5-1135G7 at 2.40 GHz, 16 GB, Windows 10 operation system plus MATLAB R2021a. The algorithm calculation time is 4.822 s when solving the optimal scheduling plan model. The optimization algorithm calculation time in the real-time charging control of EVs and ESS in CS is 129.235 s considering the changes in the number of EVs entering and leaving CS, as well as the consistency of the scheduling time interval. In the optimal dispatch schedule and real-time control model, the algorithm calculation time is much less than 15 min, and the computational burden is affordable for the energy management strategy.
5.2.4 Result verification
For CS equipped with ESS, the capacity of ESS is also an important factor affecting the operation strategy. To further check out the effectiveness and accuracy of the proposed energy management strategy, the impact of the ESS capacity change on the implementation of scheduling strategies and control algorithms is also shown in Table 4. The results show that not all the EVs’ charging demands are satisfied. The real-time control can chase the schedules and still generate similar profits. In the optimization model of the CS dispatch schedule, peak shaving and valley filling income, arbitrage income, and power purchase cost are all related to energy storage and charging load. When the number of EVs and related parameters remain unchanged, the charging income is almost not affected by the ESS capacity. As for the entire CS operation, the total revenue will increase when the ESS capacity increases.
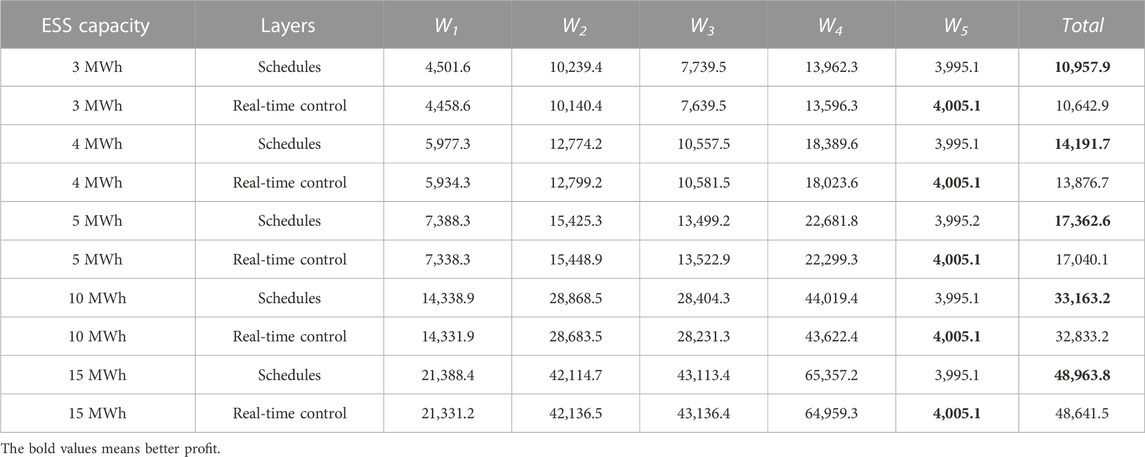
TABLE 4. Optimal objective values and comparisons with different ESS capacities.
The errors between EV real-time SoC and expectations are calculated in Figure 18. The control error of the expected SoC of EVs in CS can be controlled within 20% under the current charging dispatch capacity constraints of CS. Because the objective of the charging control model is aimed at the maximum profits of the CS aggregators, not including the penalty term regarding the charging SoC expectations. When the power is applied to the ancillary services, the profits will increase, and the schedule plan of CS can be better followed, which brings advantages for the power balance of the grid.
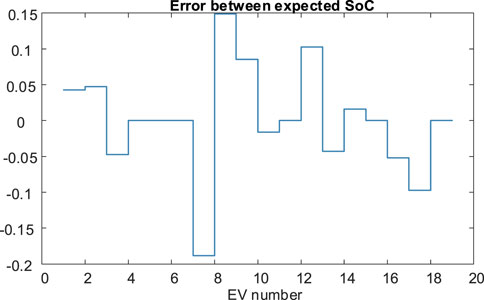
FIGURE 18. Errors between EV real-time SoC and expectations.
In Figure 19, the dispatch curve following the error of CS is constrained within 10%. The benefit indicator of peak shaving and valley filling can be derived from Figure 20, and the all-day peak shaving and valley filling benefit of the charging station is ¥14,540 under the current parameter settings. As for the scheduling capacity and charging demand in CS, the error is also controlled within 20%, and the results are shown in Figure 21.
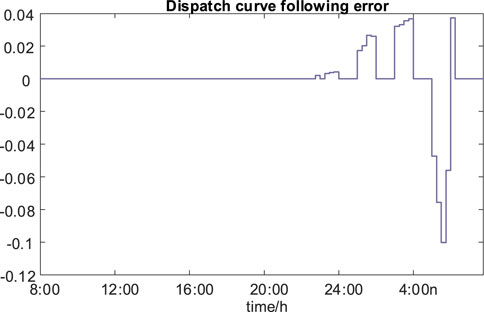
FIGURE 19. Errors of CS dispatch curve following.
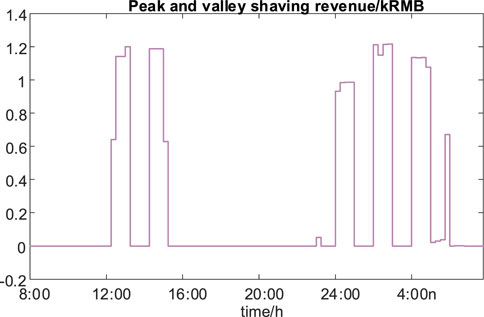
FIGURE 20. Peak and valley shaving revenues of CS.
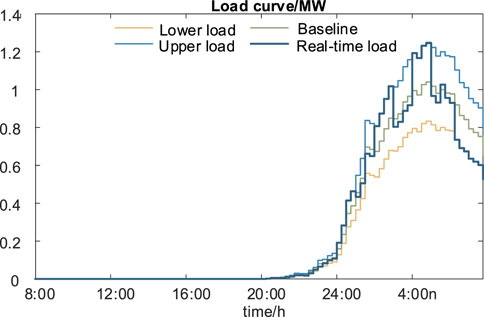
FIGURE 21. Real-time load curves and boundaries.
Therefore, the proposed energy management can estimate the dispatchability capacity of CS and then produce the optimal schedule plans for CS and equipped ESS. Finally, real-time control can also be realized by the charging and discharging of ESS, as well as the charging process control of the incoming EVs. The profits of the CS aggregators are optimized.
6 Conclusion
This paper proposes an optimal energy management strategy for CS operations considering peak and valley shaving. The dispatch potential assessment model is designed based on the EV users’ charging demand and stochastics. The dispatchability of the EV group in the CS is estimated for the dispatch planning and charging control model. The dispatch schedule is generated to maximize the profits of CS. The real-time charging control model of EVs in CS is exerted under the premise of meeting the charging needs of EV users. Therefore, the market clearing is realized, and the real-time regulation within CS is optimized for energy management. The proposed strategy can help the CS aggregator fulfill the interactions between the grid and EV users. The ancillary service requirements, charging needs of EV users, and improved energy management are negotiated to increase the CS aggregator’s revenues. It assists in improving the reliability and economics of grid dispatch operations. In the future, it is possible to guide users’ charging behavior by adjusting the service charge for EV users’ charging power. The peak and valley tariffs and the charging service charge are implemented as tariff price signals to guide users’ charging behavior. Therefore, the schedule can be executed and the controlling process of users’ charging is achieved using the real-time charging control model. The revenues of the CS aggregators are improved. The larger scale of CS cluster aggregation and related network constraints will be considered in the follow-up study to establish a higher-level energy management system.
Data availability statement
The original contributions presented in the study are included in the article/Supplementary Material; further inquiries can be directed to the corresponding author.
Author contributions
BQ: conceptualization, investigation, writing–original draft, and writing–review and editing. MS: conceptualization and writing–original draft. SK: conceptualization, supervision, writing–original draft, and writing–review and editing. FZ: data curation and writing–original draft. BL: investigation and writing–original draft. JW: writing–original draft. JT: writing–original draft. JY: conceptualization and writing–original draft.
Funding
The authors declare financial support was received for the research, authorship, and/or publication of this article. This research was funded by Science and Technology Program of China Southern Power Grid Co., Ltd. (No.031200KK52222008).
Conflict of interest
Authors BQ, FZ, JW, and JT were employed by China Southern Power Grid Co., Ltd. Authors MS and BL were employed by Zhaoqing Power Supply Bureau of Guangdong Power Grid Co., Ltd.
The remaining authors declare that the research was conducted in the absence of any commercial or financial relationships that could be construed as a potential conflict of interest.
The authors declare that this study received funding from China Southern Power Grid Co., Ltd. The funder had the following involvement in the study: Conceptualization, Investigation, Data curation.
Publisher’s note
All claims expressed in this article are solely those of the authors and do not necessarily represent those of their affiliated organizations, or those of the publisher, the editors, and the reviewers. Any product that may be evaluated in this article, or claim that may be made by its manufacturer, is not guaranteed or endorsed by the publisher.
References
Ahmadian, A., Mohammadi-Ivatloo, B., and Elkamel, A. (2020). A Review on Plug-in Electric Vehicles: introduction, current status, and load modeling techniques. J. Mod. Power Syst. Clean Energy 8 (3), 412–425. doi:10.35833/MPCE.2018.000802
Heilmann, C., and Friedl, G. (2021). Factors influencing the economic success of grid-to-vehicle and vehicle-to-grid applications—a review and meta-analysis. Renew. Sustain. Energy Rev. 145, 111115. doi:10.1016/j.rser.2021.111115
Ke, S., Chen, L., Yang, J., Li, G., Wu, F., Ye, L., et al. (2022). Vehicle to everything in the power grid (V2eG): a review on the participation of electric vehicles in power grid economic dispatch. Energy Convers. Econ. 3, 259–286. doi:10.1049/enc2.12070
Ke, S., Yang, J., Chen, L., Member, S., Fan, P., Shi, X., et al. (2023). A frequency control strategy for EV stations based on MPC-VSG in islanded microgrids. IEEE Trans. Ind. Inf., 1–12. doi:10.1109/TII.2023.3281658
Kester, J., Noel, L., Zarazua de Rubens, G., and Sovacool, B. K. (2018). Policy mechanisms to accelerate electric vehicle adoption: a qualitative review from the Nordic region. Renew. Sustain. Energy Rev. 94, 719–731. doi:10.1016/j.rser.2018.05.067
Koolman, G., Stecca, M., and Bauer, P. (2021). “Optimal battery energy storage system sizing for demand charge management in EV fast charging stations,” in Proceedings of the IEEE Transp. Electrif. Conf. Expo, ITEC, Chicago, IL, USA, June, 2021, 588–594. doi:10.1109/ITEC51675.2021.9490138
Lee, I. K., Kim, M. S., and Elber, G. (1998). Polynomial/rational approximation of Minkowski sum boundary curves. Graph. Model. Image process. 60 (2), 136–165. doi:10.1006/gmip.1998.0464
Lien, J. M. (2008). Covering Minkowski sum boundary using points with applications. Comput. Aided Geom. Des. 25 (8), 652–666. doi:10.1016/j.cagd.2008.06.006
Lin, R., Chu, H., Gao, J., and Chen, H. (2023). Charging management and pricing strategy of electric vehicle charging station based on mean field game theory. Asian J. Control, 1–11. doi:10.1002/asjc.3173
Liu, Y., Jian, L., and Jia, Y. (2023). Energy management of green charging station integrated with photovoltaics and energy storage system based on electric vehicles classification. Energy Rep. 9, 1961–1973. doi:10.1016/j.egyr.2023.04.099
Lyu, C., Jia, Y., and Xu, Z. (2021). Fully decentralized peer-to-peer energy sharing framework for smart buildings with local battery system and aggregated electric vehicles. Appl. Energy 299, 117243. doi:10.1016/j.apenergy.2021.117243
Mao, T., Lau, W. H., Shum, C., Chung, H. S. H., Tsang, K. F., and Tse, N. C. F. (2018). A regulation policy of EV discharging price for demand scheduling. IEEE Trans. Power Syst. 33 (2), 1275–1288. doi:10.1109/TPWRS.2017.2727323
Mozafar, M. R., Amini, M. H., and Moradi, M. H. (2018). Innovative appraisement of smart grid operation considering large-scale integration of electric vehicles enabling V2G and G2V systems. Electr. Power Syst. Res. 154, 245–256. doi:10.1016/j.epsr.2017.08.024
Nikam, V., and Kalkhambkar, V. (2021). A review on control strategies for microgrids with distributed energy resources, energy storage systems, and electric vehicles. Int. Trans. Electr. Energy Syst. 31 (1), 1–26. doi:10.1002/2050-7038.12607
Pan, Z., Yu, T., Li, J., Qu, K., Chen, L., Yang, B., et al. (2020). Stochastic transactive control for electric vehicle aggregators coordination: a decentralized approximate dynamic programming approach. IEEE Trans. Smart Grid 11 (5), 4261–4277. doi:10.1109/TSG.2020.2992863
Qi, C., Liu, C. C., Lu, X., Yu, L., and Degner, M. W. (2023). Transactive energy for EV owners and aggregators: mechanism and algorithms. IEEE Trans. Sustain. Energy 14 (3), 1849–1865. doi:10.1109/TSTE.2023.3253162
Raoofat, M., Saad, M., Lefebvre, S., Asber, D., Mehrjedri, H., and Lenoir, L. (2017). Wind power smoothing using demand response of electric vehicles. Int. J. Electr. Power Energy Syst. 99, 164–174. doi:10.1016/j.ijepes.2017.12.017
Rehman, W. U., Bo, R., Mehdipourpicha, H., and Kimball, J. (2021). Sizing energy storage system for energy arbitrage in extreme fast charging station. IEEE Power Energy Soc. Gen. Meet. 2021, 1–5. doi:10.1109/PESGM46819.2021.9638078
Shafie-Khah, M., Siano, P., Fitiwi, D. Z., Mahmoudi, N., and Catalão, J. P. S. (2018). An innovative two-level model for electric vehicle parking lots in distribution systems with renewable energy. IEEE Trans. Smart Grid 9 (2), 1506–1520. doi:10.1109/TSG.2017.2715259
Shams, H., Sadeghfam, A., Rostami, N., and Tohidi, S. (2019). Exact approach for charging of PEVs with V2G capability to improve micro-grid reliability. IET Gener. Transm. Distrib. 13 (16), 3690–3695. doi:10.1049/iet-gtd.2018.6752
Shaukat, N., Khan, B., Ali, S., Mehmood, C., Khan, J., Farid, U., et al. (2018). A survey on electric vehicle transportation within smart grid system. Renew. Sustain. Energy Rev. 81, 1329–1349. doi:10.1016/j.rser.2017.05.092
Tiwari, D., Sheikh, M. A. A., Moyalan, J., Sawant, M., Solanki, S. K., and Solanki, J. (2020). Vehicle-to-Grid integration for enhancement of grid: a distributed resource allocation approach. IEEE Access 8, 175948–175957. doi:10.1109/ACCESS.2020.3025170
Wu, J., Martin, L. J., Northington, F. J., and Zhang, J. (2019). Oscillating-gradient diffusion magnetic resonance imaging detects acute subcellular structural changes in the mouse forebrain after neonatal hypoxia-ischemia. Zhongguo Jixie Gongcheng/China Mech. Eng. 30 (11), 1336–1348. doi:10.1177/0271678X18759859
Wu, X., Xu, Y., He, J., Wang, X., Vasquez, J. C., and Guerrero, J. M. (2020). Pinning-based hierarchical and distributed cooperative control for AC microgrid clusters. IEEE Trans. Power Electron. 35 (9), 9865–9885. doi:10.1109/TPEL.2020.2972321
Wu, Y., Ravey, A., Chrenko, D., and Miraoui, A. (2018). “A real time energy management for EV charging station integrated with local generations and energy storage system,” in Proceedings of the IEEE Transp. Electrif. Conf. Expo, ITEC, Long Beach, CA, USA, June, 2018, 977–984. doi:10.1109/ITEC.2018.8450235
Yan, Y., and Chirikjian, G. S. (2015). Closed-form characterization of the Minkowski sum and difference of two ellipsoids. Geom. Dedicata 177 (1), 103–128. doi:10.1007/s10711-014-9981-3
Yang, J., Wiedmann, T., Luo, F., Yan, G., Wen, F., and Broadbent, G. H. (2022). A fully decentralized hierarchical transactive energy framework for charging EVs with local DERs in power distribution systems. IEEE Trans. Transp. Electrif. 8 (3), 3041–3055. doi:10.1109/TTE.2022.3168979
Yang, T., Xu, X., Guo, Q., Zhang, L., and Sun, H. (2017). EV charging behaviour analysis and modelling based on mobile crowdsensing data. IET Gener. Transm. Distrib. 11 (7), 1683–1691. doi:10.1049/iet-gtd.2016.1200
Zhang, X.-Y., and Gu, S.-X. (2017). Research on energy management strategy of connecting and off-grid charging station with photovoltaic and storage system. Annu. Int. Conf. Electron. Electr. Eng. Inf. Sci. 131, 208–216. doi:10.2991/eeeis-17.2017.29
Keywords: electric vehicles, energy management, energy storage system, peak and valley shaving, charging station, charging control
Citation: Qian B, Song M, Ke S, Zhang F, Luo B, Wang J, Tang J and Yang J (2023) Multiple-layer energy management strategy for charging station optimal operation considering peak and valley shaving. Front. Energy Res. 11:1278480. doi: 10.3389/fenrg.2023.1278480
Received: 16 August 2023; Accepted: 17 October 2023;
Published: 03 November 2023.
Edited by:
Jiawei Wang, Technical University of Denmark, DenmarkReviewed by:
Chunjun Huang, Technical University of Denmark, DenmarkJiajia Yang, James Cook University, Australia
Copyright © 2023 Qian, Song, Ke, Zhang, Luo, Wang, Tang and Yang. This is an open-access article distributed under the terms of the Creative Commons Attribution License (CC BY). The use, distribution or reproduction in other forums is permitted, provided the original author(s) and the copyright owner(s) are credited and that the original publication in this journal is cited, in accordance with accepted academic practice. No use, distribution or reproduction is permitted which does not comply with these terms.
*Correspondence: Song Ke, kesong1997@whu.edu.cn