Optimal sizing and technical assessment of a hybrid renewable energy solution for off-grid community center power
 Muhammad Tamoor1
  Abdul Rauf Bhatti1
  Muhammad Imtiaz Hussain2
  Sajjad Miran3
  Tayybah Kiren4 Asma Ali5 Gwi Hyun Lee6*
- 1Department of Electrical Engineering and Technology, Government College University Faisalabad, Faisalabad, Pakistan
- 2Agriculture and Life Sciences Research Institute, Kangwon National University, Chuncheon, Republic of Korea
- 3Department of Mechanical Engineering, University of Gujrat, Gujrat, Pakistan
- 4Department of Computer Science (RCET), University of Engineering and Technology, Lahore, Pakistan
- 5On Farm Water Management Wing of Agriculture Department Punjab, Lahore, Pakistan
- 6Interdisciplinary Program in Smart Agriculture, Kangwon National University, Chuncheon, Republic of Korea
Decentralized energy generation systems based on renewable sources have significant potential to assist in the sustainable development of developing countries. The small-scale integration of hybrid renewable energy systems in off-grid communities has not been thoroughly researched. The primary objective is to develop a preliminary design for a PV/biogas hybrid system that can meet the energy needs of an off-grid community center. A survey was conducted to calculate the energy demands of an off-grid community center and a hybrid renewable system has been designed to supply the electricity. The optimum designed system is evaluated by the PVSYST simulation software and SuperPro Designer software. The annual production of the PV system is 34428 kWh/year, specific production is 1118 kWh/kWp/year, and the performance ratio is 81.72%. All the factors that contribute to energy loss are considered in designing a PV system. The average operating efficiency of the inverter is 92.6%, and global inverter losses are 2752.4 kWh. The biogas simulation findings show an adequate match with the composition of conventional biogas and contains 89.64% methane and 5.99% carbon dioxide content. Two sensitivity analyses of biogas based on hydraulic retention time and moisture content have been performed. Measurements readings of hourly data are used to analyse the performance of PV, biogas system as well as the hybrid system performance. At day time, the maximum power generation of the hybrid PV/Biogas and the maximum load demand of the community at that time are 25.2 kW and 24.31 kW, respectively. At night time, the maximum power generation of the hybrid system and the maximum load demand are 9 kW and 8.3 kW, respectively. The power factor (PF) of the system fluctuates between 0.92 and 0.98 and the frequency of the system is constant at 50 HZ.
1 Introduction
Energy is the basic requirement of human survival. On earth, the sun is the most important resource of energy for life. Although renewable energy has been used for thousands of years, only a small part of the technical and economic potential of renewable technologies has been recorded and used so far. Population and urbanization increasing in developing countries lead to low quality of life and high energy waste (Tamoor et al., 2020a). Fossil fuels are currently the main source of power production. The reason for this is that these are easy to obtain, economical, and greatly concentrated (Holechek et al., 2022). The capability of fossil fuels like oil and gas to achieve rapid economic development in each nation has led to an increase the dependence on oil and gas. The world relies greatly on oil and gas for power, and this approach will remain unchanged in the coming duration (Keyhani, 2016). Renewable energy (solar, wind, and biomass) sources around the world are rich and widely distributed/spread. Sunlight, wind power, biogas, and hydropower are proven to be the most valuable renewable energy sources used in different ways around the world (Rahman et al., 2022).
Photovoltaic (PV) energy has emerged as one of the most important renewable energy sources in recent years (Tamoor et al., 2022a; REN21 Renewables, 2022; Tamoor et al., 2022b). This source of energy has been utilized in energy communities (Tamoor et al., 2021a; Zhang et al., 2023a), as well as for self-consumption (Fernández et al., 2021; Tamoor et al., 2022c) and the production of electricity (Colmenar-Santos et al., 2020; Nicoletti et al., 2023). It has a few drawbacks too, including a reliance on weather conditions and limited energy management capabilities (Tamoor et al., 2022d). Therefore, additional support systems are required. Biogas, a mixture of methane (CH4), carbon dioxide (CO2), and traces of other gases, is currently starting to play a more significant part in this scenario (Zhu et al., 2019; Rafiee et al., 2021). Biogas is a renewable energy source and it can be conveniently stored and managed. Additionally, organic waste from many types of waste, such as animal manure, sewage treatment sludge, biowaste, etc., can be treated using the anaerobic digestion method (Tamoor et al., 2020a; Montes and Rico, 2020).
The most widespread renewable energy source and conceivable power source in the world is solar energy. The available sunshine can be used by current technology to produce 1,700 kWh of average energy annually (Tamoor et al., 2021b). However, due to its low emissions, photovoltaic technology has the best potential among all renewable energy sources (RES) to protect the world (Naderipour et al., 2022; Habib et al., 2023a; Zhang et al., 2023b). Furthermore, compared to other renewable energy sources, this technology is a better and more efficient energy source. For instance, the photovoltaic system continues to be an important system for electrification in remote areas of developing nations (Raza et al., 2022; Tamoor et al., 2023). Solar PV systems, on the other hand, uses solar cells to convert solar radiation into electric currents. A photovoltaic power system can be installed as a grid-connected or off-grid photovoltaic system (Tamoor et al., 2021c; Miran et al., 2022). In (Kirmani et al., 2017) authors present optimal planning of solar photovoltaic systems connected to the grid to achieve cost-effective operation of the system. Grid-connected photovoltaic (PV) systems have been found to have the lowest energy costs and are suitable for small industrial/commercial buildings. Currently, the photovoltaic markets are rising or growing rapidly at a rate of 35.0%–40.0% per year. Monocrystalline and polycrystalline silicon PV module cells remain the main photovoltaic technology, with fabrication/production costs of components of about $ 1.50 per watt (Razykov et al., 2011).
Habib et al. (2023b) presented research on the production of biogas energy, which can be produced from various sources, like an animal and municipal waste. Anaerobic digestion of animal manure reduces environmental pollution and produces comparatively cheap/inexpensive and easily accessible energy for dairy farms. The produced gases are used for heating water in commercial buildings, for cooking, lighting, dry grain, and greenhouse heating in cold weather (Habib et al., 2023b). A simulation model of the biogas production is given by analysis method. The output power of the biogas production is a direct part of the biogas consumption; therefore the modulations of the output power are key to ensuring constant voltage of the distributed energy system. Biogas generator sets are generally synchronous generators, and the engine is directly connected (Yanning et al., 2009). The integrated biogas/wind power generation system overcomes the difficulty in large-scale use of biogas production such as low fermentation temperature, wind power uncertainty, and fluctuation through the use of innovative technologies, and the cost of the entire system is reduced (Gu et al., 2009).
In (Jiang et al., 2009) the authors investigate biogas as fuel for internal combustion engines and briefly introduces the physical and chemical properties of biogas as well as engine operating problem. Dual-fuel engines are based on diesel engines, improved hybrid intake systems, and dual-fuel conditioning systems that work by mixing biogas with air into a flammable mixture. It is technically feasible to purify compressed biogas by high compression ratio and use it as a vehicle fuel since the biogas is ignited with a small amount of predominantly diesel (Jiang et al., 2009). To be able to use biomass efficiently, sophisticated optimization algorithms are required, taking into account not only the production of global biomass but also local character. The combination of combined heat and power (CHP) and biomass helps to increase energy efficiency and to improve the ecological sustainability of food (Celli et al., 2008). Financial research in biogas plants shows biogas is a powerful tool for job creation, self-sufficiency, and reduction of greenhouse gas emissions, thereby reducing deforestation and reducing the extinction of large numbers of species. If it is used on a large scale, it may prove to be a back bone for developing countries (Aggarwal and Gupta, 2009; Govender et al., 2019; Bedana et al., 2022).
The utilization of photovoltaic energy and biogas energy are extremely advanced technologies and each has been intensively studied worldwide. Due to the abundance of solar resources on the earth, photovoltaic energy is the most frequently used renewable resource (Hernández-Callejo et al., 2019). Although biogas has been commonly used on a small-scale in many developing countries, biogas has gained significant relevance as an energy source for sustainable development in recent years (Antar et al., 2021). In addition to promoting sustainable development and reducing dependency on a single renewable resource, hybrid PV and biogas technology can offer sustainable energy services based on commonly accessible indigenous resources. A hybrid PV-biogas system is considered a generally acceptable approach based on several thermodynamic, economic, and environmental evaluation findings (Zhang et al., 2019; Al-Najjar et al., 2022a).
The hybridization of photovoltaic systems and biogas digesters has gained popularity in developing nations, especially on small-scales. This is mostly due to the large number of sunny hours, the volume of organic waste that needs to be processed, and numerous issues with electricity distribution in these areas (Neto et al., 2010). A research study on 1 kW of photovoltaic and 3.5 kVA of biogas system is conducted to examine paid back period of the system. The findings of the research study indicate that a hybrid system improves the power supply with levelized cost of energy of 0.21$/kWh (Buragohain et al., 2021). However, the research presented in (Tamoor et al., 2020b) simulating a 3.0 kW integrated photovoltaic-biogas power system (consisting of a 2.84 kW PV system and a 4 m3 biogas system) to provide a consistent supply of electricity for a residence in an isolated region. Similarly, in Al-Najjar et al. (2022b), a photovoltaic and biogas-based hybrid system was optimized, and it was found that, despite having the capability to meet the proposed demand, the hybrid system only performs at 40% of its potential. The suitability of different configurations of hybrid solar PV-biomass systems in Europe was discussed by Hussain et al. (2017) and he studied the technical, climate data, and economic performance of these systems to determine the key factors influencing system selection for designing large-scale solar PV-biomass hybrid power systems.
If we examine the research studies conducted to investigate whether small households or communities can self-sufficiently produce their energy (Chowdhury et al., 2020), analyzed the feasibility of a 12.9 kWp off-grid power system using a 1.0 kW biogas generator to power rural areas of Bangladesh. Due to the country’s conditions, the system has an expected payback period of 6.9 years, while lowering CO2 emissions and providing more affordable and sustainable electricity. In Kirim et al. (2022), it was analyzed that the use of a biogas system alone is not energetically or economically profitable for stabilization and needs to be hybridized with photovoltaic systems to obtain better economic results. While (Samy et al., 2018) analyses the technical and financial feasibility of electrifying an apple farm by modeling a system consisting of 25 photovoltaic modules, 2 biogas generators, and a battery bank. Thus, the hybridization of photovoltaic and biogas systems in developing nations is an attractive option for self-consumption in off-grid communities. This is because of their fast payback period and an increase in the stability of the power supply, as examined in Ali et al. (2019) that took 20 distinct installations into account. In this research, the payback is calculated using photovoltaic installations between 40 and 85 kW and biogas digesters between 2.4 and 4.8 Nm3. According to the research, these systems have a payback period of under 5 years. A hybrid system integrating photovoltaic and biogas technology was proposed to supply electrical energy to educational buildings. This system is reliable and uses renewable energy sources for at least 50% of its electrical supply (Alfonso-Solar et al., 2020).
In recent years, the photovoltaic system has emerged as the industry standard. It estimates power generation while accounting for losses caused by the environment, efficiencies of system components, wiring, shading, module mismatches, soiling, reflection, aging, and clipping losses. PVSyst is a newly developed simulation software (launched by Folsom Labs) that combines AutoCad design capabilities with all functionalities of the PV system to help system designers generate a complete design in one software package (Tamoor et al., 2021d; Faiz et al., 2021; Habib et al., 2023b). To perform energy estimations and create 3D models, PVSyst enables the utilization of a single software package. From small to large size, and for each type of surface, including flat or uneven surfaces, it is capable of designing photovoltaic (PV) systems. It has the benefit of being able to provide highly accurate estimates of the PV system that can be installed at the proposed location, monthly and annual power production, performance ratio, layout of PV system, number of inverters and PV modules, single line diagram (SLD), losses in photovoltaic system, shading analysis, electric cabling selection, global horizontal irradiance (GHI), diffuse horizontal irradiance (DHI), plane of the array (POA) irradiation, temperature indicators, computer-aided drafting (CAD) tools and SketchUp shading integration. It is also feasible to select required components of system such as rating and type (Si-Mono, Si-Poly) of photovoltaic modules, inverters rating, tilt angle, azimuth angle, orientation (horizontal and vertical mounting) of photovoltaic modules, frame size, array row arrangement, inter-row spacing between PV array, and AC/DC electric cables during the design process for PV systems (Habib et al., 2023b; Habib et al., 2023c). When developing a simulations model of PV plants, PVSyst incorporates meteorological data from the NASA-SSE (Solar System Exploration, 2023), Metronome (Meteonorm Software, 2023), and Solar Prospector (Solar Prospector, 2021) databases.
After reviewing the literature on PV/biogas hybrid system installations, a research gap has been identified in the investigation of these systems to provide energy to off-grid communities. As a result, biogas will be examined in this work as an electricity-generating system when integrated with a photovoltaic system. A biogas production plant will be proposed based on the number of biomass resources (animal manure) that are readily available, and an in-depth evaluation of the optimum power of the biogas-fed generator will be performed. The size of the photovoltaic system to be installed will also be selected to maximize the benefits to the energy partners and minimize the initial cost. The design of a hybrid renewable energy generation system for an off-grid community center will take all of this into consideration. A significant number of studies on photovoltaic-biogas hybrid systems have used mathematical procedures or models like HOMER, etc. for predicting the performance parameters and output energy. Furthermore, there is insufficient study on the small-scale integration of hybrid systems in off-grid communities. Integration of photovoltaic systems with biogas systems is also prominent in rural communities due to the abundance of biomass resources and sunshine hours. Therefore, this study provides an in-depth review of integrating renewable sources, particularly solar PV and biogas for power generation for an off-grid community center.
2 Strategy and methodology
This research study is organised into different sections.
• Section one (Electric load calculation): To meet the energy demand of a rural community center consisting of a public school, public health center, and public hall, a survey is conducted to calculate the electric load of a community center. The survey also evaluates the potential of renewable energy resources like solar irradiance, availability, and type of raw material for the biogas system.
• Section two (Designing of renewable energy-based hybrid system): Based on survey results, A hybrid renewable-based system is designed to supply electricity in the off-grid community center by estimating the size of PV system, number of photovoltaic modules and inverter in PV system, size of the bio-digester, and the amount of animal manure required as the primary raw material for the generation of biogas.
• Section three (Simulation of PV and biogas system): The PVSYST software analyzes the potential of energy production for PV systems on an annual and monthly basis, along with the assessment of optimal tilt angle and inter-row spacing. The simulation of the biogas system has been carried out using the SuperPro Designer program. This software automatically calculates its own mass and energy balances.
• Section four (Hybrid system installation): A hybrid photovoltaic-biogas renewable-based system is installed at the site in the off-grid community center.
• Section five (Performance evaluation): In the last step, the performance evaluation of the hybrid PV/biogas system has been analysed.
2.1 Electric load calculation
To meet the energy demand of the rural community center consisting of public school, public health center, and public hall, a survey is conducted to calculate the electric load of a community center. The installed electrical load in the community center is specified in Table 1. The overall electrical consumption is calculated using the installed electrical equipment in all buildings. A hybrid renewable-based system will be designed to supply the electricity in the off-grid community center.
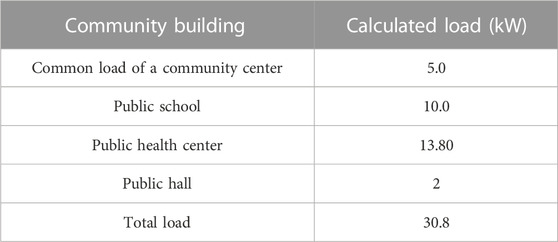
TABLE 1. Installed electrical load in community center
2.2 Designing of renewable energy-based hybrid system
The hybrid power system is an integration of different renewable energy systems that also uses some backup energy sources. Solar energy is an uncontrolled source of energy, as its availability depends entirely on climatic conditions. Sources that can be managed in terms of how much energy they produce are known as controlled sources. Biogas is a controlled source of energy. It is an optimal solution for electrifying off-grid communities. To overcome the constraints inherent in the photovoltaic system and the biogas system, and to achieve a highly reliable system for generating electric power at low cost. A hybrid PV-Biogas system is designed. These two sources will support and comply with each other to produce energy to fulfill the requirement of off-grid community center, and feed excess power into a battery bank. The Layout of a hybrid renewable-based system is shown in Figure 1.
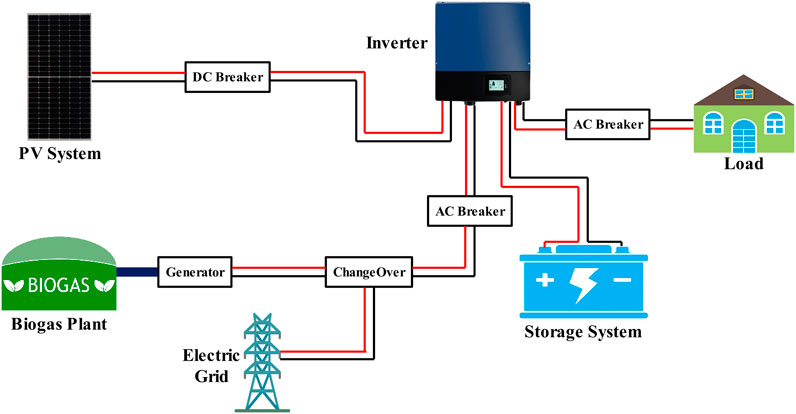
FIGURE 1. Layout of hybrid renewable-based system.
PV module’s powers are combined with biogas power. That power is utilized or absorbed by the electrical load through an inverter that converts the direct power (DC) into alternating power (AC). The output of a hybrid (Solar/biogas) system is utilized directly or stored in the battery bank/pack. The inverter has built-in protection/safety against overheating, short circuits, low battery voltage, and overload. Depending on system requirements, the battery bank/pack is designed to provide a specific number of days of load without the sun or wind/biogas. Solar cells are the power source for all photovoltaic (PV) devices. The solar cell is a solid-state semiconductor device that generates power when exposed to sunlight. The prime mover systems are operated by diesel engine/petrol engines. Biogas can also be used as fuel in these engines instead of petrol or diesel. Existing or presently available diesel engines have been converted to dual fuels, but they are still retaining the ability/capability to use diesel fuel, Petrol/Gasoline engines use 100% biogas. In the next subsections, the working principle of above said equipment is elaborated to understand how they work.
2.3 Photovoltaic system
2.3.1 PV working principle
The sun is the most important source of energy for all living activities on the earth, including the climate of the globe, the photosynthesis of plants, and the entire biogeochemical system. When electromagnetic radiation from the sun reaches the surface of the Earth, it is transformed into different forms of energy and used for several purposes. The two primary methods through which humans utilize solar energy are the generation of photoelectricity and thermal conversion. These applications indicate a significant advancement in the effort to compete against global energy shortages. For example, it is estimated that 60.0 TW can be economically converted into electricity after
2.3.1.1 Ideal SC model
A diode with the following three parameters is used to represent the ideal silicon solar cell (SC Model):
•
•
• Current (I) feed into load.
In Figure 2, a simplified model of the equivalent circuit of an ideal SC is shown, taking into consideration the fact that there is no current or voltage drop.
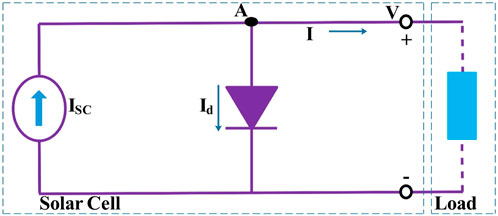
FIGURE 2. Equivalent model of ideal solar cell.
The short circuit current (
Where
•
•
• m: Ideality factor of diode
The current (
From the Eq. 1, we obtained two operating points of the silicon solar cell in the following ways:
For short circuit (
For open circuit (
The manufacturer-provided parameters of short circuit current (
2.3.1.2 Real solar cell model
The analysis of real solar cells takes into account all defects of the cell, i.e. defects of semiconductor material, junctions, and metal contacts. As illustrated in Figure 3, these defects are grouped into a series resistor (
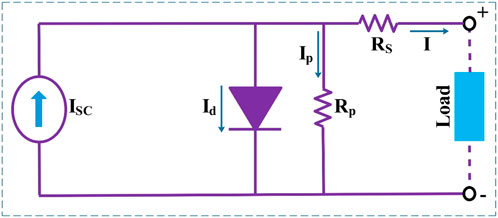
FIGURE 3. Equivalent model real solar cell.
The short circuit current (
From the previous equation, putting values in Equation 6
2.3.1.3 Photovoltaic (PV) modules
The solar cells are put together as a module, and then combined into an array, to produce the power that is required. The main feature of the PV module provided by the manufacturer is the: Module Peak Power (
2.3.2 Photovoltaic system designing
The calculated electrical load of the off-grid community center has to be considered while designing a PV energy generation system. Solar array design factors are taken into account when planning and designing a PV system. A 30.80 kW photovoltaic system consists of YINGLI Solar (PANDA 3.0 PRO 550 W). The open circuit voltage of the PV module is 50.26 V, the maximum voltage (Vmp) of the PV module is 41.57 V, and the module efficiency of 21.29%. SolarMax 30kw Hybrid inverter (SM-TX-30K) is used in designing of PV system with a rated output power of 30 kW and MPP Voltage Range of 500 VDC ∼ 900 VDC. Table 2 summarises the design parameters of the PV system.
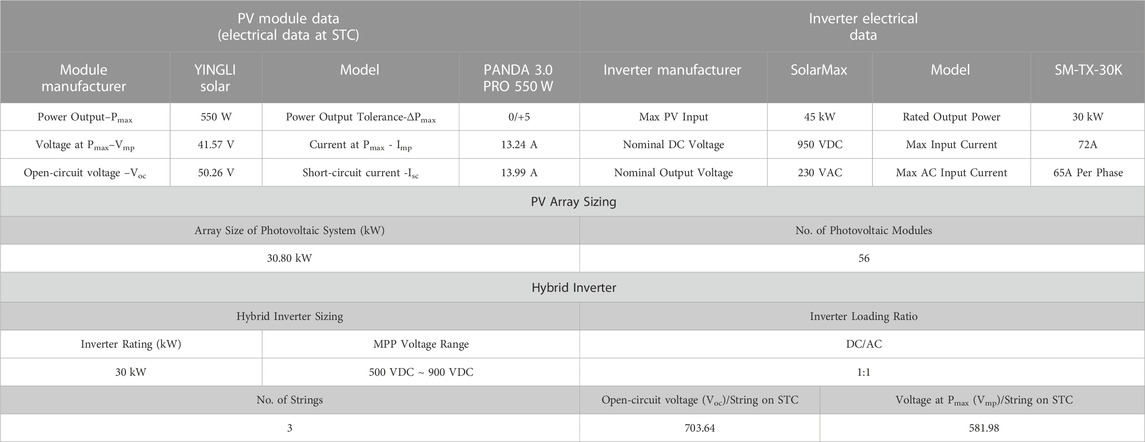
TABLE 2. Design parameters of PV system.
2.4 Biogas system
Anaerobic fermentation of organic materials produces biogas, and the technologies required to achieve this are renewable, readily available, abundant, and inexpensive. Thousands of biogas plants are operational in many developing countries (Ali et al., 2022; Seyitoglu et al., 2022; Yadav et al., 2022; Tavera-Ruiz et al., 2023). However, the further widespread production and use of biogas is primarily dependent on the availability of cheap/inexpensive and suitable designs of plants that are constructed by using locally or easily available materials and techniques. This research study explains the method of biogas production, and the factors that influence the design of plants. The biogas plant’s design, installation, operation, and maintenance details are explained with appropriate descriptions. In addition to operating specifications for cooking and lighting, it also covers the design of equipment for the use of biogas. The causes and accepted solutions to installation, operational, and technical problems occurring in biogas plants and equipment have been identified.
2.4.1 Biogas working principle
A mixing chamber is used for mixing various biomass sources (such as animal manure, agri. or food waste, etc.) with an equal amount of water (H2O). A slurry forms during this procedure. Through the inlet pipe, the entire slurry enters the digester. The introduction of the slurry stopped when the biogas digester was filled with slurry. Anaerobic bacteria in the digester break down or ferment biomass during retention time (20–35 days) (Abbasi et al., 2011; Admasu et al., 2022). Biogas is produced in the process of anaerobic degradation, and the dome of the plant starts to collect biogas. As an increasing amount of gas begins to collect, the waste slurry is forced into the outlet chamber by the pressure of the biogas. The compost pit collects an abundance of waste slurry from the outlet chamber. When a gas supply is required, open the gas valve installed on the dome of a biogas plant. The prepared slurry is continually fed into the operating plant to obtain a continuous supply of biogas.
2.4.2 Methane (CH4) production
2.4.2.1 Airtightness
Decomposition of organic matter in the presence of oxygen produces carbon dioxide and in the absence of oxygen methane (CH4) is produced. Biogas digester air/water tightness is crucial (Weiland, 2010).
2.4.2.2 Temperature
Fermentation temperature will greatly affect biogas production. According to the main conditions, methane (CH4) is produced over a wide temperature limit/range. However, the microorganism involved in methane (CH4) fermentation has the best activity at range from 30.0°C to 50.0°C. Biogas production is highest in the summer season and lower in the winter season. Methanogenic microorganisms are very sensitive to changes in temperature, and mutations when exceeding more than 40°C that affect production, so the relative stability of the temperature must be guaranteed (Weiland, 2010).
2.4.2.3 PH factor
A microorganism-neutral or slightly alkaline environment that is too alkaline or too acidic is harmful. The ideal pH range is between 7.0 and 8.0, but it can rise or fall by 0.50. PH depends upon the acidity along with alkalinity, as well as the carbon dioxide (CO2) content of the digester/fermenter of the biogas plant. The determining factor is the acid concentration. Acetic acid should have a measured concentration of volatile acids below 2000.0 parts per million for normal fermentations. Excessive concentrations can strongly impede/inhibit the action of (CH4) methane microorganisms (Abbasi et al., 2011).
2.4.2.4 Solid content
Raw materials have a solid content of 7.0%–9.0%. The dilution ratio should be 4:5 or equal proportion (Tamoor et al., 2020a).
2.4.2.5 C/N ratio
The ratio between carbon and nitrogen must be between 25.0:1.0 and 30.0:1.0. The different ratios of different raw materials will vary (Tamoor et al., 2020a).
2.4.2.6 Water content
This should be 90.0% of the total. When the amount of water (H2O) is too large, the productivity per volume unit in the digester decreases, which impedes/hinders optimum use of the digester. If H2O (water) contents are too low/little, acetic acid (CH3COOH) will accumulate, which inhibits the process of fermentation, resulting in thick scum on the surface. The H2O (water) content varies depending on the raw materials used for the process of fermentation (Abbasi et al., 2011).
2.4.2.7 Supplementary nutrients
In situations when cow manure is used, it is not necessary to add nutrients as it contains all the nutrients that the organism needs to produce methane (Tamoor et al., 2020a).
2.4.2.8 Reaction period
Under optimal conditions, a total gas production of 80.0%–90.0% is obtained in 4–5 weeks. The size of the digester is determined by the reaction time (Abbasi et al., 2011).
2.4.2.9 Harmful materials
Micro-organisms that contribute to the production of biogas are susceptible to many harmful substances. The maximum allowable concentrations of such hazardous substances are as sodium chloride (NaCl) is 40.0 parts per billion, copper (Cu) is 0.0001 kg per litre, ammonia (NH3) is 1500.0–3000.0 mg per litre, sodium (Na) is 3500.0–5500.0 mg per liter, potassium (K) is 2500.0–4500.0 mg per litre, calcium (Ca) is 2500.0–4500.0 mg per litre and magnesium (Mg) is 1000.0–1500.0 mg per litre (Eziyi and Krothapalli, 2014). These toxic substances should not exist, or their concentration should be diluted, e.g. by adding (H2O) water.
2.4.2.10 Methane content of biogas
Biogas produce from different raw materials has different methane concentrations cattle manure contains 55%–90% methane content, fruit/vegetable waste has 49.20%, food waste has 62%, green leaves has 65%, bamboo dust has 71.50%, dry leaves have 59.20% and bagasse has 56.90% methane content (Tamoor et al., 2020a).
2.4.2.11 Gas production
The precise quantity of biogas production relies on several variables. The first is that the amount of animal manure varies based on the breed of animal, the type of feed, the season of year (summer or winter), and whether the animal lives in a stable or is allowed to graze freely. Table 3 given below gives an idea about the amount of gas that can be obtained from different types of raw materials (Abbasi et al., 2011).
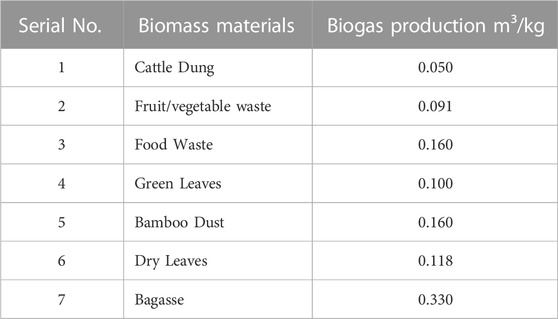
TABLE 3. Biogas production from various raw materials.
2.4.3 Designing of biogas plant
A survey has been conducted in the off-grid region, and it was found that the average household within the region has more than 10 animals. Table 4 provides information on the average manure production of several living things (Habib et al., 2023b).
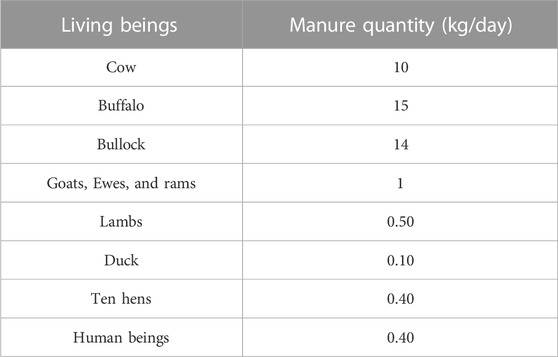
TABLE 4. Average production of manure from various living things.
Fifteen households are located in the off-grid rural community, and they supply 20 kg of manure (cow or buffalo, etc.).
Average production of biogas from animal manure/kg = 0.05 m3 (Habib et al., 2023b).
Biogas production = 300 × 0.05
The efficiency of the biogas plant is 80.0%
A biogas plant needs to be designed that will produce 12 m3 of gas each day. The following mathematical formulae (12) are used to calculate the size of domestic scale biogas plant:
Biogas plant digester size (m3) =
The ratio of raw feedstock (animal or food waste) and water is 1.0:1.0
The optimum retention time of input feedstock (salary) in the digester of the biogas plant is 30 days.
1 Cubic Meter = 1,000 kg
To produce 12 m3 of biogas per day from the daily intake of 300 kg of raw material (animal manure), the digester of the biogas plant must have a minimum capacity of approximately 18 m3. The most appropriate dimensions for the 18 m3 biogas digester are 2.10 m in radius and 1.30 m in depth. The cylindrical volume of the biogas digester is calculated by Equation 16 given below.
Volume of biogas digester = 18.006 m3
The dome of the digester can store 60 to 80 percent of the daily biogas production. A volume of 75% of the daily total biogas production is chosen for this research investigation.
Hence, a 9 m³ dome of the digester is required to store the biogas. The suitable dimensions for the 9 m³ dome are radius (2.10 m) and height (1.18 m). The Equation 18 given below is used for calculating the volume of the spherical dome.
Therefore, a 27 m3 biogas plant is designed and installed to produce 12 m3 of biogas. This 27 m3 biogas plant have 18 m³ plant digester tank and 9 m³ dome of the digester.
3 Results and discussions
3.1 Meteorological and incident energy of the PV system
In Table 5, the meteorological as well as incident energy of the PV system at the chosen site is presented. This data includes global horizontal irradiance (GHI), diffuse horizontal irradiance (DHI), wind velocity, ambient temperature, global incident in the collector plane, sky diffuse incident, albedo incident, and incident sky diffuse to global ratio. These factors are crucial for the modelling of photovoltaic (PV) energy generation systems because they assist in assessing the site’s energy potential. At the selected location, annually GHI is 1673.9 kWh/m2, and annually DHI is 852.27 kWh/m2. The annual global incident in the collector plane is 1468.3 kWh/m2, whereas the sky diffuse incident is 800.56 kWh/m2 and the albedo incident is 5.697 kWh/m2. These values are at their maximum in the summer season and their lowest in the winter season due to fog, rain, and other causes. The selected research site receives the most optimal solar irradiance throughout the year for the generation of photovoltaic energy. The annual average wind velocity is 1.8 m/s and the average annual ambient temperature is 23.63°C. The highest temperature measured is 32.10°C in May, and the lowest temperature measured is 11.26°C in January. In comparison to the winter and rainy seasons, the summer season has the highest measured ambient temperatures (°C). It was found that both wind speed and solar irradiance had an impact on the ambient temperature. Due to continuous exposure to solar irradiance, PV module temperature also increased.
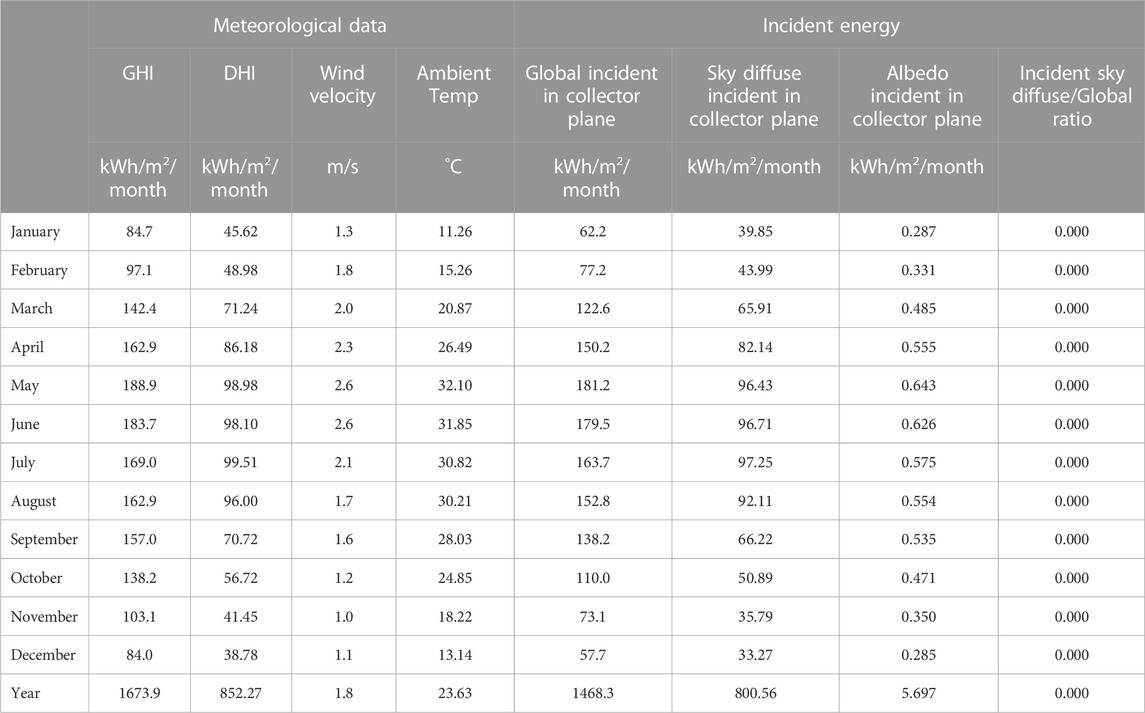
TABLE 5. Meteorological and Incident Energy of the PV system.
3.2 Simulation study of designed systems
3.2.1 Simulation of photovoltaic system
The PVSYST software analyses the potential of energy production for solar (PV) modules on an annual and monthly basis, along with the assessment of optimal tilt angle and inter-row spacing. This is performed at both the optimal tilt angles and orientations (true north or south). Table 6 shows the simulation results of designed photovoltaic system for off-grid community center. The annual production of the PV system is 34428 kWh/year, specific production of the system is 1118 kWh/kWp/year and annual performance ratio (PR) is 81.72%. The Normalized production of the designed PV system is 3.06 kWh/kWp/day, the Photovoltaic Array losses (collection losses) are 0.44 kWh/kWp/day and the overall system losses including inverter losses 0.24 kWh/kWp/day.
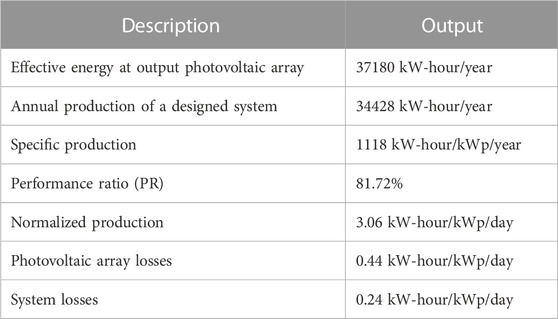
TABLE 6. Simulation results of designed PV system.
The monthly energy generation of the photovoltaic system is presented in Figure 4. The total annual effective energy of a photovoltaic array is 37180 kWh. The PV array’s energy production fluctuates from 1484 kWh in December, 1557 kWh in January to 4490 kWh in May, and 4392 kWh in June. With the use of an inverter, this energy is converted into AC energy. The total amount of annual AC energy is computed to be 34428 kWh. The amount of AC energy fluctuates from 1342 kWh in December, 1411 kWh in January, 4180 kWh in May, and 4082 kWh in June. Therefore, a difference in output energy between DC and AC is seen, which is caused by system losses. In various months (often October, November, December, January, and February), the expected output energy on the PV array side and the AC side declines. This is due to the influence of meteorological conditions, particularly solar irradiance, and losses in other components of a photovoltaic system.

FIGURE 4. Monthly energy generation of the photovoltaic system.
The primary performance indicator of a photovoltaic system that defines its design attributes is called the performance ratio (PR). This indicator is also known as quality parameters. The ability of a photovoltaic system to produce energy is evaluated using the performance ratio (PR). It represents the losses incurred by the photovoltaic system during the conversion of DC energy to AC energy and is expressed as the ratio between the final yield and the reference yields. Figure 5 shows that the average annual performance ratio of the PV system is approximately 81.72%, the highest PR is 84.7% in February, and the lowest PR is 79.6% in June. Due to the influence of climatic conditions, primarily an increase in the photovoltaic module temperature that results in overall energy loss, the performance ratio of the photovoltaic system under consideration falls in many months (frequently in May, June, and July).
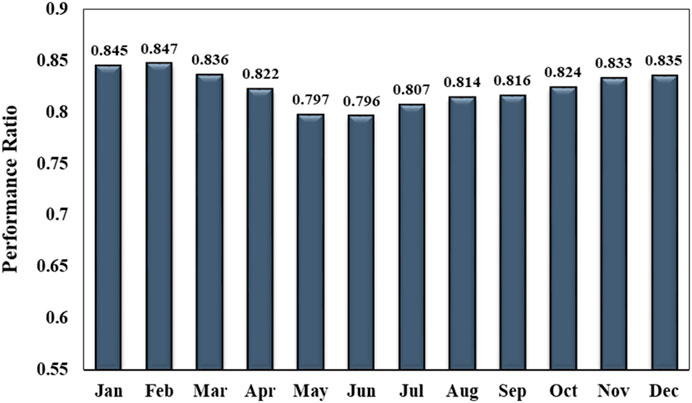
FIGURE 5. PV system performance ratio.
Simulation results for the normalized performance coefficient are shown in Table 7. Photovoltaic arrays experience system losses (Ls), including switching losses of power electronics devices, heat losses, and cable resistance losses, as well as collection losses (Lc), including losses from surface friction and losses that occur during the collection of photons in semiconductor materials, when electron jump losses between semiconductor materials. Furthermore, useful energy loss (Lu), is the output of the inverter after deducting all other losses. Due to the low solar irradiance in November, December, and January, it indicates that energy output is much lower during those months. The normalised collection losses due to PV-array losses are 0.44 kW-hour/kWp/day, the normalised PV array yield (Ya) is 3.31 kW-hour/kWp/day, the normalised system losses (Ls) due to an inverter and other losses are 0.24 kW-hour/kWp/day, and the normalised system Yield (Yf) at the inverter output is 3.06 kW-hour/kWp/day.
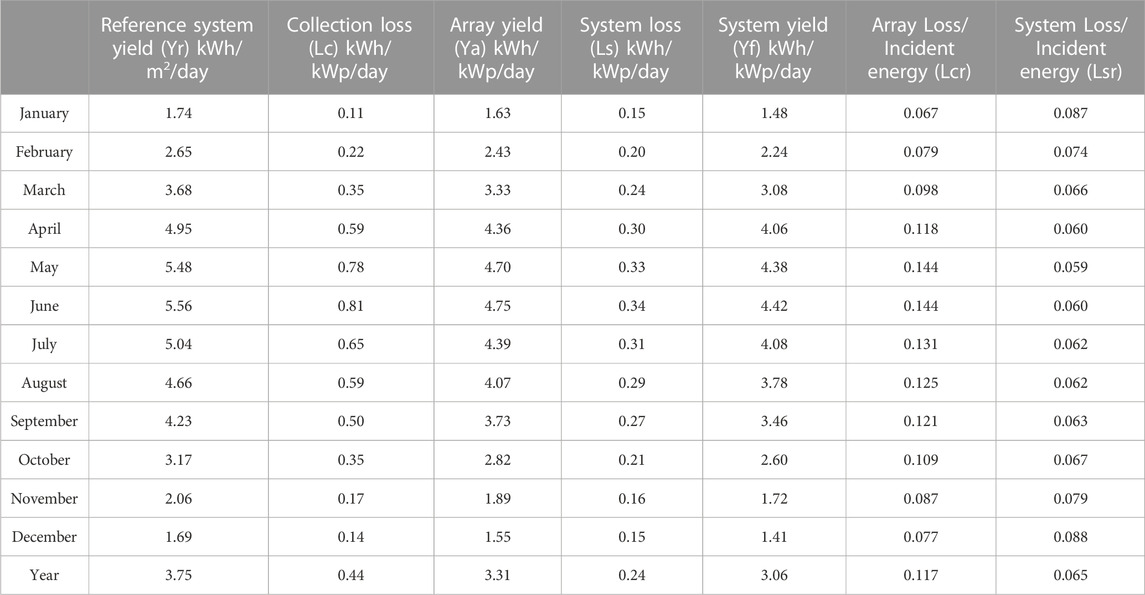
TABLE 7. Normalized performance coefficients.
All factors that contribute to energy losses must be taken into account when planning and installing a PV energy generation system, even though it is difficult to predict energy losses in advance with any degree of accuracy. The predicted annual and monthly energy losses are shown in Table 8 and include losses in module quality, photovoltaic array mismatch losses, inverter losses, and ohmic wiring losses in the DC array. The total annual losses in photovoltaic module quality are −284.977 kWh, total annual module array mismatch losses are 803.92 kW, total ohmic wiring losses in the DC array are 297.58 kWh and total annual inverter losses are 2752.4 kWh.
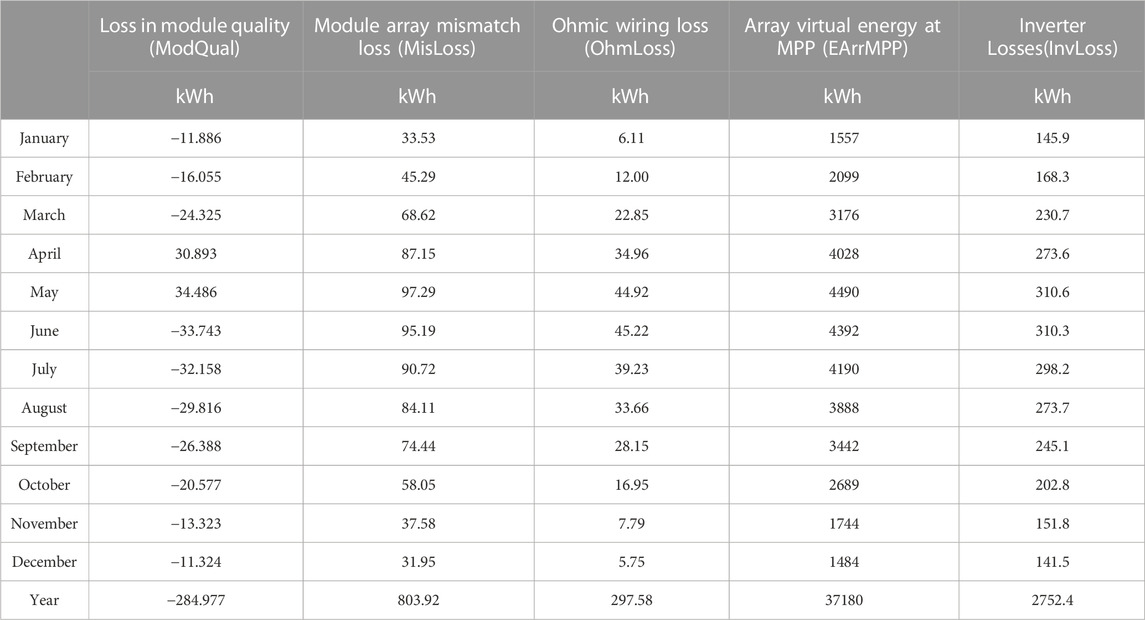
TABLE 8. Detailed losses of PV system.
The detailed inverter losses are shown in Table 9. The term “inverter losses” refers to a variety of losses, including “global inverter losses” which is the total of all inverter losses, “inefficiency loss,” or “loss during operation,” which is calculated using the efficiency curve, and the “loss (IL_Pmin)” which occurs when the array’s power is insufficient to start the inverter. When the MPP power exceeds the input power essential to produce the specified PNom(ac), the inverter adjusts the operating point on the I/V curve to obtain accurately the required power for PNom(ac). This causes inverter loss due to power overcharging (IL_Pmax). The distinction between the Pmpp and this corrected power is represented by this IL_Pmax loss value. Inverters also face losses as a result of the upper voltage MPP window (IL_Vmax) and the lower voltage MPP window (IL_Vmin). The inverter will clip the Vmpp to the limit value if it is outside the window of the inverter (Vmppmin/VmppMax). The annual average operating efficiency of the inverter is 92.6% and global inverter losses are 2752.4 kWh.
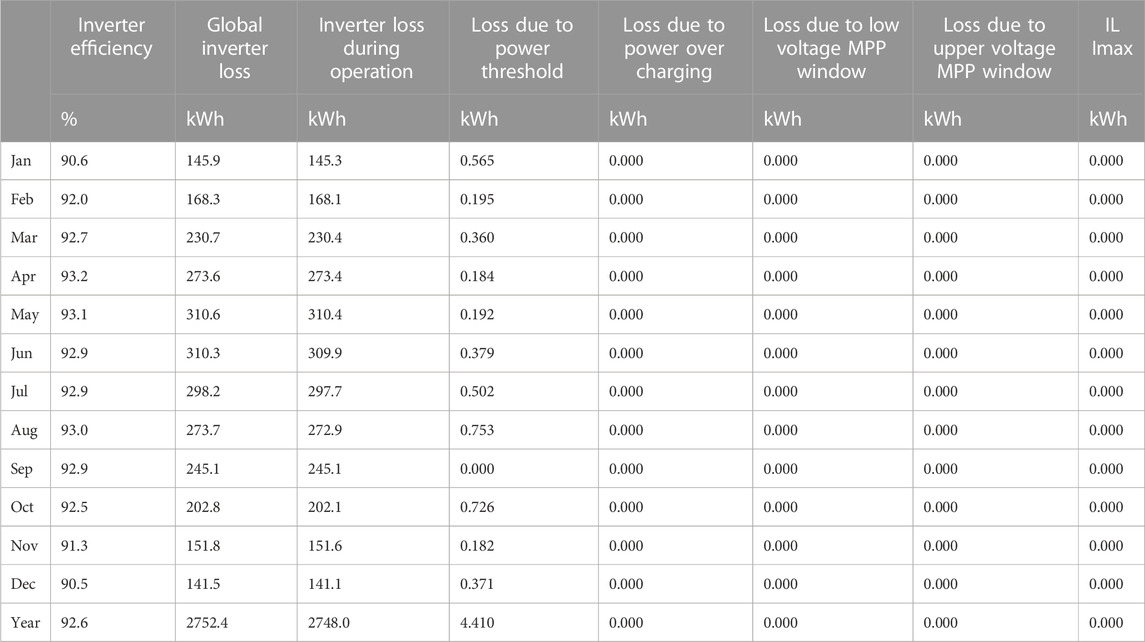
TABLE 9. Detailed inverter losses.
3.2.2 Simulation of biogas system
The simulation of the biogas system has been carried out using the SuperPro Designer program. After receiving all of the input data, the software automatically calculates its own mass and energy balance, volume of every component process, and power requirements. It is necessary to specify the raw material’s composition before simulation. The input stream contains raw material in the form of animal manure. The water stream and input stream (animal manure) are combined in a 1:1 ratio. At 40 °C and 2 atmospheric pressure, the mixtures of water and animal manure enter the biogas digester. The simulation findings of this research study show an adequate match with the composition of conventional biogas. The two main substances that makeup biogas are methane (CH4) and carbon dioxide (CO2), which account for 89.64% and 5.99%, respectively as shown in Table 10. Additionally, there are 4.37% of trace components, which include oxygen, hydrogen (H2), hydrogen sulphide (H2S), and moisture.
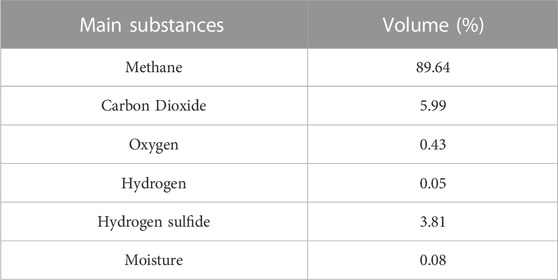
TABLE 10. Simulation result of biogas system.
In this research study, we performed two sensitivity analysis based on hydraulic retention time and moisture content. To perform a first-sensitivity analysis, various hydraulic retention times (HRTs) used in the anaerobic digestion process are systematically taken into consideration. For this research study, HRT for input material ranges from 10 to 30 days. By changes in the hydraulic retention time, Figure 6 demonstrates how the content of methane (CH4) varies. As retention time increases, the content of methane increases linearly. At various HRTs of 10, 15, 20, 25, and 30, the content (%) of CH4 is 22.67%, 39.11%, 55.49%, 67.72%, and 79.25%, respectively. Methanogens often have a slower rate of regeneration than hydrolysis acidogenesis bacteria. To prevent methanogens from being washed out, the hydraulic retention time needs to be long enough to keep them inside the digester.
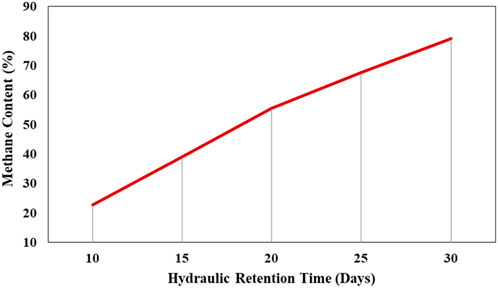
FIGURE 6. Impact of HRT on methane content.
The second sensitivity analysis aims to identify the impact of different water ratios used in the anaerobic digestion (AD) process. The amount of raw material (animal, food waste, etc.) remains constant while the amount of water gradually increases to evaluate the impact of the moisture content in methane (CH4) formation. Figure 7 shows that methane (CH4) production increases as the amount of moisture in the feedstock increases. However, carbon dioxide production marginally decreased when additional water was supplied to the bioreactor feedstock. When the amount (vol%) of the water and raw material is the same, raw material (animal, food waste, etc.) can produce a significant amount of methane.
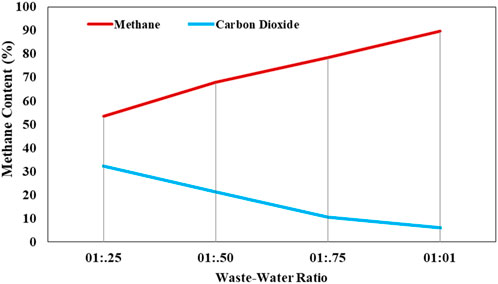
FIGURE 7. Impact moisture on methane content.
3.3 Power generation from installed system
Measurements of power generation from hybrid system, photovoltaic system, biogas system as well as the load have been recorded for 15 days in order to investigate and evaluate the performance, and production of the renewable energy-based hybrid system. For the first day, measurements are recorded on an hourly basis to evaluate how well the hybrid system as well as standalone system are working. After that measurements are recorded three times a day, in the morning, at noon, and in the afternoon, to determine the total power generated by the hybrid photovoltaic-biogas system and the load on the off-grid community center. Figure 8 shows the power generated by renewable energy sources (photovoltaic system and biogas system individually) as well as the total power generated by the installed hybrid photovoltaic-biogas system and the load demand of the community center at that time, which is analysed on an hourly basis. It was observed that the maximum generated power of PV system is 25.2 kW, while the maximum generated power of the biogas system is 8 kW. At day time, the maximum power generation of hybrid photovoltaic-biogas and the maximum load demand of the community at that time are 25.2 kW and 24.31 kW, respectively. At night time, the maximum power generation of the hybrid system and the maximum load demand are 9 kW and 8.3 kW, respectively. Therefore, it can be seen from Figure 8, that the hybrid PV/biogas system entirely meets the peak load requirement of the community center at each time. These findings of research study shows that community center become electrically independent and autonomous because of the hybrid power systems.
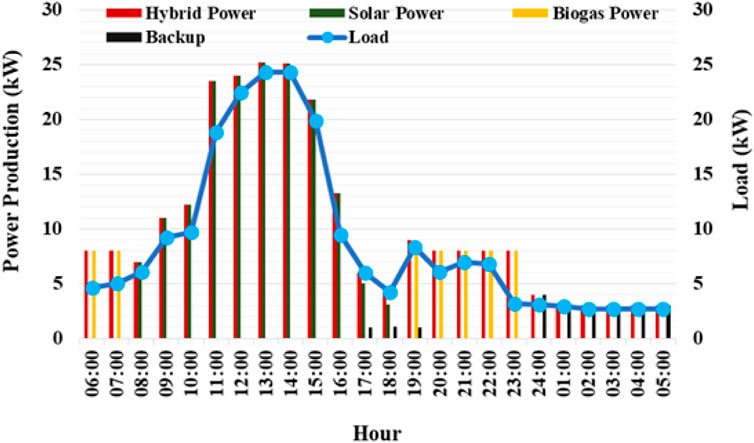
FIGURE 8. Hourly power generated by hybrid, individual systems, and load demand.
Figure 9 shows the combined electrical power from the hybrid photovoltaic-biogas system and load demand of the community center for 15 days during the morning hours. The results show that the hybrid photovoltaic-biogas system is capable of supplying 13.396 kW of power at its peak in the morning, whereas the highest demand of the community center is 11.978 kW. Therefore, it can be seen that the hybrid PV/biogas system entirely meets the peak load requirement of the community center and the hybrid system normally delivers more power than is required by the load. In the energy storage system, this additional generated power is stored. At the condition, when the hybrid system generates lower power than is required by the load as a result of the severe weather, especially foggy season. To meet the demands of the load at that moment, the system draws additional power from the energy storage system to ensure the stability and reliability of the system. The findings of the research study demonstrate that community centers become electrically independent and autonomous because of the hybrid power systems. Figure 10 shows the power factor (PF) and frequency of the hybrid system for 15 days during the morning hours. The PF of the system fluctuates between 0.847 and 0.927 and the frequency of the system fluctuates between 49.74 HZ and 49.99 HZ.
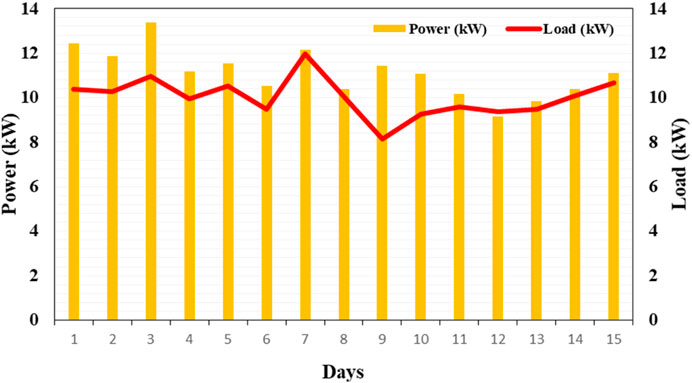
FIGURE 9. Hybrid system power and load demand during the morning hours.
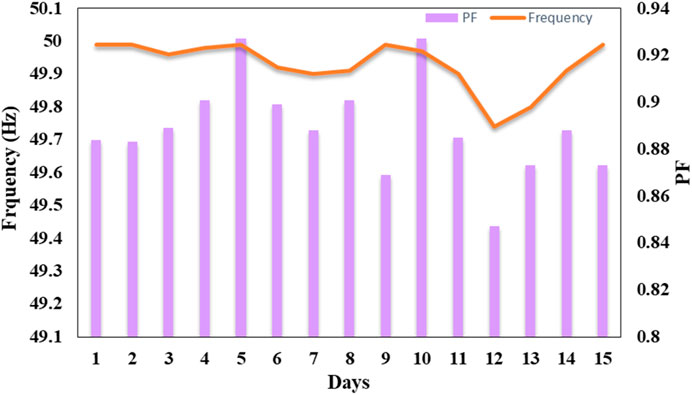
FIGURE 10. Power factor and frequency of the hybrid system during the morning hours.
Figure 11 shows the combined electrical power from the hybrid photovoltaic-biogas system and load demand of the community center for 15 days during the noon hours. The results show that the hybrid photovoltaic-biogas system is capable of supplying 23.94 kW of power at its peak in the noon, whereas the highest demand of community centers is 20.064 kW. Therefore, it can be seen that the hybrid PV/biogas system entirely meets the peak load requirement of the community center and the hybrid system normally delivers more power than is required by the load. As the electrification of the off-grid community will create opportunities for an improvement in the standard of life of the locals, the surplus power produced by the hybrid photovoltaic-biogas system will be utilized in the future to connect additional consumers simply by expanding the boundaries of the electric distributing system and adding additional energy storage system. Because the designed and installed photovoltaic-biogas system generates additional power, distributing it to the community will provide an economic surplus that will eventually pay off the initial investments. In severe weather, especially foggy season, the demands of the load are fulfilled by the system drawing additional power from the energy storage system to ensure the stability and reliability of the system. Figure 12 shows the power factor (PF) and frequency of the hybrid system for 15 days during the morning hours. The PF of the system fluctuates between 0.92 and 0.98 and the frequency of the system is constant at 50 HZ.
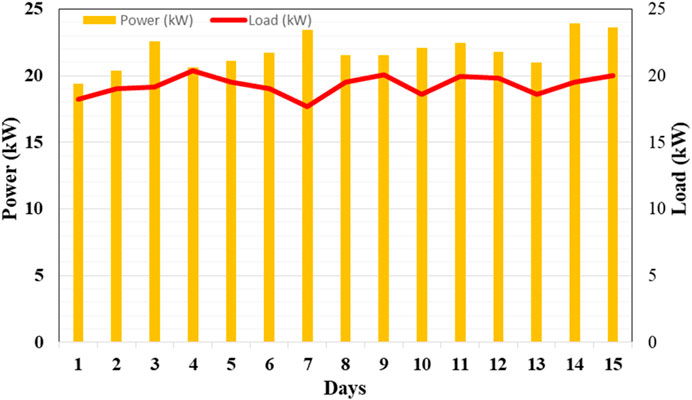
FIGURE 11. Hybrid system power and load demand during the noon hours.
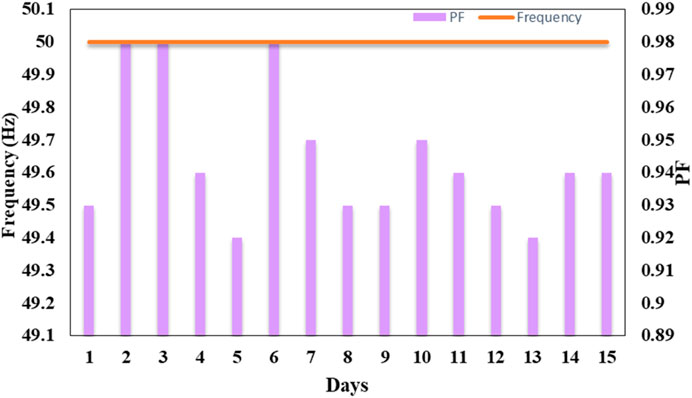
FIGURE 12. Power factor and frequency of the hybrid system during the noon hours.
Figure 13 shows the combined electrical power from the hybrid photovoltaic-biogas system and load demand of the community center for 15 days during the afternoon hours. The results show that the hybrid photovoltaic-biogas system is capable of supplying 13.396 kW of power at its peak in the afternoon, whereas the highest demand of community centers is 11.978 kW. Therefore, it can be seen that the hybrid PV/biogas system entirely meets the peak load requirement of the community center and the hybrid system normally delivers more power than is required by the load. The findings of the research study demonstrate that community centers become electrically independent and autonomous because of the hybrid power systems. Figure 14 shows the power factor (PF) and frequency of the hybrid system for 15 days during the morning hours. The PF of the system is fluctuates between 0.89 and 0.96 and frequency of the system fluctuates between 49.89 HZ and 49.99 HZ.
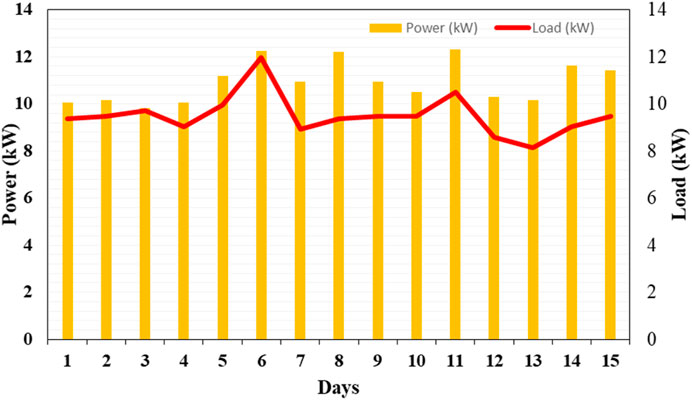
FIGURE 13. Hybrid system power and load demand during the afternoon hours.
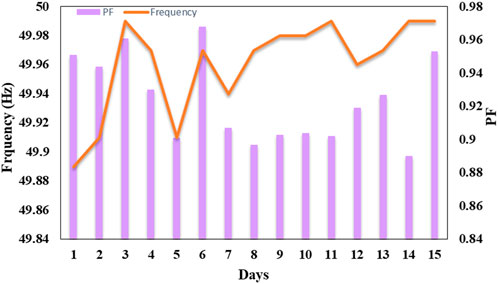
FIGURE 14. Power factor and frequency of the hybrid system during the afternoon hours.
3.4 Biogas purification
The biogas produced is usually stored in biogas digesters or large impermeable bags in biogas plants. The gas produced by the digester is transferred in a pipe to an adjacent generator and pressurized by the digester. However, biogas contains a significant quantity of carbon dioxide (CO2), hydrogen sulfide (H2S), and water vapors, these gases are essentially useless as fuel. Therefore, to make biogas appropriate for use in engines or generators, carbon dioxide (CO2), hydrogen sulphide (H2S), and water vapour must be removed. In this research, we use the water scrubbing method.
Carbon dioxide (CO2) and hydrogen sulphide (H2S) are physically absorbed in water under high pressure during water scrubbing. Carbon dioxide (CO2) present in raw biogas reacts with water (H2O) and forms carbonic acid (H2CO3). Water scrubbing is the cheapest and simplest biogas upgrading method, which uses pressurised water as the absorbent. The raw material biogas can be fed directly under storage pressure from the bottom into the scrubber while spraying pressurized water through the top nozzle. The absorption process is therefore counter current. This dissolves carbon dioxide (CO2) and hydrogen sulphide (H2S) in water and is removed by physical absorption because CO2 and H2S are more soluble in water than methane (CH4). Since H2S is more soluble than CO2 in water, water scrubbing can also be used to selectively remove H2S by further increasing the biogas pressure. A PVC pipe with a 4.50-inch diameter and a length of 6.0 feet is used for constructing a water scrubber. Water is supplied from the upper side of the scrubber (5.0 inches down from the top) and sprayed through a nozzle. The raw biogas is fed from the bottom of the scrubber (up to 5.0 inches from the bottom), thus providing a 5.0 feet height for scrubbing raw biogas with water. The raw biogas from the plant enters directly into the water scrubber. The washed water is drained from the bottom of the water scrubber, where a U-bend is provided for storing water and preventing the outflow of biogas. From the top of the scrubber, cleaned and purified biogas is released. The content of raw and purified biogas is shown in Table 11. The water-scrubbed biogas has 90.57% methane, and 7.03% carbon dioxide.
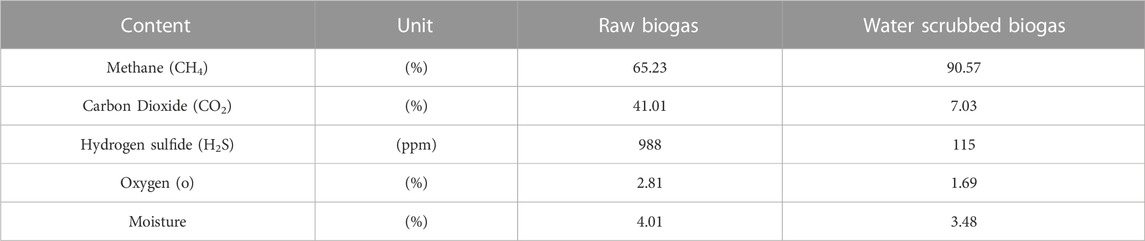
TABLE 11. Composition of raw and purified biogas.
4 Conclusion
Recent developments in the field of renewable energy have enabled the deployment of efficient and cost-effective renewable energy technologies to solve energy problems. Although renewable sources have seasonal and daily variations, they are environmentally friendly, inexhaustible, and non-polluting. The use of locally available renewable energy to supply the countryside with energy is one of the best possible solutions. Currently, renewable energy, even in off-grid communities, plays a vital role in providing fundamental energy services such as lighting and communications, heating cooling, cooking, pumping, and promoting economic development. This study evaluates a hybrid power system that combines PV and biogas system to provide electricity to an off-grid community center. The purpose of the study is to promote the use of local renewable energy sources. This study examines the individual and collective performance of a hybrid renewable energy system.
The PVSYST software analyses the potential of energy production for solar (PV) modules on an annual and monthly basis, along with the assessment of optimal tilt angle and inter-row spacing. The total annual effective energy of a photovoltaic array is 37180 kWh. The PV array’s energy production fluctuates from 1484 kWh in December, 1557 kWh in January, 4490 kWh in May, and 4392 kWh in June. With the use of an inverter, this energy is converted into AC energy. The total amount of annual AC energy is computed to be 34428 kWh. The amount of AC energy fluctuates from 1342 kWh in December, 1411 kWh in January, to 4180 kWh in May, and 4082 kWh in June. The average annual performance ratio of the PV system is approximately 81.72%, the highest PR is 84.7% in February, and the lowest PR is 79.6% in June. The total annual losses in photovoltaic module quality are −284.977 kWh, total annual module array mismatch losses are 803.92 kW, and total ohmic wiring losses in the DC array are 297.58 kWh. The annual average operating efficiency of the inverter is 92.6%, and global inverter losses are 2752.4 kWh.
The simulation of the biogas system has been carried out using the SuperPro Designer program. The two main substances that makeup biogas are methane (CH4) and carbon dioxide (CO2), which account for 89.64% and 5.99%, respectively. Additionally, there are 4.37% of trace components, which include oxygen, hydrogen (H2), hydrogen sulphide (H2S), and moisture. In this research study, we performed two sensitivity analysis based on hydraulic retention time and Moisture content. For this research study, HRT for input material ranges from 10 to 30 days. As retention time increases, the content of methane increases linearly. At various HRTs of 10, 15, 20, 25, and 30, the content (%) of CH4 is 22.67%, 39.11%, 55.49%, 67.72%, and 79.25%, respectively. In the second sensitivity analysis, the rate of methane (CH4) production increases as the amount of moisture increases and maximum when the amount of water and raw material are the same.
Measurements of power generation from hybrid, photovoltaic, and biogas system, the loads have been recorded for 15 days to investigate and evaluate the performance of the renewable energy-based hybrid system. The maximum generated power of a photovoltaic system is 25.2 kW, while the maximum generated power of a biogas system is 8 kW. In day time, the maximum power generation of the hybrid photovoltaic-biogas and the maximum load demand of the community at that time are 25.2 kW and 24.31 kW, respectively. At night time, the maximum power generation of the hybrid system and the maximum load demand are 9 kW and 8.3 kW, respectively. The photovoltaic system is capable of supplying the demand for most of the time. When PV produces low power, the power share from the biogas system is required to meet the load demand. The PF of the system fluctuates between 0.92 and 0.98 and the frequency of the system is constant at 50 HZ.
The photovoltaic-biogas hybrid power system has an excellent future because of its operational flexibility in minimizing potential power shortages, both seasonally and at all times of the day, and ensuring a more reliable and efficient supply of power for regions connected to the grid and off-grid. The Sustainable Development Goals (SDG) and other important worldwide environmental and socioeconomic development initiatives/programs would both benefit from increased use of power from renewable sources because of its efficiency and minimizing of carbon footprints. The proposed PV/Biogas hybrid system might also be viewed as a clean development mechanism if the government provides appropriate technical assistance and financing. As a new business opportunity, it will be more attractive to private investors. Finally, this research should convince decision-makers to use the implemented methodology in this work to have the optimum solution for practical renewable energy applications towards reliable solutions.
Data availability statement
The original contributions presented in the study are included in the article/supplementary material, further inquiries can be directed to the corresponding author.
Author contributions
MT: Writing–original draft. AB: Conceptualization, Supervision, Writing–review and editing. MH: Funding-acquisition, Resources, Writing–review and editing. SM: Project-administration, Validation, Writing–review and editing. TK: Formal-analysis, Software, Writing–review and editing. AA: Data-curation, Writing–review and editing. GL: Funding-acquisition, Resources, Writing–review and editing.
Funding
The author(s) declare financial support was received for the research, authorship, and/or publication of this article. This work was supported by the National Research Foundation of Korea (NRF) grant funded by the Korea government (MSIT) (No. 2022R1F1A1062793); Korea Institute of Planning and Evaluation for Technology in Food, Agriculture and Forestry (IPET) through Technology Commercialization Support Program, funded by Ministry of Agriculture, Food and Rural Affairs (MAFRA) (No. 821048-3).
Conflict of interest
The authors declare that the research was conducted in the absence of any commercial or financial relationships that could be construed as a potential conflict of interest.
Publisher’s note
All claims expressed in this article are solely those of the authors and do not necessarily represent those of their affiliated organizations, or those of the publisher, the editors and the reviewers. Any product that may be evaluated in this article, or claim that may be made by its manufacturer, is not guaranteed or endorsed by the publisher.
References
Abbasi, T., Tauseef, S. M., and Abbasi, S. A. (2011). Biogas energy, 2. New York, USA: Springer Science & Business Media.
Admasu, A., Bogale, W., and Mekonnen, Y. S. (2022). Experimental and simulation analysis of biogas production from beverage wastewater sludge for electricity generation. Sci. Rep. 12 (1), 9107. doi:10.1038/s41598-022-12811-3
Aggarwal, M., and Gupta, V. (2009). “Biogas as future prospect for energy dependency and rural prosperity in India: statistical analysis and economic impact,” in 2009 Systems and Information Engineering Design Symposium (IEEE), 45–48.
Alfonso-Solar, D., Vargas-Salgado, C., Sánchez-Díaz, C., and Hurtado-Pérez, E. (2020). Small-scale hybrid photovoltaic-biomass systems feasibility analysis for higher education buildings. Sustainability 12 (21), 9300. doi:10.3390/su12219300
Ali, M. Y., Hassan, M., Rahman, M. A., Kafy, A. A., Ara, I., Javed, A., et al. (2019). Life cycle energy and cost analysis of small scale biogas plant and solar PV system in rural areas of Bangladesh. Energy Procedia 160, 277–284. doi:10.1016/j.egypro.2019.02.147
Ali, S., Yan, Q., Irfan, M., and Chen, Z. (2022). Evaluating barriers on biogas technology adoption in China: the moderating role of awareness and technology understanding. Front. Environ. Sci. 10, 887084. doi:10.3389/fenvs.2022.887084
Al-Najjar, H., El-Khozondar, H. J., Pfeifer, C., and Al Afif, R. (2022a). Hybrid grid-tie electrification analysis of bio-shared renewable energy systems for domestic application. Sustain. Cities Soc. 77, 103538. doi:10.1016/j.scs.2021.103538
Al-Najjar, H., Pfeifer, C., Al Afif, R., and El-Khozondar, H. J. (2022b). Performance evaluation of a hybrid grid-connected photovoltaic biogas-generator power system. Energies 15 (9), 3151. doi:10.3390/en15093151
Antar, M., Lyu, D., Nazari, M., Shah, A., Zhou, X., and Smith, D. L. (2021). Biomass for a sustainable bioeconomy: an overview of world biomass production and utilization. Renew. Sustain. Energy Rev. 139, 110691. doi:10.1016/j.rser.2020.110691
Bedana, D., Kamruzzaman, M., Rana, M. J., Mustafi, B. A. A., and Talukder, R. K. (2022). Financial and functionality analysis of a biogas plant in Bangladesh. Heliyon 8 (9), e10727. doi:10.1016/j.heliyon.2022.e10727
Buragohain, S., Mohanty, K., and Mahanta, P. (2021). Hybridization of solar photovoltaic and biogas system: experimental, economic and environmental analysis. Sustain. Energy Technol. Assessments 45, 101050. doi:10.1016/j.seta.2021.101050
Celli, G., Ghiani, E., Loddo, M., Pilo, F., and Pani, S. (2008). “Optimal location of biogas and biomass generation plants,” in 2008 43rd international universities power engineering conference (IEEE), 1–6.
Chowdhury, N., Akram Hossain, C., Longo, M., and Yaïci, W. (2020). Feasibility and cost analysis of photovoltaic-biomass hybrid energy system in off-grid areas of Bangladesh. Sustainability 12 (4), 1568. doi:10.3390/su12041568
Colmenar-Santos, A., Linares-Mena, A. R., Molina-Ibáñez, E. L., Rosales-Asensio, E., and Borge-Diez, D. (2020). Technical challenges for the optimum penetration of grid-connected photovoltaic systems: Spain as a case study. Renew. energy 145, 2296–2305. doi:10.1016/j.renene.2019.07.118
Eziyi, I., and Krothapalli, A. (2014). Sustainable rural development: solar/biomass hybrid renewable energy system. Energy Procedia 57, 1492–1501. doi:10.1016/j.egypro.2014.10.141
Faiz, F. U. H., Shakoor, R., Raheem, A., Umer, F., Rasheed, N., and Farhan, M. (2021). Modeling and analysis of 3 MW solar photovoltaic plant using PVSyst at Islamia University of Bahawalpur, Pakistan. Int. J. Photoenergy 2021, 1–14. doi:10.1155/2021/6673448
Fernández, J. M. R., Payán, M. B., and Santos, J. M. R. (2021). Profitability of household photovoltaic self-consumption in Spain. J. Clean. Prod. 279, 123439. doi:10.1016/j.jclepro.2020.123439
Govender, I., Thopil, G. A., and Inglesi-Lotz, R. (2019). Financial and economic appraisal of a biogas to electricity project. J. Clean. Prod. 214, 154–165. doi:10.1016/j.jclepro.2018.12.290
Gu, W., Li, C., and Gu, M. (2009). “Study on the wind/biogas integration system for power generation and gas supply,” in 2009 World Non-Grid-Connected Wind Power and Energy Conference (IEEE), 1–4.
Habib, S., Jia, Y., Tamoor, M., Ans Zaka, M., Shi, M., and Dong, Q. (2023b). Modeling, simulation, and experimental analysis of a photovoltaic and biogas hybrid renewable energy system for electrification of rural community. Energy Technol. 11, 2300474. doi:10.1002/ente.202300474
Habib, S., Liu, H., Tamoor, M., Zaka, M. A., Jia, Y., Hussien, A. G., et al. (2023a). Technical modelling of solar photovoltaic water pumping system and evaluation of system performance and their socio-economic impact. Heliyon 9 (5), e16105. doi:10.1016/j.heliyon.2023.e16105
Habib, S., Tamoor, M., Zaka, M. A., and Jia, Y. (2023c). Assessment and optimization of carport structures for photovoltaic systems: a path to sustainable energy development. Energy Convers. Manag. 295, 117617. doi:10.1016/j.enconman.2023.117617
Hernández-Callejo, L., Gallardo-Saavedra, S., and Alonso-Gómez, V. (2019). A review of photovoltaic systems: design, operation and maintenance. Sol. Energy 188, 426–440. doi:10.1016/j.solener.2019.06.017
Holechek, J. L., Geli, H. M., Sawalhah, M. N., and Valdez, R. (2022). A global assessment: can renewable energy replace fossil fuels by 2050? Sustainability 14 (8), 4792. doi:10.3390/su14084792
Hussain, C. I., Norton, B., and Duffy, A. (2017). Technological assessment of different solar-biomass systems for hybrid power generation in Europe. Renew. Sustain. Energy Rev. 68, 1115–1129. doi:10.1016/j.rser.2016.08.016
Jiang, Y. H., Xiong, S. S., Shi, W., He, W. H., Zhang, T., Lin, X. K., and Wang, B. (2009). “Research of biogas as fuel for internal combustion engine,” in 2009 Asia-Pacific Power and Energy Engineering Conference (IEEE), 1–4.
Kalogirou, S. A. (2013). Solar energy engineering: processes and systems. 2nd Oxford. Academic Press.
Keyhani, A. (2016). Design of smart power grid renewable energy systems. 2nd ed. Hoboken, NJ, USA: John Wiley & Sons.
Kirim, Y., Sadikoglu, H., and Melikoglu, M. (2022). Technical and economic analysis of biogas and solar photovoltaic (PV) hybrid renewable energy system for dairy cattle barns. Renew. Energy 188, 873–889. doi:10.1016/j.renene.2022.02.082
Kirmani, S., Jamil, M., and Akhtar, I. (2017). Effective low cost grid-connected solar photovoltaic system to electrify the small scale industry/commercial building. Int. J. Renew. Energy Res. (IJRER) 7 (2), 797–806. doi:10.20508/ijrer.v7i2.5657.g7061
Meteonorm Software (2023). Worldwide irradiation data. Available online: https://meteonorm.com/en/(accessed on May 14, 2023).
Miran, S., Tamoor, M., Kiren, T., Raza, F., Hussain, M. I., and Kim, J. T. (2022). Optimization of standalone photovoltaic drip irrigation system: a simulation study. Sustainability 14 (14), 8515. doi:10.3390/su14148515
Montes, J. A., and Rico, C. (2020). Biogas potential of wastes and by-products of the alcoholic beverage production industries in the Spanish region of Cantabria. Appl. Sci. 10 (21), 7481. doi:10.3390/app10217481
Naderipour, A., Kamyab, H., Klemeš, J. J., Ebrahimi, R., Chelliapan, S., Nowdeh, S. A., et al. (2022). Optimal design of hybrid grid-connected photovoltaic/wind/battery sustainable energy system improving reliability, cost and emission. Energy 257, 124679. doi:10.1016/j.energy.2022.124679
Neto, M. B., Carvalho, P. C. M., Carioca, J. O. B., and Canafístula, F. J. F. (2010). Biogas/photovoltaic hybrid power system for decentralized energy supply of rural areas. Energy Policy 38 (8), 4497–4506. doi:10.1016/j.enpol.2010.04.004
Nicoletti, F., Cucumo, M. A., and Arcuri, N. (2023). Building-integrated photovoltaics (BIPV): a mathematical approach to evaluate the electrical production of solar PV blinds. Energy 263, 126030. doi:10.1016/j.energy.2022.126030
Peter, Y. U., and Cardona, M. (2010). Fundamentals of semiconductors: physics and materials properties. Berlin, Germany: Springer Science & Business Media.
Pveducation (2022). Solar cell operation. Available online: https://www.pveducation.org/pvcdrom/welcome-to-pvcdrom/solar-cell-operation (accessed on May 03, 2023).
Rafiee, A., Khalilpour, K. R., Prest, J., and Skryabin, I. (2021). Biogas as an energy vector. Biomass Bioenergy 144, 105935. doi:10.1016/j.biombioe.2020.105935
Rahman, A., Farrok, O., and Haque, M. M. (2022). Environmental impact of renewable energy source based electrical power plants: solar, wind, hydroelectric, biomass, geothermal, tidal, ocean, and osmotic. Renew. Sustain. Energy Rev. 161, 112279. doi:10.1016/j.rser.2022.112279
Raza, F., Tamoor, M., Miran, S., Arif, W., Kiren, T., Amjad, W., et al. (2022). The socio-economic impact of using Photovoltaic (PV) energy for high-efficiency irrigation systems: a case study. Energies 15 (3), 1198. doi:10.3390/en15031198
Razykov, T. M., Ferekides, C. S., Morel, D., Stefanakos, E., Ullal, H. S., and Upadhyaya, H. M. (2011). Solar photovoltaic electricity: current status and future prospects. Sol. energy 85 (8), 1580–1608. doi:10.1016/j.solener.2010.12.002
REN21 Renewables (2022). Global status report. Paris: REN21 Secretariat Available online: https://www.ren21.net/wpcontent/uploads/2019/05/GSR2022_Full_Report.pdf (accessed on April 23, 2023).
Samy, M. M., Sarhan, H. H., Barakat, S., and Al-Ghamdi, S. A. (2018). “A hybrid pv-biomass generation based micro-grid for the irrigation system of a major land reclamation project in kingdom of Saudi Arabia (ksa)-case study of albaha area,” in 2018 IEEE International Conference on Environment and Electrical Engineering and 2018 IEEE Industrial and Commercial Power Systems Europe (EEEIC/I&CPS Europe) (IEEE), 1–8.
Seyitoglu, S. S., Avcioglu, E., and Haboglu, M. R. (2022). Determination of the biogas potential of animal waste and plant location optimisation: a case study. Int. J. Energy Res. 46 (14), 20324–20338. doi:10.1002/er.8523
Sinovoltaics, (2022). Standard test conditions (STC): definition and problems. Available online: https://sinovoltaics.com/learning-center/quality/standard-test-conditions-stc-definition-and-problems/ (accessed on April 27, 2023).
Solar Prospector (2021). Solar resource data. Available online: https://www.pvsyst.com/help/meteo_import_solar_prospector.htm (accessed on May 15, 2021).
Solar System Exploration (2023). Solar system exploration. NASA-SSE. Available online: https://science.nasa.gov/solar-system/(accessed on April 13, 2023).
Tamoor, M., Abu Bakar Tahir, M., Zaka, M. A., and Iqtidar, E. (2022b). Photovoltaic distributed generation integrated electrical distribution system for development of sustainable energy using reliability assessment indices and levelized cost of electricity. Environ. Prog. Sustain. Energy 41 (4), e13815. doi:10.1002/ep.13815
Tamoor, M., Bhatti, A. R., Butt, A. D., Miran, S., Kiren, T., Farhan, M., et al. (2022c). Optimal sizing of a centralized hybrid photovoltaic system for efficient operation of street lights. J. Eng. Res. ICEPE Special Issue 1 (15), 19563. doi:10.36909/jer.icepe.19563
Tamoor, M., Bhatti, A. R., Farhan, M., Miran, S., Raza, F., and Zaka, M. A. (2021d). Designing of a hybrid photovoltaic structure for an energy-efficient street lightning system using PVsyst software. Eng. Proc. 12 (1), 45. doi:10.3390/engproc2021012045
Tamoor, M., Bhatti, A. R., Farhan, M., Zaka, M. A., and ZakaUllah, P. (2023). Solar energy capacity assessment and performance evaluation of designed grid-connected photovoltaic systems. Eng. Proc. 37 (1), 39. doi:10.3390/ECP2023-14729
Tamoor, M., Habib, S., Bhatti, A. R., Butt, A. D., Awan, A. B., and Ahmed, E. M. (2022a). Designing and energy estimation of photovoltaic energy generation system and prediction of plant performance with the variation of tilt angle and interrow spacing. Sustainability 14 (2), 627. doi:10.3390/su14020627
Tamoor, M., Hussain, M. I., Bhatti, A. R., Miran, S., Arif, W., Kiren, T., et al. (2022d). Investigation of dust pollutants and the impact of suspended particulate matter on the performance of photovoltaic systems. Front. Energy Res. 10, 1017293. doi:10.3389/fenrg.2022.1017293
Tamoor, M., Sagir, M., Abbas, G., Ans Zaka, M., and ZakaUllah, P. (2020a). Design, construction and production of small scale energy generation plant using indigenous resources. Iran. Iran. J. Energy & Environ. 11 (4), 308–319. doi:10.5829/IJEE.2020.11.04.09
Tamoor, M., Tahir, M. A. B., and Zaka, M. A. (2021b). Energy management system for integration of different renewable energy system into microgrids. Int. J. Adv. Trends Comput. Sci. Eng. 10 (2), 1234–1242. doi:10.30534/ijatcse/2021/1061022021
Tamoor, M., Tahir, M. A. B., and Zaka, M. A. (2021c). Photovoltaic integrated distributed energy generation system for sustainable energy development considering reliability indices and levelized cost of energy. Int. J. Adv. Trends Comput. Sci. Eng. 10 (3), 2540–2549. doi:10.30534/ijatcse/2021/1461032021
Tamoor, M., Tahir, M. S., Sagir, M., Tahir, M. B., Iqbal, S., and Nawaz, T. (2020b). Design of 3kW integrated power generation system from solar and biogas. Int. J. Hydrogen Energy 45 (23), 12711–12720. doi:10.1016/j.ijhydene.2020.02.207
Tamoor, M., ZakaUllah, P., Mobeen, M., and Zaka, M. A. (2021a). Solar powered automated irrigation system in rural area and their socio economic and environmental impact. Int. J. Sustain. Energy Environ. Res. 10 (1), 17–28. doi:10.18488/journal.13.2021.101.17.28
Tavera-Ruiz, C., Martí-Herrero, J., Mendieta, O., Jaimes-Estévez, J., Gauthier-Maradei, P., Azimov, U., et al. (2023). Current understanding and perspectives on anaerobic digestion in developing countries: Colombia case study. Renew. Sustain. Energy Rev. 173, 113097. doi:10.1016/j.rser.2022.113097
Weiland, P. (2010). Biogas production: current state and perspectives. Appl. Microbiol. Biotechnol. 85, 849–860. doi:10.1007/s00253-009-2246-7
Yadav, P., Yadav, S., Singh, D., Giri, B. S., and Mishra, P. K. (2022). Barriers in biogas production from the organic fraction of municipal solid waste: a circular bioeconomy perspective. Bioresour. Technol. 362, 127671. doi:10.1016/j.biortech.2022.127671
Yanning, Z., Longyun, K., Binggang, C., Chung-Neng, H., and Guohong, W. (2009). “Simulation of biogas generation,” in 2009 Transmission & Distribution Conference & Exposition: Asia and Pacific (IEEE), 1–5.
Zhang, C., Sun, J., Ma, J., Xu, F., and Qiu, L. (2019). Environmental assessment of a hybrid solar-biomass energy supplying system: a case study. Int. J. Environ. Res. public health 16 (12), 2222. doi:10.3390/ijerph16122222
Zhang, H., Yu, Z., Zhu, C., Yang, R., Yan, B., and Jiang, G. (2023b). Green or not? Environmental challenges from photovoltaic technology. Elsevier: Environmental Pollution.121066. doi:10.1016/j.envpol.2023.121066
Zhang, R., Lee, M., and Huang, L. (2023a). Grid parity analysis of photovoltaic systems considering feed-in tariff and renewable energy certificate schemes in Hong Kong. Renew. Sustain. Energy Rev. 181, 113326. doi:10.1016/j.rser.2023.113326
Keywords: solar photovoltaic, hybrid Energ system, community service, simulation tool, biogas
Citation: Tamoor M, Bhatti AR, Hussain MI, Miran S, Kiren T, Ali A and Lee GH (2023) Optimal sizing and technical assessment of a hybrid renewable energy solution for off-grid community center power. Front. Energy Res. 11:1283586. doi: 10.3389/fenrg.2023.1283586
Received: 26 August 2023; Accepted: 16 November 2023;
Published: 06 December 2023.
Edited by:
Shahzada Qamar Hussain, RMIT University, AustraliaReviewed by:
Saif Ur Rehman, COMSATS University Islamabad, PakistanMuhammad Abdul Basit, Institute of Space Technology, Pakistan
Copyright © 2023 Tamoor, Bhatti, Hussain, Miran, Kiren, Ali and Lee. This is an open-access article distributed under the terms of the Creative Commons Attribution License (CC BY). The use, distribution or reproduction in other forums is permitted, provided the original author(s) and the copyright owner(s) are credited and that the original publication in this journal is cited, in accordance with accepted academic practice. No use, distribution or reproduction is permitted which does not comply with these terms.
*Correspondence: Gwi Hyun Lee, ghlee@kangwon.ac.kr