Two-stage optimization of hydrogen and storage coordination for a multi-region flexible intermodal multi-energy port system
 Yueyang Xu
 Haijun Fu
 Junru Yang
 Leyuan Zhao
 Yang Zhang
- 1Academy of Electrical Information Engineering, Jiangsu University, Zhenjiang, Jiangsu, China
- 2Academy of Automotive and Transportation Engineering, Jiangsu University, Zhenjiang, Jiangsu, China
To address the issue of imbalanced electricity and hydrogen supply and demand in the flexible multi-energy port area system, a multi-regional operational optimization and energy storage capacity allocation strategy considering the working status of flexible multi-status switches is proposed. Firstly, based on the characteristics of the port area system, models for system operating costs, generation equipment, energy storage devices, flexible multi-status switches, and others are established. Secondly, the system is subjected to a first-stage optimization, where different regions are optimized individually. The working periods of flexible multi-status switches are determined based on the results of this first-stage optimization, targeting the minimization of the overall daily operating costs while ensuring 100% integration of renewable energy in periods with electricity supply-demand imbalances. Subsequently, additional constraints are imposed based on the results of the first-stage optimization to optimize the entire system, obtaining power allocation during system operation as well as power and capacity requirements for energy storage devices and flexible multi-status switches. Finally, the proposed approach is validated through simulation examples, demonstrating its advantages in terms of economic efficiency, reduced power and capacity requirements for energy storage devices, and carbon reduction.
1 Introduction
As the multi-energy power system rapidly advances, the integration of new energy modules such as wind power, photovoltaics, and hydrogen increases. This raises demands in various aspects like economic efficiency, energy utilization, stability, and flexibility of the power system. The distributed nature and the inherent randomness and uncertainty of modules like distributed wind and photovoltaic power generation pose risks and challenges to the operation and control of multi-source integration systems (Chen et al., 2020). Presently, the application of flexible multi-state switches allows for flexible interconnection of new energy modules, energy storage modules, and other power electronic devices. This, in turn, effectively enhances the comprehensive performance of the system (Deakin et al., 2022; Javaid et al., 2022; Huo et al., 2021; Li et al., 2022).
Currently, research on the operational optimization and power distribution strategies of renewable energy systems with flexible multi-state switches as a bridge is in its early stages. In reference (Pan et al., 2019), the focus was on microgrids as the research subject, and an improved droop control strategy with flexible interconnection devices was proposed. However, this study primarily addressed the short-term timescale and did not cover overall power distribution within the system. In reference (Ma et al., 2023), research centered on the optimization and control of low-voltage distribution networks with intelligent soft switches in the context of photovoltaic integration. A two-stage optimization control framework based on Second-Order Cone Programming (SOCP) was introduced for multi-regional low-voltage distribution networks connected by intelligent soft switches. This approach optimized voltage quality and network loss issues at the regional level, emphasizing control aspects as well.
While there is limited research in this area, renewable energy port systems with flexible multi-state switches as a bridge share similarities with integrated energy smart grids composed of multiple microgrids at the optimization and scheduling level, offering valuable insights. References (Xu et al., 2018; Wu et al., 2021) established daily economic scheduling models for integrated energy multi-microgrids, aiming to minimize total operating costs, thus achieving the lowest overall system cost. References (An et al., 2020; Li et al., 2019) introduced an adaptive chaotic particle swarm optimization method based on the basic particle swarm algorithm to control intelligent grids that include equipment like photovoltaics, wind power, and diesel generators. This approach improved optimization speed and performance. Reference (Wang et al., 2023) employed Nash negotiation game theory and considered carbon trading mechanisms to ensure that under overall system optimization, regional costs remain below the costs of independent optimization, enhancing system sustainability. Reference (Geng et al., 2020), also based on Nash negotiation game theory, focused on the complementarity of multiple energy sources within integrated energy systems and considered scenarios for the inclusion of new regions into existing systems, promoting long-term system development. Reference (Moniruzzaman et al., 2023) combined game theory with blockchain technology and applied it to the control of intelligent grid systems, ensuring fair microgrid transactions and system stability. However, it is important to note that competition exists between regions in intelligent grids, and the characteristics of energy routers differ significantly from those of flexible multi-state switches, making them less suitable for direct application in renewable energy systems using flexible multi-state switches as a bridge.
It is evident that existing research on flexible multi-energy systems largely focuses on improving overall system performance through energy quality control. However, within the realm of optimization and scheduling for multi-energy systems, especially those incorporating hydrogen as one of the energy sources, there is a dearth of comprehensive studies considering economic, carbon emission, and energy integration factors. Furthermore, there is a lack of research that takes into account the operating characteristics of flexible multi-state switches. This divide between multi-energy system operation and scheduling research and research on flexible switches is noticeable.
Therefore, in this paper, we use a novel optimization strategy (two-phase multi-region optimization) to solve the hydrogen-energy-electricity balance coordination problem for multi-region flexible intermodal multi-energy port systems. The core innovation of the scheme is reflected in the overall optimization of the system of flexible intermodal interactions between regions based on the determination of the operating periods of the inter-region connected devices (flexible multi-state switches) from the results of the individual region optimization. This scheme takes into account the operating characteristics of flexible multi-state switches. In addition, compared with other existing studies. The novelty of this paper is reflected in the fact that the optimization model is built with a comprehensive consideration of the economy, energy consumption rate, and carbon emission.
2 Port area wind-PV-storage-hydrogen system model
2.1 Introduction to the port area wind-PV-storage-hydrogen system
The multi-region flexible intermodal multi-energy port system (For the sake of brevity in the paper, this term will later be shortened to “port system.”) under investigation in this paper comprises three regions: 10 kV AC Segment 1, 10 kV AC Segment 2, and the DC region, interconnected flexibly using a flexible multi-state switch. This switch plays a vital role in regional power transfer. In practical operation, the DC region may not always achieve self-balance. Therefore, this paper treats 10 kV AC Segment 1 and the DC region as a single region, referred to as Region 1, while 10 kV AC Segment 2 is denoted as Region 2.
These regions are equipped with various renewable energy modules such as wind turbines, photovoltaic arrays, and electrolysis-based hydrogen production facilities. The energy in the system flows in the form of electricity and hydrogen. Electricity primarily serves the industrial power demand within the port area, while hydrogen is mainly used to supply hydrogen-powered vehicles, cranes, and other hydrogen energy loads. Excess hydrogen is stored in hydrogen fuel cells to power the system or is sold to some extent. The system topology is illustrated in Figure 1, and the energy flow is depicted in Figure 2.
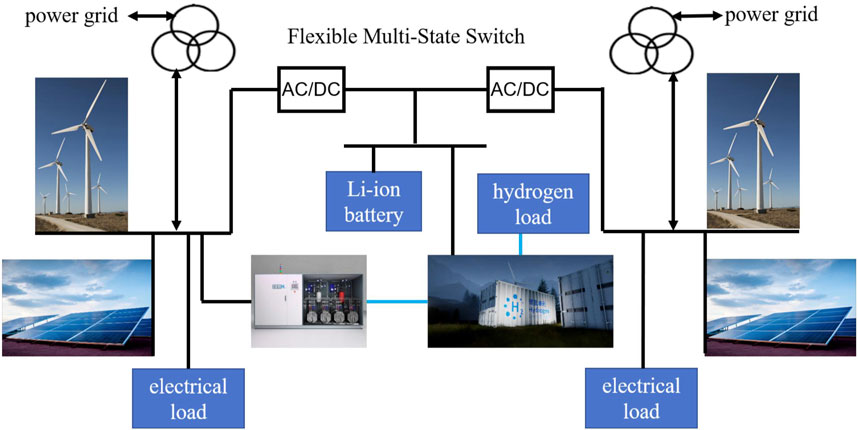
FIGURE 1. System topology.
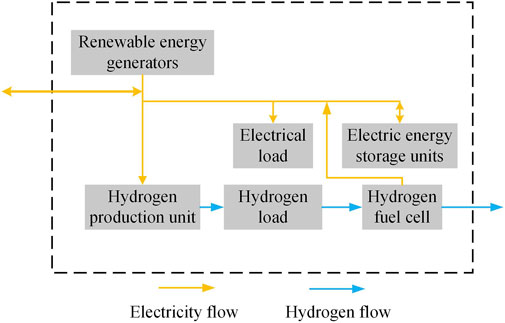
FIGURE 2. Regional energy flow diagram.
2.2 Wind and solar power output model
Given that real-time measurements and forecast data for the power generation of renewable energy devices in the port system are available, it is sufficient to constrain the actual power generation within the maximum power generation limits of these devices. The corresponding formula is as follows:
In the equation, PWTIreal,i(t) and PPVIreal,i(t) represent the actual power generation from the wind turbines and photovoltaic panels in region i, respectively, while PWTI,i(t) and PPVI,i(t) represent the maximum forecasted power generation of these devices in region i.
2.3 Energy storage module model
In the port system, the energy storage devices consist of lithium batteries and supercapacitors. The problem studied in this paper involves hourly energy coordination strategies. During dynamic processes, the energy storage system can be in a charging, discharging, or idle state. At any given time interval, the energy storage module’s energy storage level depends on the energy storage level in the previous time interval, the charging power Pcha,i(t), and the discharging power Pdis,i(t). Additionally, the energy conversion efficiency of the energy storage device is represented by ηsto. The energy storage module model is as follows:
In the equation, Ssto,i(t) and Ssto,i(t-Δt) represent the energy storage level of the energy storage module in region i at the current and previous time intervals, respectively.
To ensure that the state of charge of the energy storage device remains within a safe range, the following constraints need to be satisfied:
In the equation, SOCmin and SOCmax are the minimum and maximum state of charge values, respectively, and SOCt represents the state of charge of the energy storage device in region i at time t.
To ensure that the optimization results in each period are not affected by the initial energy storage level at the beginning of the period, it is set that the energy storage level is the same at the beginning and end of each optimization period. This equality is expressed as follows:
During the optimization process, it is possible to obtain results where both charging and discharging occur simultaneously. However, this is not practical. To address this, binary variables βcha,i(t) and βdis,i(t) are introduced to represent the charging and discharging states of the energy storage module. These variables take on values of 0 or 1, where 0 indicates the absence of the respective state, and 1 indicates the presence of the state.
Directly multiplying the parameters that represent the energy state of the energy storage module by their corresponding power in the objective function leads to non-linearity. Therefore, the following constraint is imposed:
2.4 Hydrogen energy module model
The hydrogen energy module in the port area consists of electrolysis-based hydrogen production, hydrogen fuel cells, and hydrogen storage modules (comprehensive building hydrogenation equipment). In engineering practice, data on the conversion efficiency of devices are available, e.g., the conversion efficiency of hydrogen from electrolyzed water, the conversion efficiency of hydrogen fuel cells. In addition, this paper does not improve the hydrogen energy equipment, so the principles of the equipment will not be discussed in detail in this paper.
The electrolysis module converts electrical energy into hydrogen, with a certain conversion efficiency. The conversion model is as follows:
In the equation, MHp,i(t) represents the mass of hydrogen produced by the electrolysis-based hydrogen production module in region i during time interval t, ηEH is the energy conversion efficiency of the electrolysis-based hydrogen production, and Phydro,i(t) is the electrical power used for electrolysis-based hydrogen production in region i during time interval t.
The hydrogen fuel cell module in the hydrogen energy module primarily converts excess hydrogen energy back into electrical energy when there is a severe power shortage in the port system. This helps fill the electrical energy deficit to some extent during specific time intervals. The model is as follows:
In the equation, PHreE,i(t) represents the output power of the hydrogen fuel cell in region i, ηHreE is the output efficiency of the hydrogen fuel cell in region i, and MHreE,i(t) represents the mass of hydrogen used for hydrogen fuel cell power generation in region i.
The hydrogen storage module in the hydrogen energy module is used to store temporarily unused hydrogen. Due to the complexity of modeling an effective hydrogen storage module, this paper simplifies it with equation constraints that balance the hydrogen production, industrial hydrogen demand, hydrogen sales, and hydrogen used for hydrogen fuel cells. The constraints are as follows:
In the equation, MHL,i(t) and Msell,h,i(t) represent the mass of hydrogen for the hydrogen load and the quantity of hydrogen sold in region i, respectively.
2.5 Flexible multi-state switch model
Flexible multi-state switches have a certain upper limit on their operating power and do not possess energy storage capabilities. Therefore, certain constraints are required to characterize them. The model is as follows:
In the equation, Ptran,i(t) represents the electrical power transferred through the flexible multi-state switch in region i at time t. When power is transferred into the region, its value is positive; when power is transferred out, it is negative. Ptranmax is the maximum transfer power of the flexible multi-state switch.
3 Objective function
In the dominant operation involving the 10 kV Segment 1 and 10 kV Segment 2, each region aims to minimize costs. In this paper, the objective function is designed to minimize costs while maximizing renewable energy integration and reducing carbon emissions. The objective function is as follows:
In the equation, CdWP,i, Cbuy,i, Csto,e,i, Csto,h,i, CL, CCO2, Ctran,e,i represent the costs of wasted wind and solar energy, purchasing energy, energy storage investment and operation, carbon tax, unsatisfied load loss, and electrical power transfer cost, respectively. Their specific formulas are as follows:
In the equation, δdWP, δLEloss, δLHloss, δsto,e, δsto,h, δCO2 are conversion coefficients for the cost of wasted wind and solar energy, electrical load loss, hydrogen load loss, energy storage, and carbon tax. The energy storage operation cost coefficient is calculated as 0.3% of the purchase cost. δbuy,e(t), δsell,e(t), δsell,h(t) are the purchase price, selling price, and hydrogen selling price in time interval t. CEsto, CPsto, CHsto represent the capacity cost and power cost of energy storage equipment. Esto,e and Psto,e are the rated capacity and power of energy storage equipment. rsto and rsto,h are the depreciation coefficients for energy storage and hydrogen storage equipment, set at 5%. m denotes the operational lifespan of the equipment, which is 20 years. Pbuy,e,i(t), Psell,e,i(t), PWTA,i(t), PPVA,i(t), PTUA,i(t) represent the power for purchasing electricity, selling electricity, total wind power, photovoltaic power, and thermal power in region i during time interval t. Msell,h,i(t), MHp,i(t), Mloss,h,i(t) represent the amount of hydrogen sold, hydrogen produced, and hydrogen load loss in region i during time interval t. αWT, αPV, αTU are carbon emissions conversion coefficients for wind power, photovoltaic power, and thermal power.
Whether a multi-energy hybrid system is genuinely green depends on the source of electricity during operation. The calculation formulas for the total wind power PWTA,i(t), total photovoltaic power PPVA,i(t), and total thermal power PTUA,i(t) in the port system are as follows:
In the equation, kWT, kPV, kTU are the proportion coefficients of wind power, photovoltaic power, and thermal power in grid electricity, with values of 14.25%, 15.31%, and 51.96%, respectively.
4 Constraints
4.1 Balancing constraints
The port system needs to maintain a balance between electricity supply and demand, which is formulated as follows:
In the equation, PL,e,i(t) represents the power consumed by the load during time interval t, and ηsto is the efficiency of energy storage module charging and discharging.
Similarly, a system containing hydrogen energy modules also needs to ensure a balance between hydrogen supply and demand, as expressed by the following formula:
In the equation, MHL,i(t) and MHreE,i(t) represent the hydrogen demand and the amount of hydrogen used for hydrogen fuel cell power generation.
4.2 Other constraints
In the equation, Psto, imax, PHreE, imax, and Pnetimax are the upper limits on the power for the energy storage module, hydrogen fuel cell module, and external grid interaction, respectively.
5 Optimization strategy
5.1 Overall optimization strategy
The port system consists of multiple regions. The optimization objective is the operational cost of the port system. The purpose of optimization is to determine an appropriate power coordination allocation for the port system during operation. Simultaneously, it aims to establish the power requirements for the flexible multi-status switches, as well as the power and capacity requirements for the energy storage devices in the port system. The process flow is illustrated in Figure 3:
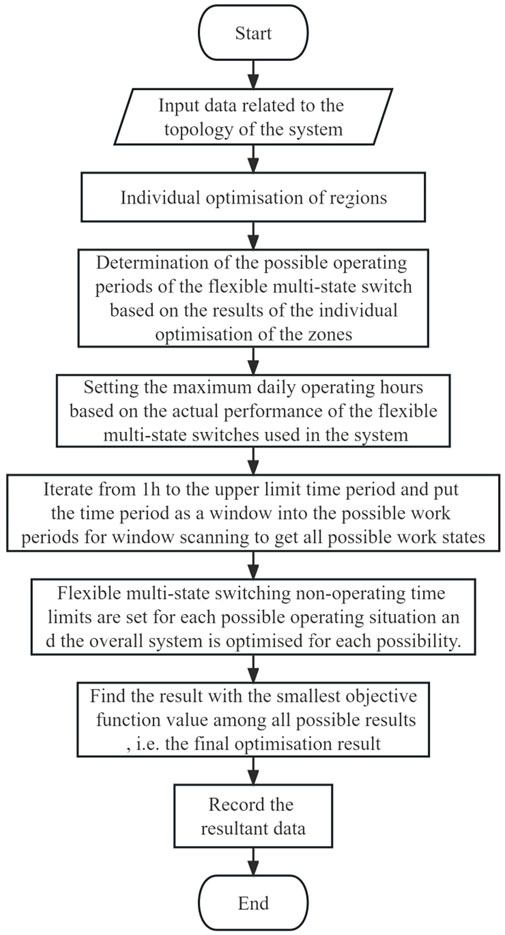
FIGURE 3. Hydrogen and energy storage optimization process flowchart.
In Figure 3, the possible working periods for the flexible multi-status switches are established in two steps, based on the results of individual regional optimization. The process steps are as follows:
Step 1: Record the electrical power interactions with the grid for each region, namely, the purchased electrical power Pbuy,e,i(t) and the sold electrical power Psell,e,i(t). Calculate the interregional imbalance power Pdiseq(t) using the following formula:
Step 2: Based on the calculation results of the imbalance power, select a continuous 10-h period at random. Calculate the arithmetic average of the imbalance power within this period. Add a certain margin to both ends of the period with the maximum calculated result as the potential working period for the flexible multi-status switches (the margin is selected based on the characteristics of the system and switches; in this paper, 4 h are chosen).
In Figure 3, after setting the upper limit of the daily working duration for flexible multi-status switches, the specific steps are as follows:
Step 1. Set the working duration of flexible multi-status switches to 1 h and start iterating from the beginning of the potential working periods of the flexible multi-status switches obtained earlier.
Step 2. In the current scenario, set the power of the non-working periods of the flexible multi-status switches to 0, and optimize the system using the optimization models from steps 1, 2, and 3.
Step 3. Since the optimization must ensure a 100% energy absorption rate, there may be situations with no solution. When there is no solution, do not record the data; otherwise, record the data.
Step 4. After completing the optimization for this iteration, shift the working segment of the flexible multi-status switches one unit of time (1 h) to the right and repeat steps 2 and 3.
Step 5. When the end of the working duration for flexible multi-status switches coincides with the end of the potential working periods, increase the working duration of flexible multi-status switches by 1 h, and repeat steps 2, 3, and 4.
Step 6. When the working duration of flexible multi-status switches exceeds the set upper limit for the daily working duration, end the iteration.
Step 7. Select the result corresponding to the minimum value of the objective function from all recorded data as the final optimization result, marking the end of the optimization process.
5.2 Calculation of energy storage device parameters during optimization
During the optimization process, the required capacity and maximum operational power of the system’s energy storage devices can be determined. The specific procedure is illustrated in Figure 4:

FIGURE 4. Flowchart for calculating system energy storage device parameters.
Without the use of optimization algorithms, it is possible to iterate through possible values of energy storage capacity within a certain range, using a specific step size. Optimization is carried out under the corresponding energy storage device capacity, following the steps shown in Figure 3, and the optimization objective results are recorded. After completing the iteration, the optimization result with the lowest operational cost is identified as the final optimization result. The capacity of the energy storage device corresponding to this result is designated as the required capacity output. Additionally, the maximum operational power of the port area’s energy storage devices is determined based on the maximum charge and discharge power in this optimization result.
6 Example simulation verification and analysis
This paper employed the MATLAB-yalmip platform in conjunction with the Cplex solver to perform simulations and optimizations. Detailed information about the relevant parameters in the optimization model, peak and off-peak electricity price data for Zhejiang Province are available in Supplementary Material.
6.1 Two-stage optimization of multi-region system with flexible energy sharing
6.1.1 First stage—individual region optimization
To establish the working states of the flexible multi-status switch, the method used in this paper initially treats the 10 kV AC section and the DC area of the port as Region 1, while the 10 kV AC section is considered as Region 2. Optimization for Region 1 and Region 2 is performed using Eqs 1–8, Eqs 10–15 and the preliminary operating optimization for Region 1 and Region 2 is illustrated in Figures 5, 6, respectively.
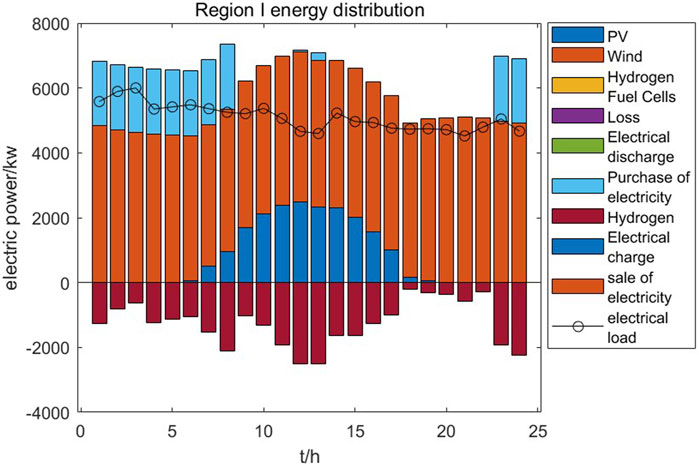
FIGURE 5. Power allocation optimization results for Region 1 during individual optimization.
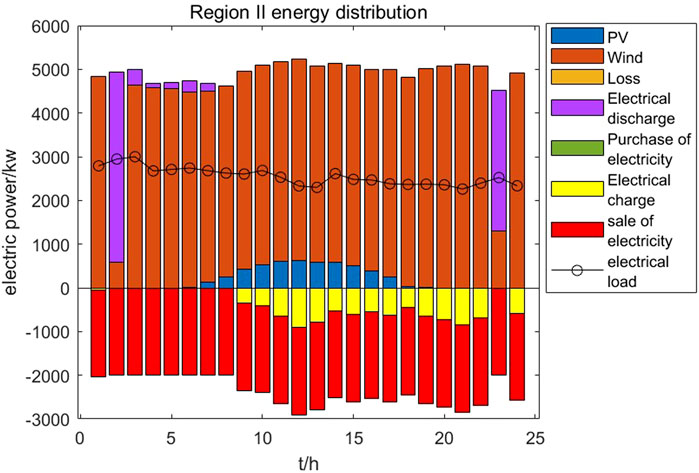
FIGURE 6. Power allocation optimization results for Region 2 during individual optimization.
Combining the port’s topological diagram in Figure 1 with the results in Figure 5, it is evident that Region 1, which includes the hydrogen production module through water electrolysis, is in a power-deficient state due to its task of supplying hydrogen to the port. Even after individual optimization, Region 1 still needs to purchase electricity from the grid from 1:00 to 8:00 to balance the electrical supply. In contrast, Region 2, which is not directly connected to the hydrogen energy module, has an ample electricity supply but needs to purchase electricity from the external grid from 3:00 to 8:00 to meet Region 1’s power requirements. The maximum value of Pbuy,e,i(t) reaches 2 MW, the maximum power of the 10 kV AC distribution network, and the total electricity purchased is 20,207 kWh. According to Eq. 12, the daily carbon emissions for Region 1 under these conditions are 128.76 kg.
Because the total electricity generated by the wind and solar power output in Region 2 is greater than the power required for the load, the actual and theoretical wind and solar power output values are compared in Figure 7. Combining Figures 6, 7, it is clear that Region 2 cannot fully absorb the output of wind and solar power equipment on its own. There are significant discrepancies in actual power output compared to the theoretical output at 1:00 and 23:00. A simple numerical calculation shows that the unabsorbed electricity at these moments amounts to approximately 87.46% and 73.79%, respectively, which accounts for about 6.91% of the total electricity generated by the wind and solar power output equipment (7799/112777 ≈ 6.91%). Using Eq. 12 again, the daily carbon emissions for Region 2 under these conditions are 58.99 kg.
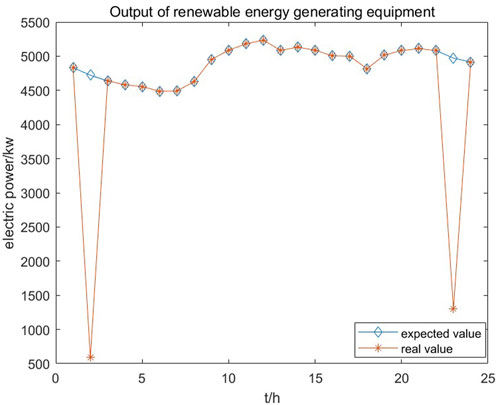
FIGURE 7. Actual vs theoretical wind and solar power output for Region 2 during individual optimization.
The results of the first stage of individual optimization align with the actual conditions in the port, where supply-demand imbalances and energy absorption problems are observed. Specifically, Region 1 faces a self-sufficiency problem where the electricity demand is high, but it is connected to the hydrogen energy module. On the other hand, Region 2 experiences an overabundance of electricity supply since it is not directly connected to the new energy modules. This leads to energy absorption issues.
6.1.2 Second stage—joint optimization of two regions
Building upon the preliminary results from the first stage, flexible multi-status switch operating periods were established to minimize operational costs, which is calculated by using Eq. 16. The selected operating time is from 13:00 to 21:00, with non-working hours set to zero transfer power by using Eq. 9. The remaining steps were optimized as per the process shown in Figure 3, and the operational optimization results for Region 1 and Region 2 are depicted in Figure 7. As the direction of transfer power in the flexible multi-status switch is challenging to determine and the port system in this paper only has two regions, Region 1’s power transfer to the flexible multi-status switch, Peo,i(t), is used to indicate the working status of the flexible multi-status switch, as shown in Figure 8. The optimization results for energy storage are included in Table 1.
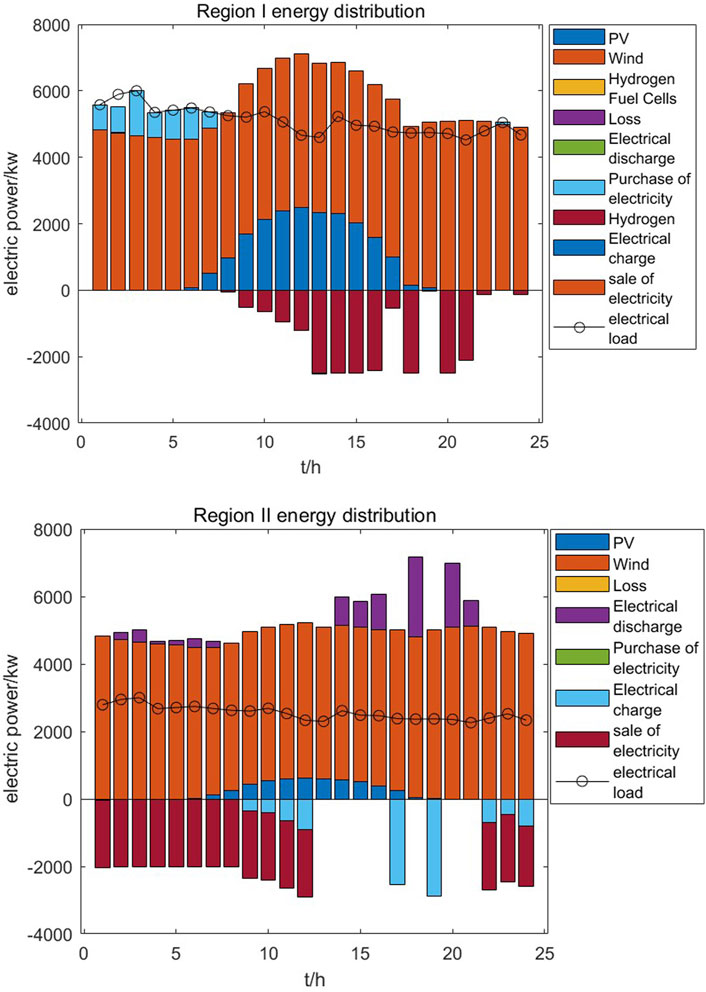
FIGURE 8. Power allocation results for the multi-region system with flexible energy sharing.
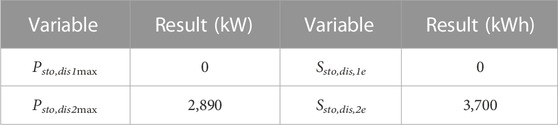
TABLE 1. Optimization results for the multi-region system with flexible energy sharing.
Combining Figure 8B with Figure 9, it is evident that Region 2 charges from 9:00 to 12:00 in preparation for the opening of the flexible multi-status switch. During the operating period of the flexible multi-status switch, Region 2 transfers surplus electricity and discharges from energy storage to Region 1. After the closure of the flexible multi-status switch at 21:00, surplus electricity continues to charge energy storage to ensure a certain reserve.
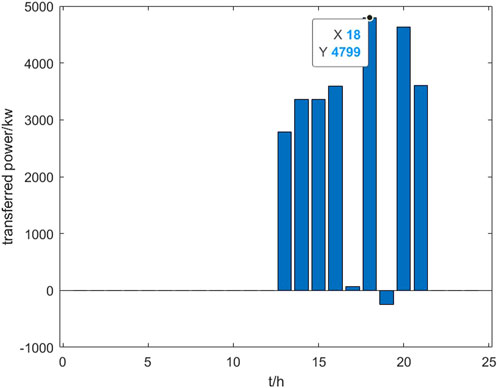
FIGURE 9. Flexible multi-status switch transfer power chart.
From Figure 8A, it is apparent that Region 1, facing a severe shortage of electricity, purchases electricity from the grid during the low demand period of Zhejiang’s industrial electricity use from 1:00 to 7:00, compensating for the low electricity demand of the port during the trough period of photovoltaic power generation. In the 9:00 to 12:00 period, the port’s photovoltaic power generation is at a higher level, and Region 1 utilizes the surplus electricity from new energy sources to perform water electrolysis to produce hydrogen. At 13:00, when the flexible multi-status switch opens, Region 1 uses the switch to transfer surplus electricity and surplus electricity from new energy sources for water electrolysis until the closing of the flexible multi-status switch at 21:00. The choice to perform water electrolysis in the latter half of the day also reduces the maintenance costs of the hydrogen storage equipment.
By plugging the numerical results of the optimization into the cost model, the daily operational cost of the port system after optimization is calculated to be ¥718,110, a decrease compared to before optimization. Calculations according to Eq. 11 show that the penalty cost for wasting wind and solar energy is zero, indicating a utilization rate of 100% for wind and solar power generation. According to Eq. 12, the daily carbon emissions for the port are 117.19 kg, which represents a 37.58% reduction compared to the state before optimization. The total daily purchased electricity is 6013.56 kWh, which is 70.24% lower compared to the pre-optimized state.
From Figure 9, it can be observed that the maximum transfer power of the flexible multi-status switch is 4,799 kW, and except for the period from 18:00 to 19:00, the direction of electricity transfer is consistent from Region 2 to Region 1. This ensures minimal changes in the direction of electricity transfer for the flexible multi-status switch. Additionally, during the 18:00 to 19:00 period, the amount of electricity transferred from Region 1 to Region 2 is relatively small compared to other times. In practical applications, this part of the power can be compensated through energy storage modules and interactions with the external power grid, ensuring that the direction of electricity transfer for the flexible multi-status switch remains unchanged during its operation, thus extending the switch’s lifespan.
In the table, Psto,dis1max, Ssto,dis,1e, Psto,dis2max, and Ssto,dis,2e represent the power and capacity requirements for Region 1 and Region 2, respectively, as optimized using multi-region optimization. A value of 0 indicates that energy storage devices are not needed.
6.2 Traditional approach applied in the port system
The traditional approach to optimization approach involves viewing the entire system as a whole and then using a particular optimization model to directly optimize the system. The traditional strategy does not consider the specific components (regions) within the system and the connecting devices between the components (regions).
To portray this traditional approach and present it in an experimental form. We connect Region 1 with Region 2, disregard the characteristics of the flexible multi-state switch, and apply all the optimization models established in the previous sections (Chapters 2–4) except the flexible multi-state switch model to optimize the whole. The operational optimization results for the system are depicted in Figure 10.
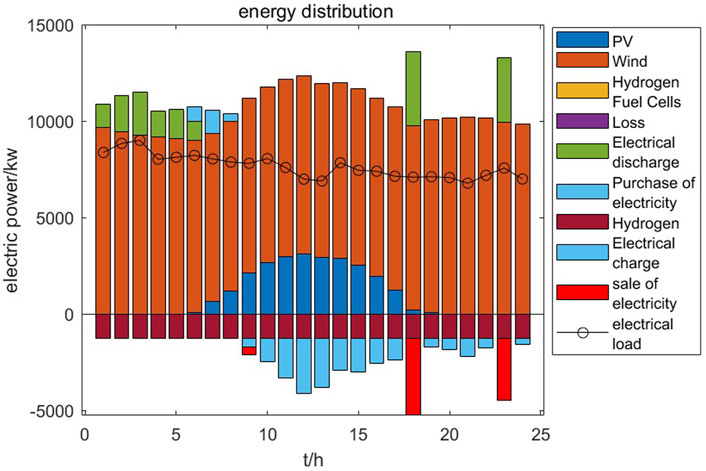
FIGURE 10. Results from the traditional approach.
From Figure 10, it can be observed that in the traditional approach, the port area continues to charge the energy storage devices during the period with high wind and solar power generation from 9:00 to 17:00. It mainly discharges energy storage devices during the period from 1:00 to 5:00 to compensate for power shortages in the port area.
By plugging the numerical results of the optimization into the cost model, the daily operational cost of the port system after optimization is calculated to be ¥176130. Calculations according to Eq. 11 show that the penalty cost for wasting wind and solar energy is zero, indicating a utilization rate of 100% for wind and solar power generation. The total daily purchased electricity is 2307.79 kWh. In addition, following the idea of calculating the energy storage demand parameters in 5.2, the results of the power demand and capacity demand of the energy storage equipment in the traditional way were calculated to be 4123.5 kW and 23877.5 kWh, respectively.
6.3 Comparative analysis
To verify the advantages and rationality of the optimization strategy presented in this paper, a comparison is made with the traditional optimization approach.
The traditional approach in 6.2 theoretically achieves the goal but ignores the characteristics of flexible multi-status switches and the regional characteristics of Region 1 and Region 2. It mainly reflects the following:
(1) When the system is considered as a whole, free exchange of electricity between Region 1 and Region 2 is allowed, which is difficult to implement in practical applications (Regions are connected by flexible multi-state switches). Frequent changes in the direction of electricity transmission for flexible multi-status switches can significantly reduce their lifespan.
(2) The maximum transmission power requirement for flexible multi-status switches cannot be recognized, which is not conducive to equipment configuration in the port system.
In contrast, the approach used in this paper establishes the working time and maximum transmission power of flexible multi-status switches, and under the switch’s operating status, it almost does not change the direction of electricity transmission. This effectively addresses the issues that the traditional approach faces when applied to the port system.
To analyze the advantages of the programs used in this paper more concrete and intuitive. The relevant calculation results of key parameters from Sections 6.1, 6.2 are summarized in Table 2.

TABLE 2. Summary of optimization results.
From the data and calculations in Table 2, it can be seen that compared to the results obtained from the traditional approach, the approach presented in this paper results in a daily operating cost reduction of approximately 104 million CNY, as well as a 29.91% reduction in energy storage device power requirements and an 84.50% reduction in capacity requirements. However, there is a slight increase in daily purchased power, which accounts for 3.28% of the output power from the port area’s generation devices.
Overall, the optimization strategy presented in this paper, when compared to the traditional approach, is more suitable for practical applications in the port area. It makes implementation easier and results in significant cost savings in terms of energy consumption and equipment configuration. This is achieved by slightly increasing the grid-purchased power to compensate for reduced power and capacity requirements for energy storage devices, thereby significantly reducing operating costs.
7 Conclusion
This paper presents a flexible multi-region optimization scheme for renewable energy systems, focusing on a practical multi-region flexible intermodal multi-energy port system. The conclusions drawn from comparative simulation results are as follows:
1. The proposed operational optimization scheme, which involves two stages, effectively addresses the “hydrogen-electricity dual-balance” requirement of the port system. In the first stage, individual regional optimization results are used to determine the operating periods of flexible multi-state switches. Building upon this, the second stage of system-wide optimization ensures coordination between energy storage and flexible multi-status switches, achieving 100% absorption of renewable energy system generation.
2. Implementation of the strategy proposed in this paper led to an overall reduction in carbon emissions compared to the scenario where regions operate independently.
3. The proposed operating scheme specifies the operating duration of flexible multi-status switches while ensuring minimal alteration in the direction of energy transfer. This not only enhances the operational lifespan of flexible multi-status switches but also ensures their practical use.
4. Compared to traditional optimization approaches, the strategy presented in this paper significantly reduces energy storage capacity requirements, daily operational costs, and power requirements for energy storage devices.
5. The results of the case study validate the feasibility of transferring scheduling strategies from intelligent grid research, where energy routers are used, to renewable energy systems bridged by flexible multi-state switches.
In conclusion, the approach proposed in this paper offers a practical solution to improve the utilization of renewable energy in the port system, reduce carbon emissions, and optimize the energy management of the entire system.
Data availability statement
The original contributions presented in the study are included in the article/Supplementary Material, further inquiries can be directed to the corresponding author.
Author contributions
YX: Conceptualization, Methodology, Software, Writing–original draft, Writing–review and editing. HF: Methodology, Supervision, Writing–review and editing. JY: Methodology, Visualization, Writing–review and editing. LZ: Methodology, Writing–review and editing. YZ: Methodology, Writing–review and editing.
Funding
The author(s) declare financial support was received for the research, authorship, and/or publication of this article. This work is supported by Research on the Mechanism of Energy and Power Balance Regulation of Multi-energy Integration System under the Bi-stochastic State of Green Energy Supply and Demand in Jiangsu Province, which comes from Jiangsu University.
Conflict of interest
The authors declare that the research was conducted in the absence of any commercial or financial relationships that could be construed as a potential conflict of interest.
Publisher’s note
All claims expressed in this article are solely those of the authors and do not necessarily represent those of their affiliated organizations, or those of the publisher, the editors and the reviewers. Any product that may be evaluated in this article, or claim that may be made by its manufacturer, is not guaranteed or endorsed by the publisher.
Supplementary material
The Supplementary Material for this article can be found online at: https://www.frontiersin.org/articles/10.3389/fenrg.2023.1336601/full#supplementary-material
References
An, Y., Zhao, Z., Wang, S., Huang, Q., and Xie, X. (2020). Coordinative optimization of hydro-photovoltaic-wind-battery complementary power stations. CSEE J. Power Energy Syst. 6 (2), 410–418. doi:10.17775/CSEEJPES.2019.00330
Chen, G., Dong, Yu, and Liang, Z. (2020). Analysis and reflection on high-quality development of China's characteristic new energy in energy transition. Proc. CSEE 40 (17), 5493–5506. doi:10.13334/j.0258-8013.pcsee.200984
Deakin, M., Taylor, P. C., Bialek, J., and Ming, W. (2022). Design and operation of hybrid multi-terminal soft open points using feeder selector switches for flexible distribution system interconnection. Electr. Power Syst. Res. 212, 108516. ISSN 0378-7796. doi:10.1016/j.epsr.2022.108516
Geng, Q., Hu, Y., He, J., Zhou, Y., and Zhao, W. (2020). Operation optimization of regional comprehensive energy system based on Nash bargaining. Electr. Power Constr. 41 (1), 114–125. doi:10.3969/j.issn.1000-7229.2020.01.014
Huo, Q., Li, M., Su, M., Yang, H., Li, D., Lu, Y., et al. (2021). Analysis of application scenarios for flexible multi-state switches. Automation Electr. Power Syst. 45 (08), 13–21. doi:10.7500/AEPS20200117005
Javaid, M., Haleem, A, Singh, R. P., and Suman, R. (2022). Enabling flexible manufacturing system (FMS) through the applications of industry 4.0 technologies. Internet Things Cyber-Physical Syst. 2, 49–62. doi:10.1016/j.iotcps.2022.05.005
Li, N., Shan, X., Heng, L., Ren, Y., Pan, H., and Ge, L. (2019). “Optimization of micro-grid dispatching based on adaptive chaos particle swarm optimization,” in 2019 IEEE Innovative Smart Grid Technologies - Asia (ISGT Asia), Chengdu, China, 2445–2449. doi:10.1109/ISGT-Asia.2019.8881050
Li, Z., Chen, W., He, G., and Zhao, H. (2022). “A novel modulation method for flexible multi-state switches with shared modules,” in 2022 IEEE International Power Electronics and Application Conference and Exposition (PEAC), Guangzhou, Guangdong, China, 1308–1313. doi:10.1109/PEAC56338.2022.9959144
Ma, M., Zhang, R., Wang, Z., Fang, M., Zhi, J., and Zhao, Z. (2023). Optimization control of low-voltage distribution network with flexible interconnection based on intelligent soft switch. China Electr. Power 28 (03), 25–33.
Moniruzzaman, Md, Yassine, A., and Benlamri, R. (2023). Blockchain and cooperative game theory for peer-to-peer energy trading in smart grids. Int. J. Electr. Power & Energy Syst. 151, 109111. 0142-0615. doi:10.1016/j.ijepes.2023.109111
Pan, Wu, Huang, W., Tai, N., Ma, Z., Zheng, X., and Zhang, Y. (2019). Multi-layer coordinated control strategy for multi-microgrid islanded operation based on power mutual assistance. High. Volt. Eng. 45 (10), 3101–3111. doi:10.13336/j.1003-6520.hve.20190924009
Wang, K., Liang, Y., Jia, R., and Wang, X. (2023). Two-stage optimization and scheduling of comprehensive energy systems with hydrogen-mixed gas in uncertain environment. Power Syst. Technol. 47 (08), 3141–3159. doi:10.13335/j.1000-3673.pst.2023.0156
Wu, S., Li, Q., Liu, J., Zhou, Q., and Wang, C. (2021). Double-layer optimization configuration of CCHP microgrid system based on energy storage plant services. Power Syst. Technol. 45 (10), 3822–3832. doi:10.13335/j.1000-3673.pst.2020.1838
Keywords: renewable energy port system, multiregional operation optimization, energy storage configuration, flexible multi-state switch, hydrogen and electricity balance
Citation: Xu Y, Fu H, Yang J, Zhao L and Zhang Y (2024) Two-stage optimization of hydrogen and storage coordination for a multi-region flexible intermodal multi-energy port system. Front. Energy Res. 11:1336601. doi: 10.3389/fenrg.2023.1336601
Received: 11 November 2023; Accepted: 14 December 2023;
Published: 05 January 2024.
Edited by:
Qunhai Huo, Chinese Academy of Sciences (CAS), ChinaReviewed by:
Zhenya Ji, Nanjing Normal University, ChinaZhengqi Wang, Nanjing Institute of Technology (NJIT), China
Copyright © 2024 Xu, Fu, Yang, Zhao and Zhang. This is an open-access article distributed under the terms of the Creative Commons Attribution License (CC BY). The use, distribution or reproduction in other forums is permitted, provided the original author(s) and the copyright owner(s) are credited and that the original publication in this journal is cited, in accordance with accepted academic practice. No use, distribution or reproduction is permitted which does not comply with these terms.
*Correspondence: Haijun Fu, fuhaijun21@ujs.edu.cn