Research and optimisation of focused solar heating system with phase change thermal storage
 Yishu Zhang
  Wenqing Zhang*
- Lanzhou Jiaotong University, Lanzhou, Gansu, China
Currently, solar heating systems face several challenges in winter cold conditions, including low heat collection temperature, high heat collection loss, low thermal storage density, and unstable storage temperature, making it difficult to meet heating quality requirements. Taking the heating of a driving school building in the suburbs of Baiyin, Gansu as a case study, and using typical meteorological data for the local heating season, we simulated the indoor thermal load of the building using DEST software. We then designed a focused solar heating system with phase change thermal storage, coupling focused solar thermal technology with latent heat storage technology. The thermal storage performance of Ba(OH)2·8H2O composite phase change material in an oil-sealed environment was verified. Mathematical models of the major components of the focused solar heating system with phase change storage were developed, along with a TRNSYS system model. An objective function was established using the annualized cost method, with the area of the collector and the mass of PCM as variables. Optimization was performed using Genopt software, invoking the Hooke-Jeeves algorithm to optimize the heat collection area S and mass m of phase change material in the focused solar heating system. The optimized results showed a collector area of 4.11 m2, and a PCM mass of 130 kg, resulting in a 10.04% improvement in the solar assurance rate. Over the system’s entire lifecycle, the cost decreased by 1025 RMB, and the carbon emission reduction increased from 10,838 to 16,101 kg.
1 Introduction
Winter heating is an essential requirement for livelihood, yet traditional methods often rely heavily on the consumption of fossil fuels (Li et al., 2000; Li et al., 2022). While solar energy is a widely distributed, abundant, and free source of clean energy (Zhou and Wang, 2017; Al-Azawii et al., 2018), it comes with challenges such as low energy density and intermittent availability (Zhang et al., 2021). Therefore, in the realm of solar heating, it is crucial to select a collector with superior performance and a compatible heat storage device. Currently, common solar heating systems employ either flat-plate collectors or glass tube vacuum collectors. Although these collectors are more economical, they suffer from significant heat loss and are prone to malfunction, especially in colder conditions where water temperatures usually range from 30°C to 50°C. In terms of heat storage, traditional solar thermal storage devices predominantly use water tanks, operating on a sensible heat storage mechanism. These systems have a low heat storage density. Problems such as water vaporization can occur when the storage volume is too small, and the heat storage temperature may not meet the heating requirements when the volume is too large (Yang et al., 2017).
Focused solar heating systems with phase change thermal storage represent a novel approach to energy application that is distinct from traditional solar energy methods. Which has the advantages of high heat storage density, stable temperature of heat storage and release process, and reusable, etc., and has become a research hotspot in the field of new energy heat storage. At present, the solar heating system with phase change energy storage device has been studied to a certain extent. Varol et al. (2010) constructed a solar energy system with phase change storage device to fill the phase change material directly into the solar collector, and experimentally concluded that the solar energy system with phase change storage device is more efficient than conventional solar energy system without phase change device. Alva et al. (2006) conducted an in-depth study on this technique of filling phase change materials directly into solar flat plate collectors and envisaged the replacement of conventional thermal storage tanks with phase change material energy storage devices. Aghbalou et al. (2006) constructs a Solar System with a phase change storage device by making sheets of phase change material and then placing them in a thermal storage tank for hybrid thermal storage. Talmatsky and Kribus. (2008) compared this Solar System with phase change storage device with a Solar System with conventional thermal storage, and concluded that due to the high heat loss at night in the phase change storage method, the phase change storage method has little advantage over the water tank storage, so simply placing the PCM in the water tank is not energy efficient and effective. Lamrani et al. (2020) developed a solar heating system combining a solar trough collector with phase change thermal storage, using RT-55 as the storage medium and conducted experiments to conclude that the system is capable of generating hot water in the range of 36°C–38°C when using RT-55 as the phase change material. From the above study, it can be seen that the optimisation of the Solar System with phase change storage mainly includes improving the physical coupling between the phase change material and the collector, as well as improving the thermal storage performance of the phase change material.
In cold winter, the collector temperature of Solar System with phase change energy storage device remains low, but the temperature of phase change material suitable for heat storage/supply is relatively high, so it is difficult to directly couple the solar collector with phase change energy storage module with suitable phase change point temperature. To overcome the shortcomings of the existing systems, this paper proposes a focused solar heating system containing phase change thermal storage. In contrast to flat-plate and glass tube vacuum collectors, focused collectors are capable of generating high temperatures even under cold winter conditions, thereby substantially improving the quality of the thermal energy generated. These focused solar collectors typically utilize dual-axis tracking systems, allowing them to capture normal solar radiation. This irradiation intensity is significantly higher compared to flat-plate and glass tube vacuum collectors. Phase change heat storage has emerged as a research hotspot in the heat storage domain due to its high heat storage density, stable temperature during both storage and release phases, and reusability (Safari et al., 2017; Gil et al., 2018; Wang and Hu, 2018). The most prevalent type of phase change involves solid-liquid transitions, categorized by operating temperatures into low (<80°C), medium (80°C–250°C), and high (>250°C) ranges (Abhat, 1983; Wu et al., 2013). Inorganic crystalline hydrates, such as Ba(OH)2·8H2O, offer high latent heat, good thermal conductivity, and low cost. Their phase change enthalpy per unit volume typically ranges between 200 and 400 MJ/m³. Notably, Ba(OH)2·8H2O has the highest enthalpy of phase change per unit volume among crystalline hydrates in the low-temperature region (0°C–120°C), at 572 MJ/m³. This is 3–4 times greater than the latent heat density of organic phase-change materials, with a phase change latent heat value of 265 kJ/kg and a phase change temperature of 78°C (Naumann and Emons, 1989; Sheng et al., 2014). Based on the above elaboration, this paper couples a focused collector and a Ba(OH)2·8H2O phase change energy storage module.
2 Building modeling
Baiyin City in Gansu is situated at a longitude of 103°3′E and a latitude of 36°35′N, lying in China’s Zone III, which is abundant in solar energy resources. The total annual solar radiation in this area ranges from 5,020 to 5860 MJ/(m2·a) (Yan et al., 2012), and the climate during winter is cold and dry. The centralized heating period lasts from November 1st to March 31st. Due to the absence of relevant meteorological parameters for Baiyin City, this study refers to data from the nearest meteorological observation station in Lanzhou City (103°49′E, 36°03′N). Figure 1A illustrates the daily dry bulb temperature distribution, indicating that the maximum daily minimum temperature during the heating period does not exceed 6.7°C, the lowest temperature recorded is −16.9°C, and January is the coldest month. Figures 1B, C depict the total daily radiation in the normal plane and the hourly radiation intensity in the normal plane, respectively. The maximum normal radiation intensity during the heating season was 1195 W/m2 (compared to the solar constant of 1367 W/m2), and the average normal daily radiation during the heating season was 18.4 MJ/m2.
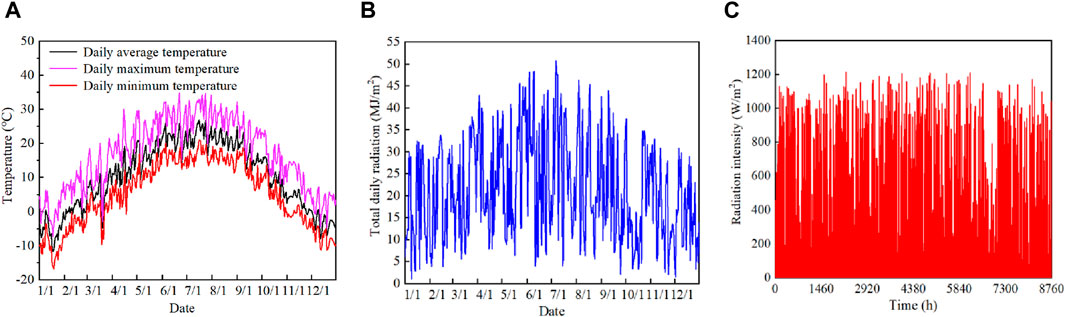
Figure 1. Meteorological resource distribution. (A) Daily dry bulb temperature distribution, (B) Total daily radiation in the normal plane, (C) Hourly radiation intensity in the normal plane.
2.1 Basic building parameters
In the Gansu Baiyin area, a room heating as a research object, the building is far away from the city center, cannot be centralized heating, but the geographical location of the open with sufficient space. The architectural model of the guardhouse is shown in Figure 2, the room sits in the east and faces the west, with an area of 10.2 m2, a height of 3 m, a length of 3.4 m, and a width of 3 m; there are two windows, both of them with a height of 1 m and a width of 0.8 m; and the door has a height of 1.8 and a width of 0.7 m.
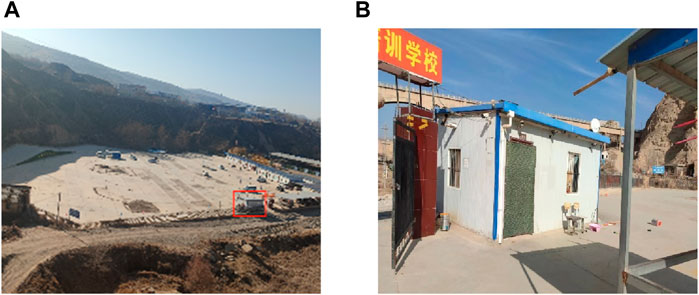
Figure 2. Architectural model of the guardhouse. (A) Building layout, (B) Concrete figure.
2.2 Building heat load modeling
The heat transfer process in a building consists of natural convection of indoor air with the wall interior and steady state heat conduction within the wall. First, the temperature tn of the wall interior is preset to obtain the qualitative temperature tm, and then the volume expansion coefficient
Where, tf denotes the indoor air temperature, and tn denotes the temperature of the inner wall, °C.
Let the kinematic viscosity of air be v, thermal conductivity λ, and Prandtl number Pr, then the Rayleigh number Ra and the Nusselt number NuH are shown in Eqs 3, 4.
The surface heat transfer coefficient h0 at the preset tn temperature is obtained from this Nusselt number.
Where, g denotes the gravitational acceleration;
By the conservation of energy, the heat transferred in the process of heat transfer from the wall to the flow is the same as the heat transferred in the process of heat conduction in the wall, and the calculation formula is shown in Eq. 6.
Using an iterative algorithm, the preset tn is calibrated by Eq. 6, and the surface heat transfer coefficient h is determined when tn reaches within the permissible error range, thus further determining the heat transfer coefficient k.
After obtaining the corresponding heat transfer coefficients for each wall, as well as for windows and doors, energy calculations were performed for them, including the basic heat transfer Q1 and the additional heat dissipation as Q2.
where
The cold air infiltration heat dissipation, Q3, is calculated as shown in Eq. 10.
Where Cp denotes the constant pressure specific heat capacity of outdoor air in kJ/(kg∙k); V denotes the indoor cold air infiltration volume flow rate in m3/h; and ρw denotes the density of outdoor air.
The cold air intrusion heat dissipation is Q4. Where N denotes the exterior door addition rate.
2.3 DEST thermal load simulation
A heat load analysis of the room at the driving school was conducted using DEST software, with 19°C set as the standard indoor temperature. The room functions as a bedroom and is categorized as a sedentary space within a common room. The room features a 200 mm-thick concrete wall with internal polystyrene board insulation, an insulated roof (refer to building insulation standards), and a brick floor. The external door is a single-pane, metal balcony door, while the windows are standard external windows with double glazing and curtains. The room is open from 8:00 a.m. to 7:00 p.m.
Disturbances include one person contributing 53 W of heat (distributed as personal thermal disturbance), lighting contributing a maximum of 50 W and a minimum of 0 W (distributed through incandescent lamps and following bedroom lighting schedules), and equipment contributing between 15 and 30 W of thermal disturbance, operating 24 h a day. The natural room temperature of the room of the simulated driving school is shown in Figure 3A, and the load required to maintain 19°C in the room is shown in Figure 3B.
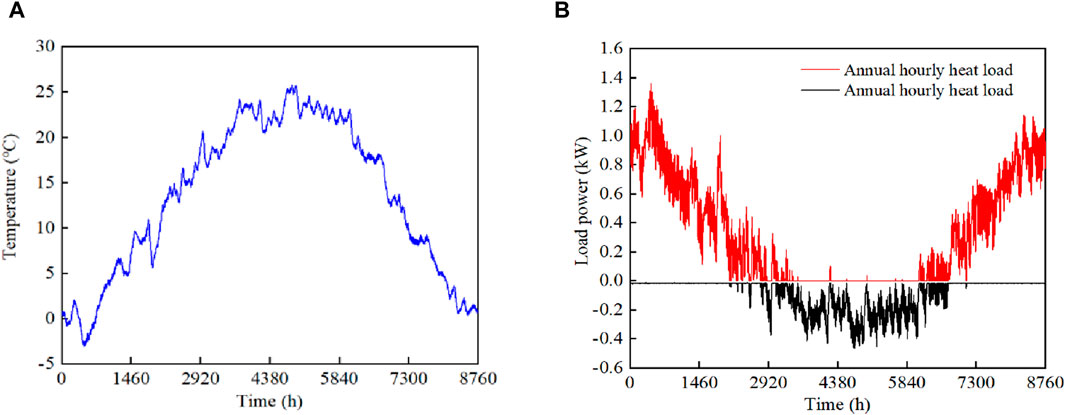
Figure 3. Simulation of heat load variation in room. (A) Natural room temperature distribution, (B) Maintain 19°C load requirements.
From the DEST simulation, it can be seen that under typical meteorological year conditions, the loads are largest in December and January, and relatively small for the rest of the heating period. The maximum heat load occurs on January 19th at 1360 W with an average of 133 W/m2.
3 Design of solar heating systems design of solar heating system
The heating of the room of a driving school in the silver area of one is used as a research object to design a solar heating system. The system mainly consists of four parts: disk solar collector system with tracking, phase change thermal storage device, auxiliary heat source and heating end. The schematic diagram of solar heating system is shown in Figure 4.
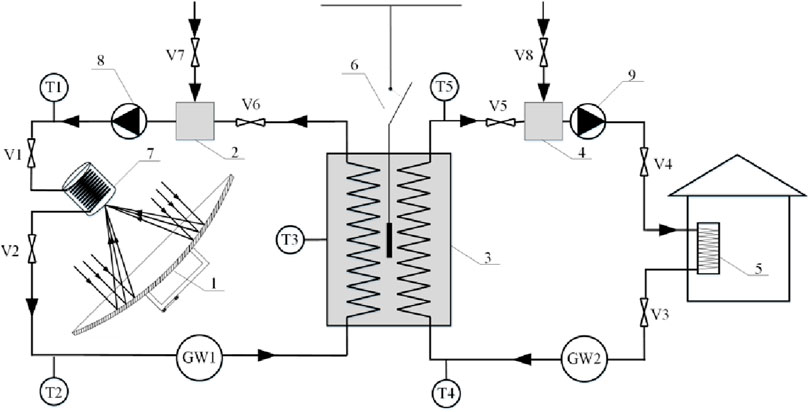
Figure 4. Schematic diagram of solar heating system.
In the figure, 1-dish solar collector, two-open make-up oil tank (small volume), 3-phase-change heat storage/exchange device, four-open make-up water tank (small volume), 5-radiator, 6-assisted electric heat source, 7-cylindrical cavity heat absorber, 8-circulating oil pump, 9-circulating water pump, V1∼V6 are pipeline valves, V7 is the oil inlet valve (replenishes oil to the system), V8 is the water inlet valve (replenishes water to the system), T1∼T5 are temperature sensors, GW1 is oil flow rate meter and GW2 is water flow rate meter.
3.1 System operation principle and control mode
The solar heating system operates on two separate cycles: the heat collection cycle and the heat storage-to-end-user cycle. The heat transfer mediums used in these cycles are heat transfer oil and water, respectively. The operation modes are as follows:
(1) In the normal solar irradiation intensity is greater than 200 W/m2, and the PCM temperature is lower than 80°C, the disk collector begins to collect solar radiation energy, solar radiation energy in the heat absorber converted to thermal energy after the circulation of thermal oil absorption, and then brought to the phase change device through the pump pressure to heat the phase change material, to be reduced in temperature and then re-sent back to the collector heating, and continuous cycle. The outlet temperature of heat transfer oil in the collector is 105–115°C (110°C is the best temperature).
(2) When the indoor temperature of the building is lower than 19°C, the heating end cycle starts, and the heat energy stored in the PCM is brought to the user side (radiator) for heating through water circulation, and then re-sent back to the phase-change device for heating when the temperature is lowered, and circulated continuously. The heating temperature range of the phase change device is 70°C–80°C.
(3) The phase change device is equipped with an electric auxiliary heat source. When the temperature of the phase change material decreases to 70°C, the auxiliary heat source is turned on; when the temperature increases to 74°C, the auxiliary heat source is turned off.
3.2 Mathematical modeling of system components
3.2.1 Mathematical modeling of disk collectors
The light-heat conversion efficiency of the disk collector is jointly determined by the air transmittance, specular reflectance, parabolic truncation rate, parabolic covering rate, and cavity heat absorber heat loss rate. Among them, the cavity heat absorber heat loss includes reflected heat loss Qref, convective heat loss Qconv, thermal conductivity loss Qcond, and radiant heat loss Qrad, as shown below (Liu et al., 2005; Llorente et al., 2011; Madhlopa and Johnstone, 2011; Tan et al., 2014; Samanes et al., 2015):
Where,
3.2.2 Disc collector
The heat storage and exothermic process of the phase change device mainly considers the instantaneous heat storage of the PCM, and its energy change amount is:
Where
The phase-change device heat loss
Where Us is the heat transfer coefficient of the phase change system, W/m2·K; As is the wall area of the PCM in contact with the phase change device, m2; Tb is the temperature of the PCM, K; Ta is the outside ambient temperature, K; Ah is the wall area of the void of the phase change device, m2; and Th is the average temperature of the air above the PCM, K. The phase change device has the following characteristics.
The oil heat exchanger and water heat exchanger in the phase change device are uniformly cross-distributed in a grid shape. The material used is copper with good compatibility with barium hydroxide octahydrate. The heat exchanger grid is filled with phase change material, as shown in Figure 5.
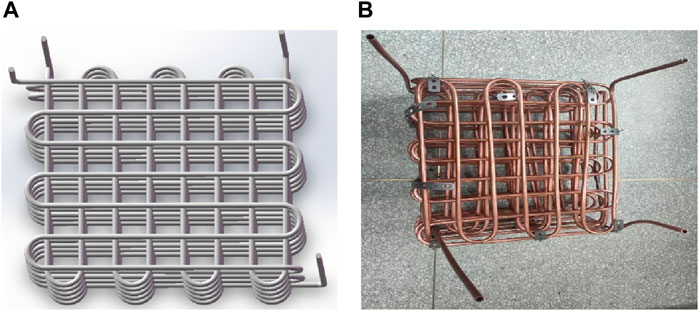
Figure 5. Phase change device model. (A) 3D model, (B) Real model.
Reference (Wang et al., 2016; Tang and Liang, 2019; Wu et al., 2021), the heat energy transfer equation between the heat exchanger and the phase change material is as follows:
In the formula, Tk, T, Tp and Tref represent the tube wall temperature, heat transfer fluid temperature, phase change material temperature and reference temperature, respectively, K; h is the heat transfer coefficient, W·m-2·K−1; hp and href are the enthalpy of the phase change material and the reference enthalpy, J/g; β1 is the liquid phase ratio; and L is the value of latent heat of phase change, J/g.
3.2.3 Mathematical modeling of heating ends
According to the law of conservation of energy, the difference between the amount of heat energy transferred on the heating side of the phase change system and the heat loss along the pipeline is the heat energy at the heating end. The mathematical model of the process under steady state condition is shown in Eq. 22, and the schematic diagram of heating end control is shown in Figure 6.
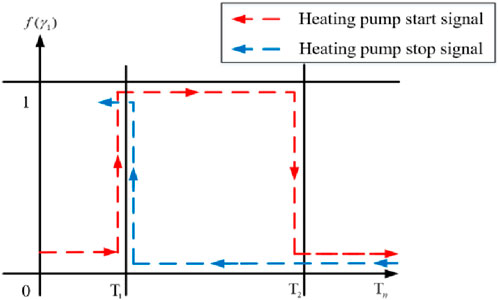
Figure 6. Heating end control schematic.
Where Cs is the overall heat capacity of the radiator, J/°C; Gs for the circulation flow, kg/s;
3.2.4 Mathematical modeling of auxiliary heat sources
The auxiliary heat source thermal storage belongs to the PCM solid-phase sensible heat storage, and the thermal energy input of this process to the phase change system is

Figure 7. Schematic diagram of auxiliary heat source control.
Where P is the power of auxiliary heat source, kW; Tup and Tdown are the upper limit of set temperature and the lower limit of set temperature, respectively, and
3.3 System capacity calculation
The system capacity mainly includes the collector area, the amount of phase change material and the power of auxiliary heat source. Figure 3B shows that the heat load of the room in the heating season is uncertain, and the collector area is too small, the amount of heat collected is too small, and solar heating can not be highlighted; it is too large to exacerbate the economic burden, resulting in a waste of heat. According to the Technical Specification for Solar Heating and Thermal Engineering (GB50495-2019), the total collector area is shown in Eq. 26.
Where,
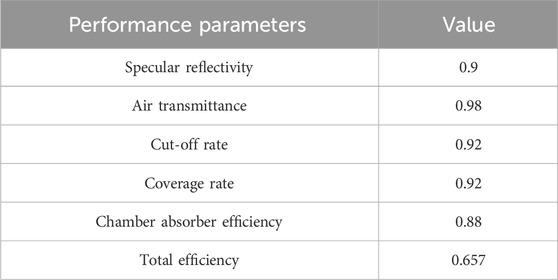
Table 1. Dish collector performance parameters.
Assuming that all solar radiation collected by the collector is stored losslessly as phase change heat, the phase change material required for a solar heating system is shown in Eq. 27.
In the formula, K is the latent heat value of phase change material, 265 kJ·kg-1; DNI is the average daily solar irradiation in December on the light surface of the collector, 15.35 MJ/(m2·d), and the mass of the phase change material obtained from the calculation is 97 kg.The heating system adopts the electric auxiliary heat source, whose power should be higher than the maximum heat load of the building, and is taken as 1.5 kW.
3.4 Phase change materials thermal storage test
In addition to the advantages of high latent heat value (265 kJ kg−1), suitable phase transition temperature (78°C) and higher density, Ba(OH)2·8H2O as an inorganic hydrated salt, like all inorganic hydrated salts, exists a more obvious phenomenon of supercooling and poor nucleation characteristics, which prevents it from releasing stored latent heat within the desired temperature range, thus affecting the thermal storage performance; For this unfavorable phenomenon, in this paper, Na2B4O7·10H2O with 3% mass fraction and carboxymethyl cellulose with 1% mass fraction were added to Ba(OH)2·8H2O, and 30 g of this composite phase change material was used as a sample for the experiment. As shown in Figure 8A, the oil-seal experimental group and the non-oil-seal experimental group were set up, and the cooling method was natural cooling. The cooling curve of the oil seal experimental group is shown in Figure 8B, which shows that the stable exothermic temperature of the phase change material is 76.5°C, and the exothermic curve is uniform and smooth, which is in line with the requirement of solar thermal storage heating. Setting 70°C–80°C as the heating temperature zone, the theoretical latent heat exotherm of Ba(OH)2·8H2O accounts for the proportion of the total exotherm as shown in Eq. 28:
where K is the value of latent heat of phase transition; T1 is the initial temperature of 70°C and T2 is the terminal temperature of 80°C.
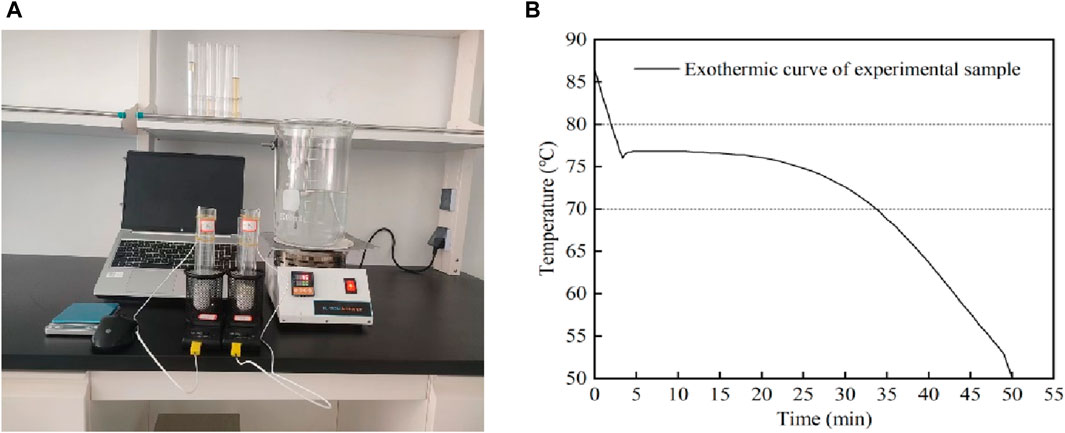
Figure 8. Exothermic process of test specimen under oil seal environment. (A) Experimental platform, (B) Exothermic curve of test sample (oil seal experimental group).
3.5 Experimental test of heat storage/heating
In order to verify the feasibility of solar phase-change thermal storage for heat supply, a phase-change thermal storage∕heat supply experimental platform as shown in Figure 9B is constructed in this paper. The partial diagram of the phase change device is shown in Figure 9A, which contains an oil heat exchanger and a water heat exchanger respectively, and the two sets of heat exchangers are evenly distributed crosswise. The oil heat exchanger contains thermal oil inlet and thermal oil outlet for system heat storage; the water heat exchanger contains water inlet and outlet for system heat release. The phase change device contains 97 kg of composite phase change material (Na2B4O7·10H2O with 3% mass fraction and carboxymethyl cellulose with 1% mass fraction were added to Ba(OH)2·8H2O), and the heat storage process adopts a constant temperature heater. Instead of the solar collector system, a constant temperature heater was used for the heat storage process. The inlet temperature of heat transfer oil was constant at 103°C, and the flow rate was 0.5 L/min. The initial water temperature of the exothermic process was 30°C, and the water flow rate of the exothermic process was constant at 1.2 L/min.Set A, B, C three temperature measurement points along the left, middle and right centre direction of the phase change device, record the temperature change of the phase change material, and calculate the power change of the heat storage process and the power change of the exothermic process at the same time. The thermal storage experiment curve is shown in Figure 9C and the exothermic experimental curve is shown in Figure 9D.
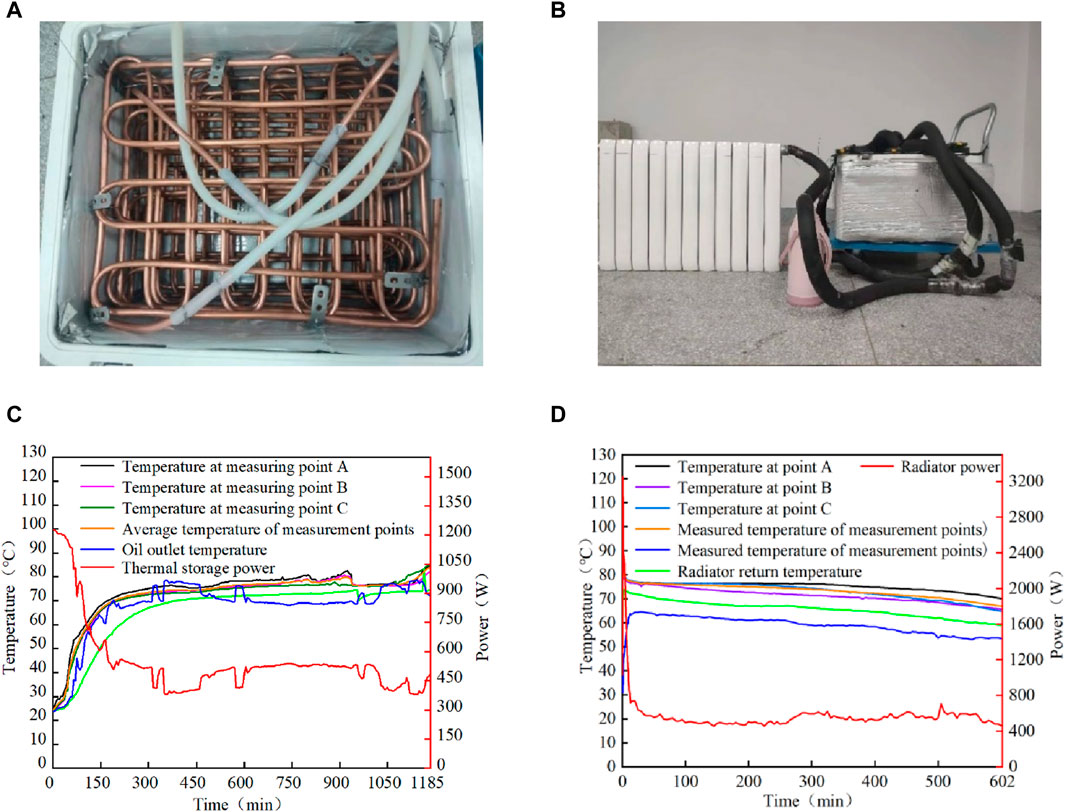
Figure 9. Experiment on phase change heat storage/exothermic. (A) Physical diagram of phase change device, (B) Exothermic storage experimental platform, (C) Thermal storage experiment curve, (D) Exothermic experimental curve.
Figure 9C shows the temperature change of the phase change material during the heat storage process, and the phase change process is PCM solid-phase sensible heat storage, phase change heat storage, and liquid-phase sensible heat storage in that order. From the figure, it can be seen that the total time of heat storage is 1,185 min, and the overall heat storage shows three stages, in which the 70°C–80°C stage of heat storage takes 965 min, and the temperature change in this stage is very small, but the amount of heat storage is the largest. The outlet temperature of heat transfer oil is very close to the temperature of A, B and C measurement points, which indicates that the oil heat exchanger has good heat transfer performance. Since the phase change heat storage occupies the majority of the system heat storage, the temperature change of the heat storage process is stable and highly available. From the heat storage experiments, it is concluded that the use of phase change materials for heat storage has the advantages of stability and reliability, high energy storage density, and small heat loss, which is not available in the water tank sensible heat storage in the solar heating system. Figure 9D demonstrates the temperature change characteristics of the experimental platform during the exothermic process. It can be seen that the total exothermic time is 602 min, and the temperature of A, B and C measurement points decreases gently. The radiator water supply temperature range is 60°C–74°C, the return water temperature range is 53°C–65°C, and the supply and return water temperatures are in line with the actual engineering requirements. The heating experiment shows that when Ba(OH)2·8H2O composite phase change material is used for heat storage/supply, the radiator water supply temperature, return water temperature, and heating stability are good, which overcomes the shortcomings of the traditional water tank such as large volume of heat storage, low density of heat storage, non-constant temperature, and large heat loss, etc., and is therefore of great significance in the field of solar energy heat storage and heating.
4 TRNSYS modeling and typical working condition analysis
TRNSYS is a powerful transient simulation software which is widely used in the study of solar heating systems. In this paper, TRNSYS is used to model a focused solar heating system containing phase change thermal storage. In this case, the oil pump power is controlled by PID (Type23 module) to ensure that the heat transfer oil outlet temperature is within the specified range. The TRNSYS model as shown in Figure 10 is built based on the mathematical model of the system components, and the system control strategy. The main information in TRNSYS, as shown in Table 2.
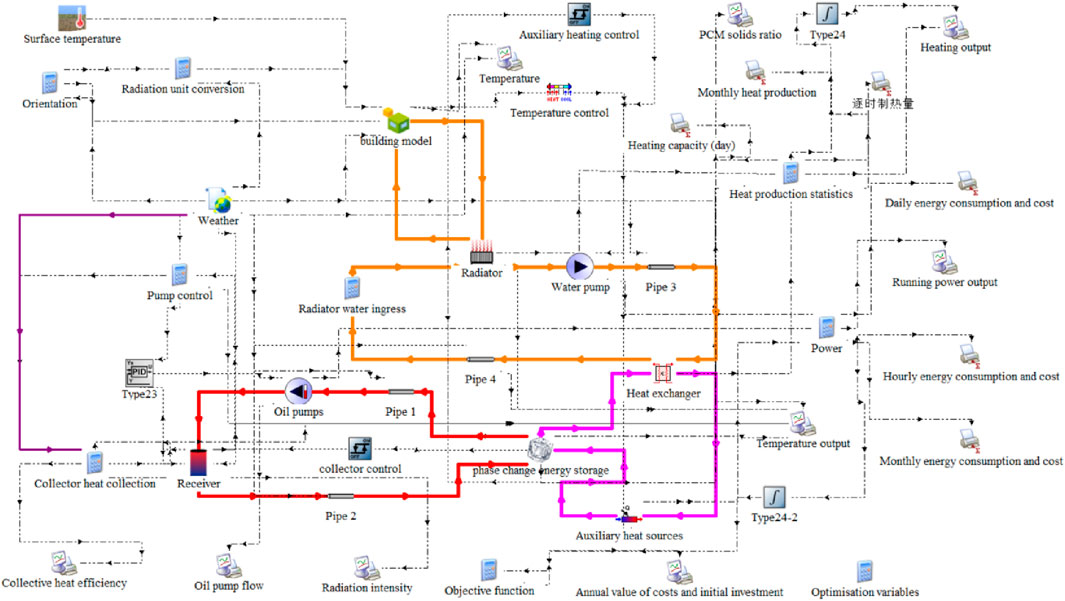
Figure 10. TRNSYS model of focused solar heating system containing phase change thermal storage.
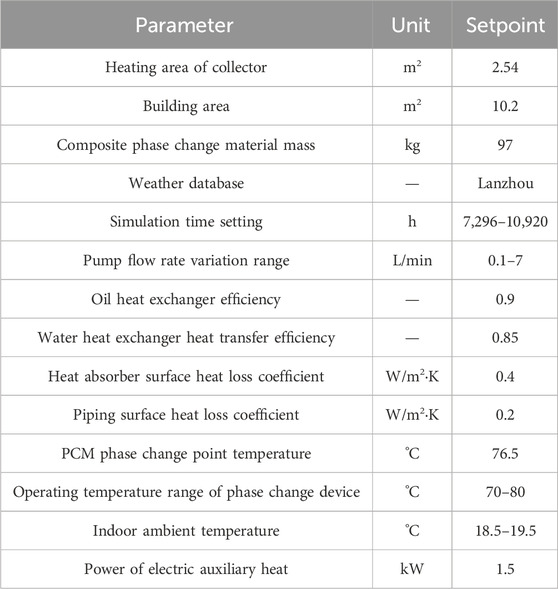
Table 2. Main parameters of simulation model.
4.1 Operational characterization
Based on the source of heating energy, the operation modes for heating are divided into three categories: solar + electric auxiliary heating, solar-only heating, and auxiliary-only heating. The thermal changes in the system during the heating process exhibit significant inertia. Therefore, it's crucial to consider the system’s state before, during, and after operation when analyzing the complete cycle, which includes the collector process, heat release process, and the solid-liquid phase transition of the phase-change material. On the collector side, the operational characteristics of the solar heating system take into account factors such as solar irradiation intensity, outlet oil temperature from the collector, and the flow rate of the circulating oil pump. On the heat storage and transfer side, factors like solar collector heat, electric auxiliary heating, and the solid-liquid phase changes in the phase-change device are considered. For the end-user side, parameters such as indoor temperature, temperature of the phase-change device, and the inlet and outlet water temperatures of the radiator are taken into account.
Figures 11A–D presents simulation data for the heating system based on a typical meteorological year. The data indicate that overall normal direct radiation during the heating period is satisfactory. Owing to the phase-change material’s (PCM) heating range of 70°C–80°C and the use of PID control for the collector’s outlet temperature, the temperatures of the oil at the collector’s inlet and outlet remain stable. The frequency of the PCM undergoing a complete phase change is higher during the pre-heating and end periods than in the mid-heating period. This suggests that, in addition to being significantly influenced by solar irradiance, the phase change process of the PCM is also related to the building’s indoor temperature. As shown in Figure 11D, the temperature difference between the supply and return water in the radiator is approximately 10°C, aligning with heating experience standards. The radiator’s power is essentially maintained at 1,800 W, keeping the indoor temperature of the building between 18°C and 20°C. The solar energy guarantee rate for the entire heating season is 20.36%.
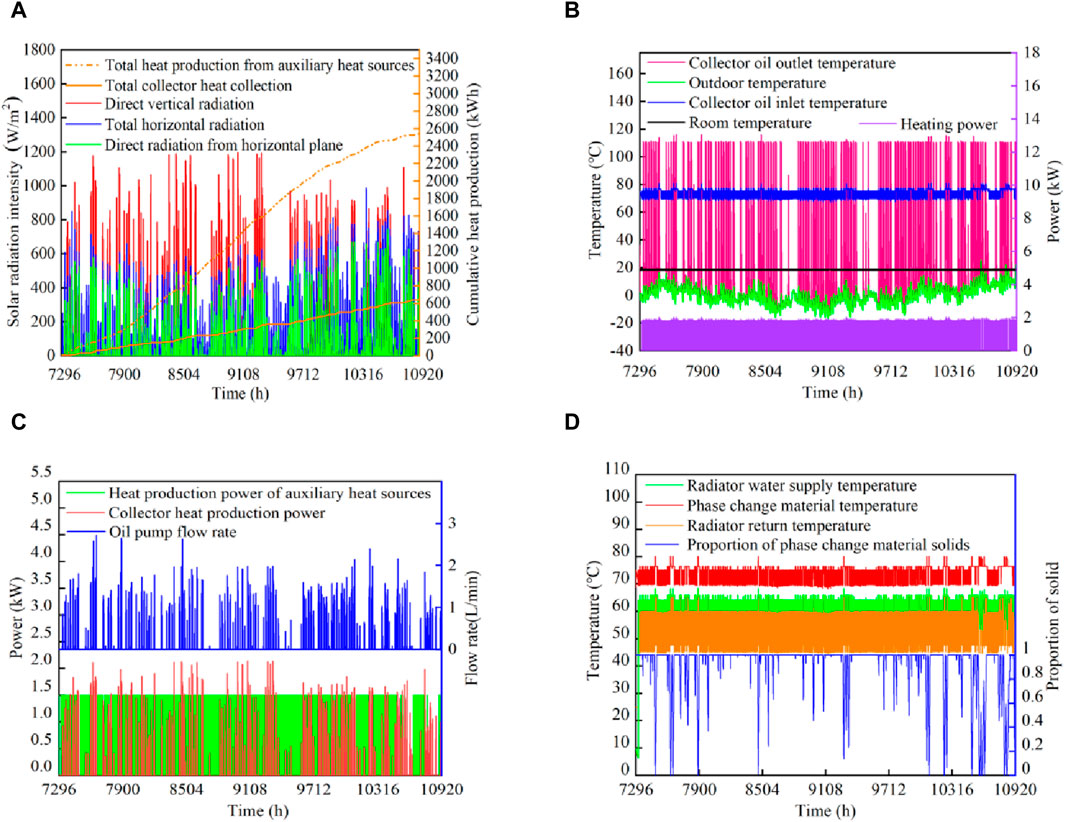
Figure 11. Characterization of heating system operation. (A) Solar radiation intensity, (B) collector side, (C) Heating power (D) Thermal storage/heating end.
4.2 Typical model analysis
4.2.1 Combined solar and electric auxiliary heating mode
Solar + auxiliary heat combined heating mode, this paper takes January 22 ∼ January 25 (0 moment timing, 9,264–9336 h) for simulation, the solar radiation in this stage is shown in Figure 12.
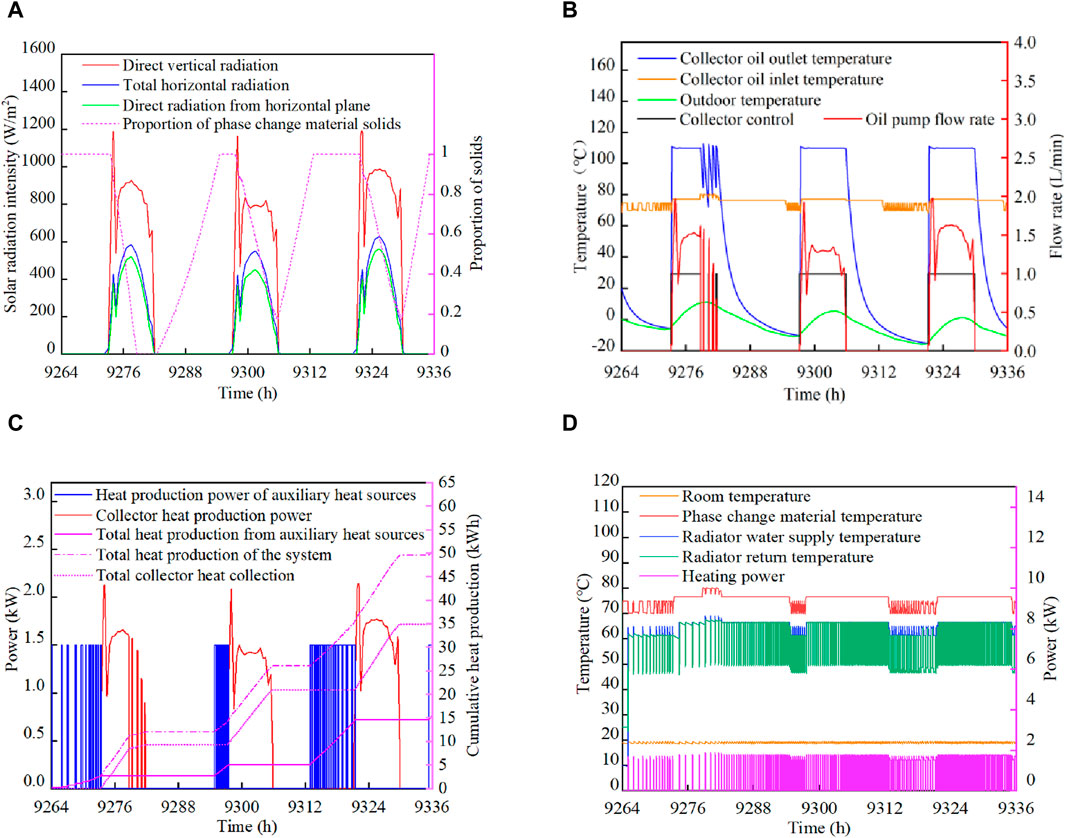
Figure 12. Solar + auxiliary heat combined heat supply mode model. (A) Solar radiation intensity (B) collector side, (C) Accumulation of heat supply (D) Thermal storage/heating end.
As can be seen from Figure 12A, the solar irradiation intensity was good from January 22 to January 25, in which the normal irradiation intensity basically remained at 900 W/m2∼1,000 W/m2, which was close to twice the horizontal irradiance. On January 22∼January 23: the initial value of PCM solid ratio in the phase change device was 100%. Combined with Figures 12A, B, when the solar normal irradiation intensity is greater than 200 W/m2, the collector control is activated, and the collector outlet oil temperature is rapidly increased to 110°C before output.Combining insights from Figures 12B, C, after the solar collector mode is initiated, the system’s heat storage state transitions from electrically-assisted to solar heat storage. Correspondingly, as outdoor temperatures rise under solar irradiation, the radiator supply intervals lengthen, as shown in Figure 12D. The PCM temperature quickly stabilizes, signifying the good intensity of solar irradiation. This meets the radiator’s normal heating demands, and any surplus solar energy is stored in the PCM. As a result, the PCM solid phase proportion decreases from one to 0 in Figure 12A, indicating that the 97 kg of PCM has reached its maximum phase change heat storage capacity. Once this is accomplished, the PCM transitions to sensible heat storage in its liquid phase, and the collector control switches off after the PCM temperature surpasses 80°C.From January 23 to January 24, the system first provides heat to the building via stored phase-change heat, followed by a brief period of electric auxiliary heating, before resuming solar heat storage the next day. Unlike on January 22, the PCM solid phase ratio didn't drop to zero on January 23, leading to more electric heating on January 24.From January 24 to January 25, the PCM solid phase proportion remains at a minimum of 20%, with other patterns similar to previous days. During the solar-plus-electric auxiliary heating phase, the two heat storage methods alternate to meet indoor heating needs.
On this typical day of heat storage, the oil pump flow waveform mirrors that of direct solar radiation. The pump flow stabilizes at 1.5 L/min for an extended period, and the heating thermal power remains consistent at 1,800 W, keeping the indoor temperature around 19°C. The total heat stored under this mode is 47.1 kWh, comprising 31.5 kWh from solar heat storage and 15.6 kWh from electric-assisted heat storage. The solar energy guarantee rate stands at 66.9%.
4.2.2 Solar separate heating mode
Solar energy alone heating mode, this paper takes March 17 to March 20 (8 moments timing, 10,570–10,642 h) for simulation, the solar radiation in this phase is shown in Figures 13A–D.
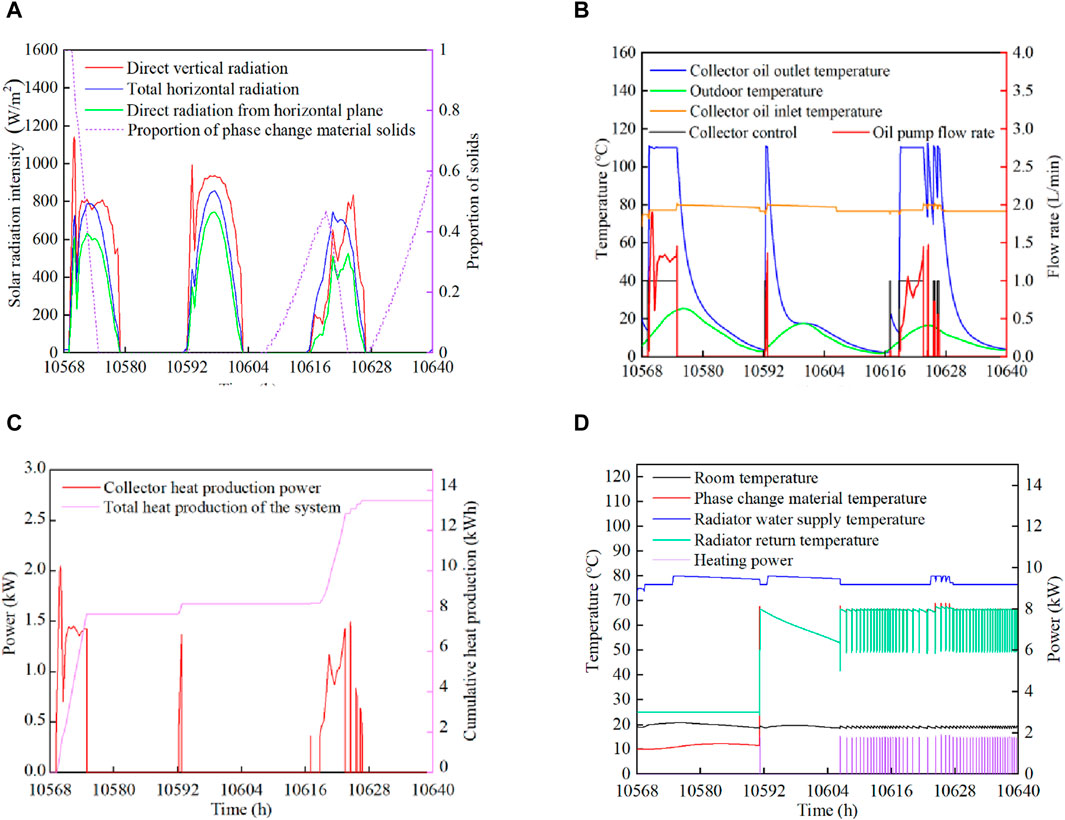
Figure 13. Simulation of solar alone heating mode. (A) Solar radiation intensity, (B) collector side, (C) Accumulation of heat sup, (D) Thermal storage/heating end.
As can be seen from Figure 13, the weather conditions were good from March 17 to March 20, The outdoor temperature experienced a significant rebound compared to January, although it mostly remained between 5°C and 15°C. The PCM solid ratio during this period fluctuated as follows: 1→0→0.48→0→0.6. The lowest temperature of the PCM was 75°C, which is above the activation temperature of 70°C for the electric-assisted heat source. These factors indicate that the system’s heat supply and circulation performed well during this period. Heat energy was continuously replenished by solar radiation and carried over to the following day.In conjunction with Figures 13A, B, and (D), solar irradiance remained strong on March 19. However, the collector control mode was set to 0 for an extended period. This was due to the PCM temperature reaching its upper limit of 80°C after brief periods of collector activity on both March 18 and March 19. The cessation was also influenced by the higher outdoor temperatures and the discontinuation of end-user heat supply. Between 10,605 and 10642 h, the heating-side demand for heat increased, and the system’s heat collection shifted from a saturated state to a vacant state. This triggered a 0→1 transition in the heat collection control mode, which correlates with an increase in cumulative heat collection as seen in Figure 13C.
The PCM is in phase change state for a long time during this typical daily heat storage period, and the temperature change of the phase change device is stable, the cumulative heat collection capacity is 13.3 kWh, the solar energy guarantee rate is 100%, and the indoor temperature is maintained between 18°C and 21°C, the solar energy guarantee rate is 100%, which meets the indoor heating demand.
4.2.3 Electro-assisted individual heating mode
Electricity-assisted heat alone heating mode, this paper takes December 31 ∼ January 3 (0 moment timing, 8736h–8808 h) for simulation, the simulation results are shown in Figures 14A–D.
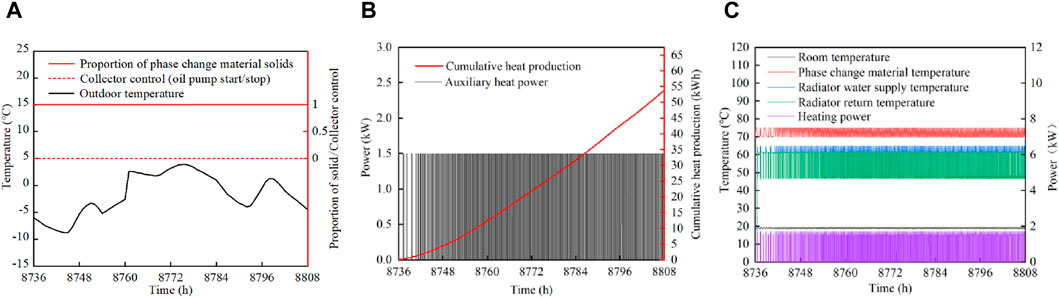
Figure 14. Simulation of separate heating mode with electric auxiliary heating. (A) Collector side, (B) Heat supply accumulation, (C) Termal storage/heat supply end.
From December 31 to January 3, the weather remained cloudy, resulting in a collector control output of zero. During this period, the heating was solely provided by the electric auxiliary heat source. The system relied on solid-phase sensible heat for both heat storage and heat release. As a result, the temperature of the phase change device, as shown in Figure 14C, displayed a sawtooth waveform, a pattern dictated by the characteristics of sensible heat storage and release. The indoor temperature was maintained at a stable range of 18°C–19°C, with the electric auxiliary heat accumulating 54 kWh of energy.
Simulations of the system’s three operational modes revealed that the supply water temperature stabilized at 60°C–70°C, while the return water temperature remained between 50°C and 60°C. The performance of the solar heating system is intrinsically linked to the heat storage mode of the phase change material, which can be either sensible or latent heat storage. The fluctuating temperature of the phase change material serves as an indicator of the system’s current thermal energy demand and allows for the evaluation of the system’s capacity. Among the modes, the solar-only heating mode makes the most efficient use of phase change heat storage. This is followed by the combined solar and electric auxiliary heating mode, with the electric-only mode being the least efficient. It is evident that the total amount of heat collected (S) and the mass of the phase change material (m) are the most crucial factors affecting the performance of the solar heating system.
5 Solar heating system optimization
In solar heating systems, the solar guarantee rate is typically inversely correlated with the system’s initial investment. While increasing the solar guarantee rate boosts both the initial investment and operating costs (Jin et al., 2020), it also enhances the system’s energy-saving, economic, and environmental benefits. This paper employs the annualized cost method to holistically consider the initial investment, operating costs, and energy efficiency of the system, aiming to optimize its overall performance. The system’s collector area and the quality of the phase change material serve as the optimization variables. An objective function is established, and the Trnopt module in TRNSYS is used to interface with the Genopt optimization software. This integration employs the Hooke-Jeeves optimization algorithm to simultaneously optimize the variables.
5.1 Introduction to the annualised cost method and the Hooke-Jeeves algorithm
The dynamic calculation using the annualized cost method means that the initial investment in the system is amortized over each year of the system’s lifespan according to the capital recovery formula. The sum of the discounted initial investment and the annual operating cost constitutes the annual cost for that year (Zhao et al., 2021). This method converts all costs into a common present value metric, taking into account all factors affecting the system’s economic viability over its entire lifespan. The Hooke-Jeeves algorithm, also known as the step acceleration method or the pattern search method, is a direct method for solving optimization problems. It offers the advantages of rapid convergence and strong stability. The algorithm consists of two key components: the “exploratory move” and the “pattern move.” The exploratory move searches along ‘n' directions to determine a new base point and the direction favorable for reducing the function value. The pattern move proceeds along the direction defined by two adjacent base points. These two moves alternate, and the optimization algorithm uses the simulation output to assess whether the optimization goal has been achieved. This informs the decision on whether to rerun the simulation program for further optimization (Ma et al., 2019; Wang, 2019). The workflow of the Genopt algorithm is illustrated in Figure 15.
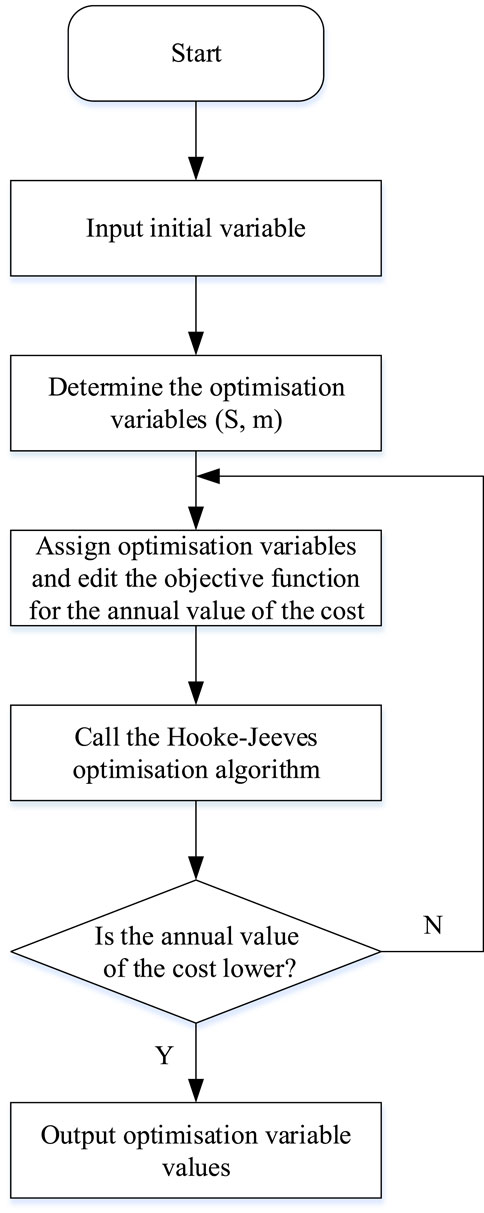
Figure 15. Genopt optimization flow.
5.2 Optimizing the objective function
The annual value of the cost includes the initial investment in the system and the operating costs, and the annual value of the cost method is calculated by the formula (Jiang, 2018):
where Z is the annual value of the cost, RMB/year; i is the deposit rate, taken as 5.5%; n is the system life, taken as 25 years; L is the initial investment in the system; and C is the annual operating cost, RMB/year.
The total initial investment cost of the system L0 includes: collector mirror field cost L1, light tracker cost L2, heat absorber cost L3, phase-change box and phase-change material cost L4, heat exchanger cost L5, pump and piping cost L6, heat-transferring material cost L7, and thermal insulation material cost L8. The annual running cost includes: circulating oil pump running electricity cost C1, circulating water pump running electricity cost C2, and electric heating cost C3, and then there are:
The cost of each component of the system is considered at manufacturing cost price, then the initial investment estimate of the main equipment is shown in Table 3.
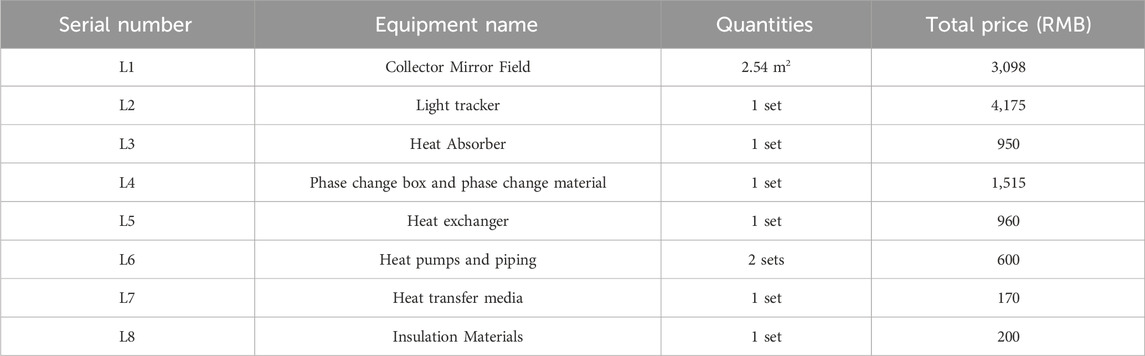
Table 3. Estimated initial investment in solar heating system equipment.
According to the relevant provisions of the tariff policy, the city of Baiyin implements the step tariff system on a monthly basis for urban and rural residential electricity users with 1 m per household. The first step (0–160 kWh) is 0.51 RMB/kWh, the second step (161–240 kWh) is 0.56 RMB/kWh, and the third step (>241 kWh) is 0.81 RMB/kWh. The building belongs to a place that consumes a higher amount of electricity, and the tariffs are calculated according to the third step.
5.3 Optimization results
The optimization process of the focused solar heating system containing phase change thermal storage is shown in Figure 16. Where the horizontal coordinates denote the iteration step, and the vertical coordinates denote the solar collector area and phase change material mass, respectively.
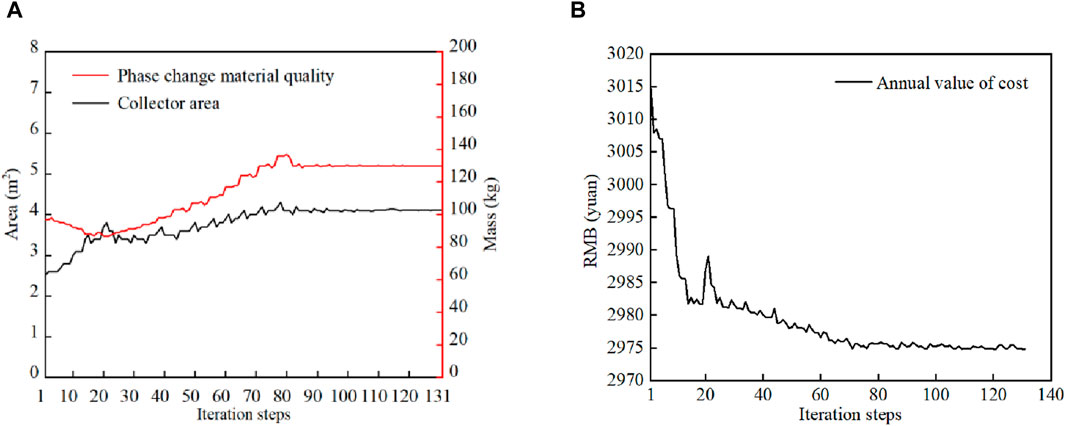
Figure 16. Optimization change process of solar heating system. (A) Optimization process of collector and compared to material (B) Change process of annual value of cost.
From Figure 16A, it can be seen that the initial values of the collector area and the mass of phase change material are 2.54 m2 and 97 kg, respectively, and after 80 iterations of calculation, the range of change tends to stabilize and reaches the convergence state. At this time, the optimal area of solar collector is 4.11 m2 and the optimal mass of phase change material is 130 kg. Figure 16B shows the optimization process of the annual value of the system cost, and the total cost of the system is reduced by a total of 1,025 RMB during the whole life cycle after optimization. According to the “Technical Specification for Solar Heating and HVAC Engineering”, the solar guarantee rate should be 20%–40% when the solar heating system adopts short-term thermal storage. Compared with before optimization, the solar guarantee rate increases from 20.36% to 30.4%. In the paper, the solar heating system is established based on the more abundant solar resource area. In the solar heating system design criteria for the use of solar energy efficiency is recommended, in which the short-term heat storage system in the area of more abundant solar energy resources, the solar energy guarantee rate is generally 20%–40%, and the specific recommended data are shown in Table 4.The comparison before and after optimization is shown in Table 5.
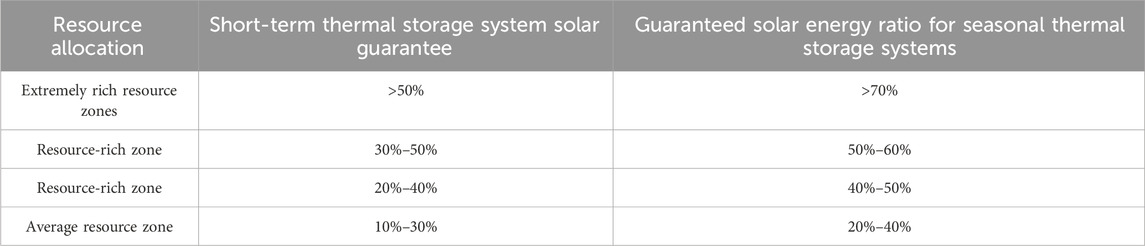
Table 4. Recommended solar guarantee rates for different solar resource zones.
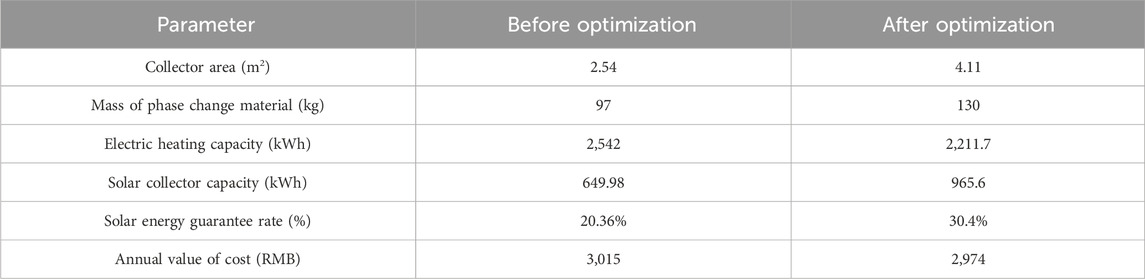
Table 5. Comparison of system parameters before and after optimization.
Figure 17 shows an analysis of the economic performance of the solar heating system before and after optimisation (A indicates the annual value of the costs, B indicates the annual value of auxiliary heat source costs, C indicates the annual value of initial investment costs, D indicates the annual equivalent cost of solar energy, E indicates the annual value of other project costs).From the economic point of view, although the optimization process increases the annual value of the initial investment cost of the system from 466.7 RMB to 577.8 RMB, the solar guarantee rate increases rapidly, the annual equivalent cost of the solar collector increases by 256.2 RMB, and the cost of the electric heating decreases from 2059.3 RMB to 1791.2 RMB. Due to the limitation of the weather environment, as the optimization process proceeds, the growth rate of the solar guarantee rate slows down, the initial investment cost and the operation cost increase, and finally the economic optimal solution is obtained. The environmental benefits of the solar heating system tend to be more optimal after optimization using the cost annual value function model. Let the carbon emission reduction in the whole life cycle of the system be G, then there are:
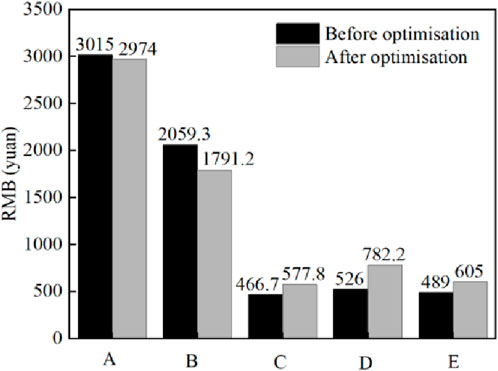
Figure 17. Comparison of the economics of solar heating systems.
Where,
6 Conclusion
In this paper, This study focuses on the heating system for a room at a driving school in the Baiyin area of Gansu Province. DEST software was used to simulate the building’s dynamic heat load, and a focused solar heating system with phase change thermal storage was designed to be compatible with the room’s heating requirements. The heat storage performance of the composite phase change material was also verified. TRNSYS software facilitated the modeling of the solar heating system and the analysis of various operational modes. Finally, the Hooke-Jeeves optimization algorithm optimized the system’s collector area S and the mass of the phase change material m, using the annual value of cost as the objective function:
Specific conclusions are as follows:
(1) To address the winter heating needs of isolated buildings and overcome the shortcomings of existing solar heating systems, such as low temperatures in flat-plate collectors and vacuum tube collectors as well as poor performance in heat storage tanks, an innovative approach was taken. This involved combining a focusing disc collector with phase change material for thermal storage, resulting in the design of a focused solar heating system with phase change thermal storage was designed.
(2) A mathematical model for the main components of the focused solar heating system that includes phase change thermal storage was established, as well as a corresponding TRNSYS system model. Simulation analyses indicate that the system’s water supply temperature stabilizes at approximately 60°C–70°C, while the return water temperature remains stable at 50°C–60°C. Furthermore, the performance of the solar heating system is closely related to the heat storage mode of the phase change material, either sensible or latent heat storage. The fluctuating temperature characteristics of the phase change material can reflect the current thermal energy requirements.
(3) Among the operation modes, solar-only heating maximizes the utilization of phase change thermal storage, followed by a combined solar and electric auxiliary heating mode. The least effective mode was using electric auxiliary heating alone. This suggests that the collector area S and phase change material mass m are the most critical factors affecting the system’s performance.
(4) Using the annual value of cost as the objective function, the Hooke-Jeeves algorithm optimized the system’s collector area to 4.11 2 and the mass of the phase change material to 130 kg. As a result, the solar energy guarantee rate increased by 10.04%; the system cost was reduced by 1,025 RMB over its life cycle, and the carbon reduction amount increased from 10,838 kg to 16,101 kg. The environmental benefits are better enhanced.
Data availability statement
The original contributions presented in the study are included in the article/Supplementary Material, further inquiries can be directed to the corresponding author.
Author contributions
YZ: Conceptualization, Data curation, Funding acquisition, Investigation, Methodology, Project administration, Resources, Validation, Visualization, Writing–review and editing. WZ: Supervision, Formal Analysis, Software, Writing–original draft.
Funding
The author(s) declare that financial support was received for the research, authorship, and/or publication of this article. This research was supported by the following projects: The experimental platform is based on Lanzhou Jiaotong University, and is supported by 21JR7RA329, the Youth Science and Technology Fund of Gansu Province, China, and this paper represents the authors’ personal views.
Acknowledgments
In the research process of the contents of this paper, we are very grateful to Lanzhou Jiaotong University for providing various related hardware platforms, as well as the software simulation platforms provided by the relevant researchers of the peer group, and we thank the peer group for the software platform support.
Conflict of interest
The authors declare that the research was conducted in the absence of any commercial or financial relationships that could be construed as a potential conflict of interest.
Publisher’s note
All claims expressed in this article are solely those of the authors and do not necessarily represent those of their affiliated organizations, or those of the publisher, the editors and the reviewers. Any product that may be evaluated in this article, or claim that may be made by its manufacturer, is not guaranteed or endorsed by the publisher.
References
Abhat, A. (1983). Low temperature latent heat thermal energy storage: heat storage materials. Sol. Energy 30 (04), 313–332. doi:10.1016/0038-092X(83)90186-X
Aghbalou, F., Badia, F., and Illa, J. (2006). Exergetic optimization of solar collector and thermal energy storage system. Int. J. Heat. Mass Tran. 49 (07-08), 1255–1263. doi:10.1016/j.ijheatmasstransfer.2005.10.014
Al-Azawii, M. M., Theade, C., Danczyk, M., Johnson, E., and Anderson, R. (2018). Experimental study on the cyclic behavior of thermal energy storage in an air-alumina packed bed. J. Energy Storage 18, 239–249. doi:10.1016/j.est.2018.05.008
Alva, S. L. H., Gonzalez, J. E., and Dukhan, N. (2006). Initial analysis of PCM integrated solar collectors. J. Sol. Energy Eng. 128 (02), 173–177. doi:10.1115/1.2188532
Gil, A., Peiró, G., Oró, E., and Cabeza, L. F. (2018). Experimental analysis of the effective thermal conductivity enhancement of PCM using finned tubes in high temperature bulk tanks. Appl. Therm. Eng. 142, 736–744. doi:10.1016/j.applthermaleng.2018.07.029
Jiang, X. Y. (2018). Influence of external walls on building energy consumption in different climate zones. Build. Energy Environ. 37 (07), 22–24. doi:10.3969/j.issn.1003-0344.2018.07.005
Jin, G., Liu, M. Y., and Wu, X. (2020). Example analysis of operational characteristics of solar-ground source heat pump system in severe cold region. Build. Sci. 36 (02), 51–55. doi:10.13614/j.cnki.11-1962/tu.2020.02.07
Lamrani, B., Kuznik, F., and Draoui, A. (2020). Thermal performance of a coupled solar parabolic trough collector latent heat storage unit for solar water heating in large buildings. Renew. Energ 162, 411–426. doi:10.1016/j.renene.2020.08.038
Li, J. P., Wei, S. F., Dong, Y. H., Liu, X. M., and Novakovic, V. (2022). Technical and economic performance study on winter heating system of air source heat pump assisted solar evacuated tube water heater. Appl. Therm. Eng. 221 (2023), 119851. doi:10.1016/j.applthermaleng.2022.119851
Li, M., Wang, R. Z., Xu, Y. X., and Wu, J. Y. (2000). A new hybrid system with combined cycle of solar heating and refrigeration. Energy Eng. (02), 10–13. doi:10.16189/j.cnki.nygc.2000.02.004
Liu, Z. G., Zhang, C. P., Zhao, Y. H., and Tang, D. W. (2005). Design and experimental study of a new type of cavity heat absorber. Acta Energiae Solaris Sin. 26 (03), 332–337. doi:10.3321/j.issn:0254-0096.2005.03.007
Llorente, J., Ballestrin, J., and Vazquez, A. J. (2011). A new solar concentrating system: description, characterization and applications. Sol. Energy 85 (05), 1000–1006. doi:10.1016/j.solener.2011.02.018
Ma, X. F., Guo, J. X., and Peng, S. N. (2019). Optimization of solar-air source heat pump heating system. Dist. Heat. (04), 123–129+143. doi:10.16641/j.cnki.cn11-3241/tk.2019.04.021
Madhlopa, A., and Johnstone, C. M. (2011). Computation of solar radiation distribution in a solar still with internal and external reflectors. Sol. Energy 85 (02), 217–233. doi:10.1016/j.solener.2010.12.010
Naumann, R., and Emons, H. H. (1989). Results of thermal analysis for investigation of salt hydrates as latent heat-storage materials. J. Therm. Anal. 35, 1009–1031. doi:10.1007/BF02057256
Safari, A., Saidur, R., Sulaiman, F. A., Xu, Y., and Dong, J. (2017). A review on supercooling of Phase Change Materials in thermal energy storage systems. Renew. Sust. Energy Rev. 70, 905–919. doi:10.1016/j.rser.2016.11.272
Samanes, J., García-Barberena, J., and Zaversky, F. (2015). Modeling solar cavity receivers: a review and comparison of natural convection heat loss correlations. Energy Technol. 69, 543–552. doi:10.1016/j.egypro.2015.03.063
Sheng, Q., Xing, Y. M., and Luo, H. (2014). Experimental study on thermal storage performance of barium hydroxide phase change material octahydrate. J. Beijing Univ. Aeron. Astron. 40 (05), 635–638. doi:10.13700/j.bh.1001-5965.2013.0385
Talmatsky, E., and Kribus, A. (2008). PCM storage for solar DHW: an unfulfilled promise? Sol. Energy 82 (10), 861–869. doi:10.1016/j.solener.2008.04.003
Tan, Y., Zhao, L., Bao, J., and Liu, Q. (2014). Experimental investigation on heat loss of semi-spherical cavity receiver. Energy Convers. manage. 87, 576–583. doi:10.1016/j.enconman.2014.06.080
Tang, J. C., and Liang, J. X. (2019). Numerical analysis and experimental investigation of the impact of heating elements on heat storage and release of solid regenerator. J. Hefei Univ. Technol. 42 (03), 376–379+414. doi:10.3969/j.issn.1003-5060.2019.03.012
Varol, Y., Koca, A., Oztop, H. F., and Avci, E. (2010). Forecasting of thermal energy storage performance of Phase Change Material in a solar collector using soft computing techniques. Expert Syst. Appl. 37 (04), 2724–2732. doi:10.1016/j.eswa.2009.08.007
Wang, C. X., and Hu, Z. J. (2018). Research on the application of low-to-medium temperature phase change thermal energy storage technology in heating field. Sino-Global Energy 23 (02), 82–88.
Wang, Q. L. (2019) Research on optimization of renewable energy multi source complementary heating system. [dissertation/master's thesis]. [Qingdao]: Qingdao University of Technology.
Wang, Y. F., Wang, L., Chen, H. S., Xie, N. N., Yang, Z., and Chai, L. (2016). Numerical study on thermal performance characteristics of a cascaded latent heat storage unit. Proc. Institution Mech. Eng. 230 (1), 126–137. doi:10.1177/0957650915604757
Wu, T., Liu, X. N., Yang, L., and Li, W. (2021). Numerical analysis and experiment on heat storage and release of shaped phase change heat storage device. J. Hefei Univ. Technol. 44 (11), 1465–1469. doi:10.3969/j.issn.1003-5060.2021.10.005
Wu, T. T., Chen, X., Han, A. J., Ye, M. Q., and Zhao, M. C. (2013). Effect of high-temperature phase change material on the performance of infrared decoy. Spectrosc. Spect. Anal. 33 (10), 2651–2654. doi:10.3964/j.issn.1000-0593(2013)10-2651-04
Yan, Y. F., Zhang, Z. E., Zhang, L., and Dai, C. L. (2012). Solar energy utilization technology and its applications. Acta Energiae Solaris Sin. 33 (S1), 47–56. doi:10.19912/j.0254-0096.2012.s1.001
Yang, X., Xiong, T., Dong, J. L., Li, W. X., and Wang, Y. (2017). Investigation of the dynamic melting process in a thermal energy storage unit using a helical coil heat exchanger. Energies 10 (8), 1129–1218. doi:10.3390/en10081129
Zhang, L., Zhao, X. W., Li, B., Zhang, L. G., Zhang, T., and Zhao, W. M. (2021). Brief talk on application research progress of phase change materials. Chem. Propell. Polym. Mat. 19 (02), 24–30. doi:10.16572/j.issn1672-2191.202109014
Zhao, W., Man, Y. X., and Yang, X. Q. (2021). Optimal analysis on the inclination angle and azimuth angle of solar collector in severe cold and cold area. Build. Energy Effic. 49 (05), 82–86. doi:10.3969/j.issn.2096-9422.2021.05.015
Zhou, Y., and Wang, S. X. (2017). Application effect of composite phase change energy storage thermal insulation mortar in solar greenhouse. Trans. Chin. Soc. Agric. Eng. 33 (20), 190–196. doi:10.11975/j.issn.1002-6819.2017.20.024
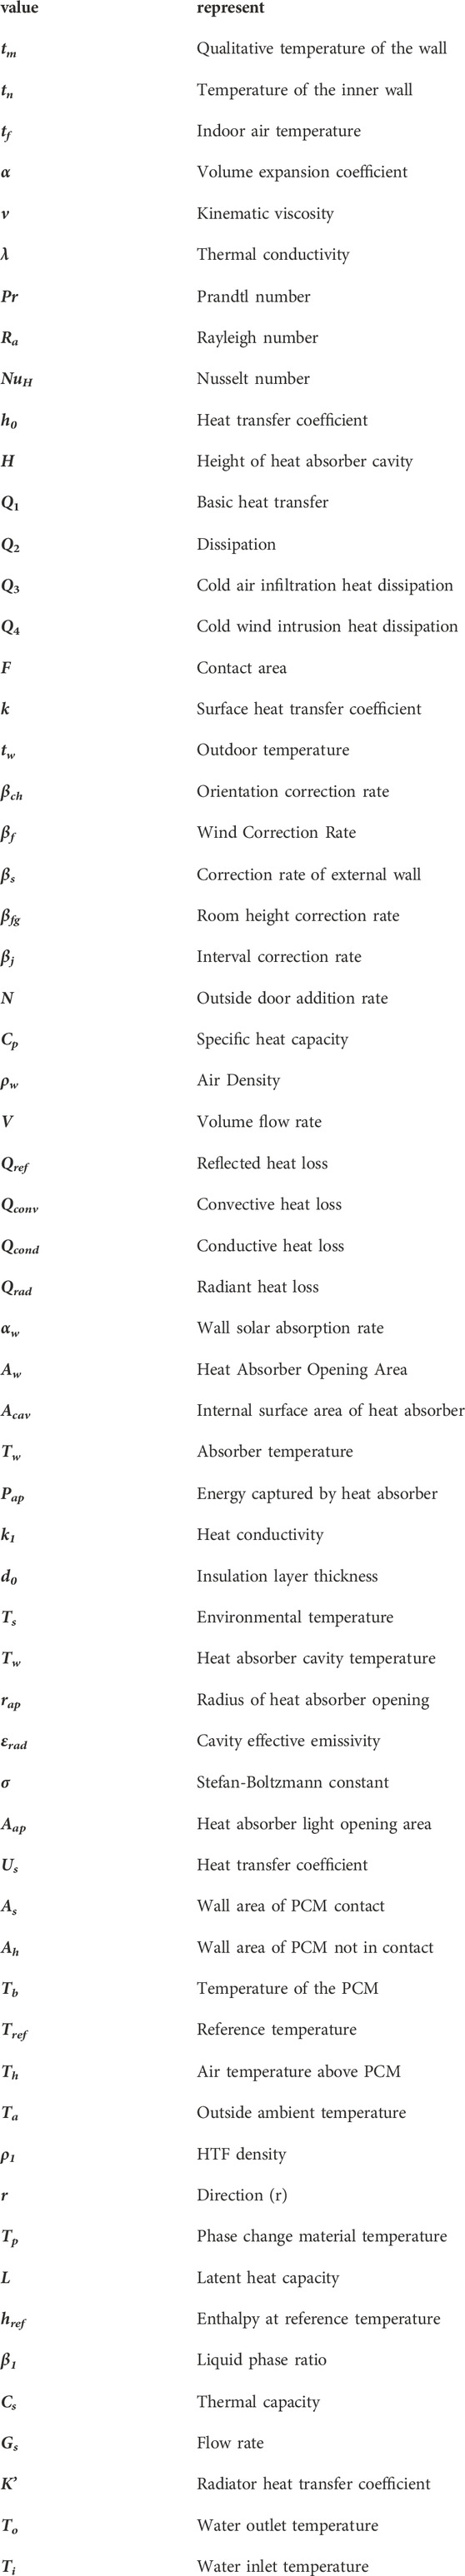
Nomenclature
Keywords: solar heating systems, phase change thermal storage, concentrated solar power, annual value of costs, full life cycle
Citation: Zhang Y and Zhang W (2024) Research and optimisation of focused solar heating system with phase change thermal storage. Front. Energy Res. 12:1279491. doi: 10.3389/fenrg.2024.1279491
Received: 18 August 2023; Accepted: 09 May 2024;
Published: 30 May 2024.
Edited by:
Sudhakar Kumarasamy, Universiti Malaysia Pahang, MalaysiaReviewed by:
Hai Wang, Zhaoqing University, ChinaLahoucine Gourdo, Université Ibn Zohr, Morocco
Xiangfei Kong, Hebei University of Technology, China
Copyright © 2024 Zhang and Zhang. This is an open-access article distributed under the terms of the Creative Commons Attribution License (CC BY). The use, distribution or reproduction in other forums is permitted, provided the original author(s) and the copyright owner(s) are credited and that the original publication in this journal is cited, in accordance with accepted academic practice. No use, distribution or reproduction is permitted which does not comply with these terms.
*Correspondence: Wenqing Zhang, zwqxuesheng@163.com