Natural source electromagnetic survey for geothermal application in industrial area with strong electromagnetic noise
 Rongwen Guo
 Peng Xue1,4
  Jianxin Liu
 Yongfei Wang
- 1School of Geosciences and Info-Physics of Central South University, Changsha, China
- 2Hunan Key Laboratory of Nonferrous Resources and Geological Hazards Exploration, Changsha, China
- 3Key Laboratory of Metallogenic Prediction of Nonferrous Metals and Geological Environment Monitoring Ministry of Education, Central South University, Changsha, China
- 4Guangdong Nonferrous Metals Geological Suvery, Qingyuan, China
- 5Science and Technology on Near-Surface Detection Laboratory, Wuxi, China
The magnetotelluric (MT) method is a widely used geophysical technique for deep structure exploration. However, rapid industrial development has resulted in significant anthropogenic interference for practical applications of this method in recent years. To carry out MT survey in regions with strong electromagnetic (EM) noise, we develop a strategy, in which part of MT sites are set for night time period and a newly proposed automatic clustering method based on MT signal patterns is applied to process measured data from Yingde area in Guangdong. The MT sites are employed in night time to avoid human activity and measure the quiet time MT signal to make sure that we can capture portion of MT signal. Based on cosine similarity, we can use clustering algorithms to separate the signals from the noise. The application of this strategy for geothermal exploration in Yingde area in Guangdong, indicates the validity of our proposed strategy for real geothermal detection.
1 Introduction
The magnetotelluric method (MT) (Avdeev, 2005) utilizes natural electromagnetic (EM) sources to image underground resistivity distribution (Guo et al., 2022; Li et al., 2023b). It has been widely used for underground structure imaging for different purposes (Yang et al., 2021a; Egbert et al., 2022; Yu et al., 2022; Wang et al., 2024). However, it can be easily affected by various EM noise generated by human activities (such as high-voltage power lines, trains, etc.), which can lead to wrong results for underground geoelectrical structure. Therefore, how to obtain reliable MT impedance estimation from the heavily contaminated data has become an important step for MT data interpretation.
Rapid industrialization in southern and eastern China makes the MT survey in this area a challenge. Industrial EM noise can be divided into the following four categories: 1) EM fields generated by high-voltage and high-current transmission lines; 2) The strong magnetic field generated by high-power electrical equipment; 3) short spatial scale EM source in space; 4) Industrial current source (Hu et al., 1999; Sun et al., 2000; Tang et al., 2012; Xu et al., 2012).
When conducting ground EM measurements in areas with significant industrial noise, it is common to use high-quality remote reference sites to improve data quality (Han et al., 2022). Avoiding peak electricity usage periods and extending the duration of data observations can be used to improve data quality (Zhang et al., 2022).
The MT impedance estimation is usually performed based on statistical linear regression methods. The earliest method used is the least square method to estimate the MT impedance tensor (Sims et al., 1971). The least square method assumes that the input magnetic data is noise-free. The failure can down-bias the impedance estimation. The introduction of remote reference method can effectively suppress noise in magnetic fields (Epishkin, 1997; Varentsov et al., 2003; Munoz and Ritter, 2013). However, when the measured data contain outliers, the least square method with remote reference can also produce results with significant biases. This can be addressed by the robust method proposed by (Egbert, 1997), which has become the most widely used method for MT impedance estimation (Rousseeuw et al., 2003; Chave and Thomson, 2004)However, when strong EM noise is present, the studies (Chave, 2014; Chen et al., 2020) have shown that the robust method can also produce unreliable MT impedance estimation.
In recent decades, the rapid development of deep learning has been widely used in denoising MT data (Zuo et al., 2022; Li et al., 2023c). These include the dictionary learning algorithm (Tang et al., 2018), impulsive atoms and a niche particle swarm optimization-orthogonal matching pursuit (NPSO-OMP) algorithm (Li et al., 2020) and deep-learning-based data nonlinear mapping method (Li et al., 2023a).
Some work focuses on separating MT signal and noise based on different features of them. For instance, the clustering method based on Euclidean distance is developed in the work (Tang et al., 2017; Yang et al., 2021b)to separate MT signal and noise. It is worthy of noting that the patterns of MT signal in frequency domain have certain similarities, and this is also true for strong EM noise, which can be used to separate the noise from signal using morphology-based clustering algorithms based on cosine similarity (Guo et al., 2023). The work (Guo et al., 2023) shows that the method is effective in separating the MT signal and noise, which will be used in this paper to extract useful MT signal.
In this study, a joint strategy is used to carry out geothermal imaging in Yingde region of Guangdong Province, a developed industrial area in China. In this strategy, MT sites covering the night time are employed to ensure that at least some segments of the MT signal are measured and the recently proposed morphology-based clustering method is used to denoise the MT data. Then the data are inverted for subsurface resistivity structure with inversion results consistent with borehole logging and available geological information, indicating that with proper strategies, MT can provide useful information on subsurface structure for geothermal application.
2 Methodology
2.1 Basic procedure for MT signal processing
The basic steps of estimating MT impedance can be divided into windowing the time domain data, whitening of time domain data (first-order differencing), Fourier transformation, data stacking and impedance estimation (Figure 1). In the frequency domain, magnetic field components (Hx, Hy) and electrical field components (Ex, Ey) are considered as data input and data output for a linear system defined by the impedance (Figure 2). Through regression methods, the impedance tensor Z (Zxx, Zxy, Zyx, and Zyy). can be estimated, through which the apparent resistivity and phase can be obtained (Chen et al., 2020).
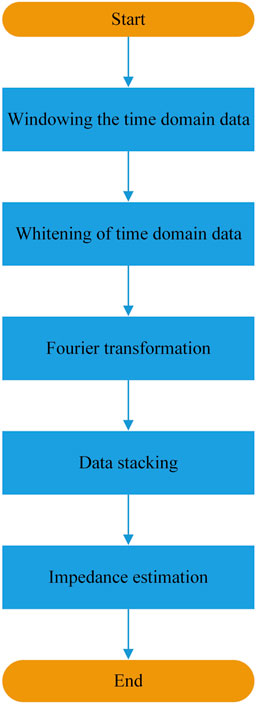
FIGURE 1. Basic process for processing MT signals.
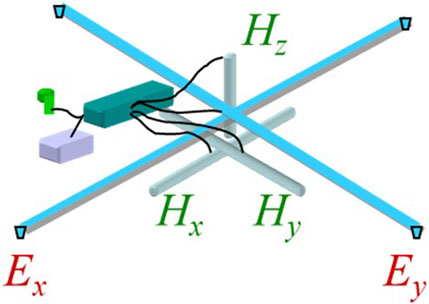
FIGURE 2. MT signal acquisition schematic diagram.
2.2 Automatic clustering method based on MT signal patterns for MT data
Cluster analysis is a method used to classify data into different groups based on their characteristics. It includes self-organizing map clustering (Macqueen, 1967), density-based clustering (Huang and Ng, 1999), and K-means clustering (also known as K-means) (Goodman, 1974). The clustering method used in this paper is the K-means clustering algorithm, which uses cosine similarity for clustering. Assuming that there are two vectors a and b, the cosine similarity is calculated as follows (Guo et al., 2023)
where θ represents the angle between two vectors, xi and yi represent the corresponding components of vectors a and b. In this paper, a and b denote the n-dimensional frequency domain data from two different time series segments. For instance, we carry out Fourier transform on one segment of a time series with length of 2n to obtain a consisting of n discrete Fourier transformed data points.
Cosine similarity is a measure of similarity between two vectors based on the cosine value of the angle. It ranges from −1 to 1, with the values equal to 1 and −1, indicating that the two vectors have the same direction, and the opposite direction, respectively. when the cosine similarity is close to 0, this indicates that the two vectors are nearly orthogonal. One obvious advantage of the use of cosine similarity is that it can reduce high-dimensional data to one dimensional. Compared to the clustering based on Euclidean distance, we cluster the data based on the cosine similarity, which emphasizing the dimensional differences and the relative differences.
If we can group data into k groups with k clustering centers. The K-means clustering algorithm can be described by the following steps (Figure 3):
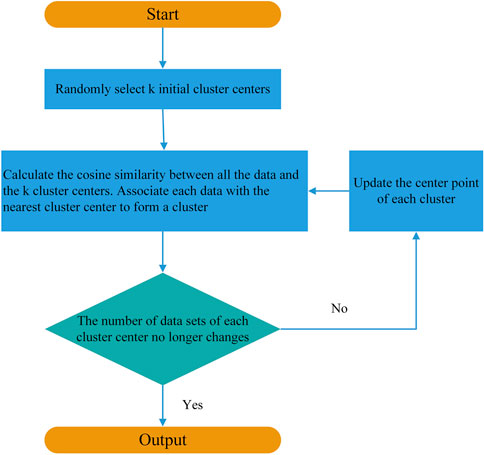
FIGURE 3. K-means algorithm flowchart.
1. Randomly select k initial cluster centers.
2. Calculate the cosine similarity between all the data and the k cluster centers. Based on the maximum cosine similarity, we associate each data with the nearest cluster center to form a cluster.
3. Update the center point of each cluster, i.e., find the center point of each cluster.
4. Repeat steps 2 and 3 until the number of data sets of each cluster center no longer changes.
As indicated in the paper (Guo et al., 2023), both EM signal and noise show cosine similarity, which can be used to separate the signal and noise. Since this method is effective to single out EM signal from contaminated MT data, this method is used to process our noisy MT data in this paper.
3 MT geothermal exploaration in Yingde area of Guangdong Province
3.1 Geologic setting
The survey area is located along the Yingde segment of the Wuchuan-Renhua deep fault in the Yubei-Yuzhong sag zone of the South China Fold Belt (Figure 4). The Wuchuan-Renhua deep fault zone extends over 800 km in total within Guangdong Province, with strike ranging from 20–40°and an faultwidth of 15–20 km. The main fault zone extends north-east from Wuchuan through Yangchun, Yunfu, Sihui, Guangning, and Yingde, to the south end of Guangdong Province. The fault has significant influence on the geothermal distribution in this area cutting through the deep crustal heat source. Along the fault zone, strong dynamic metamorphism can be observed, particularly in the granite formation where series of silicified quartz veins and chloritization structures have formed. Its scale ranges from 5 to 35 m. The rocks on both sides of the fault are extensively altered with good fracture permeability.
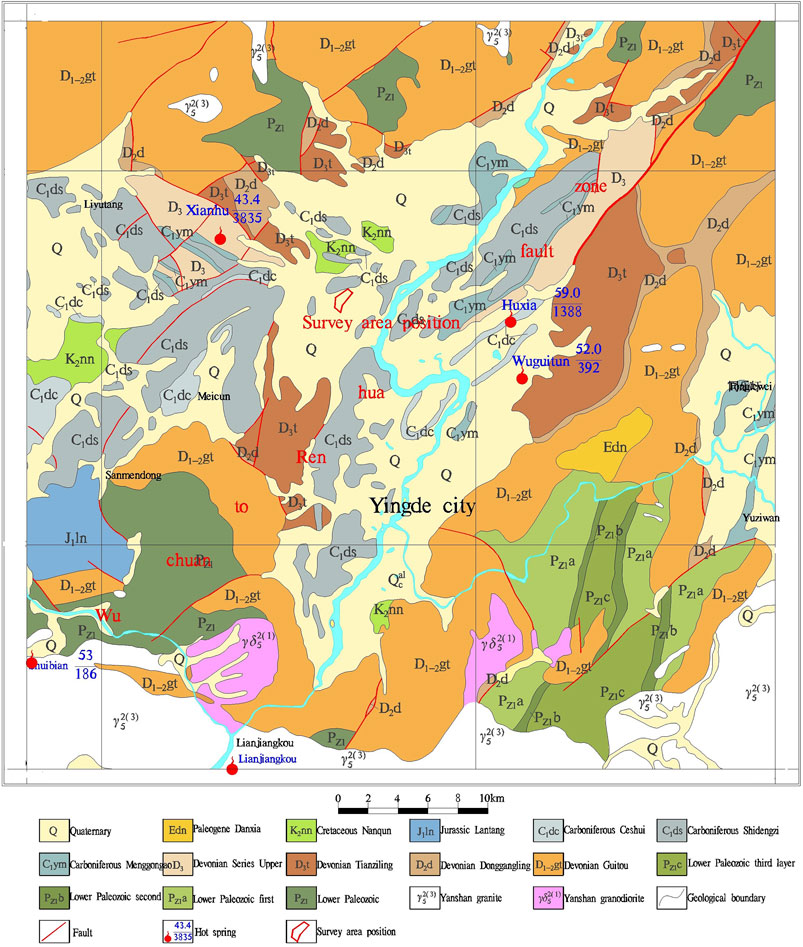
FIGURE 4. Yingde regional geological map.
Deep-seated magmatic rocks are considered as the heat source for the geothermal system in this area. Regional scale faults cut through the magmatic rock and the underground water circulation bring the heat to near surface. The exploration for geothermal targets relies on the understanding of the distribution of the regional and local fault system. Another important issue is to understand the role of different faults, for instance, as water source channel or heat transport channel. Then geothermal reservoir can be well imaged.
Our survey area is surrounded by several hot springs in the nearby region, including Wangbu Wuguitan thermal field (water temperature of 52.0°C and a flow rate of 392 m3/day), Wangbu Lake Submerged thermal field (59.0°C and a flow rate of 1388 m3/day), and thermal field Hot Spring (43.4°C and a flow rate of 3835 m3/day). Further away, there are also Shuibian and Lianjiangkou thermal fields. All these thermal fields are considered to be controlled by secondary faults associated with the regional Wuchuan-Renhua fault with deep cutting, which is believed to be formed multiple times. It is the main fault responsible for the wide distribution of thermal fields in Guangdong Province. The survey area is close to the Hengshitang Xianhu and Wangbu Wuguitan thermal fields which may have similar geological background.
3.2 MT data acquisition
In 2022, geophysicists from Guangdong Geological Suvery Bureau designed 5 MT survey lines (L1-L5) with 28 MT sites for 1 hour (indicated by green dots in Figure 5) and 14 sites for whole night time (indicated by pink dots in Figure 5) in total. The equipment used includes one V5 System 2000 from Canadian company Phoenix, and one GSEM system, jointly developed by Changsha Jushan Intelligent Technology Co., Ltd. and Central South University. Line spacing of 100 m is used. Since the target area is densely populated, it is impossible to use a regular survey grid. The detailed station distribution is shown in Figure 5. The remote reference point was set in approximately 100 km to the northwest.
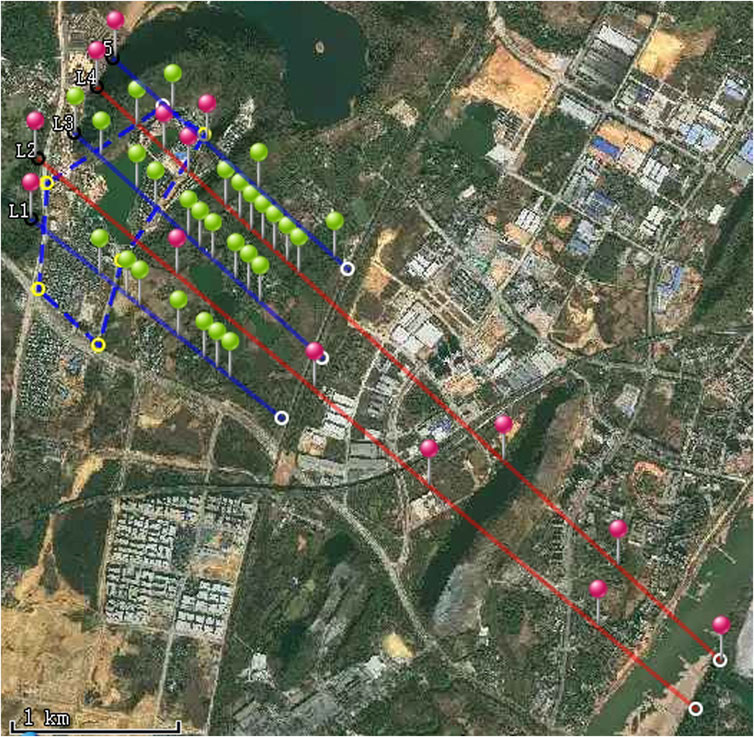
FIGURE 5. The locations of MT sites (the green sites for 1 hour and the pink sites for whole night time).
At the first few days, each station is measured for about 1 hour. Since EM noises are strong during the daytime, it is hardly to get useful information for frequencies lower than 10 Hz. They decided to set up two MT stations during the night time. As indicated in Figure 6, during the daytime, the survey is affected strongly by human acivity, for instance, bypass veichle, which typicallly affects one nearest magnetic channel. However, from the time period 00:00–5:00, the time series is less affected and relatively quiet.
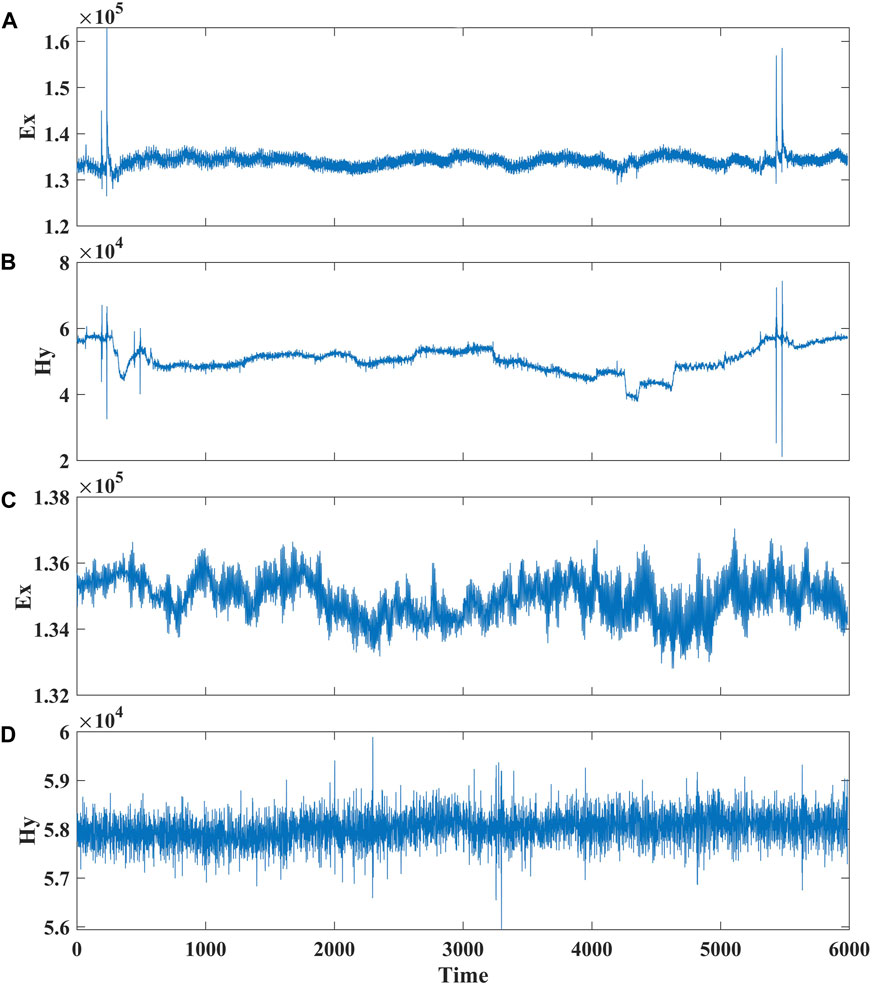
FIGURE 6. Curve of time series at (A, B) daytime and (C, D) midninght.
3.3 Data processing
In this paper, an automatic clustering method is used to separate the noise and signal and a robust impedance method is used to estimate the impedance for the measured data (Guo et al., 2023). For comparison, the data without the use of clustering is also calculated. For sites measured for whole night time, the data from the time period 00:00–05:00 are used. The MT sites for 1 h are not used for comparison in this part.
As shown in Figure 7, compared with the result without the application of clustering, the automatic clustering method produces smoother apparent resistivity and phase results, which is physically more reasonable. Without clustering, both apparent resistivity and phase jump rapidly with large error bar. The application of clustering improves the results significantly for both apparent resistivity and phase. The overall trend of apparent resistivity and phase is consistent, showing an initial increase followed by a decrease in apparent resistivity.
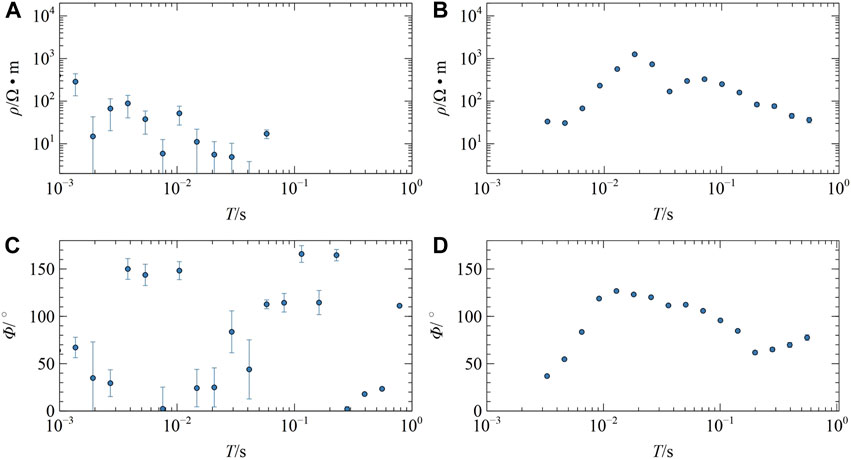
FIGURE 7. The (A, B) apparent resistivity and (C, D) phase comparison for (A, C) the robust method and (B, D) clustering of MT observed data at sites L5-M13.
Similar results also indicated in Figure 8 for another station. Without clustering, the resistivity curve processed by the robust method shows no clear trend, and the phase is quite scattered, both with large error bars. However, after the application of the automatic clustering algorithm, the results become smoother. Both the apparent resistivity and phase curves show significant improvements, exhibiting better continuity and consistent change pattern. Similar results are also shown in Figure 9 for site L5-M16. After clustering, the data are improved significantly, showing the benefit of our proposed method for data with strong EM noise.
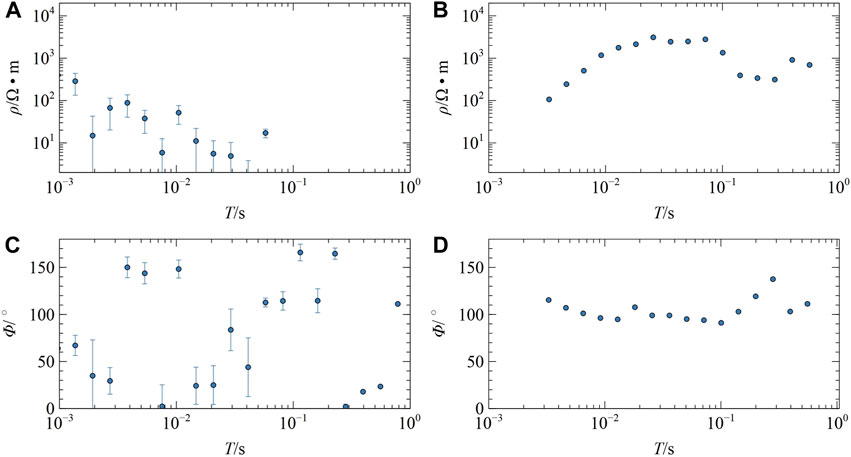
FIGURE 8. The (A, B) apparent resistivity and (C, D) phase comparison for (A, C) the robust method and (B, D) clustering of MT observed data at sites L5-M14.
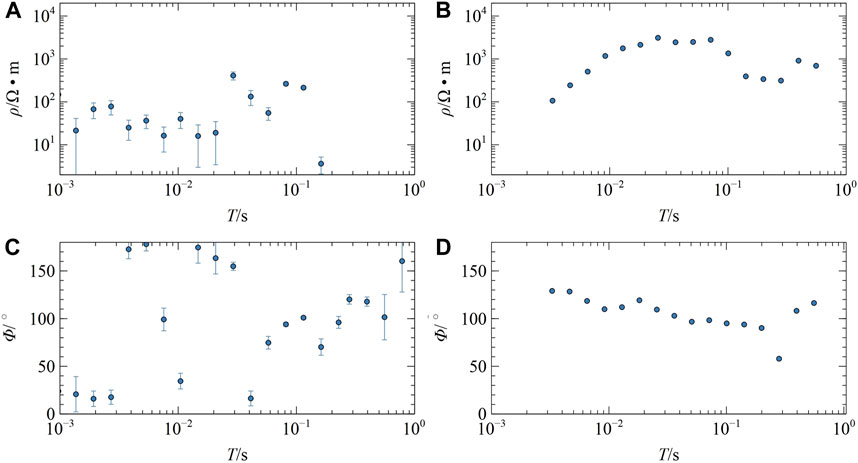
FIGURE 9. The (A, B) apparent resistivity and (C, D) phase comparison for (A, C) the robust method and (B, D) clustering of MT observed data at sites L5-M16.
3.4 2D inversion
We perform two-dimensional inversion by MODEM2d (Egbert and Kelbert, 2012; Kelbert et al., 2014) for the measured data. The inversion is based on TM mode, and 16 frequencies are used, ranging from 320 Hz to 1 Hz. The error tolerance is set to 5%. The initial model is a uniform half-space with a resistivity of 100 Ω⋅m. The grid consists of 100 × 100 cells, with horizontal size of 70 m and vertical size of 50 m. The root mean square (RMS) of data misfit set for all the survey lines is less than 3.
4 Results interpretation and discussion
Figure 10 illustrates the resistivity inversion results for lines L1 to L5. Since no night-time stations for L1 and L3, we will not use the data for deep structure interpretation. This can be clearly seen from the inversion results for different lines. For L1 and L3, there is less information in deep region than the rest lines. The deep high resistivity structure for L3 is probably artifact caused by EM noise. Subsequently, we will focus on the analysis of L2, L4 and L5.
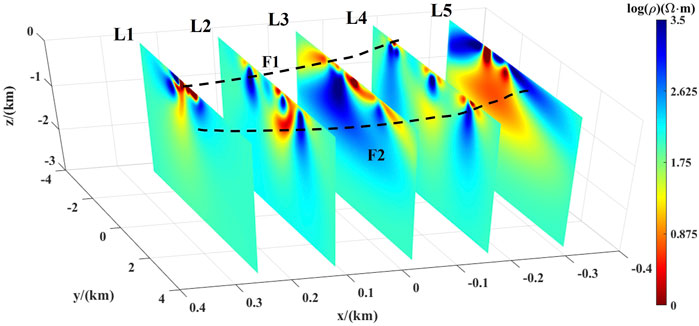
FIGURE 10. The MT inversion results.
For L5, since only two nighttime sites are available, the resolution can be poor. For L2, there are two high resistivity anomalies on both sides of the line and relatively low resistivity in the middle. The transition zone at y = 2 km is highly correlated to the Beijiang fault. The large area of low resistivity is probably caused by the smoothing effect applied during inversion. We expect a more localized low resistivity body, probably caused by fault filling and alteration.
For L4, the inversion result is very similar as that of L2. At y = −3 km, the high resistivity body is verified by a 3,300 m borehole as shown in Figure 11. The 3,300 m borehole drilled a fractured hot water layer at around 3300 m with temperature of 70 C on the surface. We infer the fault F1 by lining up the two high resistivity bodies as in Figure 10. The whole borehole is almost in the limestone layer. The hot water is mainly caused by the temperature gradient of earth. The high resistivity anomaly similar as the one in L2 likely reflects the existence of Beijiang fault F2. We consider F2 as the channel for water source. F2 provides water input for geothermal reservoir and F1 acts as geothermal reservoir or channeling.
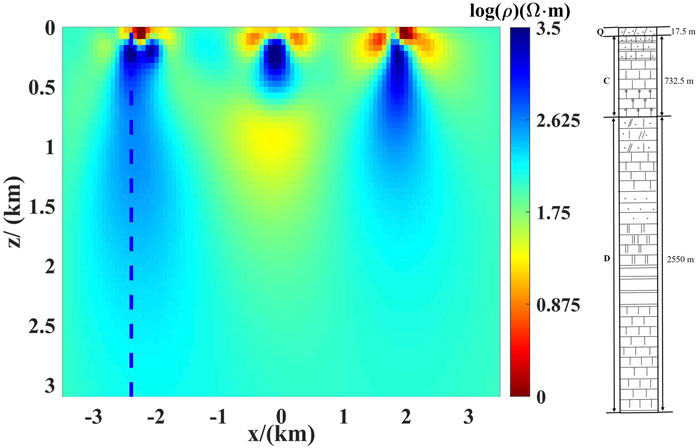
FIGURE 11. 2D profile of the L4 survey line and the location of the borehole, the blue dashed line represents the location of the borehole.
Fault F2 cuts into great depth. When groundwater flows dissolution in the tectonic fractures, the underground rock undergoes dissolution and forms a more connected fracture-cave zone, which acts as thermal fluid channels. At the same time, the deep circulation groundwater is heated by deep heat sources (geothermal energy) and dissolves a large amount of minerals, forming geothermal mineral water. Therefore, the mining area has the potential of finding hot springs.
Geothermal resources typically occur in areas where discordogenic faults meet. Moreover, discordogenic faults provide channels connecting deep heat sources, and high-temperature water with rich of dissolved mineral can be transported back to shallow area through the faults. The upper cap prevents the heat escape of hot water, acting as a storage zone for geothermal resources.
5 Conclusion
In this study, we develop a combined strategy to carry out geothermal exploration in industrial region. To avoid noise from human activity, part of MT sites are employed for night time period. An automatic clustering method based on cosine similarity is used to separate the EM signal and noise, and subsequently impedance estimation is carried out. Then, 2D inversion for the impedance data is carried out. The inversion result matches well with the available geologic information and borehole logging data. According to existing geological data, the area is mainly characterized by convective geothermal systems, shallow-circulating water in Beijiang fault is possibly input into the high temperature fault channel (F1) to form a thermal convection system as indicated from our inversion results.
Data availability statement
The raw data supporting the conclusion of this article will be made available by the authors, without undue reservation.
Author contributions
RG: Writing–original draft, Writing–review and editing. PX: Writing–original draft, Writing–review and editing. JxL: Funding acquisition, Writing–review and editing. YW: Writing–original draft, Writing–review and editing. ST: Writing–review and editing. JjL: Writing–review and editing. WX: Writing–review and editing.
Funding
The author(s) declare financial support was received for the research, authorship, and/or publication of this article. This work was financially supported by the National Natural Science Foundation of China (42130810,42074165,42174171). The work is also supported by the project of Science and Technology on Near-Surface Detection Laboratory (grant no. 6142414221605).
Acknowledgments
We would like to thank Guangdong nonferrous metals geological suvery 940 team for providing us with the measured data. We are grateful to the High Performance Computing Center of Central South University for partial support of this work.
Conflict of interest
The authors declare that the research was conducted in the absence of any commercial or financial relationships that could be construed as a potential conflict of interest.
Publisher’s note
All claims expressed in this article are solely those of the authors and do not necessarily represent those of their affiliated organizations, or those of the publisher, the editors and the reviewers. Any product that may be evaluated in this article, or claim that may be made by its manufacturer, is not guaranteed or endorsed by the publisher.
References
Avdeev, D. B. (2005). Three-dimensional electromagnetic modelling and inversion from theory to application. Surv. Geophys. 26, 767–799. doi:10.1007/s10712-005-1836-x
Chave, A. D. (2014). Magnetotelluric data, stable distributions and impropriety: an existential combination. Geophys. J. Int. 198, 622–636. doi:10.1093/gji/ggu121
Chave, A. D., and Thomson, D. J. (2004). Bounded influence magnetotelluric response function estimation. Geophys. J. Int. 157, 988–1006. doi:10.1111/j.1365-246x.2004.02203.x
Chen, H., Guo, R., Dong, H., Wang, Y., and Li, J. (2020). Comparison of stable maximum likelihood estimator with traditional robust estimator in magnetotelluric impedance estimation. J. Appl. Geophys. 177, 104046. doi:10.1016/j.jappgeo.2020.104046
Egbert, G. D. (1997). Robust multiple-station magnetotelluric data processing. Geophys. J. Int. 130, 475–496. doi:10.1111/j.1365-246x.1997.tb05663.x
Egbert, G. D., and Kelbert, A. (2012). Computational recipes for electromagnetic inverse problems. Geophys. J. Int. 189, 251–267. doi:10.1111/j.1365-246x.2011.05347.x
Egbert, G. D., Yang, B., Bedrosian, P. A., Key, K., Dean Livelybrooks, D. W., Schultz, A., et al. (2022). Fluid transport and storage in the cascadia forearc influenced by overriding plate lithology. Nat. Geosci. 13, 677–682. doi:10.1038/s41561-022-00981-8
Epishkin, V. (1997). Improving magnetotelluric data-processing methods. Mosc. Univ. Geol. Bull. 71, 347–354. doi:10.3103/s0145875216050057
Goodman, L. A. (1974). Exploratory latent structure analysis using both identifiable and unidentifiable models. Biometrika 61, 215–231. doi:10.1093/biomet/61.2.215
Guo, R., Tong, W., Liu, J., Wang, Y., Yin, Z., and Chen, H. (2023). A new algorithm based on frequency domain magnetotelluric signal form for automatic clustering. J. Central South Univ. Sci. Technol. doi:10.11817/j.issn.1672-7207.2023.10.015
Guo, R., Wang, Y., Egbert, G. D., Liu, R., Pan, K., et al. (2022). An efficient multigrid solver based on a four-color cell-block gauss-seidel smoother for 3d magnetotelluric forward modeling. Geophysics 87, E121–E133. doi:10.1190/geo2021-0275.1
Han, J., Zhan, Y., and Sun, X. (2022). Characteristics and processing of magnetotelluric data under strong electromagnetic interference environment. Seismol. Geol. 44, 736–752. doi:10.3969/j.issn.0253-4967.2022.03.011
Huang, Z., and Ng, M. K. (1999). A fuzzy k-modes algorithm for clustering categorical data. IEEE Trans. Fuzzy Syst. 7, 446–452. doi:10.1109/91.784206
Hu, J., Chen, Q., Yan, L., and Zhang, X. (1999). Analyzing noise sources of mt data and minimizing measurement noise. J. Jianghan Petroleum Inst., 69–71.
Kelbert, A., Meqbel, E., Tandon, H., and Tandon, K. (2014). Modem: a modular system for inversion of electromagnetic geophysical data. Comput. Geosci. 66, 40–53. doi:10.1016/j.cageo.2014.01.010
Li, G., Wu, S., Cai, H., He, Z., Liu, X., Zhou, C., et al. (2023a). Inceptcn: a new deep temporal convolutional network combined with dictionary learning for strong cultural noise elimination of controlled-source electromagnetic data. Geophysics 88, E107–E122. doi:10.1190/geo2022-0317.1
Li, J., Guo, R., Liu, J., Wang, Y., and Wang, X. (2023b). An efficient algebraic multi-resolution sampling approach to 3-d magnetotelluric modelling. Geophys. J. Int. 235, 166–177. doi:10.1093/gji/ggad207
Li, J., Liu, X., Li, G., and Tang, J. (2020). Magnetotelluric noise suppression based on impulsive atoms and npso-omp algorithm. Pure Appl. Geophys. 177, 5275–5297. doi:10.1007/s00024-020-02592-z
Li, J., Liu, Y., Tang, J., and Ma, F. (2023c). Magnetotelluric noise suppression via convolutional neural network. Geophysics 88, WA361–WA375. doi:10.1190/geo2022-0258.1
Macqueen, J. (1967). Classification and analysis of multivariate observations. USA: University of California Los Angeles LA USA.
Munoz, G., and Ritter, O. (2013). Pseudo-remote reference processing of magnetotelluric data: a fast and efficient data acquisition scheme for local arrays. Geophys. Prospect. 61, 300–316. doi:10.1111/1365-2478.12012
Rousseeuw, A., Annick, J., and Leroy, P. (2003). Robust regression and outlier detection. China: Wiley-Interscience.
Sims, W. E., Bostick, F. X., and Smith, H. W. (1971). The estimation of magnetotelluric impedance tensor elements from measured data. Geophysics 36, 938–942. doi:10.1190/1.1440225
Sun, J., Jin, G., Jin, , and Bei, D. (2000). The noise interference of magnetotelluric sounding data. Geophys. Geochem. Explor. (in Chinese) 24, 119–127.
Tang, J., Li, G., and Xiao, X. (2017). Strong noise separation for magnetotelluric data based on a signal reconstruction algorithm of compressive sensing. Chinese J. Geophys. 60, 3642–3654. doi:10.6038/cjg20170928
Tang, J., Li, G., and Zhou, C. (2018). Denoising amt data based on dictionary learning. Chinese J. Geophys. 61, 3835–3850. doi:10.6038/cjg2018L0376
Tang, J.-T., Xu, Z.-M., and Xiao, X. (2012). Effect rules of strong noise on magnetotelluric (mt) sounding in the luzong ore cluster area. Chinese J. Geophys. 55, 4147–4159.
Varentsov, I. M., Sokolova, E. Y., and Martanus, E. R. (2003). System of electromagnetic field transfer operators for the bear array of simultaneous soundings: methods and results. Izvestiya Physics of the solid earth39, 118–148.
Wang, Y., Guo, R., Liu, J., Li, J., Liu, R., Chen, H., et al. (2024). A divergence free vector finite element method for efficient 3d magnetotelluric forward modeling. Geophysics 89, E1–E11. doi:10.1190/geo2023-0037.1
Xu, Z. M., Tang, J. T., and Qiang, J. K. (2012). An analysis of the magnetotelluric strong interference types in ore concentration areas. Geophysical and Geochemical Exploration 36, 214–219.
Yang, B., Lin, W., Hu, X., Fang, H., Qiu, G., and Wang, G. (2021a). The magma system beneath changbaishan-tianchi volcano, China north korea: constraints from three-dimensional magnetotelluric imaging. Journal of Volcanology and Geothermal Research 419, 107385. doi:10.1016/j.jvolgeores.2021.107385
Yang, B., Zhao, H., Chi, H., and Yang, S. (2021b). Wideband Doppler frequency shift measurement and direction discrimination based on optical single sideband modulation with a fixed low-frequency reference signal. Optics Communications 499, 127306. doi:10.1016/j.optcom.2021.127306
Yu, N., Wang, E., Wang, X., Kong, W., Li, D., and Li, R. (2022). The influence of the ailaoshan-red river shear zone on the mineralization of the beiya deposit on the southeastern margin of the Tibetan plateau revealed by a 3-d magnetotelluric survey. Journal of Geophysical Research Solid Earth 127. doi:10.1029/2021jb022923
Zhang, Y., Wang, P., and Chen, X. (2022). Magnetotellunc time series processing in strong interference environment. Seismology and Geology 44, 786–801.
Keywords: magnetotelluric, geothermal, electromagnetic noise, automatic clustering method, data processing
Citation: Guo R, Xue P, Liu J, Wang Y, Tian S, Li J and Xue W (2024) Natural source electromagnetic survey for geothermal application in industrial area with strong electromagnetic noise. Front. Energy Res. 12:1298841. doi: 10.3389/fenrg.2024.1298841
Received: 22 September 2023; Accepted: 26 January 2024;
Published: 12 February 2024.
Edited by:
Xiao Luo, Hunan University, ChinaReviewed by:
Nannan Zhou, Chinese Academy of Sciences (CAS), ChinaHongzhu Cai, China University of Geosciences Wuhan, China
Copyright © 2024 Guo, Xue, Liu, Wang, Tian, Li and Xue. This is an open-access article distributed under the terms of the Creative Commons Attribution License (CC BY). The use, distribution or reproduction in other forums is permitted, provided the original author(s) and the copyright owner(s) are credited and that the original publication in this journal is cited, in accordance with accepted academic practice. No use, distribution or reproduction is permitted which does not comply with these terms.
*Correspondence: Yongfei Wang, yongfeiwangyfw@163.com; Wei Xue, xuewei90210@163.com