Numerical investigation on the exhaust gas combustion of an SOFC in a catalytic multichannel burner
 Yao Yanyi
 Yang Weijuan
 - State Key Laboratory of Clean Energy Utilization, Institute for Thermal Power Engineering, Zhejiang University, Hangzhou, Zhejiang, China
The utilization of the exhaust gas of a solid oxide fuel cell is important to improve the energy efficiency and control pollutant emission. In this work, the combustion of solid oxide fuel cell exhaust gas (H2/CO) in a honeycomb ceramic catalytic burner is investigated numerically. A 2D numerical combustion model with 17 channels is built to analyze the influence of channel position on thermal performance and combustion characteristics. The high burnout of H2 and CO is obtained as 96.75% and 97.75%, respectively. The channels can be divided into three groups from the inside to the outside as follows: part 1, from the 9th channel to the 13th channel; part 2, from the 14th channel to the 16th channel; and part 3, the 17th channel. The channels in the same group presented the same results of flow, temperature, and combustion. Compared with the other channels, the outermost channel shows notable differences in depressing the temperature of the whole channel, moving the maximum temperature downstream, enlarging the temperature bias of the lower and upper walls, and enlarging the combustion zone. H2 and CO perform different combustion processes in the honeycomb ceramic catalytic burner. Compared with H2, the initial position of CO conversion is more affected by channel distribution. In the 17th channel, the CO oxidation rate is controlled mostly by the slower oxygen adsorption and the resulting low O(s) coverage. In the 9th channel, the CO oxidation rate is controlled mostly by the wall temperature and fuel-limited. The burnout rate of H2 changes from 95% to 99.9% with the channel position, but the burnout of CO varies little. The closer the channel to the outer wall, the higher the proportion of heterogeneous reaction and the more the generated heat. The generated heat by the channel can present a diversity of 4%.
1 Introduction
Among various high-efficiency energy generation technologies, fuel cells have received increasing attention as an efficient clean energy conversion device. The solid oxide fuel cell (SOFC) is a third-generation fuel cell system with high energy conversion efficiency, good fuel adaptability, energy saving potential, and ecofriendly nature (Choudhury et al., 2013; Sharaf and Orhan, 2014; An-Na et al., 2015). An SOFC can directly convert chemical energy in biomass into electrical energy, and it has broad application prospects in both large and small energy generation systems (Din and Zainal, 2016; Papurello et al., 2022).
Therefore, there are some studies on the structure and working characteristics of SOFC systems, mainly focusing on the SOFC reformer and stack parts, as well as the fuel utilization rate and preheating temperature of the SOFC systems. As for the exploration of the operating conditions of the SOFC systems, by recovering the exhaust gas after SOFC, Yen et al. (2010) experimentally explored that the optimal after-burner operation is obtained when using an anode off-gas temperature of 650°C, a cathode off-gas temperature of 390°C, a flame barrier temperature of 700°C, an excess air ratio of 2, and a fuel utilization of 0.6. Cordiner et al. (2007) achieved successful operation with good system efficiency by coupling the biomass reformer with an SOFC and explored the impact of operating conditions on fuel cell performance. Danylo et al. (2018) established an SOFC–gas turbine hybrid power generator testbed to explore the impact of fuel utilization in fuel cells on system efficiency and system performance. The results showed that the system can achieve greater than 70% power generation efficiency in the range of fuel utilization of 60%–90%. Menon et al. (2015) numerically studied the effects of various operating conditions on temperature distribution, material transport, and electrochemistry in the battery, and they found that the increase in inlet speed resulted in lower fuel utilization and efficiency. Yu et al. (2010) experimentally studied the combustion characteristic of the exhaust gas of high-temperature fuel cells using the catalytic combustion method. The gas flow characteristics and combustion stability in the combustion chamber have been studied, along with the effects of flow rate, preheating temperature, and other parameters, which provide a reference for the design of a suitable catalytic burner.
However, in the simulation and experiment of the SOFC system, it can be found that the SOFC has certain deficiencies in the emission and effective utilization of exhaust gases. The SOFC generally works at a high temperature of 600–1,000°C (Xue et al., 2005), and the exhaust gas contains much heat although the exhaust components differ greatly in different operating stages and under different reaction conditions (Rokni, 2012; Pianko-Oprych and Jaworski, 2017). Direct emission of the exhaust gas will cause considerable energy loss and environmental pollution (Hoque et al., 2012). The anode off-gas does not only include a high concentration of water vapor but also includes a small portion of CO and H2, lowering the fuel utilization rate of the SOFC system notably (Yu et al., 2010). Ji et al. (2021) studied the feasibility and method of applying commercial three-way catalysts to SOFC tail gas (7.9% H2, 4.7% CO, 29.4% CO2, 1% N2, 7.9% O2, and 49.1% steam) treatment. Considering the heat in the exhaust gas and the full use of combustible components, it is necessary to further use the SOFC exhaust gas and recover the chemical energy and heat energy. Then, the energy utilization efficiency of the SOFC system is greatly improved, and the emission of pollutants is reduced, which is of great significance to the promotion and application of the SOFC (Chen et al., 2020).
In the process of the SOFC exhaust gas treatment, the exhaust gas has low calorific value and low concentration of combustible components, which brings some difficulties to stable combustion. It is necessary to consider the use of special burners to overcome these difficulties. Ghang et al. (2012) explored that if the heat from the combustion of the SOFC exhaust gas can be supplied directly to the steam reformer with a coupled heat-exchanging reactor, the resultant system can be more compact, and heat transfer can be more efficient. Wang et al. (2020) proposed a solid oxide fuel cell–gas turbine hybrid system combined with anode and combustor exhaust recirculation loops, and the results show that the anode recycle loop can increase the electrical efficiency of the hybrid system and reduce the SOFC temperature gradient. Porous medium burners with good structural characteristics can achieve better heat exchange, thereby broadening the limit of the lean flammability and achieving the effect of stabilized combustion, which will be an effective way for solving the SOFC exhaust gas problem. Dai et al. (2018) explored the combustion characteristics of methane in low concentrations in porous media burners by establishing a two-dimensional (2D) numerical model of porous media burners. Shafiey Dehaj and Arab Solghar (2019) conducted experiments and numerical simulations of natural gas combustion in a three-region porous media burner. The use of porous media significantly improved the thermal efficiency of the burner. Wang et al. (2014) studied the combustion characteristics of methane in porous media burners by changing the catalyst parameters and obtained the temperature changes before and after using porous media burners. Al-Attab et al. (2015) developed porous media burners for biomass gas with heat recovery devices and achieved a maximum heat recovery efficiency of approximately 93% and a total system efficiency of 54%. Shafiey Dehaj et al. (2017) tested a new porous media burner containing a heat exchanger and studied temperature changes, polluting gases, and influencing factors. In the studies above, in some cases, the partially depleted O2 cathodic air is used as an oxidizer, and the cathodic off-gas has more or less the same temperature as the anodic fuel-containing stream (Yen et al., 2010). In other cases, the oxidizer is provided partially by the cathodic air and partially by the external O2 separation unit. In this work, the oxidizer is provided fully by the O2 separation unit, and the mixture temperature (548 K) is far lower than the anode exhaust gas temperature (650°C).
In summary, porous media burners present good performance in stabilizing combustion and enhancing combustion efficiency. This work is focused on the combustion of the SOFC exhaust gas in a honeycomb media catalytic burner. The numerical research studies are carried out using a 2D numerical combustion model of the catalytic honeycomb ceramic burner with 17 channels. The combustion performance of the combustible components (H2 and CO) of the SOFC exhaust gas is achieved. Moreover, the special contribution and individuality of every channel are focused on and compared with the others.
2 Materials and methods
2.1 Experimental setting
Generally, in the exhaust gas of the SOFC anode, the proportion of combustible components (H2 and CO) is low, while the proportion of H2O and CO2 is high. Moreover, there is still a small amount of N2. The components of the exhaust gas of the SOFC from our earlier work (Ji et al., 2021) are shown in Table 1, and the lower calorific value and gaseous hourly space velocity (GHSV) are 2.725 MJ·m-3 and 90,000 h-1, respectively, which also provide the inlet conditions of the burner. The fuel/oxygen equivalence ratio (Φ) is 0.8, the temperature of the inlet mixture (Tin) is 548 K, and a uniform velocity profile is used at the inlet with a velocity (vin) of 0.25 m·s-1. Figure 1 depicts the experimental setting of exhaust gas combustion in the catalytic multichannel burner shown in Figure 2. The honeycomb ceramic catalyst is prepared by the impregnation method using cordierite honeycomb and chloroplatinic acid. The preparation process and the catalyst properties are given in the work of Yang et al. (2017). H2, CO, CO2, N2, O2, and steam are premixed in the main pipeline and tube furnace (Thermo Scientific TF55035KC-1), and then, fully mixed and preheated reactants can be supplied to the burner. An electric spark generator (Delta GS-HHJJ) is used to ignite the mixture gas, after which flame is regularly stabilized in the chamber. The thermocouple (WRNK-191) is chosen to measure the maximum combustion temperature of the honeycomb ceramic burner (Tmax), and the FLIR thermal imager (FLIR S65) is chosen to measure the wall temperature of the burner (Twall). The species distribution of the outlet mixture is measured with the gas chromatograph (Agilent 7890B).

TABLE 1. Mole fraction and inlet conditions of the mixture.
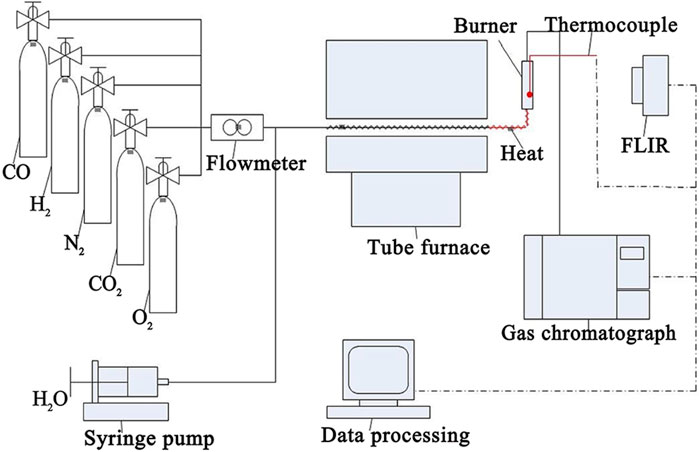
FIGURE 1. Experimental setting.
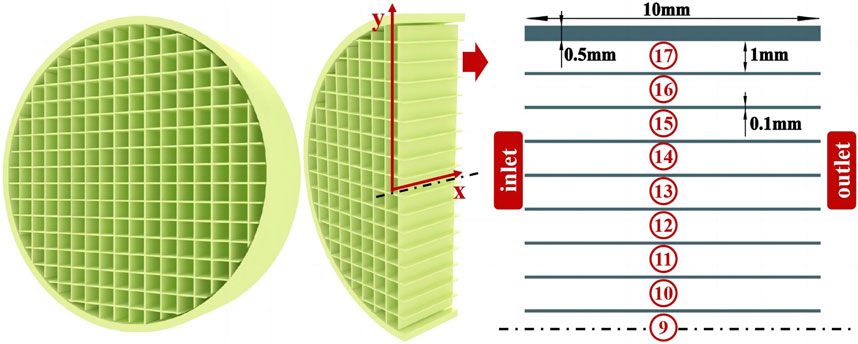
FIGURE 2. Physical model of the catalytic multichannel burner.
2.2 Physical object
Figure 2 presents the instruction diagram of the catalytic multichannel burner made by honeycomb ceramic. The burner is characterized by many micro-channels with catalytic walls. The burner has a total length of 10 mm and a diameter of 19.6 mm with 17 channels. The wall thickness of the whole burner is 0.5 mm. The diameter of every single channel is 1 mm, and the channel wall has a thickness of 0.1 mm. To further study the flow field, temperature field, and reaction process in the burner, a 2D geometric burner model is built, according to the previous experimental conditions. The channels are named as the 17th CL ∼ 9th CL from the outside to the inside. The premixed and preheated H2/CO/O2/H2O/CO2 enters from the inlet and then undergoes combustion with the action of the honeycomb ceramic catalyst. Part of the released heat is emitted through the outer burner wall by radiation and convection.
2.3 Mathematical model
Using the commercial CFD code FLUENT, the mass, momentum, energy, and heat transfer are simulated in a 2D simulation model. To match the different surface-to-volume ratios of the true 3D and simulated 2D reactors, the active surface area of the catalyst was adjusted in the simulations. The Knudsen number is less than the critical value of 0.001 in these cases. Thus, the continuous model and no-slip conditions are appropriate, and the Navier–Stokes equations are still applicable. The laminar model is used because of the low Reynolds number (Re = 14.11 based on a velocity of 0.25 m·s-1). A first-order up-wind scheme is used to discretize the convective terms in steady mass, momentum, energy, and species equations, while second-order central differencing schemes are used to discretize the diffusion terms. The pressure–velocity coupling is treated using the SIMPLE algorithm. The specific heat of species is calculated using a piecewise polynomial fitting method. The specific heat of the mixture is calculated using the mixing law, and the mixture gas density is calculated using the ideal gas law. The thermal conductivity and viscosity are calculated as a mass-fraction-weighted average of all species, and species diffusion velocities are computed by mixture average diffusion, including thermal diffusion (Zheng et al., 2014; Arumugam and Mantzaras, 2023). Convergence of simulation is guaranteed based on the residuals of all governing equations to be less than 10–6.
The boundary conditions of the inlet and outlet are set as velocity inlet and pressure outlet, respectively. The discrete ordinate (DO) model is used to compute the radiation at inner surfaces, and the emissivity of the cordierite honeycomb (ε) is 0.92 (Zhang H et al., 2022). The thermal condition of the outer wall is set as the convection boundary condition, and the thermal conductivity of the wall is taken to be 30 W·m-1·K−1. Adiabatic boundary conditions are used for the head and end faces of the wall.
A detailed gas-phase reaction mechanism, containing 12 species and 30 reversible elementary reactions (Yang and Pope, 1998; Rieger et al., 2015; Turkeli-Ramadan et al., 2015), is used in the computation mode. A detailed surface chemistry mechanism for CO and H2 oxidation over Pt is taken from the work of Deutschmann et al. (2000). It contains 21 irreversible elementary reactions with 8 gaseous and 11 surface species.
2.4 Grid independence and data validation
To assure grid independence, a mesh sensitivity analysis is performed with (i) 158,924; (ii) 243,211; and (iii) 326,136 grids. The temperature and CO mole distributions at the centerline with different mesh densities are shown in Figure 3. It can be seen that (ii) 243,211 cells are adequate to represent combustion inside the honeycomb ceramic, while more cells do not introduce any significant difference. To save computational time and satisfy the precision requirement, the optimized grid with (ii) 243,211 cells is used in the computational domain, and the minimum area of a single grid is 10 μm2.
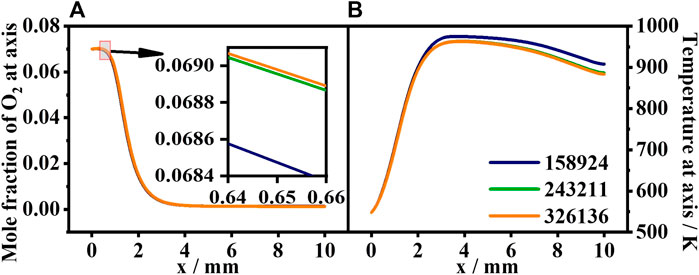
FIGURE 3. Grid independence verification of the numerical simulation. (A) CO mole fraction along the centerline. (B) Temperature along the centerline with different mesh densities.
The average wall temperature (Twall), maximum combustion temperature (Tmax), and burnout rate of CO and H2 are compared with the experimental results in Table 2, and a comparison of the wall temperature between the experiment and simulation results is shown in Figure 4. The average relative error (δ) is smaller than 5%, and the simulation results follow the same trend as the experiment results. In summary, the present numerical algorithm and boundary conditions are reasonable and accurate to simulate honeycomb ceramic combustion.
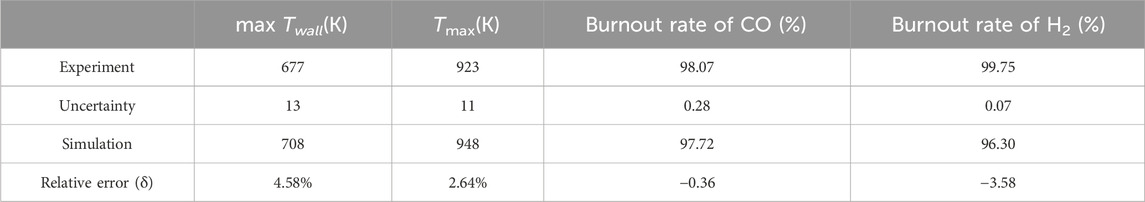
TABLE 2. Comparison of results between the experiment and simulation.
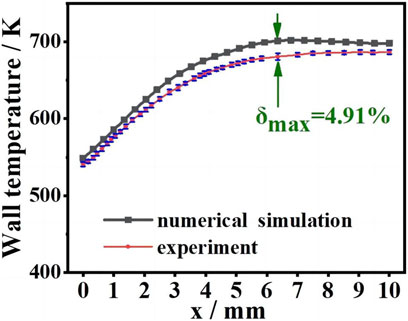
FIGURE 4. Comparison of the wall temperature between the experiment and simulation results.
3 Results and discussion
3.1 Thermal performance
Figure 5A shows the contours of the pressure field in the catalytic honeycomb ceramic burner. The outlet pressure of different channels is the same because of the pressure outlet boundary condition. On the contrary, the pressure at the inlet varies due to different temperature and mixture density distributions at different channels. Pressure drop at the centerline of each channel is shown in Figure 5B. We divide the nine channels of the computing area into three parts from the inside to the outside: part 1, from the 9th CL (channel) to the 13th CL, the pressure drop is basically the same (approximately 1.8Pa); part 2, from the 14th CL to the 16th CL, the pressure drop decreases gradually; and part 3, the 17th CL, the pressure drop is significantly decreased to a minimum (1.3Pa). The pressure drop of part 3 is only 72% of part 1, which means that the outer channel presents a notable lower flow resistance.

FIGURE 5. Pressure field of each channel (A) and pressure drop at the centerline (B).
Figure 6A shows the contours of the y-direction flow of the mixture in each channel. The reaction starts near the inner wall, causing the mixture to flow longitudinally from the axis to the wall. The flow contours of the 9th ∼ 14th CL show that the mixture flow is symmetrical before x < 3.5 mm, but the symmetry of the 15th ∼ 17th CL is destroyed. In the latter, the upward zone (y-velocity >0) is strong and occupies the main channel, and a downward zone (y-velocity <0) appears and tends a long distance as a compensation at the downstream of the upward zone. Along the x-direction centerline of each channel, there is an inflexion point where the y-velocity equals to 0 and the flow direction changes downstream. The inflexion points are shown as red points in Figures 6A, B, which show the x-direction position of the inflexion points of each channel (x0v). In part 1 (9th ∼14th CL), x0v remains unchanged at 1.2 mm with different channels, and the flow exhibits good symmetry. In part 2 (15th ∼ 16th CL), x0v increases and is bigger than in part 1, and the asymmetry of the flow field appears near the inflexion point. In part 3 (17th CL), x0v reaches up to 2.5 mm, and the asymmetrical flow occupies the main part of the channel.
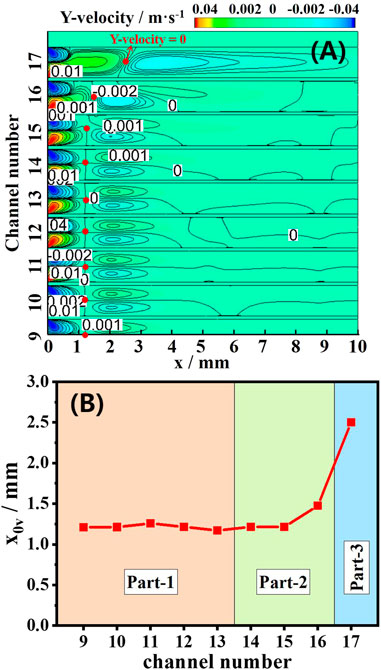
FIGURE 6. Computed contours of the y-velocity field (A). The corresponding x-direction position when the y-velocity at the centerline of each channel is 0 (B).
Figures 7–9 show the temperature results of the catalytic honeycomb ceramic burner and each channel. Figure 7 shows the temperature field contours, Figure 8A shows the temperature of the centerline of each channel, Figures 8B, C show the temperatures of the upper wall and lower wall of each channel, and Figure 9 presents the maximum temperatures and their x-direction positions, in which Twu, Tc, and Twl are the maximum temperatures at the upper wall, centerline, and lower wall, respectively, while xwu, xc, and xwl are the x-direction positions of Twu, Tc, and Twl, respectively. In part 1, the temperature in each channel is similar, while in parts 2 and 3, the high-temperature zone with red color decreases, especially the 17th CL. In part 1, Twu and Twl show little difference, and xwu and xwl of each channel are basically the same with a value of 3 mm, which is smaller than xc with a value of 4 mm. From the comparison of the Twu, Twl, and Tc, in part 1, the maximum temperature with a value of 948 K is not affected by the channel position. While, in part 2, Twu, Twl, and Tc decrease from the inside to the outside, Twl is greater than Twu, which means some heat is transferred from the inside channel to the outside channel. The bias of Twl and Twu becomes the maximum of 190 K in part 3, which mainly results from the heat loss to the atmosphere of 463 W. Summarily, heat loss has the greatest effects on the part 3 channel by depressing the temperature of the whole channel, moving the maximum temperature downstream, and enlarging the temperature bias of the lower and upper walls. As to the part 2 channels, the closer to the outside, the larger the effects by heat loss. In the center of the burner, the part 1 channels show little differences due to the little heat loss.
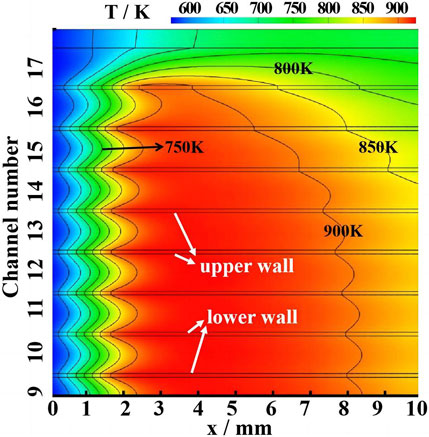
FIGURE 7. Contours of the temperature field.
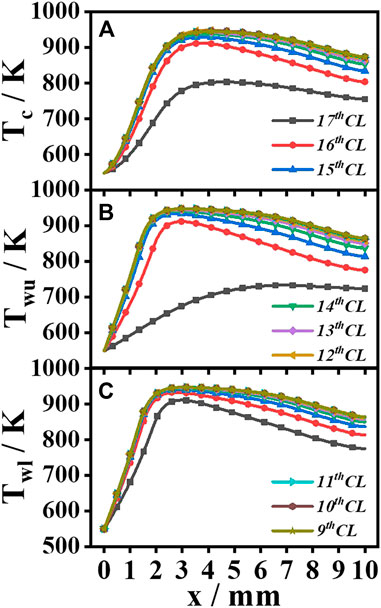
FIGURE 8. Temperature distribution along the centerline (A), upper wall (B), and lower wall (C) of each channel.
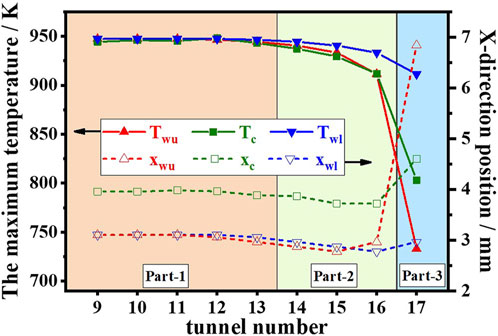
FIGURE 9. The maximum temperature and its corresponding x-direction position of each channel.
3.2 Combustion characteristics
To further understand the effects of internal channel distribution on combustion characteristics, the contours of H2 and CO mass fractions are studied, as shown in Figure 10. According to the gradient changes in H2 and CO mass fractions, the initial position of the fuel reaction is greatly affected by the channel distribution. In part 1, H2 conversion starts first at the inlet, the heat release by the wall reaction increases the mixture temperature, and then, CO conversion starts at x = 1 mm, further back than H2. In part 2, especially in part 3, CO conversion starts at the rear position compared with part 1, while the initial position of H2 conversion is less affected by the channel distribution. Mole fractions of H2 and CO along the upper wall of the 9th CL and the 17th CL are shown in Figure 11. With a higher wall temperature of 550 K–960 K in the 9th CL, compared to 550 K–720 K in the 17th CL, H2 and CO consumption in the upper wall of the 9th CL is faster than that of the 17th CL, due to the combined effects of higher reactivity and higher molecular diffusivity. Compared with H2, the initial position of CO conversion is more affected by the channel distribution, with the initial position at x = 1 mm in the 9th CL and x = 2 mm in the 17th CL.
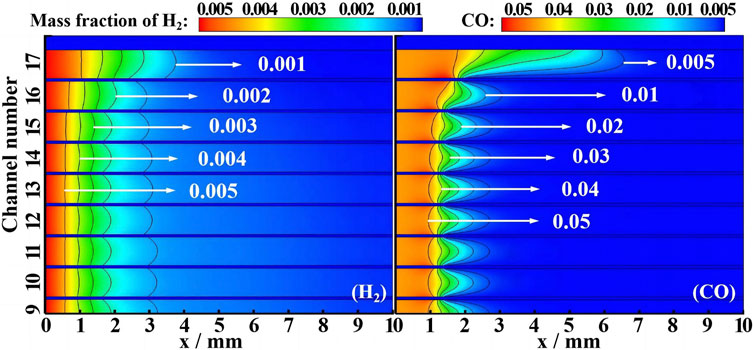
FIGURE 10. Computed contours of H2 and CO mass fraction.
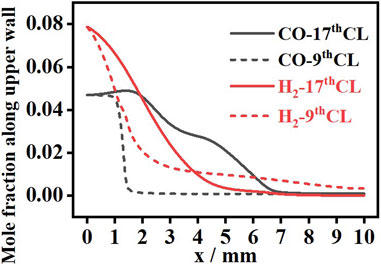
FIGURE 11. Mole fraction of H2 and CO along the upper wall of the 9th CL and 17th CL.
Figure 12 provides the surface coverage and wall temperature at the upper wall in the 9th CL (dashed lines) and the 17th CL (solid lines). In the 17th CL, the wall temperature is low (550 K ∼ 720 K), and the CO oxidation rate is controlled mostly by the slower oxygen adsorption and the resulting low O(s) coverage. Adsorption of CO is favored against desorption at low temperature, and CO was more favorably adsorbed than O2, leading to the dominant CO(s) coverage far upstream the wall (Engel and Ertl, 1979; Kasemo and Trnqvist, 1980; Tieber et al., 1997). H2 conversion increases the wall temperatures further downstream, O2 adsorption is promoted, and this, in turn, accelerated CO oxidation, as seen by the drop in CO(s) and associated increase in O(s) coverage after x = 5 mm. In the 9th CL, the wall temperature is high (550 K ∼ 960 K), and the CO oxidation rate is controlled mostly by the wall temperature and fuel-limited. Over the region x < 1 mm, H2 competed with CO for adsorption sites, and furthermore, its surface oxidation efficiently consumed surface oxygen, thus hindering CO(s) oxidation. The latter was attested by the slow decrease in the CO(s) surface coverage and basically unchanged O(s) surface coverage. Over the region x > 1 mm, the steady increase in the O2 supply with further temperature increase (over 800 K) (Zheng et al., 2014) provided sufficient O2 for CO oxidation, leading to the increase in O(s) and drop in CO(s).
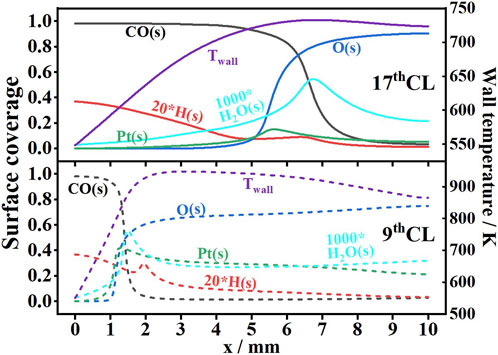
FIGURE 12. Surface coverage and wall temperature along the upper wall of the 9th CL and 17th CL.
Compared with the work by Arumugam and Mantzaras (2023) (which constitutes the first detailed catalytic and gas chemistry 2D channel simulations of SOFC off-gases), there are some different behaviors in this work:
(i) Strong homogeneous combustion is present in the former, while in the latter, homogeneous combustion is largely absent. Zhang Y et al. (2022) showed that the homogeneous reaction self-ignition is affected by the inlet temperature, inlet velocity, and inlet equivalence ratio of the mixture. When the inlet temperature is lower than 500 K, the homogeneous reaction cannot self-ignite. In this work, the mixture inlet temperature, inlet velocity, and equivalence ratio are 548 K, 0.25 m/s, and 0.8, respectively, lower than 1073 K, 1 m/s, and 0.9, respectively, in Arumugam’s work. Low inlet temperature and low fuel consumption weaken the catalytic reaction, releasing less reaction heat and free radicals, which is not conducive to the self-ignition of homogeneous reactions.
(ii) Arumugam’s work has higher H2 and CO conversions (98.983% and 99.954%, respectively) compared to this paper (96.30% and 97.72%, respectively) because high inlet temperature (1073 K in the former and 548 K in the latter), leading to high wall temperature (1,350–1,500 K in the former and 720–960 K in the latter), can heat the incoming flow and increase the fuel consumption and reaction rate (Lu et al., 2022).
(iii) In this work, at the 9th channel, H2 consumption is inhibited and is slower than CO consumption because CO inhibits the catalytic conversion of hydrogen as the wall temperature is lower than 700 K (Mantzaras, 2008). The main surface coverage is CO(s), greatly reducing the O(s) and free sites. On the other hand, with wall temperature higher than 700 K, H2 consumption is mainly inhibited by water. With the range of 700–850 K of surface temperature, the fraction of the water vacancy site is high (Geng, 2015), leading to higher surface coverage for H2O(s), OH(s), and H(s). As shown in Figure 12, when 1 mm < x < 2 mm, the wall temperature increases from 700 K to 900 K, and the surface coverage for H2O(s) increases, leading to an increase in H(s) surface coverage at x = 2 mm. The higher H(s), in turn, favored the recombinative desorption of H(s) (2H(s) + Pt(s) → H2) and, hence, slowed down the consumption of H2.
Figure 13A shows the residual rate distribution of H2/CO at the outlet in different channels. The burnout of CO is less affected by the channel position, compared with H2. In addition to the 15th ∼ 17th CL, the residual rate of CO at the outlet in different channels changes within a narrow range, and the average value is nearly stable at 2.25%. Moreover, at the exit of each individual channel, the longitudinal distribution of the CO residual rate is basically unchanged; that is, there is no significant difference between the distribution near the wall and the center. In contrast, the burnout of H2 is greatly affected by the channel position. From the 9th to 17th CL, the residual rate of H2 at the outlet in different channels has markedly changed from 5% to 0.1%, and the average value is near 3.25%. Moreover, at the exit of each individual channel, the H2 residual rate along the longitudinal distribution changes significantly; that is, the H2 near the wall is significantly smaller than that at the centerline.
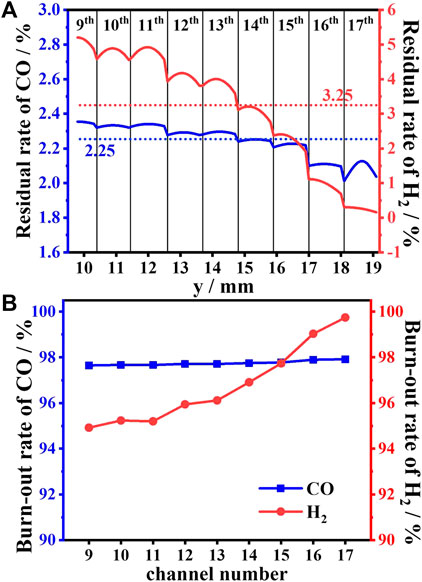
FIGURE 13. Residual rate distribution at the outlet (A) and the burnout rate (B) of H2/CO in different channels.
Figure 13B shows the burnout rate of H2/CO in different channels. The burnout rate of CO in all channels almost keeps the same value of 97.75%, which implies that the burnout of CO is not affected by the channel position. Conversely, the burnout of H2 is greatly affected by the channel position. From the 9th CL to 17th CL, the burnout rate of H2 increases from 95% to 99%, which implies that the outer channel performs better on the H2 burnout.
Supplementary Figure S1 compares the heat generation of the heterogeneous reaction (HTR) and homogeneous reaction (HR) in every channel, in which QHTR and QHR are the heat released by the HTR and HR, respectively; SHTR is the proportion of HTR heat to total heat production; and AHTR is the proportion of heat production to average heat production. In the whole burner, the proportion of QHTR and QHR to the total heat is 98.94% and 1.06%, respectively, which implies that the fuel combustion in the burner is dominated by the HTR. QHTR and SHTR increase as the channel position moves outward. The closer the channel position to the outer wall, the more the heat generated by the HTR and the less the heat generated by the HR. AHTR increases from 98.2% to 103% as the channel position moves from the center to the outside. The closer the channel position is to the outer wall, the more is the heat generated by the single channel. The generated heat by the channels can present a difference of approximately 4%, according to the diversity of AHTR.
4 Conclusion
In conclusion, the catalytic combustion of premixed H2/CO/O2 in honeycomb ceramic is numerically studied to discover the combustion characteristics of the SOFC exhaust gas. A 2D numerical combustion model with 17 channels is built to analyze the influence of the channel distribution. The following conclusions can be drawn from the present investigation:
(i) The honeycomb ceramic catalytic burner with 17 channels obtains good burnout of H2 and CO with the efficiency of 96.75% and 97.75%, respectively. The channels of the honeycomb ceramic catalytic burner perform differently due to their positions, and they can be divided into three groups from the inside to the outside: part 1, from the 9th channel to the 13th channel; part 2, from the 14th channel to the 16th channel; and part 3, the 17th channel. The channels in the same group present the same in the view of flow, temperature, and combustion.
(ii) Compared with the other channels, the part 3 channel shows notable differences in the view of depressing the temperature of the whole channel, moving the maximum temperature downstream, and enlarging the temperature bias of the lower and upper walls. It is dominated by the outermost position, and a heat loss of 463 W to the atmosphere presents the greatest effect on it.
(iii) H2 and CO perform different combustion processes in the honeycomb ceramic catalytic burner. Compared with H2, the initial position of CO conversion is more affected by the channel distribution. In the 17th channel, the CO oxidation rate is controlled mostly by the slower oxygen adsorption and the resulting low O(s) coverage. In the 9th channel, the CO oxidation rate is controlled mostly by the wall temperature and fuel-limited. The burnout rate of H2 shows notables difference from 95% to 99.9% with the channel position, but the burnout of CO varies little.
(iv) The combustion in the honeycomb ceramic catalytic burner is dominated by the heterogeneous reaction, and the proportion is 98.94%. The closer the channel is to the outside, the greater is the proportion of HTR and the more is the generated heat. The generated heat by the channel can present a diversity of 4%.
Data availability statement
The raw data supporting the conclusion of this article will be made available by the authors, without undue reservation.
Author contributions
YY: writing–original draft and writing–review and editing. YW: writing–review and editing. CJ: writing–review and editing. ZX: writing–review and editing. ZJ: writing–review and editing.
Funding
The authors declare that no financial support was received for the research, authorship, and/or publication of this article.
Acknowledgments
The authors gratefully acknowledge the support of the National Natural Science Foundation of China (51976186).
Conflict of interest
The authors declare that the research was conducted in the absence of any commercial or financial relationships that could be construed as a potential conflict of interest.
Publisher’s note
All claims expressed in this article are solely those of the authors and do not necessarily represent those of their affiliated organizations, or those of the publisher, the editors, and the reviewers. Any product that may be evaluated in this article, or claim that may be made by its manufacturer, is not guaranteed or endorsed by the publisher.
References
Al-Attab, K. A., Ho, J. C., and Zainal, Z. A. (2015). Experimental investigation of submerged flame in packed bed porous media burner fueled by low heating value producer gas. Exp. Therm. Fluid Sci. 62, 1–8. doi:10.1016/j.expthermflusci.2014.11.007
An-Na, D., Lin-Feng, X. U., and An-Ze, S. (2015). Research progress of solid oxide fuel cell. Bull. Chin. Ceram. Soc. 34 (S1), 234–238. doi:10.16552/j.cnki.issn1001-1625.2015.s1.058
Arumugam, V. K., and Mantzaras, J. (2023). Heterogeneous and combined heterogeneous/homogeneous combustion modeling of SOFC off-gases. J. Phys. Chem. A 127 (1), 316–328. doi:10.1021/acs.jpca.2c07049
Chen, Z., Guo, S., and Qin, C. (2020). Experimental research on porous media combustion of SOFC exhaust gas. Case Stud. Therm. Eng. 22, 100796. doi:10.1016/j.csite.2020.100796
Choudhury, A., Chandra, H., and Arora, A. (2013). Application of solid oxide fuel cell technology for power generation: a review. Renew. Sustain. Energy Rev. 20, 430–442. doi:10.1016/j.rser.2012.11.031
Cordiner, S., Feola, M., Mulone, V., and Romanelli, F. (2007). Analysis of a SOFC energy generation system fuelled with biomass reformate. Appl. Therm. Eng. 27 (4), 738–747. doi:10.1016/j.applthermaleng.2006.10.015
Dai, H., Zhao, Q., Lin, B., He, S., Chen, X., Zhang, Y., et al. (2018). Premixed combustion of low-concentration coal mine methane with water vapor addition in a two-section porous media burner. Fuel 213, 72–82. doi:10.1016/j.fuel.2017.09.123
Danylo, O., Farida, H. N., David, T., Bryden, K. M., and Lawrence, S. (2018). Fuel utilization effects on system efficiency in solid oxide fuel cell gas turbine hybrid systems. Appl. Energy 228, 1953–1965. doi:10.1016/j.apenergy.2018.07.004
Deutschmann, O., Maier, L. I., Riedel, U., Stroemman, A. H., and Dibble, R. W. (2000). Hydrogen assisted catalytic combustion of methane on platinum. Catal. Today 59 (1), 141–150. doi:10.1016/s0920-5861(00)00279-0
Din, Z. U., and Zainal, Z. A. (2016). Biomass integrated gasification-sofc systems: technology overview. Renew. Sustain. energy Rev. 53, 1356–1376. doi:10.1016/j.rser.2015.09.013
Engel, T., and Ertl, G. (1979). Elementary steps in the catalytic oxidation of carbon monoxide on platinum metals. Adv. Catal. 28, 1–78. doi:10.1016/s0360-0564(08)60133-9
Geng, X. (2015). Low concentration synthesis gas catalytic combustion experiment analysis. Master thesis.
Ghang, T. G., Lee, S. M., Ahn, K. Y., and Kim, Y. (2012). An experimental study on the reaction characteristics of a coupled reactor with a catalytic combustor and a steam reformer for SOFC systems. Int. J. Hydrogen Energy 37 (4), 3234–3241. doi:10.1016/j.ijhydene.2011.11.076
Hoque, M. A., Lee, S. B., Park, N. K., and Kim, K. (2012). Pd–Pt bimetallic catalysts for combustion of SOFC stack flue gas. Catal. Today 185 (1), 66–72. doi:10.1016/j.cattod.2011.08.023
Ji, M. Z., Lee, D. J., Gong, S. Q., Yao, Y. Y., Huang, F., Zhou, W. H., et al. (2021). Catalytic combustion characteristics of SOFC exhaust gas. J. Combust. Sci. Technol. 27 (2), 201–207. doi:10.11715/rskxjs.R202005027
Kasemo, B., and Trnqvist, E. (1980). Weighing fractions of monolayers: application to the adsorption and catalytic reactions of h2, co, and o2 on pt. Phys. Rev. Lett. 44 (23), 1555–1558. doi:10.1103/physrevlett.44.1555
Lu, Q., Gou, J., Pan, J., Wang, Y., Zhang, Y., Zhu, J., et al. (2022). Comparison of the effect of heat release and products from heterogeneous reaction on homogeneous combustion of H2/O2 mixture in the catalytic micro combustor. Int. J. Hydrogen Energy 44 (59), 31557–31566. doi:10.1016/j.ijhydene.2019.10.040
Mantzaras, J. (2008). Catalytic combustion of syngas. Combust. Sci. Technol. 180 (6), 1137–1168. doi:10.1080/00102200801963342
Menon, V., Banerjee, A., Dailly, J., and Deutschmann, O. (2015). Numerical analysis of mass and heat transport in proton-conducting SOFCs with direct internal reforming. Appl. Energy 149, 161–175. doi:10.1016/j.apenergy.2015.03.037
Papurello, D., Canuto, D., and Santarelli, M. (2022). CFD model for tubular SOFC stack fed directly by biomass. Int. J. hydrogen energy 47 (10), 6860–6872. doi:10.1016/j.ijhydene.2021.12.015
Pianko-Oprych, P., and Jaworski, Z. (2017). Numerical investigation of a novel burner to combust anode exhaust gases of sofc stacks. Pol. J. Chem. Technol. 19 (3), 20–26. doi:10.1515/pjct-2017-0043
Rieger, J., Weiss, C., and Rummer, B. (2015). Modelling and control of pollutant formation in blast stoves. J. Clean. Prod. 88, 254–261. doi:10.1016/j.jclepro.2014.07.028
Rokni, O. (2012). Thermodynamic investigation of an integrated gasification plant with solid oxide fuel cell and steam cycles. Green 2 (2-3), 71–86. doi:10.1515/green-2011-0022
Shafiey Dehaj, M., and Arab Solghar, A. (2019). Study of natural gas/air combustion in the three-region porous medium burner. J. Braz. Soc. Mech. Sci. Eng. 41 (3), 137. doi:10.1007/s40430-019-1637-7
Shafiey Dehaj, M., Ebrahimi, R., Shams, M., and Farzaneh, M. (2017). Experimental analysis of natural gas combustion in a porous burner. Exp. Therm. Fluid Sci. 84, 134–143. doi:10.1016/j.expthermflusci.2017.01.023
Sharaf, O. Z., and Orhan, M. F. (2014). An overview of fuel cell technology: fundamentals and applications. Renew. Sustain. Energy Rev. 32, 810–853. doi:10.1016/j.rser.2014.01.012
Tieber, W., Athenstaedt, W., and Leisch, M. (1997). 3d-atom-probe study of oxygen-adsorption on stepped platinum surfaces. Fresenius J. Anal. Chem. 358 (1-2), 116–118. doi:10.1007/s002160050359
Turkeli-Ramadan, Z., Sharma, R. N., and Raine, R. R. (2015). Two-dimensional simulation of premixed laminar flame at microscale. Chem. Eng. Sci. 138, 414–431. doi:10.1016/j.ces.2015.08.026
Wang, H., Wei, C., Zhao, P., Ye, T., Lund, H., and Kaiser, M. J. (2014). Experimental study on temperature variation in a porous inert media burner for premixed methane air combustion. Energy 72, 195–200. doi:10.1016/j.energy.2014.05.024
Wang, X., Lv, X., and Weng, Y. (2020). Performance analysis of a biogas-fueled SOFC/GT hybrid system integrated with anode-combustor exhaust gas recirculation loops. Energy 197, 117213. doi:10.1016/j.energy.2020.117213
Xue, X., Tang, J., Sammes, N., and Du, Y. (2005). Dynamic modeling of single tubular sofc combining heat/mass transfer and electrochemical reaction effects. J. Power Sources 142 (1/2), 211–222. doi:10.1016/j.jpowsour.2004.11.023
Yang, B., and Pope, S. B. (1998). An investigation of the accuracy of manifold methods and splitting schemes in the computational implementation of combustion chemistry. Combust. Flame 112 (1–2), 16–32. doi:10.1016/s0010-2180(97)81754-3
Yang, W., Wang, Y., Zhou, J., Zhou, J., Wang, Z., and Cen, K. (2017). Catalytic self-sustaining combustion of the alkanes with pt/zsm5 packed bed in a microscale tube. Chem. Eng. Sci. 158, 30–36. doi:10.1016/j.ces.2016.09.027
Yen, T. H., Hong, W. T., Huang, W. P., Tsai, Y. C., Wang, H. Y., Huang, C. N., et al. (2010). Experimental investigation of 1 kw solid oxide fuel cell system with a natural gas reformer and an exhaust gas burner. J. Power Sources 195 (5), 1454–1462. doi:10.1016/j.jpowsour.2009.09.021
Yu, S., Hong, D., Lee, Y., Lee, S., and Ahn, K. (2010). Development of a catalytic combustor for a stationary fuel cell power generation system. Renew. Energy 35 (5), 1083–1090. doi:10.1016/j.renene.2009.10.015
Zhang, H., Wang, Y., Hu, Y., Mao, W., Zou, Y., Chen, G., et al. (2022). Preparation, microstructure, and thermophysical properties of cr3+-modified cordierite high emissivity ceramic for metal thermal protection. J. Alloys Compd. 892, 162164. doi:10.1016/j.jallcom.2021.162164
Zhang, Y., Pan, J., Lu, Q., Wang, Y., Li, J., Quaye, E. K., et al. (2022). Numerical investigation on the self-ignition and combustion characteristics of H2/air in catalytic micro channel. Int. J. Hydrogen Energy 47 (3), 1965–1978. doi:10.1016/j.ijhydene.2021.10.112
Zheng, X., Mantzaras, J., and Bombach, R. (2014). Kinetic interactions between hydrogen and carbon monoxide oxidation over platinum. Combust. Flame 161 (1), 332–346. doi:10.1016/j.combustflame.2013.07.021
Nomenclature
Keywords: catalytic combustion, low calorific value, honeycomb ceramic, SOFC, exhaust gas
Citation: Yanyi Y, Weijuan Y, Jingyi C, Xiaoyu Z and Junhu Z (2024) Numerical investigation on the exhaust gas combustion of an SOFC in a catalytic multichannel burner. Front. Energy Res. 12:1322956. doi: 10.3389/fenrg.2024.1322956
Received: 17 October 2023; Accepted: 01 February 2024;
Published: 01 March 2024.
Edited by:
Hesamoddin Rabiee, The University of Queensland, AustraliaReviewed by:
Davide Papurello, Polytechnic University of Turin, ItalyJohn Mantzaras, Paul Scherrer Institut (PSI), Switzerland
Copyright © 2024 Yanyi, Weijuan, Jingyi, Xiaoyu and Junhu. This is an open-access article distributed under the terms of the Creative Commons Attribution License (CC BY). The use, distribution or reproduction in other forums is permitted, provided the original author(s) and the copyright owner(s) are credited and that the original publication in this journal is cited, in accordance with accepted academic practice. No use, distribution or reproduction is permitted which does not comply with these terms.
*Correspondence: Yao Yanyi, 11627077@zju.edu.cn