Influence of deflectors on indoor airflow velocity distribution under natural ventilation conditions
 Chaojie Wang
 Meng Jin1
 - 1School of Environment and Energy Engineering, Anhui Jianzhu University, Hefei, Anhui, China
- 2Architectural Design and Research Institute, Anhui Jianzhu University, Hefei, Anhui, China
Deflectors offer a cost-effective solution for enhancing airflow distribution. The purpose of this paper is to investigate the effect of the deflector on the indoor airflow velocity distribution under natural ventilation conditions. The results obtained from numerical simulations are validated through experimental measurements using a reduced-scale model. Subsequently, the validated reduced-scale numerical model was extended to full-size rooms. A full-size numerical simulation method is used to analyze the effect of no deflector, deflectors with different opening width-to-height ratios and deflectors with different opening shapes on the percentage of indoor velocity partitions under natural ventilation conditions. The findings reveal that the judicious installation of deflectors can enhance indoor airflow velocity distribution and increase the percentage of the indoor comfort zone. Deflectors with different opening width-to-height ratios exert distinct influences on indoor airflow velocity distribution. When the deflector opening width-to-height ratio is set at 7/6, the indoor comfort zone percentage reaches its maximum at 75.98%. Furthermore, the shape of the deflector’s opening significantly affects indoor airflow velocity distribution, and when the opening shape is a rhombus shape of 4.00 cm × 9.00 cm, the proportion of indoor velocity comfort zone is the largest, which is 75.56%. This study provides a reference for the design and practice of natural ventilation in buildings.
1 Introduction
Reducing carbon emissions in the construction sector is crucial for China’s strategic goals of achieving carbon peaking and carbon neutrality. The substantial use of non-renewable energy in the construction industry has emerged as a significant contributor to global warming and environmental degradation (Alhamami et al., 2023; Nie et al., 2023). Hence, the prevailing global trend is to develop clean energy technologies like wind energy to mitigate greenhouse gas emissions. Natural ventilation, as a passive green building technology measure (Wang and Malkawi, 2019), can improve the building environment by increasing the level of indoor thermal comfort, which aids in preventing the development of “sick building syndrome” and reducing the risk of epidemic transmission (Fantozzi et al., 2022; Ren et al., 2022). Buildings incorporating natural ventilation often exhibit energy costs that are 40% lower than those relying on air conditioning. In regions with comfortable outdoor climates, natural ventilation serves as a cost-free cooling resource (Ayata and Yıldız, 2006; Odi et al., 2022; Qin et al., 2022). Beyond delivering fresh air to interior spaces, promoting indoor air circulation, and eliminating indoor air pollutants to enhance indoor air quality (Lei et al., 2017), effective use of natural ventilation can curtail the demand for air conditioning, reduce indoor temperatures, ameliorate indoor heat and humidity conditions (Liping and Hien, 2007), and enhance thermal comfort (Wong et al., 2002; Costanzo and Donn, 2017).
Understanding how natural ventilation affects the indoor environment of a building, primarily ventilation rates and indoor air temperatures, is crucial for evaluating the design of these low-energy buildings. Various methods are employed to forecast and assess ventilation performance, including full-size model experiments, empirical formulas, scale model experiments, and CFD numerical simulations (Chen, 2009). Field measurements of the indoor thermal environment in full-size buildings are, however, more challenging to conduct in much research. This is due to the fact that external climatic conditions are often complicated, ever-changing, and uncontrollable during field tests in prototype buildings (Omrani et al., 2017a), particularly for ventilation that is solely buoyancy-driven. Consequently, there is a growing interest in investigating the indoor thermal environment using reduced-scale models. In order for the reduced-scale model results to be applicable to full-size buildings, the primary similarity criterion should be satisfied with equal values. Many scholars have employed reduced-scale model experiments in their research. For instance, Guo et al. (2018) developed a reliable and effective methodology to evaluate the performance of buoyancy-driven ventilation in large-space buildings, using reduced-scale experimental models and numerical simulations of full-size prototypes. Liu et al. (2009) used scaled-down modeling tests to predict the performance of buoyancy-driven ventilation for atrium buildings and used internal heat loads to simulate as a heat source for building-driven buoyancy; furthermore, it evaluated the efficiency of buoyancy-driven ventilation under hot and humid climatic conditions. Le Roux et al. (2012) highlighted the significance of accounting for the effect of wind on airflow in mechanically ventilated buildings through scaled-down model experiments. They developed a new methodology to study steady-state and transient isothermal flows in buildings equipped with ventilation systems.
Computational Fluid Dynamics (CFD) is another method for examining the impact of natural ventilation on a building’s indoor environment. The benefits of CFD include low cost, high efficiency (Yang et al., 2015; Tian et al., 2018; Zhang and Ryu, 2021), and the capacity to compute pertinent non-measurable parameters (Liu et al., 2009). CFD technology has rapidly advanced alongside computer science and technology. Through CFD analysis of the wind environment within buildings, it becomes possible to predict indoor airflow distribution (Zou et al., 2021), assess indoor air quality, and evaluate comfort levels. In 1974, Nielsen of Denmark pioneered the application of CFD technology for airflow simulation in ventilated rooms (NIELSEN, 1974). Wang Y. et al. (2021) systematically compared the ventilation characteristics of different window opening configurations using computational fluid dynamics (CFD) simulations, combining ventilation rates and thermal comfort to provide a comprehensive evaluation of window ventilation performance. Yang et al. (2015) numerically simulated the transient development of buoyancy-driven natural ventilation by modeling. And numerical simulation was used to analyze the airflow characteristics in three cases where the initial indoor temperature is equal to, higher than and lower than the outdoor temperature. Asfour and Gadi (2008) used Computational Fluid Dynamics (CFD) to study the effect of a vaulted roof as a wind inducing device in a building on the performance of natural ventilation, and evaluated the performance of the natural ventilation based on the value of the airflow rate and the quality of the internal airflow distribution.
In contemporary urban planning and building design, natural ventilation is often disregarded as a passive green building technology. Typically, local seasonal wind directions are not considered when planning and designing residential and workplace environments. While it is relatively simple to introduce fresh outdoor air into a building’s interior through doors and windows to enhance indoor air quality (Prueksakorn et al., 2015; Wen and Hiyama, 2018), this approach can lead to excessive wind speeds in localized indoor areas and result in uneven indoor airflow distribution. In fact, for maintaining thermally comfortable environments, the recommended upper limit for indoor airflow velocity is 1 m/s. When the wind speed exceeds 1 m/s, this is when the airflow begins to pick up light weight objects (ASHRAE, 2020). Therefore, there is an urgent need to implement effective and practical methods for directing airflow to enhance indoor airflow distribution.
Currently, numerous scholars have conducted research on air deflectors. The working principle of airflow deflectors relies on utilizing the pressure differential created by their physical structure to induce directional changes in airflow. Consequently, the reasonable installation of deflectors can significantly enhance indoor airflow distribution. Che et al. (2022) have conducted an investigation into the impact of airflow deflector designs installed in external windows on airflow distribution performance and the risk of infection in a wind-driven naturally ventilated classroom. Different sizes of airflow deflectors were designed based on four external window openings, and the performance was compared to obtain the best deflector. Liu et al. conducted a study examining the influence of deflector adjustments on diffusers, with performance assessed using air diffusion performance index values. The findings revealed that the upward blade deflector significantly enhances the air diffusion performance index value of the blade grille. In general, downward jets reduce the air diffusion performance index value for each adjustable diffuser type when operating under cooling conditions (Liu and Novoselac, 2016). Song et al. (2021) improved the trajectory of cold airflow from perforated bricks to the rack by implementing deflectors in the cold aisle. This optimization enhanced the uniformity of airflow distribution vertically and overall thermal environment around the rack. Cheng et al. (2023) have conducted experiments on deflection ventilation for winter heating. The effects of different air supply speeds, air supply temperatures and deflection angles on air distribution were analyzed, and the thermal comfort and energy efficiency were comprehensively evaluated.
Most of the aforementioned studies have focused on air-conditioning air supply outlets, exploring various deflector forms such as louvers and grille types, as well as the application of deflectors in internal equipment like fans and ducts. However, there is a paucity of research regarding the implementation of deflectors in buildings operating under natural ventilation conditions. Therefore, the purpose of this study is to analyze the effects of setting different opening width-to-height ratios and different opening shapes of deflector panels on the indoor airflow velocity distribution in a room under natural ventilation conditions. An office in Hefei area is used as a research object for experiment and simulation. Numerical simulations and experiments employ a reduced-scale model, with experimental results used to validate numerical findings. The validated reduced-scale numerical model is extended to the full-size room, and then full-size numerical simulation is used to analyze the effects of no deflector, deflector with different opening width-to-height ratios, and deflector with different opening shapes on the percentage of indoor velocity comfort zones under natural ventilation conditions, reflecting the indoor airflow distribution of the actual building. This study helps to set up indoor deflectors more scientifically and rationally under specific conditions to improve indoor airflow distribution and increase the proportion of indoor velocity comfort zone in order to avoid excessive indoor air velocity caused by cross ventilation. Moreover, the findings of this study provide a reference for the design and practice of natural ventilation in buildings.
2 Methods
2.1 Experimental methods
2.1.1 Experimental site and apparatus
This study focuses on an office space situated in the Hefei area. The office has dimensions of 3.6 m in length, 4.0 m in width, and 3.0 m in height. It features a south-facing opening measuring 0.6 m × 1.2 m and a north-facing opening measuring 0.9 m × 2.1 m. Notably, the north-south opening is situated directly opposite. During the transitional season and summer in Hefei, the prevailing natural ventilation wind direction is from the southeast, with an average wind speed of 3.2 m/s in the southern direction.
The apparatus used in the experiment included a 5 mm thick acrylic plate model, an electric fan and a thermosensitive anemometer, as shown in Figure 1. The thermosensitive anemometer used is the SMART SENSOR AR866A model, with a measurement accuracy of ±1% and a resolution of 0.01 m/s. The probe diameter is 11 mm, which can be stretched to 920 mm, and the instrument and the line are about 2.1 m long. Additionally, the instrument featured a USB interface enabling real-time measurement and data recording on a computer. It also had the capacity to store data for up to 500 sets.
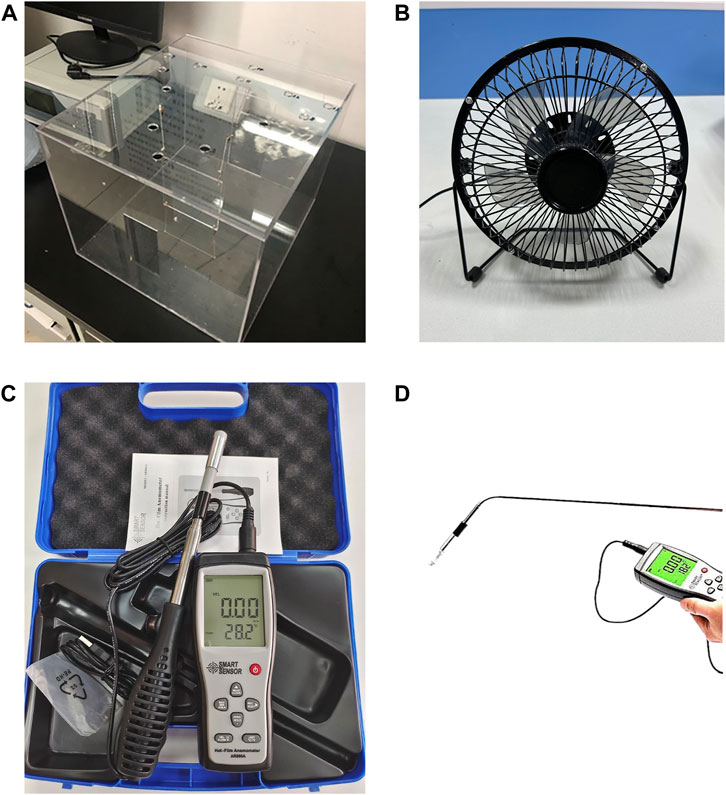
Figure 1. Experimental apparatus: (A) Acrylic plate model; (B) Electric fan; (C) Thermosensitive anemometer; (D) Schematic diagram of thermosensitive anemometer probe.
2.1.2 Similarity analysis
In this test, the medium used in the model and the prototype is air, and the air flow is turbulent, non-isothermal, incompressible, viscous three-dimensional steady flow, and the basic differential equations of the viscous fluid are dimensionally-processed to obtain the following functional equations.
Where
Since the medium used in both the model and the prototype is air (Xie et al., 2021), i.e.,
In practical engineering and modeling tests, air flow is generally in the drag square region, the Reynolds number
The Froude number (
Where
When designing using the Froude criterion, it is required that the rooms and models have equal Froude numbers, which can be expressed according to Eq. 4 as follows: (Xie et al., 2021).
where the mark "′" is added to indicate the corresponding parameter of the prototype. Let the free-fall acceleration scale
When the model test conditions are basically similar to the prototype conditions,
In the experiment of this paper, the geometric scale
2.1.3 Experimental model
The reduced-scale model experiment employs a room model with dimensions of 36 cm in length, 40 cm in width, and 30 cm in height, as depicted in Figure 2. The size of the south-facing opening of the model is 6 cm × 12 cm, the height from the bottom is 9 cm, the size of the north-facing opening is 9 cm × 21 cm, and the size of the indoor set deflector is 12 cm × 12 cm, the height from the bottom is 9 cm, and the distance from the south-facing opening is 14 cm, which is scaled down by 10 times. Geometric similarity between the model and the prototype is upheld, with the model crafted from specially treated plexiglass acrylic plate of 5 mm thickness. The chosen acrylic plate boasts notable advantages, including robust impact resistance, high recyclability, ample rigidity and strength, ease of processing and molding, and simple maintenance. Importantly, the acrylic plate remains resilient against significant vibrations and deformations throughout the experimental course.
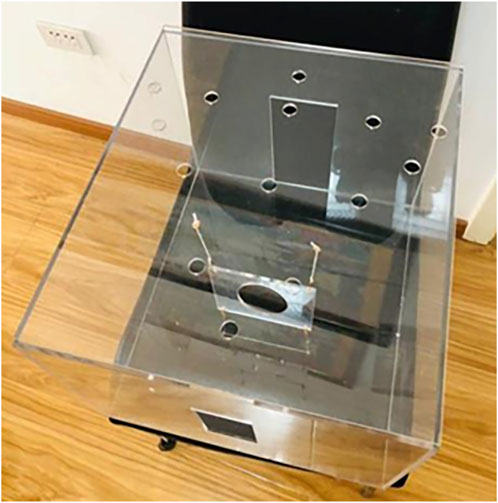
Figure 2. Reduced scale experimental model.
The arrangement of measurement points for the experimental model is illustrated in Figure 2. At the top of the model, a circular hole with a diameter of 15 mm (11 mm diameter of the thermosensitive anemometer probe) serves as the designated measurement point. These measurement points are symmetrically positioned along the centerline of the building model, as depicted in Figure 3. The total count of measurement points corresponds to 14.
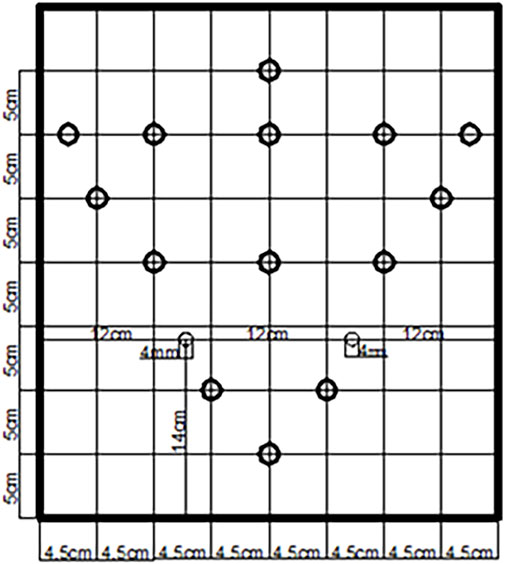
Figure 3. Schematic diagram of measurement point layout.
2.1.4 Experimental scheme design
To investigate the impact of varying width-to-height ratios and distinct shapes of deflector plate openings on the indoor velocity partitioning ratio within the context of natural ventilation, this paper introduces the subsequent experimental plan: 1) a hole was opened in the deflector plate, and eight deflector plates with different width to height ratio openings were set, the opening sizes of the deflector plates were shown in Table 1, and the schematic diagram of the openings was shown in Figure 4; 2) A hole is opened in the deflector plate with the same opening area, and the opening shapes are circular, 4.00 cm × 9.00 cm rhombic, square and 9.00 cm × 4.00 cm rhombic. The shape and size of the specific deflector opening is shown in Table 2, and the schematic diagram of the opening is shown in Figure 5.
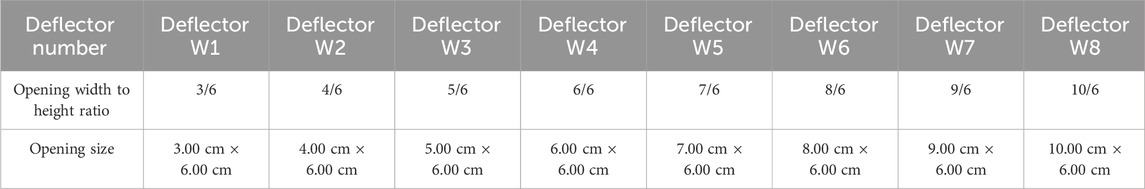
Table 1. Table of deflector opening dimensions.
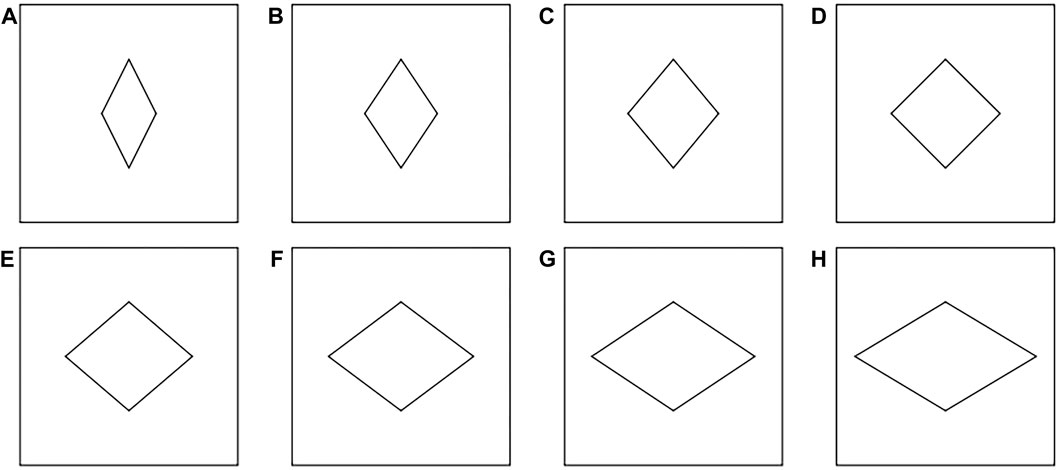
Figure 4. Schematic diagram of the different width to height ratio openings of the deflector: (A) Width to height ratio 3/6; (B) Width to height ratio 4/6; (C) Width to height ratio 5/6; (D) Width to height ratio 6/6; (E) Width to height ratio 7/6; (F) Width to height ratio 8/6; (G) Width to height ratio 9/6; (H) Width to height ratio 10/6.
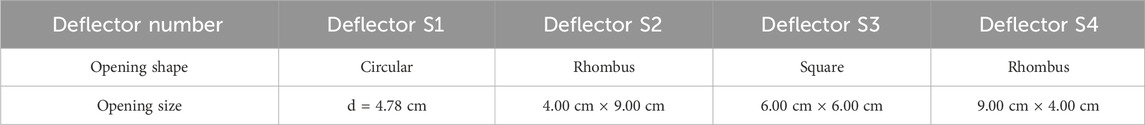
Table 2. Different shape opening size table.
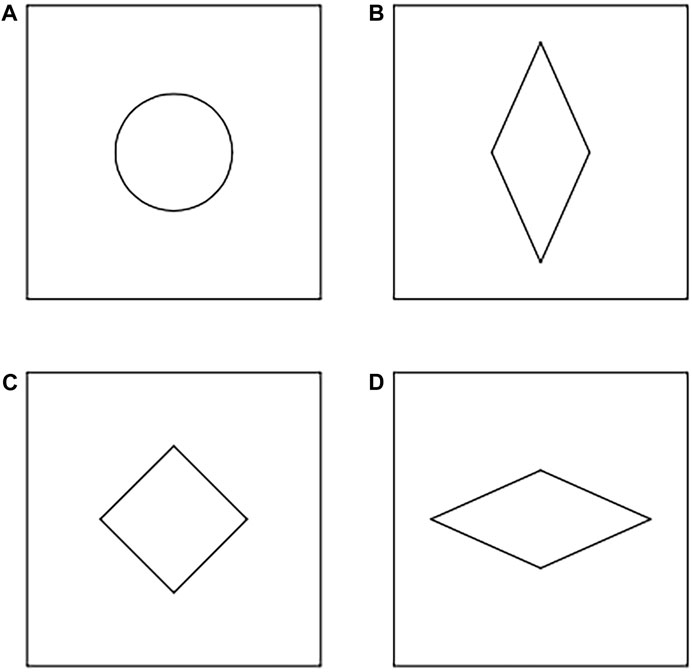
Figure 5. Schematic diagram of different shapes of deflector openings: (A) Circular; (B) 4.00 cm × 9.00 cm Rhombus; (C) Square; (D) 9.00 cm × 4.00 cm Rhombus.
2.1.5 Experimental steps
The experimental protocol commenced by establishing the model’s fixed position, followed by meticulous adjustments to both the distance and height between the fan and the window opening. Drawing from similarity theory (Han and Li, 2021), a hot-wire anemometer was deployed to gauge the wind speed at the entrance, thereby maintaining a constant inflow velocity of 1.0 m/s. The experiment aims to measure the wind speed at a 15 cm height within the model. To minimize experimental errors, it is essential to maintain the thermal probe of the thermosensitive anemometer perpendicular to the incoming flow direction. The experimental measurement diagram is shown in Figure 6. Then, use the anemometer to test the wind speed at 14 measurement points. To ensure the accuracy of the measurement results, take 10 consecutive instantaneous velocity values for each measurement point and calculate the average value as the final velocity value at each measurement point.
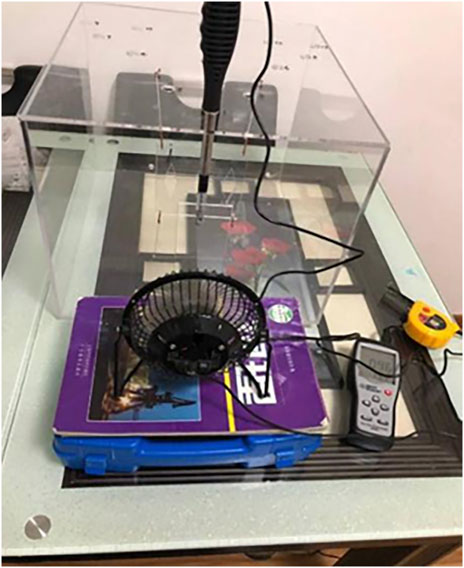
Figure 6. Experimental measurement diagram.
2.2 Simulation methods
2.2.1 Geometric model and numerical methods
Airpak software is now widely used to simulate indoor and airflow organization distribution (Zhang and Ryu, 2021; Zhang et al., 2023). In this study, we employed the Airpak software to construct a scaled-down numerical model of a room, measuring 36 cm in length, 40 cm in width, and 30 cm in height. During the simulation, all doors and windows remained open. The room model is depicted in Figure 7, with the x-axis denoting the depth direction, the y-axis representing height, and the z-axis indicating width. The arrangement of numerical simulation measurement points is the same as that of the reduced-scale model experiment. The velocity values of each measurement point were calculated directly by Airpak software when the deflectors with different opening width to height ratio and different opening shapes were set in the room.
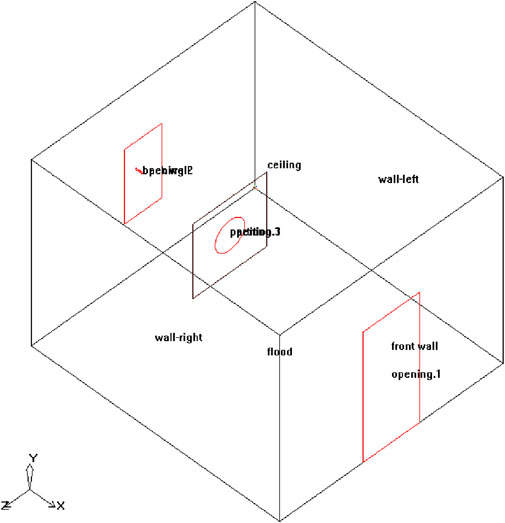
Figure 7. Schematic diagram of the room geometry model.
In order to study the flow of indoor air in the real state, a 1:1 full-scale modeling was conducted, and the room model size was 3.6 m × 4.0 m × 3.0 m (length × width × height). The natural ventilation of the room with all windows and doors open is simulated. The airflow distribution in the cross-section at the height of y = 1.5 m (height of human activity) was investigated by numerical simulation of the room without deflector, with deflectors with different opening width-to-height ratios and deflectors with different opening shapes.
Indoor air flow is incompressible and low-speed turbulent. This paper employs the indoor zero-equation model for its extensive validation, characterized by rapid computational speed and stable convergence when predicting various airflow scenarios, including natural convection (Vera et al., 2010), forced convection, mixed convection, and displacement ventilation within a room. This model is well-suited for forecasting indoor airflow distribution and has demonstrated its effectiveness, particularly under mixed convection conditions (Ling et al., 2015). In this study, the SIMPLE (semi-implicit method for pressure dependent equations) pressure-velocity coupling algorithm is used (Fan et al., 2022; Liu et al., 2022; Mohamed et al., 2022).
2.2.2 Boundary conditions
The boundary conditions of the reduced-scale model are determined based on the full-size working conditions as well as similar scales. The boundary conditions of this simulation are as follows: the pressure boundary is chosen, and the southward inlet wind pressure of the room is determined according to
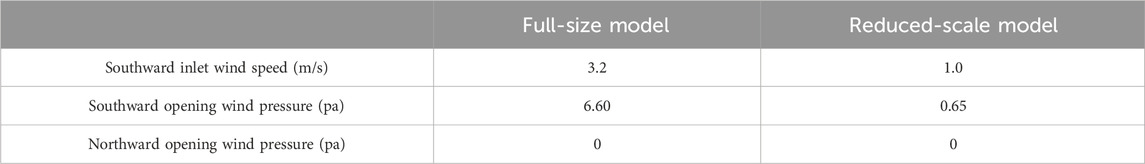
Table 3. Boundary condition settings.
2.2.3 Mesh generation
The simulation was conducted using the Airpak software to mesh the computational region with a hexahedral unstructured grid. As an example, five different grid schemes were selected for the simulation when a circular hole was opened in the deflector of the reduced-scale model. The number of divisions for these schemes was 14,520, 17,664, 22,818, 34,210, and 44,404 grid cells, respectively. To investigate the grid independence (Strasszer and Xydis, 2020; Yuan et al., 2020; Wang Z. et al., 2021), the measurement point was chosen at the center of the deflector opening. Figure 8 illustrates the wind speed variations at the measurement point for different grid numbers. When the number of grids is less than 22,818, there is a noticeable difference in air velocity at the measurement point. However, when the number of grids is equal to or greater than 22,818, the air velocity at the measurement point remains relatively stable. The air velocities at the measurement point for grid counts of 22,818, 34,210, and 44,404 are recorded as 0.66 m/s, 0.66 m/s, and 0.67 m/s, respectively. The air velocity deviation among the three grid schemes is within 5%. Therefore, 22,818 grid cells were selected as the meshing scheme for this study, as shown in Figure 9. The meshing quality is good and meets the requirements for the simulation.
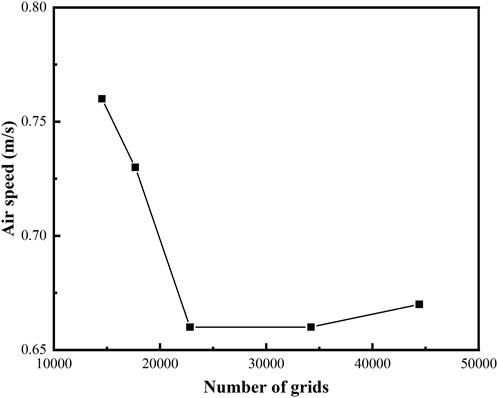
Figure 8. Grid independence analysis.
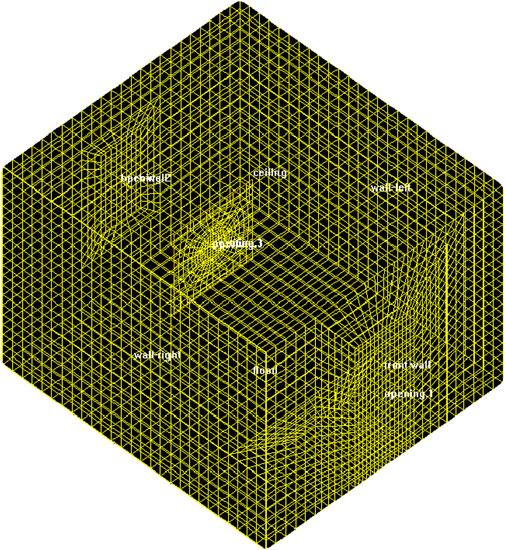
Figure 9. Mesh division.
2.3 Indoor air velocity interval division
Indoor air velocity significantly influences indoor airflow distribution and is intricately linked to human thermal comfort (Prianto and Depecker, 2002; Omrani et al., 2017b). This study, considering existing research findings along with regional and indoor work characteristics, adopts a range of 0.25 m/s to 1.00 m/s as the benchmark for evaluating indoor wind speed comfort. Below 0.25 m/s, indoor wind speeds are too low for occupants to readily perceive, while wind speeds above 1.00 m/s cause discomfort to the occupants. Wind speeds in the range of 0.25 m/s to 1.00 m/s provide for human comfort. Consequently, this paper classifies indoor wind speed intervals under natural ventilation conditions as follows: the low wind speed zone ranges from 0.00 m/s to 0.25 m/s, the comfortable speed zone ranges from 0.25 m/s to 1.00 m/s, and wind speeds exceeding 1.00 m/s fall into the high wind speed zone.
3 Results and discussion
3.1 Experimental results and discussion
The measured and simulated outcomes from the reduced-scale model experiments are compared and analyzed to validate the reasonableness and effectiveness of the simulation approach. The following is a comparison between the measured results and simulated results for the deflector plate with different opening width to height ratio and different opening shape respectively.
Velocity measurements were taken at 14 specific points located at a cross-sectional height of y = 15 cm, while varying the opening width-to-height ratios and shapes of holes within the deflector’s center. The measured velocity values at each measurement point of the reduced-scale model and numerical simulation are shown in Figures 10A, B when the holes with different width-to-height ratios are opened in the middle of the deflector. The measured and numerical simulation values of velocity at each measurement point of the reduced-scale model are shown in Figures 10C, D when a hole of different shapes is opened in the middle of the deflector. As can be seen from the figure, as the width-to-height ratio of the deflector opening and the shape of the opening change, the velocity values at each measurement point change accordingly, but the overall trend remains consistent. The flow of outdoor air enters through windows, passes through the room’s deflector opening, and exits through the opposite door, creating cross-ventilation. Consequently, measurement points 1, 5, 11, and 14 exhibit higher velocity values. As air velocity decreases from the room’s entrance to the exit of the incoming flow, airflow velocity gradually diminishes. Obstructions in airflow occur at unopened holes of the deflector plate, generating vortices in the area behind the deflector plate, leading to near-zero velocity values at measurement points 4 and 6. With decreasing air velocity, measurement points 7, 8, 9, 10, 12, and 13, situated farther from the entry point, also exhibit lower and near-zero velocity values.
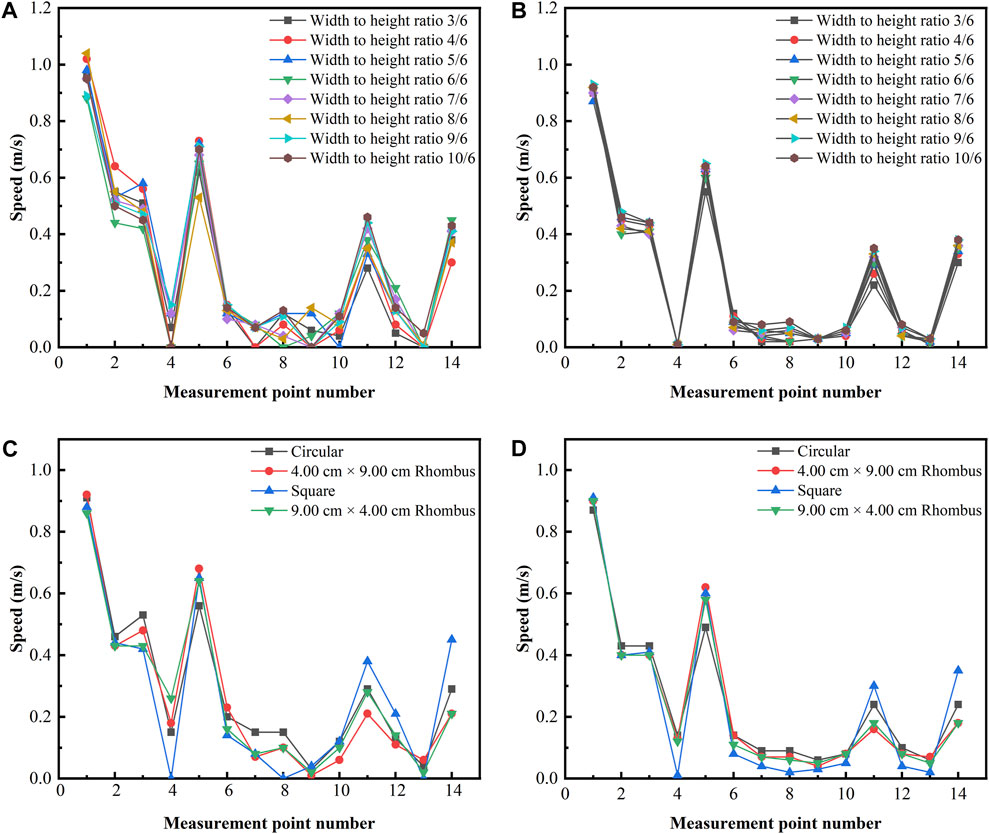
Figure 10. (A) Measured speed diagram of different width-to-height ratio openings; (B) Simulated speed diagram of different width-to-height ratio openings; (C) Measured speed diagram of different shapes of openings; (D) Simulated speed diagram of different shapes of openings.
The numerical simulation data at 14 measurement points in this experiment were compared with the measured data of the reduced-scale model. As shown in Figure 10, the experimental measurements of the reduced-scale model are slightly larger than those of the numerical simulation, but the overall trend remains consistent. Table 4 lists the mean absolute error and root mean square error between the experimental and simulated results for the deflectors with different opening width to height ratio and deflectors with different opening shapes. After analysis, it was found that the maximum value of the mean absolute error between the simulated and measured values of wind speed is 0.0721 m/s, and the maximum value of the root mean square error is 0.0834 m/s, and these errors are within the acceptable range. Therefore, the results of the numerical simulation can better reflect the experimental results. The validated numerical model can be used for full-size working condition expansion, and the results can truly reflect the airflow distribution inside the building.

Table 4. Comparison of numerical simulation results with experimental measurements.
3.2 Full-scale simulation results and analysis
The full-size simulation comprises three cases: under natural ventilation conditions, the indoor airflow velocity distribution is simulated and analyzed in scenarios with no deflectors, with deflectors of varying opening width-to-height ratios, and with deflectors of different shapes. The role of the deflector is to increase the wind pressure of the environment or guide its flow direction to change through some way and equipment construction, the windward side of the deflector is the positive pressure area, and the backward side of the deflector is the negative pressure area.
3.2.1 No deflector
As depicted in Figure 11, the velocity distribution at a height of y = 1.5 m in the absence of a deflector is illustrated. Outdoor air enters the room through the southern entrance and exits through the northern air vent, establishing cross-ventilation. The air velocity is highest at the south side inlet, and localized areas in the middle section have higher air velocities due to cross ventilation.
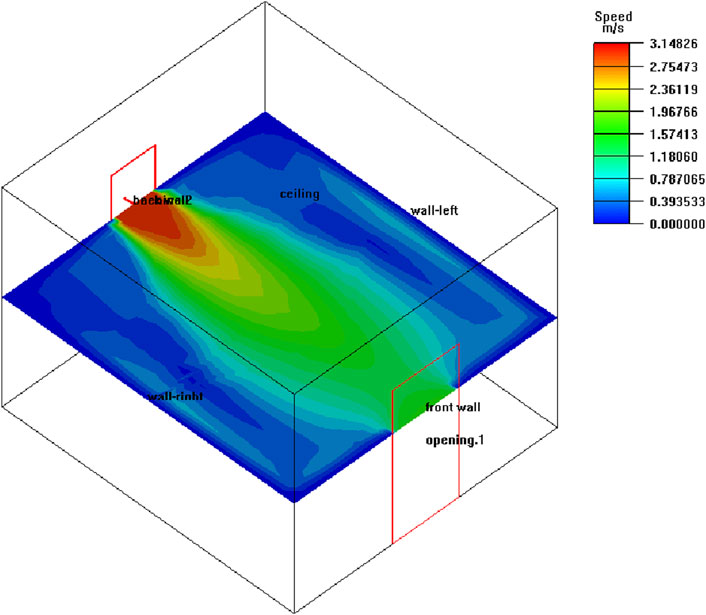
Figure 11. Velocity cloud at y = 1.5 m height without deflector.
As indicated in Table 5, in the absence of a deflector within the room, the velocity cloud diagram of the cross-section at a height of y = 1.5 m comprises 3.06% in the low wind speed zone, 62.11% in the comfort speed zone, and 34.83% in the high wind speed zone.
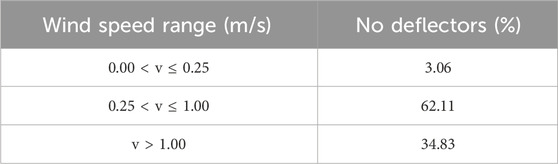
Table 5. Distribution of each velocity partition in numerical simulation without deflector.
3.2.2 Deflectors with different width-to-height ratio openings
Illustrated in Figure 12, outdoor air flows into the room through the southern entrance, with the highest wind speed observed at this inlet. Encountering the obstruction at the unopened place of the deflector plate, vortex will be generated at the back of the deflector plate, resulting in the value of the air velocity at the back of the deflector plate in a large area close to zero. Through the openings in the room deflector, air flows from one side of the room to the other, creating cross ventilation and resulting in higher air velocities in localized areas. As the width-to-height ratio of the deflector opening increases, the percentage of the low-wind-speed zone in the velocity cloud diagram at the cross-section of y = 1.5 m height decreases, while the proportion of the comfortable-speed zone and high-wind-speed zone increases.
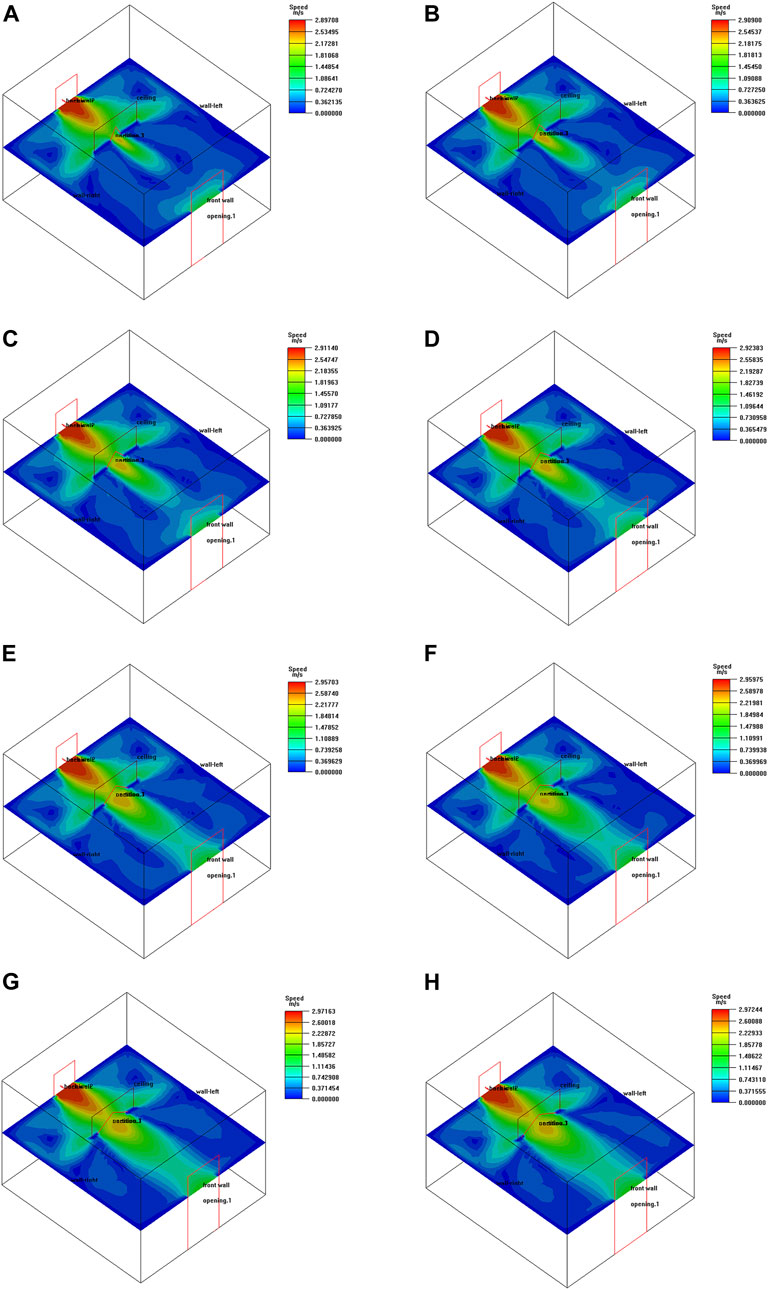
Figure 12. Velocity cloud at y = 1.5 m height when the deflector is opened with different width-to-height ratio openings: (A) Width to height ratio 3/6; (B) Width to height ratio 4/6; (C) Width to height ratio 5/6; (D) Width to height ratio 6/6; (E) Width to height ratio 7/6; (F) Width to height ratio 8/6; (G) Width to height ratio 9/6; (H) Width to height ratio 10/6.
Figure 13 illustrates the effect of variations in the width-to-height ratio of the deflector openings on the percentage of indoor velocity partitioning. As the width-to-height ratio increases from 3/6 to 7/6, there is a continuous reduction in the proportion of the low wind speed zone, decreasing from 11.79% to 3.75%, representing an 8.04% decrease. Concurrently, there is an increase in the proportion of the speed comfort zone, rising from 72.38% to 75.98%, indicating a 3.60% increase. Additionally, the proportion of the high wind speed zone rises from 15.83% to 20.27%, reflecting a 4.44% increase. Subsequently, when the width-to-height ratio of the deflector opening increases from 7/6 to 8/6, the percentage of the low wind speed zone experiences an increase from 3.75% to 7.33%, a growth of 3.58%. Simultaneously, the percentage of the speed comfort zone decreases from 75.98% to 71.38%, representing a 4.60% decrease. Additionally, the percentage of the high wind speed zone increases from 20.27% to 21.29%, signifying a 1.02% increase. Lastly, when the width-to-height ratio of the deflector opening is increased from 8/6 to 10/6, the percentage of the low wind speed zone decreases from 7.33% to 2.98%, indicating a 4.35% decrease. Correspondingly, the percentage of the speed comfort zone increases from 71.38% to 73.01%, reflecting a 1.63% increase. Furthermore, the percentage of the high wind speed zone increases from 21.29% to 24.01%, representing a 2.72% increase.
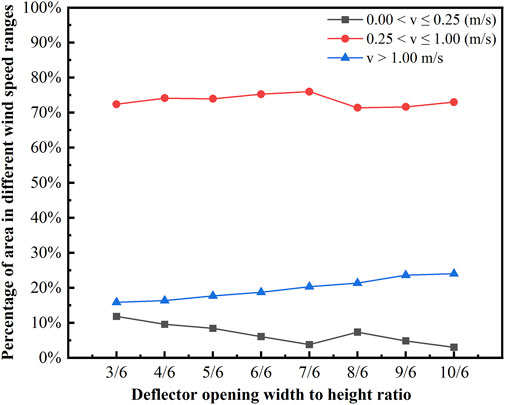
Figure 13. The percentage of each velocity zone when the width-to-height ratio of the deflector opening is varied.
3.2.3 Deflectors with differently shaped openings
As shown in Figure 14, the flow state and the reason for its formation are in general agreement with Figure 12. The different shapes of the deflector opening have a greater influence on the proportion of each wind speed zone in the velocity cloud map of the cross-section at the height of y = 1.5 m.
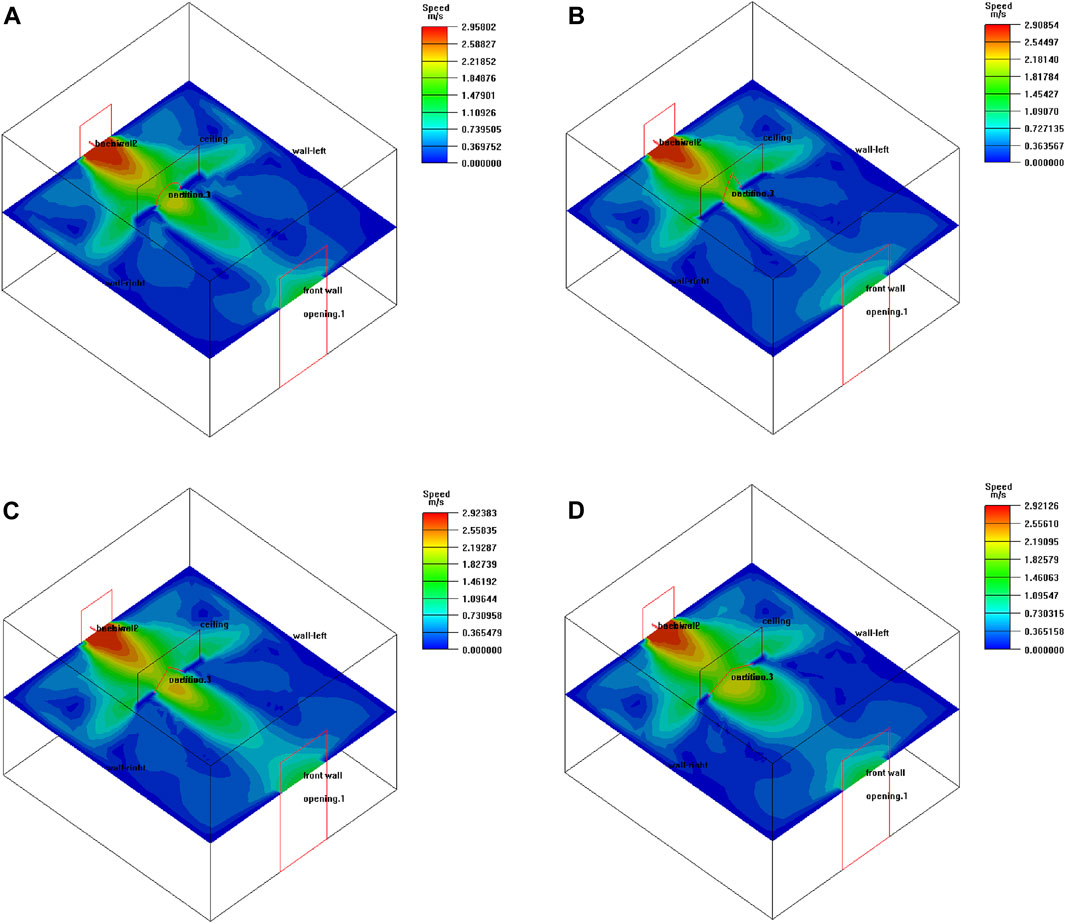
Figure 14. Velocity cloud at y = 1.5 m height when the deflector plate is opened with different shapes of openings: (A) Circular; (B) 4.00 cm × 9.00 cm Rhombus; (C) Square; (D) 9.00 cm × 4.00 cm Rhombus.
In Figure 15, we observe changes in wind speed zones related to different deflector opening shapes. When the deflector opening has a 9.00 cm × 4.00 cm rhombus shape, the percentage of the low wind speed zone measures 13.78%, while with a square deflector opening, it decreases to 6.04%. The highest percentage of the speed comfort zone, at 75.56%, is recorded when the deflector opening takes the form of a 4.00 cm × 9.00 cm rhombus, and the lowest percentage, 66.83%, is observed when the deflector opening is in the shape of a 9.00 cm × 4.00 cm rhombus. The percentage of the high wind speed zone shows relatively little variation.
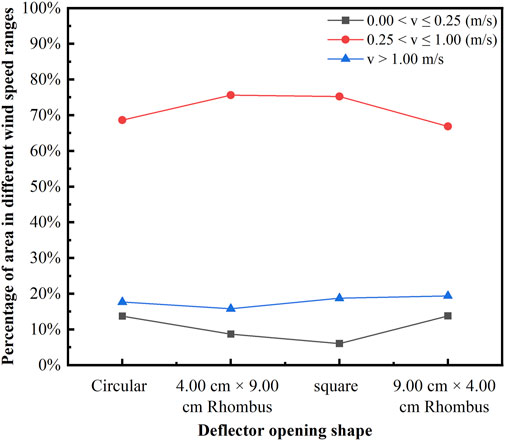
Figure 15. Percentage of each velocity zone when the deflector plate is opened with different shaped openings.
The effects of the above three scenarios on the indoor airflow distribution under natural ventilation conditions are simulated and analyzed, keeping the wind pressure at the entrances and exits constant and the position of the deflector plate constant. In the absence of a deflector plate in the room, the indoor speed comfort zone occupies the smallest proportion, accounting for 62.11%. The percentage of indoor speed comfort zone increased significantly when deflectors with different opening width-to-height ratios and deflectors with different opening shapes were installed indoors. The percentage of the indoor speed comfort zone varied with changes in the opening width-to-height ratio of the deflector plate. When the deflector plate had an opening width-to-height ratio of 7/6, it reached its highest value at 75.98%, marking a significant increase of 13.87%. The shape of the deflector opening had a more pronounced effect on the indoor speed comfort zone percentage. When the deflector opening took on a rhombus shape measuring 4.00 cm × 9.00 cm, it reached its highest value at 75.56%, reflecting a substantial increase of 13.45%.
4 Conclusion
In this study, a 1:10 scale experimental model and a numerical model were established based on similarity theory. The experimental measurements from the reduced-scale model were compared and analyzed alongside the simulation results, confirming the rationality and effectiveness of numerical simulations. Subsequently, the validated reduced-scale numerical model was extended to a full-size room. The study investigated the impact of deflectors, including different opening width-to-height ratios and shapes, as well as the absence of deflectors, on the percentage of indoor velocity partitions under natural ventilation conditions using full-scale numerical simulations. Based on the aforementioned findings, the following conclusions can be drawn:
1) A comparative analysis of the experimental measurements from the reduced-scale model and the simulation results indicates that the experimental results obtained from the reduced-scale model are slightly greater than the numerical simulation results, while the overall speed trend remains consistent. Consequently, the CFD numerical simulation better mirrors the experimental results, and the validated numerical model can be applied to extend to full-size working conditions. The results of the full-scale numerical simulation accurately portray the indoor airflow velocity distribution within the building.
2) In the context of natural ventilation, the judicious installation of indoor deflectors can effectively augment the percentage of the indoor speed comfort zone, mitigating excessive indoor wind speeds resulting from cross-ventilation and thereby enhancing human comfort and improving the distribution of indoor airflow velocity.
3) Various deflector plate opening width-to-height ratios yield distinct impacts on both the indoor speed comfort zone percentage and indoor airflow velocity distribution. The maximum percentage of the indoor speed comfort zone, at 75.98%, is achieved when the width-to-height ratio of the deflector opening stands at 7/6.
4) Different shapes of deflector openings exert a more significant influence on the percentage of the indoor speed comfort zone and indoor airflow velocity distribution. The largest percentage of the indoor speed comfort zone, amounting to 75.56%, is observed when the deflector opening takes the form of a rhombus measuring 4.00 cm × 9.00 cm.
Data availability statement
The original contributions presented in the study are included in the article/Supplementary material, further inquiries can be directed to the corresponding author.
Author contributions
CW: Conceptualization, Data curation, Formal Analysis, Investigation, Methodology, Software, Visualization, Writing–original draft, Writing–review and editing. MJ: Conceptualization, Data curation, Investigation, Methodology, Validation, Writing–original draft. HC: Conceptualization, Funding acquisition, Project administration, Resources, Supervision, Writing–review and editing.
Funding
The author(s) declare financial support was received for the research, authorship, and/or publication of this article. This research was funded by the Special Funds Program for Central Guided Local Science and Technology Development of Anhui Province (No. 201907d07050009).
Conflict of interest
The authors declare that the research was conducted in the absence of any commercial or financial relationships that could be construed as a potential conflict of interest.
Publisher’s note
All claims expressed in this article are solely those of the authors and do not necessarily represent those of their affiliated organizations, or those of the publisher, the editors and the reviewers. Any product that may be evaluated in this article, or claim that may be made by its manufacturer, is not guaranteed or endorsed by the publisher.
References
Alhamami, A. H., Dodo, Y. A., Naibi, A. U., Alviz-Meza, A., and Mokhtarname, A. (2023). Energy-carbon emission nexus in a residential building using BIM under different climate conditions: an application of multi-objective optimization. Front. Energy Res. 11. doi:10.3389/fenrg.2023.1326967
Asfour, O. S., and Gadi, M. B. (2008). Using CFD to investigate ventilation characteristics of vaults as wind-inducing devices in buildings. Appl. Energy 85 (12), 1126–1140. doi:10.1016/j.apenergy.2007.10.015
Ashrae, (2020). ANSI/ASHRAE Standard 55-2020. Thermal environmental conditions for human occupancy. Atlanta: ASHRAE.
Ayata, T., and Yıldız, O. (2006). Investigating the potential use of natural ventilation in new building designs in Turkey. Energy Build. 38 (8), 959–963. doi:10.1016/j.enbuild.2005.10.007
Che, W., Ding, J., and Li, L. (2022). Airflow deflectors of external windowsto induce ventilation: towards COVID-19 prevention and control. Sustain. Cities Soc. 77, 103548. doi:10.1016/j.scs.2021.103548
Chen, Q. (2009). Ventilation performance prediction for buildings: a method overview and recent applications. Build. Environ. 44 (4), 848–858. doi:10.1016/j.buildenv.2008.05.025
Cheng, F., Li, Y., Wu, Y., Cheng, Y., and Lin, Z. (2023). Experimental study of air distribution and heating performances of deflection ventilation. Energy Build. 282, 112800. doi:10.1016/j.enbuild.2023.112800
Costanzo, V., and Donn, M. (2017). Thermal and visual comfort assessment of natural ventilated office buildings in Europe and North America. Energy Build. 140, 210–223. doi:10.1016/j.enbuild.2017.02.003
Fan, X., Yu, T., Liu, P., and Li, X. 2022. Uniformity of supply air in the plenum for under-floor air distribution ventilation in a circular conference room: a CFD study. Energies 15 (17), 6370. doi:10.3390/en15176370
Fantozzi, F., Lamberti, G., Leccese, F., and Salvadori, G. (2022). Monitoring CO2 concentration to control the infection probability due to airborne transmission in naturally ventilated university classrooms. Archit. Sci. Rev. 65 (4), 306–318. doi:10.1080/00038628.2022.2080637
Guo, P., Wang, S., Xu, B., Meng, Q., and Wang, Y. (2018). Reduced-scale experimental model and numerical investigations to buoyance-driven natural ventilation in a large space building. Build. Environ. 145, 24–32. doi:10.1016/j.buildenv.2018.09.019
Han, O., and Li, A. (2021). Velocity distribution of wall-attached jets in slotted-inlet ventilated rooms. Build. Environ. 194, 107708. doi:10.1016/j.buildenv.2021.107708
Lei, Z., Liu, C., Wang, L., and Li, N. (2017). Effect of natural ventilation on indoor air quality and thermal comfort in dormitory during winter. Build. Environ. 125, 240–247. doi:10.1016/j.buildenv.2017.08.051
Le Roux, N., Faure, X., Inard, C., Soares, S., and Ricciardi, L. (2012). Reduced-scale study of wind influence on mean airflows inside buildings equipped with ventilation systems. Build. Environ. 58, 231–244. doi:10.1016/j.buildenv.2012.07.007
Ling, Y., Zhang, X., Li, S., Han, G., and Sun, X. (2015). The numerical simulation and experimental study on rack cooling effect in date center with UFAD system. Int. J. Low-Carbon Technol. 10 (4), 446–451. doi:10.1093/ijlct/ctt011
Liping, W., and Hien, W. N. (2007). The impacts of ventilation strategies and facade on indoor thermal environment for naturally ventilated residential buildings in Singapore. Build. Environ. 42 (12), 4006–4015. doi:10.1016/j.buildenv.2006.06.027
Liu, J., Zhang, Y., Chen, S., Nie, Z., and Yang, D. (2022). Simulation study of gas explosion propagation law in coal mining face with different ventilation modes. Front. Energy Res. 10. doi:10.3389/fenrg.2022.846500
Liu, P.-C., Lin, H.-T., and Chou, J.-H. (2009). Evaluation of buoyancy-driven ventilation in atrium buildings using computational fluid dynamics and reduced-scale air model. Build. Environ. 44 (9), 1970–1979. doi:10.1016/j.buildenv.2009.01.013
Liu, S., and Novoselac, A. (2016). The effect of deflectors on Air Diffusion Performance Index of adjustable diffusers: cooling condition (RP-1546). Sci. Technol. Built Environ. 22 (1), 67–74. doi:10.1080/23744731.2015.1078700
Mohamed, M. H., Alqurashi, F., Ramadan, A., and Thévenin, D. (2022). Enhancement attempts for a three-bladed savonius turbine performance. Front. Energy Res. 10. doi:10.3389/fenrg.2022.797868
Nie, Y., Deng, M., Shan, M., and Yang, X. (2023). Clean and low-carbon heating in the building sector of China: 10-Year development review and policy implications. Energy Policy 179, 113659. doi:10.1016/j.enpol.2023.113659
Odi, F. A. M. O. L., Nouh, M. b.S., Katerina, K., Tamer, A. R., Abdukaarem, A., and Amhamed, A. I. (2022). Window-windcatcher for enhanced thermal comfort, natural ventilation and reduced COVID-19 transmission. Buildings 12 (6), 791. doi:10.3390/buildings12060791
Omrani, S., Garcia-Hansen, V., Capra, B., and Drogemuller, R. (2017a). Natural ventilation in multi-storey buildings: design process and review of evaluation tools. Build. Environ. 116, 182–194. doi:10.1016/j.buildenv.2017.02.012
Omrani, S., Garcia-Hansen, V., Capra, B. R., and Drogemuller, R. (2017b). On the effect of provision of balconies on natural ventilation and thermal comfort in high-rise residential buildings. Build. Environ. 123, 504–516. doi:10.1016/j.buildenv.2017.07.016
Prianto, E., and Depecker, P. (2002). Characteristic of airflow as the effect of balcony, opening design and internal division on indoor velocity: a case study of traditional dwelling in urban living quarter in tropical humid region. Energy Build. 34 (4), 401–409. doi:10.1016/S0378-7788(01)00124-4
Prueksakorn, K., Piao, C.-X., Ha, H., and Kim, T. (2015). Computational and experimental investigation for an optimal design of industrial windows to allow natural ventilation during wind-driven rain. Sustainability 7 (8), 10499–10520. doi:10.3390/su70810499
Qin, B., Xu, X., Asawa, T., and Zhang, L. (2022). Experimental and numerical analysis on effect of passive cooling methods on an indoor thermal environment having floor-level windows. Sustainability 14 (13), 7880. doi:10.3390/su14137880
Ren, C., Cao, S.-J., and Haghighat, F. (2022). A practical approach for preventing dispersion of infection disease in naturally ventilated room. J. Build. Eng. 48, 103921. doi:10.1016/j.jobe.2021.103921
Song, P., Zhang, Z., and Zhu, Y. (2021). Numerical and experimental investigation of thermal performance in data center with different deflectors for cold aisle containment. Build. Environ. 200, 107961. doi:10.1016/j.buildenv.2021.107961
Strasszer, D., and Xydis, G. (2020). CFD-based wind assessment for suburban buildings. The case study of aarhus university, herning campus. Front. Energy Res. 8. doi:10.3389/fenrg.2020.539095
Tian, W., Han, X., Zuo, W., and Sohn, M. D. (2018). Building energy simulation coupled with CFD for indoor environment: a critical review and recent applications. Energy Build. 165, 184–199. doi:10.1016/j.enbuild.2018.01.046
Vera, S., Fazio, P., and Rao, J. (2010). Interzonal air and moisture transport through large horizontal openings in a full-scale two-story test-hut: Part 2 – CFD study. Build. Environ. 45 (3), 622–631. doi:10.1016/j.buildenv.2009.07.021
Walker, C., Tan, G., and Glicksman, L. (2011). Reduced-scale building model and numerical investigations to buoyancy-driven natural ventilation. Energy Build. 43 (9), 2404–2413. doi:10.1016/j.enbuild.2011.05.022
Wang, B., and Malkawi, A. (2019). Design-based natural ventilation evaluation in early stage for high performance buildings. Sustain. Cities Soc. 45, 25–37. doi:10.1016/j.scs.2018.11.024
Wang, Y., Yu, Y., Ye, T., and Bo, Q. (2021a). Ventilation characteristics and performance evaluation of different window-opening forms in a typical office room. Appl. Sci. 11, 8966. [Online]. doi:10.3390/app11198966
Wang, Z., Tian, Q., and Jia, J. 2021b. Numerical study on performance optimization of an energy-saving insulated window. Sustainability 13 (2), 935. doi:10.3390/su13020935
Wen, L., and Hiyama, K. (2018). Target air change rate and natural ventilation potential maps for assisting with natural ventilation design during early design stage in China. Sustainability 10 (5), 1448. doi:10.3390/su10051448
Wong, N. H., Feriadi, H., Lim, P. Y., Tham, K. W., Sekhar, C., and Cheong, K. W. (2002). Thermal comfort evaluation of naturally ventilated public housing in Singapore. Build. Environ. 37 (12), 1267–1277. doi:10.1016/S0360-1323(01)00103-2
Xie, Y., Qin, J., Zhu, J., Liu, G., Zheng, Z., and Yuan, H. (2021). Experimental research on ventilation characteristics of a main engine room in a jack-up offshore platform. Appl. Ocean Res. 117, 102897. doi:10.1016/j.apor.2021.102897
Yang, X., Zhong, K., Kang, Y., and Tao, T. (2015). Numerical investigation on the airflow characteristics and thermal comfort in buoyancy-driven natural ventilation rooms. Energy Build. 109, 255–266. doi:10.1016/j.enbuild.2015.09.071
Yuan, X., Xu, X., Wang, Y., Liu, J., Kosonen, R., and Cai, H. (2020). Design and validation of an airflow management system in data center with tilted server placement. Appl. Therm. Eng. 164, 114444. doi:10.1016/j.applthermaleng.2019.114444
Zhang, C., Zou, D., Huang, X., and Wu, Y. (2023). Study on hot air heating characteristics of greenhouse in cold region. Front. Energy Res. 11. doi:10.3389/fenrg.2023.1038182
Zhang, F., and Ryu, Y. (2021). Simulation study on indoor air distribution and indoor humidity distribution of three ventilation patterns using computational fluid dynamics. Sustainability 13 (7), 3630. doi:10.3390/su13073630
Keywords: deflector, velocity distribution, natural ventilation, numerical simulation, reduced-scale model
Citation: Wang C, Jin M and Cheng H (2024) Influence of deflectors on indoor airflow velocity distribution under natural ventilation conditions. Front. Energy Res. 12:1327577. doi: 10.3389/fenrg.2024.1327577
Received: 25 October 2023; Accepted: 28 March 2024;
Published: 10 April 2024.
Edited by:
Michael Carbajales-Dale, Clemson University, United StatesReviewed by:
Giacomo Salvadori, University of Pisa, ItalyJun Wu, Alameda County Public Health Department, United States
Copyright © 2024 Wang, Jin and Cheng. This is an open-access article distributed under the terms of the Creative Commons Attribution License (CC BY). The use, distribution or reproduction in other forums is permitted, provided the original author(s) and the copyright owner(s) are credited and that the original publication in this journal is cited, in accordance with accepted academic practice. No use, distribution or reproduction is permitted which does not comply with these terms.
*Correspondence: Haifeng Cheng, cheng_hf@163.com