The driving factors of spatial differences on the whole life cycle carbon emissions of the construction industry: from the analysis perspective of total factor productivity
 Zhengyan Zhang
  Zhaoqi Wu
 Binqing Cai
- School of Management, Fujian University of Technology, Fuzhou, China
The energy saving and emissions reduction of the construction industry are crucial for China to achieve the “carbon peaking and carbon neutrality” goals. In order to promote the green development of the life cycle of the construction industry and improve the efficiency of emissions reduction. This paper examines the spatial-temporal distribution of life cycle carbon emissions in China’s construction industry (LCCECI) from 2004 to 2018. It uses the SBM-Malmquist total factor productivity (TFP) index to measure technological progress and establishes the spatial econometric model based on the STIRPAT model. The study investigates the driving factors of the LCCECI at the provincial and regional levels, aiming to provide suggestions for low-carbon development in the construction industry. The research results are as follows. ① The growth in the SBM-Malmquist TFP index of the construction industry distinctly curbs the LCCECI. ② Total population and urbanization level are not the primary driving factors for the LCCECI. The growth of per capita GDP significantly induces the LCCECI, while concurrently exhibiting a notable inhibitory effect on the LCCECI of neighboring regions. ③ The improvement of the SBM-Malmquist TFP index is conducive to the reduction of the LCCECI in the three major regions. The per capita GDP has the largest positive driving effect of the LCCECI in the eastern region, and the urbanization level the urbanization rate only significantly inhibits the growth of the LCCECI in the central region.
1 Introduction
In recent years, climate change has had an unprecedented impact on a global scale. The frequent occurrence of extreme and unusual weather has led to threats to food production, and the accelerated rise in sea level has exacerbated the extent of marine disaster causation. The main cause of climate change is excessive CO2 emissions. The 2018 Global Status Report on Energy and Carbon Dioxide published by the International Energy Agency states that the total amount of carbon dioxide produced by global energy consumption reached a historical high of 33.1 billion tons in 2018 (IEA, 2019). In order to deal with climate change, the Paris Agreement, adopted in 2015 and signed by 186 countries worldwide, aims to significantly reduce global greenhouse gas emissions and limit the global temperature increase to below 2°C (Cheng et al., 2020). As a rapidly developing carbon-emitting country, China has committed to peak carbon emissions by 2030 and achieve carbon neutrality by 2060. Since the reform and opening up, in pursuit of rapid economic development, China’s long-term extensive development mode has resulted in a large amount of energy consumption and excessive carbon dioxide emissions. Along with the economic development and the continuous improvement of urbanization level, the carbon emissions of construction industry (CECI) and its proportion of total carbon emissions are increasing continuously. According to data from the China Statistical Yearbook, the CECI accounted for approximately 27.9%–34.3% of the total CO2 emissions during 1995–2016 (Wang et al., 2019). It can be seen that the construction industry is one of the important sources of global greenhouse gas emissions, and building carbon reduction is an important task in addressing climate change. Therefore, energy conservation and emissions reduction in the construction industry are crucial for China to achieve the carbon peaking and carbon neutrality goals.
Recently, more and more scholars have begun to pay attention to the CECI and its driving factors (Zhu et al., 2022; Zhang et al., 2022; Zhang et al., 2021; Sun et al., 2023; Li et al., 2021; Yang et al., 2021). Technological progress, as one of the key driving factors, has received widely attention. Because of the abstract nature of technological progress, there is no direct measurement of technological progress level. Most scholars use the energy efficiency which is single input and single output as a measurement of technological progress to study the impact of technological progress on the CECI (Xu and Wang, 2020; Shi et al., 2017; Lu et al., 2016; Song et al., 2018). However, technological progress is a broad concept. And compared to the energy efficiency of single input and single output, the total factor productivity (TFP) can reflect the input-output situation of the construction industry more comprehensively, so as to measure the technical progress of the construction industry more systematically. At the same time, existing studies are mostly conducted under the framework of non-spatial econometrics, which often ignores spatial characteristics, leading to the failure of traditional models (Yandell and Anselin, 1990). The CECI in each province of China and its influencing factors are not independent entities, and the links among the provinces are becoming closer with the evolution of socioeconomic activities and urbanization process, which has led to more complex spatial connections between the provincial CECI. In addition, previous studies lack relevant research on the CECI and its driving factors from the life cycle perspective. As a frequently overlooked member of the high-carbon industries, the CECI is not only generated during the construction phase, but also encompass the stages of building materials manufacturing and transportation, building operation and demolition from the life cycle perspective. And each of these stages contains enormous potential for carbon reduction and energy conservation. Understanding the changing trend of the CECI’s footprint in various provinces of China from the life cycle perspective can help achieve carbon neutrality throughout the life cycle of the construction industry, including design, construction, operation and other stages. Therefore, by analyzing the spatial characteristics and driving factors of the CECI from a life cycle perspective, we can better understand the contribution of each factor to carbon emissions. This will help us identify priority areas for improvement and regions that require focused attention, in order to formulate targeted and effective low-carbon policies and measures. Considering spatial characteristics and driving factors in the formulation of policies for environmental sustainability and low-carbon development in the construction industry will provide policymakers with comprehensive and accurate information and guidance to achieve sustainable development goals.
Based on the above analysis, this study has three main contributions to the literature. Firstly, this paper described the spatiotemporal distribution pattern of the life cycle carbon emissions of the construction industry (LCCECI) in China, which provided a new perspective for the analysis of the CECI. Secondly, this paper proposed an extended Stochastic Impact by Regression on Population, Affluence, and Technology (STIRPAT) model and optimized the indicator representing technological progress. The SBM-Malmquist TFP was taken as the index of technological progress, which can measure the technological progress of the construction industry in a more comprehensive and systematic way. Finally, a spatial econometric model was established to explore the spatial-temporal correlation and heterogeneity of the driving factors on the LCCECI. The statistical inference was more accurate and reasonable when considering the spatial characteristics of the LCCECI among provinces in China.
The remainder of the study is organized in the following manner. The review of previous literature is given in the second section, the third section describes the methodology and data adopted to achieve the objectives of the study fourth section provides the results and discussion over the finding of the study at the last recommendations suggested by the authors are narrated.
2 Literature review
With the increasing global population and rapid urbanization, the development of the construction industry has exerted tremendous pressure on energy consumption and environmental pollution. Researching carbon emissions in the construction industry is of great significance in understanding climate change, promoting sustainable development, achieving economic benefits, and improving environmental health. Existing literature research on carbon emission mainly focuses on three aspects, including the analysis of carbon emission research perspective, the driving factors of technological progress and the analysis of research methods.
The research on the driving factors of the CECI has been widely concerned by scholars at domestic and overseas. From the national level, scholars abroad have studied the impact of technological progress on the construction industry in Norway and Pakistan (Grepperud and Rasmussen, 2004; Khan et al., 2020). However, in recent years, most studies on the driving factors of the CECI have focused on China. For examples, Shi et al. (2017) used the structural decomposition analysis method to analyze the contribution value of various driving factors to the increment of the CECI. Li et al. (2017) used ridge regression to quantitatively analyze the impact of various explanatory variables on the CECI in China. From the regional level, Sun et al. (2023) characterized the spatiotemporal evolution of the CECI at the provincial level. Huo et al. (2022) analyzed the network structure characteristics and driving factors of the CECI based on provincial data in China. In addition, some scholars have studied variables related to the CECI in China, such as the marginal abatement cost, the ecological economic efficiency, the carbon emission intensity, the carbon emission efficiency, the embodied carbon emission, and the energy-economic efficiency (Feng and Wang, 2015; Hui and Sui, 2018; Song et al., 2018; Chen et al., 2019; Cao et al., 2022; Xu et al., 2022; Zhu et al., 2022). However, although many scholars have studied the driving factors that influence the CECI, few studies have analyzed the driving factors of carbon emissions from the perspective of life cycle. Understanding the carbon footprint trends of the construction industry in various provinces in China from the life cycle perspective will help to achieve carbon neutrality of the construction industry in the life cycle from the design, construction, operation, and other stages to make corresponding emissions reduction strategies (Wu et al., 2019).
Compared to reducing CO2 emissions by controlling economic growth, promoting technological progress in the construction industry is a more reasonable approach (Wen et al., 2020). Selecting reasonable indicators of technological progress is a prerequisite for studying the impact of technological progress on the CECI. There have been many studies that have revealed the role of technological factors in reducing the CECI, and have attempted to measure technological progress from different perspectives. Some scholars used the energy intensity (EI) to represent the technological progress, and the results shown that reduction of EI can significantly reduce carbon emissions from urban residential buildings and CECI in China (Li et al., 2017; Huo et al., 2020; Zhang et al., 2021). Besides, some studies expressed technological progress in terms of the technical assembly rate in the construction industry. These studies believed that the improvement of the technical assembly rate in the construction industry can significantly promote the carbon productivity, the ecological economic efficiency and the energy environmental efficiency (Feng and Wang, 2015; Xiang and Zhang, 2020). In addition, some scholars used the number of patents in the construction industry and the energy-saving technology level (GDP generated per unit of energy consumption) as indicators of technological progress in the construction industry (Hui and Sui, 2018; Cao et al., 2022). However, the technological progress is a concept with a relatively broad scope. Compared with the measure of the indicators of technological progress from a single perspective in the above studies, the TFP considering multi-input and multi-output can more comprehensively and systematically measure the technological progress of the construction industry.
Currently, two decomposition methods, which are structural decomposition method (SDA) and index decomposition analysis (IDA), are commonly adopted when analyzing the changes in energy consumption and CO2 emissions caused by different driving factors (Wang and Feng, 2018). In the relevant studies on the SDA, Shi et al. (2017) used the SDA method to study the drivers of the CECI in China. However, because this method is based on input-output table, the use of this method is limited (Wang and Feng, 2018). Compared with SDA method, IDA method is more convenient to build model, and the data requirement is relatively low (Zhang et al., 2021). Commonly used IDA methods include the Kaya, LMDI and STIRPAT model. For example, Song et al. (2018) conducted a decomposition analysis of the driving factors of the CECI from four aspects based on the LMDI model. Zhang et al. (2021) and Huo et al. (2020) used the STIRPAT model to explore the impact of urbanization on the CECI. In addition, there are also some studies that used econometric model to explore the driving factors of the CECI. For example, some scholars used the Spatial Durbin Model (SDM) to study the heterogeneity of marginal abatement costs in the construction industry of China from the perspective of factor flows (Cao et al., 2022). And some scholars used the spatial econometric model to analyze the spatial distribution and the driving factors of the CECI in China (Wen er al., 2020). In summary, some literature has studied the driving factors of the regional CECI using the STIRPAT model and panel data, but there are relatively few studies that combine spatial econometric models with the STIRPAT model. However, considering the spatial characteristics of the LCCECI in different provinces in China, the statistical inference will be more accurate and reasonable.
In conclusion, there still exist certain deficiencies in existing research: 1) Most studies only covered certain stages of the CECI, but few literature analyzed the CECI from the life cycle perspective. 2) Most of the indicators of technological progress in the literature only measured technological progress from a single perspective, which cannot comprehensively evaluate the effect of technological progress on the CECI. 3) Existing studies rarely take into account the spatial correlation of the CECI in different regions and the spatial heterogeneity of the CECI by different driving factors, which make the model inference not accurate enough.
In order to solve the above problems, based on the perspective of the life cycle, this paper analyzes the spatial and temporal distribution pattern of the LCCECI in China. The SBM-Malmquist TFP index is used as an indicator to measure technological progress. At the same time, based on the STIRPAT model, a spatial econometric model is established to study the driving factors of the LCCECI in provinces and three main regions of China, in order to provide suggestions for promoting low-carbon development of construction industry in China.
3 Methodology and data
3.1 Research method
The main research methods used in this paper are STIRPAT model and spatial econometric model. Firstly, STIRPAT model is used to select indicators, and then, based on STIRPAT model, spatial econometric model is used to analyze the spatial autocorrelation and spatial spillover effects of LCCECI in different provinces of China.
3.1.1 STIRPAT model
The IPAT model is a classic approach to study environmental influences, which characterizes the relationship between environmental loads and economic growth by linking population size, affluence and technology progress. On this basis, Dietz and Rosa (1997) proposed the random regression impact model of IPAT, namely, the STIRPAT model:
where
Considering the development of China’s construction industry, and referring to relevant studies (Hui and Su, 2018; Song et al., 2018; Zhu et al., 2022), the total population and urbanization rate were selected as indicators of population size, per capita GDP as indicators of affluence, and SBM-Malmquist TFP index as indicators of the level of technology. The construction intensity and the energy consumption structure of the construction industry are used as control variables. The extended STIRPAT model is as follows:
where I is the LCCECI in China (106 tons), P is the total population (104 people), UR is the urbanization rate (%), A is the GDP per capita (Yuan/person), T is the SBM-Malmquist TFP index, CI is the construction intensity (104 m2), and ES is the energy consumption structure (%).
3.1.2 Spatial econometrics model
The spatial dependence that geographic regions have on each other breaks the assumption of classical econometric models that samples are independent of each other. Therefore, the spatial econometric model is adopted to reflect the spatial correlation of samples. The analysis of Moran’s I index is a method of measuring spatial autocorrelation by correlating the similarity of spatial values adjacent to regions (Anselin et al., 1991). In this paper, Moran’ I index is used to calculate the spatial autocorrelation of the LCCECI in each province of China, and to analyze the spatial dependence of the LCCECI in each province of China. The equation for Moran’ I index is shown below:
where n represents the number of provinces; xi and xj are the LCCECI in provinces i and j, respectively;
At present, spatial econometric models mainly include the Spatial Autoregressive Model (SAR), the Spatial Error Model (SEM), and the Spatial Durbin Model (SDM) (Wen et al., 2020). Among them, the SDM combines the above two models and considers both the spatial autocorrelation of the explanatory and explained variables. Therefore, this paper intends to use the SDM model to analyze the spatial spillover effect of the LCCECI. The model expression is as follows:
where
In this paper, the LCCECI of a district are influenced not only by its own population size, affluence and technology progress, but also by those of surrounding areas. Therefore, this paper combines the spatial econometric model and STIRPAT model, and the model expression is as follows:
where
3.2 Data sources and processing
Due to the lack of building materials consumption data for each province before 2004 and the special factor of the COVID-19 pandemic causing economic production to halt at the end of 2019, this paper has chosen data from 2004 to 2018 for a period of 15 years (three 5-year periods) to avoid the influence of these factors on the calculation of carbon emissions in the construction industry. The research sample covers 30 provinces in China, excluding Tibet and Hong Kong, Macao and Taiwan. According to China’s division of administrative regions, the eastern region includes 11 provinces and cities: Beijing, Tianjin, Hebei, Liaoning, Shanghai, Jiangsu, Zhejiang, Fujian, Guangdong, Shandong and Hainan; the central region includes 8 provinces and cities: Shanxi, Jilin, Heilongjiang, Anhui, Jiangxi, Henan, Hubei and Hunan. The western region consists of 11 provinces and cities: Inner Mongolia, Guangxi, Chongqing, Sichuan, Guizhou, Yunnan, Shaanxi, Gansu, Ningxia, Qinghai and Xinjiang. Based on the existing research, six driving factors related to the LCCECI were selected as explanatory variables in this paper, namely, total population, urbanization rate, GDP per capita, SBM-Malmquist TFP index, construction intensity and energy consumption structure. The definitions and data sources of variables are shown in Table 1. The underlying data of all variables are obtained from the China Statistical Yearbook, the China Statistical Yearbook of Construction Industry and the China Energy Statistical Yearbook.
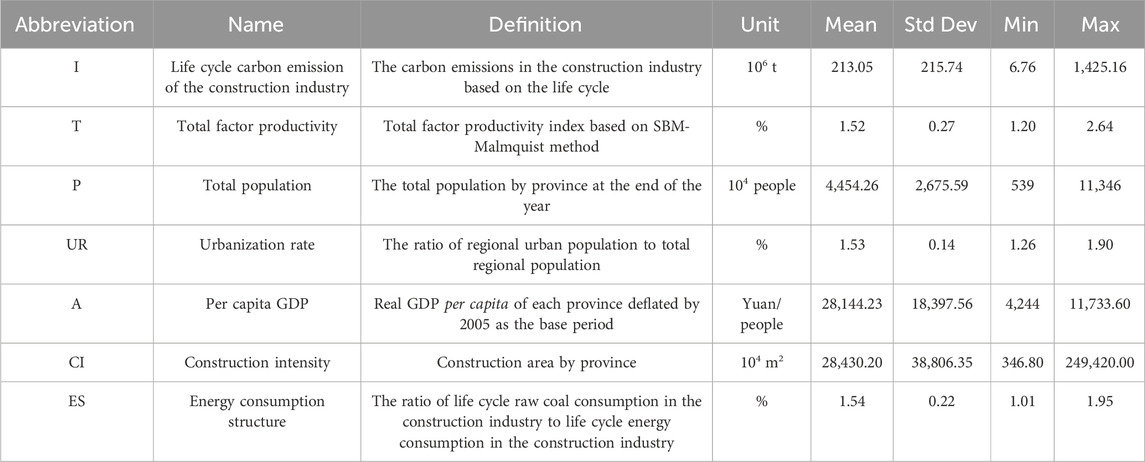
TABLE 1. Explanation of model variables.
3.2.1 LCCECI (I)
As the dependent variable of this paper, the LCCECI is divided into 6 stages, including building materials manufacturing stage, building materials transportation stage, building construction stage, building operation stage, building demolition stage, construction and demolition (C&D) waste disposal stage, with reference to the research method of Zhang and Wang, (2016). The LCCECI is equal to the sum of the emissions from all six stages. The CO2 emissions for each stage are calculated according to the methodology recommended by the IPCC:
where AD is activity data, and EF is the emission factor, which is the emission per unit activity. The specific definitions of AD and EF varied in the different stages. In the material manufacturing stage, AD is the quantity of a certain material, and EF is the CO2 emission factor when that material is produced. In the material transportation stage and waste disposal stage, AD is the quantity of transportation multiplied by the transportation distance, and EF is the emission factor for a specific transportation method. In the building construction stage, building operation stage and demolition stage, AD is the energy consumed by various activities in each stage, and EF is the emission factor of a particular energy source such as coal, oil, or gas. The results of the calculations are shown in Supplementary Tables S1, S2 of the appendix.
3.2.2 SBM-Malmquist TFP index (T)
As an independent variable for measuring technological progress in this paper, the SBM-Malmquist TFP index with multiple inputs and multiple outputs can reflect technological progress more comprehensively than the energy intensity or technical assembly rate of single input and output commonly used in existing studies. Therefore, this paper takes the SBM-Malmquist TFP index as an indicator to measure the technological progress and fill the research gap. The calculation formula is as follow:
where
4 Empirical results and analysis
4.1 Spatial-temporal evolution of the LCCECI
This paper calculates the CO2 emission of the construction industry in each stage of the whole life cycle and the LCCECI in each province of China (excluding Tibet, Hong Kong, Macao and Taiwan) from 2004 to 2018. From the stage level, according to the calculations, the LCCECI mainly comes from the building materials manufacturing stage and the building operation stage, which account for 97.01% of the total emissions. At the regional level, the eastern region accounts for over half of the national carbon emissions, while the central region’s carbon emissions are slightly higher than the western region by 5%. The eastern region consistently remains the primary source of China’s LCCECI, and the average annual growth rate of carbon emissions in the eastern region is the highest among the three regions, which is 27.67%. In terms of the spatial-temporal distribution pattern of China’s LCCECI (Figure 1), there is a decreasing gradient from the eastern coastal areas to the western regions. And over the past 15 years, the proportion of provinces with carbon emissions between 200 and 500 million tons has increased from 6.65% in 2004 to 36.67% in 2018.
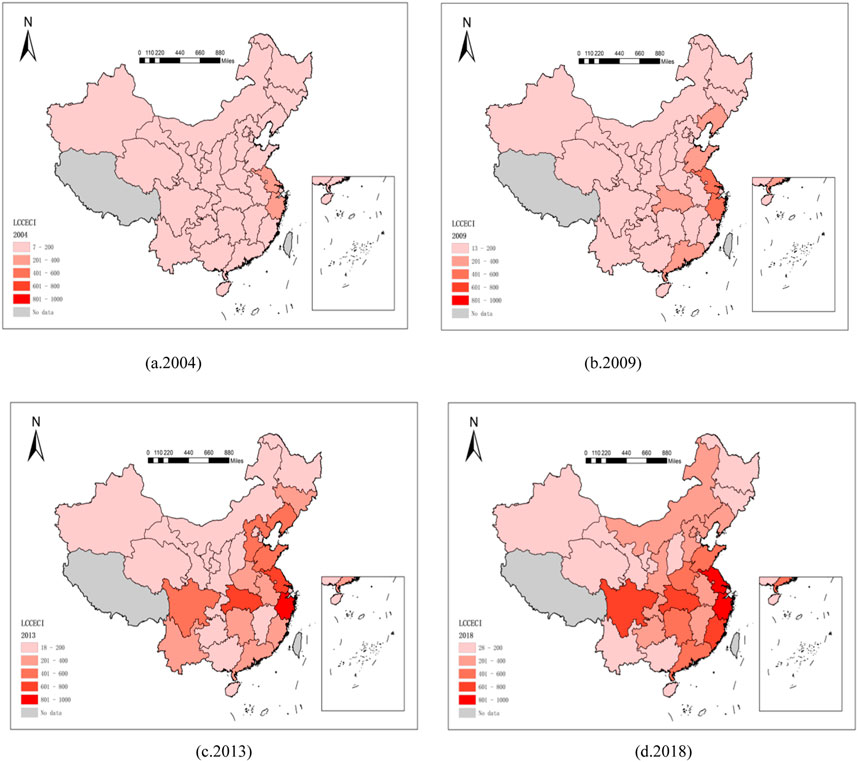
FIGURE 1. Spatial-temporal distribution pattern of China’s LCCECI from 2004 to 2018.
4.2 SBM-Malmquist TFP index
The SBM-Malmquist index greater than 1 indicates that the efficiency has increased compared with the previous year. Figure 2 shows the SBM-Malmquist index of the construction industry in the three major regions during 2004–2018. From the figure, we can find that the SBM-Malmquist index of the construction industry in China is greater than 1 in all years except for the period from 2007 to 2008、2010 to 2011 and 2013 to 2014. And the national average value is 1.06, which indicates that the life cycle total factor productivity of the construction industry in China has greatly improved during 2004–2018, with an improvement of 6%. Comparing the SBM-Malmquist index of the construction industry in the three regions. It can be seen that in the initial stage, there was a significant gap in the SBM-Malmquist TFP index of the construction industry in the three regions, which may be caused by the unequal economic development level and resource distribution among the regions. With the passage of time, the progress of technology, the promotion of policies and the optimal allocation of resources, the SBM-Malmquist TFP index of the construction industry in the three regions gradually converged, indicating that there is uneven regional variation in the changes in TFP of the construction industry and certain spatial disparities exist.
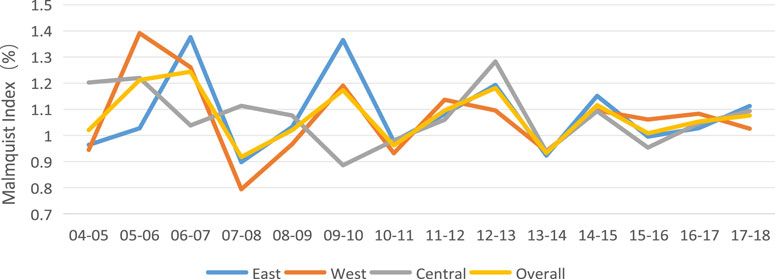
FIGURE 2. The SBM-Malmquist TFP index of the construction industry in the three regions of China during 2004–2018.
4.3 Spatial autocorrelation analysis and model selection
4.3.1 Spatial autocorrelation analysis
In this paper, the spatial weight matrix
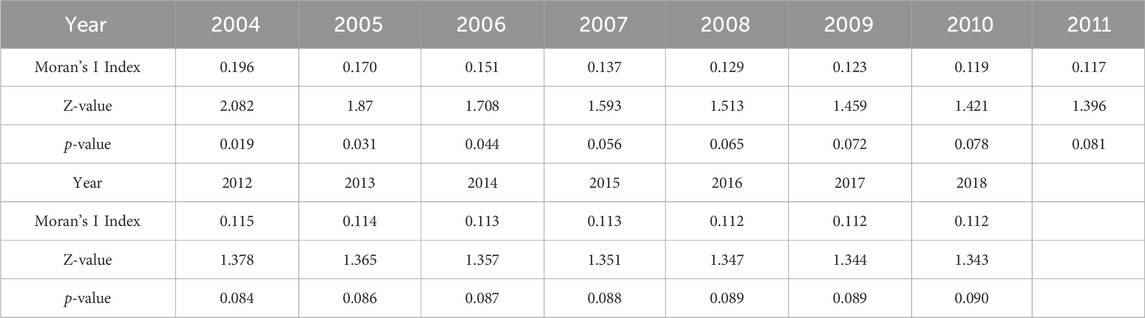
TABLE 2. Moran’s I index of the LCCECI in China from 2004–2018.
4.3.2 Spatial econometric models
In order to verify the feasibility of each variable and improve the reliability of the model, multicollinearity, panel unit root and cointegration tests were carried out on each variable. The results showed that the tolerance of explanatory variables and variance expansion factor all met the conditions, there was no serious multicollinearity, and the data of each variable were all integrated of order 1 and the sequence was stable.
Then, on this basis, the spatial econometric model is selected. Firstly, the applicability of the SEM and the SAR model was investigated by performing traditional and robust LM tests based on the mixed OLS regression model. The null hypothesis of the LM test is no spatial autocorrelation. According to the discriminant criteria proposed by Anselin et al. (1991), if
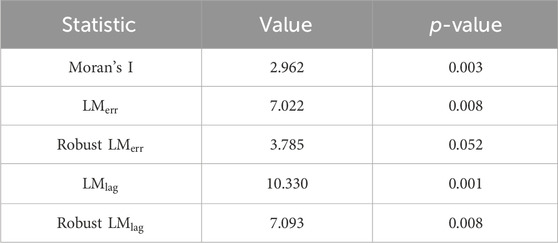
TABLE 3. The results of LM test.
Secondly, LR test and Wald test are used to verify whether the SDM model will degenerate into a SEM model or a SAR model, because the SEM model and SAR model are special cases of the SDM model. The results are presented in Table 4. Both LR and Wald tests reject the null hypothesis that the SDM degenerates into either a SEM or a SAR model, indicating a good fit of the SDM model. Thus, this paper establishes the SDM model with two-way fixed effects to decompose and analyze the spatial effects of the driving factors of the LCCECI.
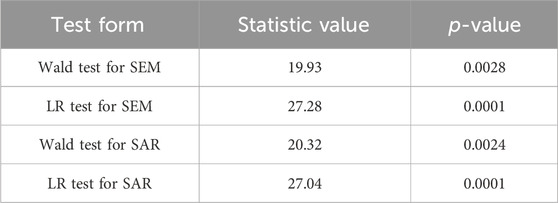
TABLE 4. The results of LR test and Wald test.
4.4 Spatial spillover effect analysis
4.4.1 Spatial effect decomposition and analysis
The R2 of the two-way fixed effects SDM model which is 0.851 (see Table 6), indicating that the selection of the six factors driving of the LCCECI is reasonable. In other words, the total population, urbanization rate, per capita GDP, SBM-Malmquist TFP index, construction intensity, and energy consumption structure can explain 85.1% of the LCCECI variation. The SDM model considers the spatial correlation between the explanatory and explained variables in different regions. However, the spatial lag term contained in the model will cause that the estimated coefficient corresponding to the explanatory variables to be no longer simply interpreted as the marginal effect between variables. Therefore, the marginal spillover effect needs to be decomposed into direct effects and indirect effects (Wang and Kong, 2021). The decomposition results are shown in Table 5.
(1) From the perspective of technology level factor, the estimated values of the direct effect and total effect of the SBM-Malmquist TFP index are significantly negative at the level of 1%, which indicates that the improvement of the TFP of the construction industry in a certain province will reduce the LCCECI of that province. This finding is consistent with the research results of Zhou et al. (2023) who all believe that the improvement of technological level has a significant inhibition effect on carbon emissions. The improvement of technological levels will promote energy efficiency (Berkhout et al., 2000; Hanley et al., 2009), accelerate the development and application of new energy, reduce its use cost, and realize the substitution between fuels (Kang et al., 2018). Therefore, by improving the technical level of all stages of the whole life cycle of the construction industry, the current extensive development model with high energy consumption and high carbon emissions can be changed, so as to improve the energy utilization efficiency of the construction industry and reduce the LCCECI. For example, improve the main building materials production technology in the building materials manufacturing stage and encourage construction enterprises in the construction stage to adopt more advanced and environmentally friendly construction methods and equipment, such as modular buildings, prefabricated components, etc., which can effectively reduce the LCCECI.
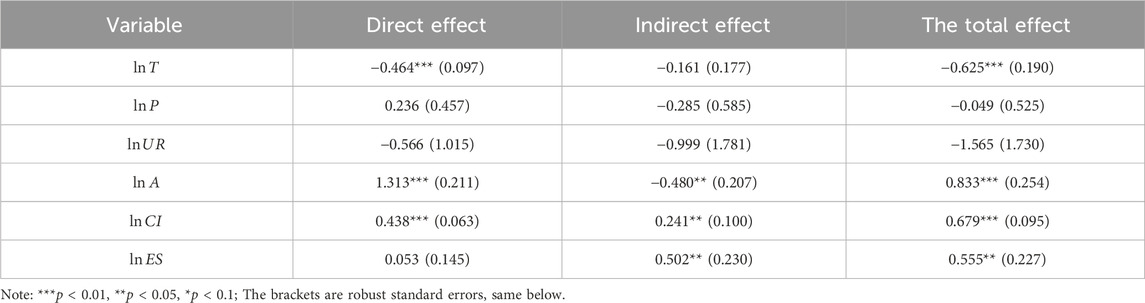
TABLE 5. The direct and indirect effects of SDM model.
Furthermore, although the estimated indirect effects of SBM-Malmquist TFP index are negative, they have not passed the significance test, indicating that the spatial spillover effects of SBM-Malmquist TFP index are not significant. On the one hand, due to the regional effect of technology diffusion in the promotion of construction technology, that is, the province with the best application of a certain construction technology will be the center to promote and publicize the technology to the surrounding areas, and the diffusion effect will become worse and worse, resulting in an insignificant spatial spillover effect of SBM-Malmquist TFP index. On the other hand, because some provinces may have strong barriers to the flow of technology, with technological elements being influenced by these barriers, interprovincial technology transfer becomes more challenging, which leads to the insignificant spillover effect of SBM-Malmquist TFP index.
(2) From the perspective of population size factor, the estimated value of the direct effect, indirect effect, and total effect of total population and urbanization rate on the LCCECI have not passed the significance test. This indicates that the total population and the urbanization have no significant impact on the LCCECI. According to previous studies, there is no uniform conclusion on the relationship between total population, urbanization and carbon emissions. Some scholars argue that the total population and the urbanization lead to increased energy consumption, thus stimulating carbon emissions (Fan et al., 2006; Lin and Liu, 2010; Poumanyvong and Kaneko, 2010; Madlener and Sunak, 2011; Zhou and Dai, 2013; Wang et al., 2016). However, other studies have found that population size and urbanization significantly reduce carbon emissions. The reason is that urbanization can improve the efficiency of resource allocation, and the economies of scale brought about by population and economic activities play an important role in controlling and reducing carbon emissions (Sharma, 2011; Sadorsky, 2014). And some scholars propose that there may be a nonlinear relationship between urbanization and carbon emissions (Xie and Liu, 2019). Due to the rapid expansion of cities, a large number of people migrated from rural areas to urban areas, leading to a rise in housing and transportation demands. And the corresponding construction led to an increase in carbon emissions. However, with the further intensification of urbanization, severe environmental pollution has forced the government to optimize the development mode and promote clean energy technologies, leading to a reduction in carbon dioxide emissions. Consistent with the findings of Rafiq et al. (2016), Xie and Liu, (2019) and Lu et al. (2018), our research also found no clear linear positive or negative correlation between the total population, urbanization and the LCCECI. Therefore, in the context of accelerated urbanization in China, further increasing the urban population proportion and advancing the urbanization process are not likely to have a significant impact on the CECI in specific provinces or even surrounding regions.
(3) From the perspective of affluence factor, the direct, indirect, and total effects of per capita GDP are all significant, with values of 1.313, −0.480, and 0.833, respectively. This indicates that the increase in per capita GDP not only increases the LCCECI but also significantly reduce the LCCECI of the surrounding areas. However, some previous studies have reached different conclusions. Some studies have shown that economic growth and carbon emissions satisfy the Kuznets curve, that is, they have an inverted U-shaped relationship, with environmental pollution first increasing until it reaches a threshold and then decreasing during economic growth (Jeon, 2022). In other words, in the initial stage of the economy, as the scale of economic activity increases, the level of pollution also increases. However, in the later stage of economic development, the environment gradually improved due to the transformation of economic structure to service and information-intensive industries, the formulation of stricter environmental regulations by the government, the improvement of people’s environmental awareness, and the application of clean energy technologies. Since China is still in the early stage of economic development and has long relied too much on investment and heavy industry development, its future economic development will still need to consume a lot of energy. With the development of the economy and the expansion of the construction industry, the carbon emissions of the construction industry will continue to rise. In addition, regions with higher per capita GDP are more likely to attract talents, and the accumulation of talents will increase infrastructure and housing construction, promoting the development of the local construction industry. This will produce a “siphon effect,” which will increase the life-cycle carbon emissions of the local construction industry while reducing the life-cycle carbon emissions of the construction industry in the surrounding areas, that is, there is an obvious spatial spillover emission reduction effect of per capita GDP.
(4) Based on the estimated results of various control variables, construction intensity has a certain promotional effect on the LCCECI in a specific province, and there is a significant spatial spillover effect. On one hand, the increase in construction intensity means there are more construction projects and longer construction periods. Buildings require a significant amount of energy during the construction process, such as for machinery, lighting, and heating. This leads to increased energy consumption and, in turn, increased carbon emissions. On the other hand, construction processes require a large amount of building materials, such as cement, steel, and wood. The increase in construction intensity usually results in higher material demands and longer transportation distances. The production and transportation processes of these materials also require energy, further increasing carbon emissions. The energy consumption structure is positively correlated with the LCCECI, and there is a significant spatial spillover effect as well. This implies that if a specific province adjusts its energy consumption structure in the construction industry and reduces the proportion of raw coal usage, it can encourage neighboring provinces to reduce the LCCECI. This proactive approach by the specific province can stimulate neighboring provinces and provide them with an example to follow. They will start to appreciate the significance of reducing coal usage and begin contemplating measures to adjust their energy consumption structure accordingly.
4.4.2 Spatial heterogeneity analysis
According to Figure 1, the spatial distribution pattern of LCCECI gradually decreases from the eastern coastal region to the western region, and there are great differences of LCCECI in the in the eastern, western and central regions of China. Therefore, it is necessary to analyze the spatial heterogeneity of the LCCECI, so that the government can formulate differentiated carbon emission reduction measures according to the actual situation of different regions. Based on the model established above, the spatial heterogeneity analysis in the three regions is conducted. The results are shown in Table 6, from which it can be seen:
(1) The improvement of the SBM-Malmquist TFP index is all conducive to reducing the LCCECI in the eastern, western and central regions. However, in different regions, the emission reduction effect of the SBM-Malmquist TFP index is different, and the emission reduction effect of the central and western regions is greater than that of eastern region. This may be due to the higher level of economic development and marketization in the eastern region, compared with the central and western regions, there is a more complete construction system and technical foundation, and the proportion of clean energy use has been much higher than that in the central and western regions. In addition, the overall development scale of the construction industry in the central and western regions is small, the technology is relatively backward, and the space for emission reduction brought by technological progress is larger, which makes the demonstration effect of technological progress on the central and western regions play a role and effectively inhibits the LCCECI of the central and western regions.
(2) The total population has no significant effect on the LCCECI in the three regions. However, the increase of urbanization rate can significantly inhibit the growth of the LCCECI in the central region, but has no obvious effect in the eastern and western regions. According to the American urban geographer Northam’s three-stage theory of urbanization development, that is, the process of urbanization needs to go through three stages: the early stage, the middle stage and the late stage (with urbanization rates below 30%, between 30% and 70%, and between 70% and 90%, respectively). As can be seen from Figure 3, some parts of the central region have approached the urbanization level of the eastern region, indicating that the central region is in a stage of rapid urbanization development, probably because the central region has adopted active urbanization policies and measures, providing more opportunities for urban construction and development. Government support and investment in urban planning, infrastructure construction, land use and other aspects also provide a basis for the rapid development of urbanization, and also provide a basis for strengthening the agglomeration effect of the construction industry. The scale economy brought by population and economic activities plays an important role in controlling and reducing the LCCECI in the central region.
(3) The per capita GDP has a significant positive effect on the LCCECI in the eastern, central and western regions, but the positive driving effect is the largest in the eastern region. Benefiting from its geographical advantages and national policy support, the eastern region has a higher level of social and economic development. In 2018, the per capita GDP of the eastern region reached 64,376 Yuan/person, much higher than 34,060 Yuan/person in the central region and 33,249 Yuan/person in the western region. It may be that with the enrichment of material and cultural life, the demand for construction tends to be diversified, which increases the scale of construction to a certain extent. In addition, regions with high per capita GDP can drive housing demand and promote the construction of supporting infrastructure, thus increasing the construction area and material consumption of the construction industry, causing the rapid rise of the LCCECI.
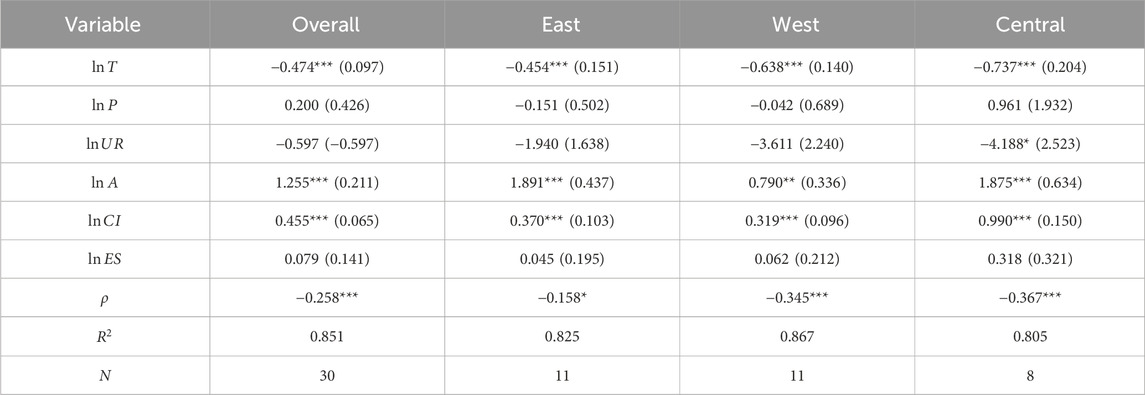
TABLE 6. Estimation results of influencing factors of the LCCECI in three major regions of China.
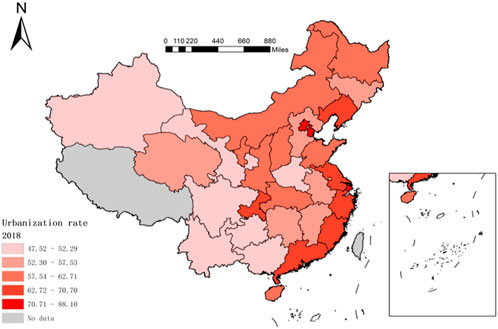
FIGURE 3. Distribution of urbanization rate by provinces in the country of China in 2018.
4.5 Robustness test
4.5.1. Robustness tests with different spatial weight matrices
In order to test the robustness of the model, this paper constructs a spatial distance matrix and a spatial economic matrix based on the study of Jiao et al. (2018), which incorporates regional geographic distance and economic activities into the framework. The results are shown in Table 7, whether using the spatial distance matrix or the spatial economy matrix, technological progress still has significant changes in the LCCECI. Although the coefficients of the estimation results change, their direction and significance level do not change fundamentally, and the R2 of the 0–1 adjacency matrix is 0.851, which is larger than the other weight matrices. This indicates that the results are robust and reliable.
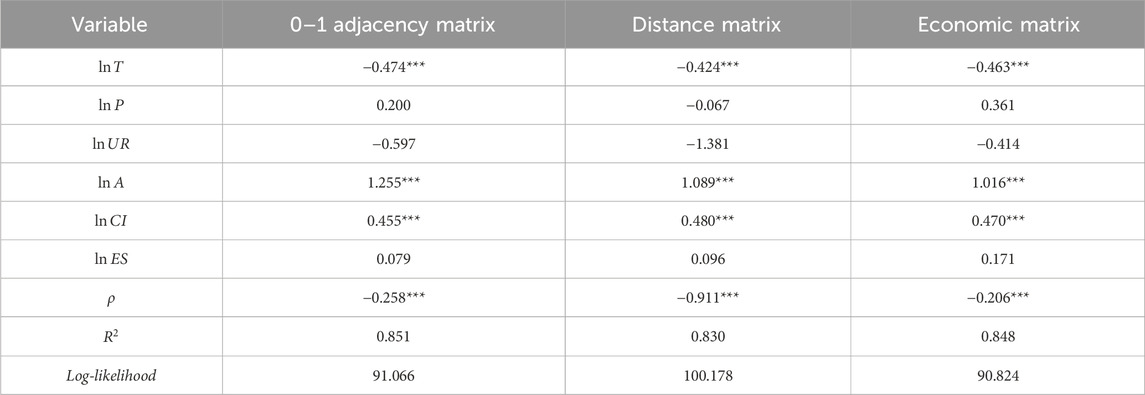
TABLE 7. Robustness tests with different spatial weight matrices.
4.5.2 Robustness tests with alternative measures
In order to assess the consistency of the spatial regression results, the construction intensity (CI) and energy consumption structure (ES) of the control variables are replaced by the industrial structure (IS) and the degree of population aging (PS) respectively, to further test the robustness of the model. The results are shown in Table 8. From the regression results in Table 8, it can be seen that the influence of other variables on the LCCECI has not changed substantially. In summary, the method of replacing control variables proves that the factors and research results selected above are reliable and robust.
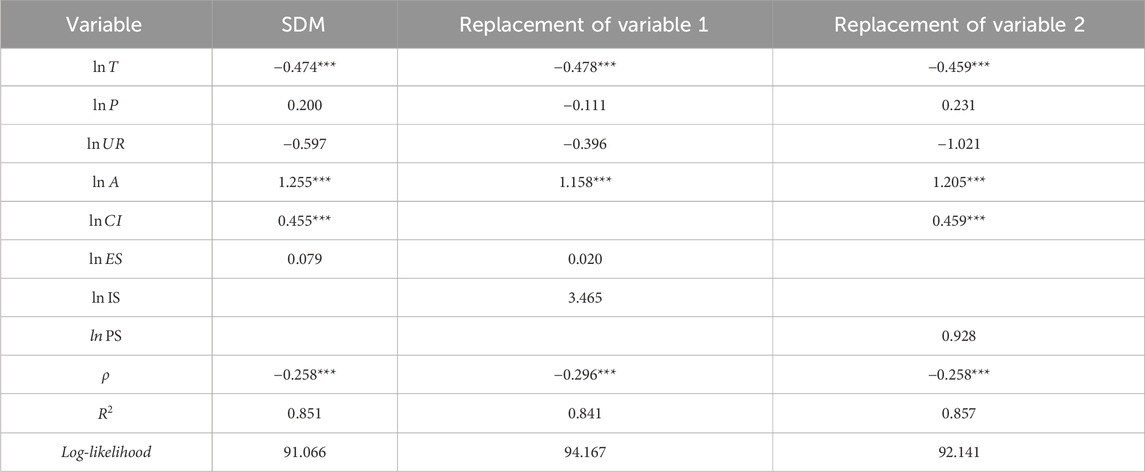
TABLE 8. Robustness tests with alternative measures.
5 Conclusion and suggestion
Due to the significant energy consumption in the materials manufacturing, construction, and operation of building stages, including the combustion of fossil fuels, the construction industry generates a substantial amount of carbon dioxide emissions. These emissions make the construction industry a significant contributor to global greenhouse gas emissions, playing a crucial role in climate change and global warming. Therefore, reducing carbon emissions in the construction industry can help slow down the pace of climate change and mitigate the extent of global temperature rise. By reducing carbon emissions, the construction industry can actively contribute to achieving global sustainable development goals. The classical econometrics model assumes that samples are independent of each other, if the spatial correlation is ignored, the research conclusion cannot accurately reflect the mutual relationship between samples. Therefore, based on the theory of spatial econometrics and the life cycle perspective, this paper takes the LCCECI in 30 provinces of China during 2004–2018 as the research object, and describes the spatial and temporal distribution pattern of the LCCECI in China. Taking the SBM-Malmquist TFP index as an index to measure technological progress, and establishing a spatial econometric model based on STIRPAT model, this paper studies the driving factors and heterogeneity of the LCCECI in China’s provinces and three regions. It helps the central and provincial government to formulate policies and guidelines in line with the level of economic development and regional characteristics, promoting the green development of the construction industry. The conclusions of this paper are as follows:
1) The LCCECI between 200–500 megatons increased from 6.65% in 2004 to 36.67% in 2018, and the LCCECI mainly come from the building materials manufacturing stage and the building operation stage. The eastern region accounts for more than half of the LCCECI, and the LCCECI shows a trend of decreasing distribution from the east coast to the west. 2) The results of the SDM model with bilateral fixed effects show that the improvement of the SBM-Malmquist TFP index has a significant inhibitory effect on the local LCCECI, but the spatial spillover effect is not significant. The total population and the urbanization rate do not significantly affect the LCCECI. The growth of the per capita GDP is one of the main driving factors leading to the growth of the LCCECI in China, and there is a significant negative spatial spillover effect on the surrounding areas. 3) The results of spatial heterogeneity analysis of influencing factors showed that, the improvement of SBM-Malmquist TFP Index is all favorable to reduce the LCCECI in the three major regions. However, in different regions, the emission reduction effect of SBM-Malmquist TFP index is different, and the emission reduction effect of the central and western regions is greater than that of the eastern region. The urbanization rate only significantly inhibited the growth of the LCCECI in the central region. The per capita GDP has a significant positive impact on the LCCECI in the three regions, but the positive driving effect on the eastern region is the largest.
In response to the above conclusions, the following recommendations are made:
1) Develop emission reduction measures at all stages of the construction industry’s life cycle to improve the SBM-Malmquist TFP index of the whole life cycle. At the stage of building materials manufacturing, governments can encourage the widespread use of low-carbon materials, promote the optimization of production processes, and promote carbon capture and storage technology. In the construction phase, advanced technology and equipment are introduced to improve the efficiency of construction production. In the operation phase, accelerate the renewal of the thermal insulation system of existing buildings, accelerate the research and development of key technologies for green buildings and tax policies to promote the development of green buildings. 2) Actively promote the urbanization process to ensure the sustainable development of the construction industry. According to the research results, urbanization rate has no significant impact on the LCCECI, but the promotion of urbanization can provide more scientific research and innovation opportunities, help promote the innovation and upgrading of building technology and materials, improve the energy efficiency and environmental protection level of buildings, and further reduce carbon emissions. 3) Establishing region-specific objectives to promote the green development of the construction industry. By matching the targets with the actual local situation, it is possible to motivate different regions to adopt appropriate emission reduction measures to reduce the LCCECI. The eastern region could set more stringent carbon reduction targets, encourage the promotion of green buildings and energy efficient technologies, and promote the industrialization of construction. The western region should speed up the urbanization process and focus on improving supporting infrastructure in order to use urban population intensification to curb the growth of carbon emissions in the construction industry. The three major regions should also establish collaborative mechanisms for carbon emissions to break down regional barriers and expedite coordinated development between regions, while formulating synchronized carbon reduction policies.
This study takes China as an example and focuses on analyzing the impact effects and heterogeneity of technological level, population size, urbanization rate and affluence on the LCCECI. The conclusions drawn from this study can be extended to other countries, such as developing nations like India and Brazil. In terms of carbon emission reduction, China is gradually transitioning from a follower to a leader and can serve as a model for other countries. However, this paper may have the following limitations: First, due to data limitations, this paper only analyzes the LCCECI at the provincial level in China, but does not delve into emissions at the cities, county, and construction company levels. The next research direction should focus on the carbon emissions at the level of cities, counties and construction companies, including detailed research on the carbon emissions of the construction industry in different cities, the carbon emissions of construction companies in the construction process and the investigation and analysis of the carbon emissions of the construction industry in county-level units. To understand the differences in carbon emissions between different regions and study the reasons behind them and the potential to reduce emissions. Such in-depth research can provide a scientific basis for formulating more targeted emission reduction strategies and promote the transformation of the construction industry to low-carbon development. Secondly, due to driving factors on the LCCECI are numerous and complex, and the development of various industries can impact the construction industry. This paper only studies the main representative driving factors, and will further improve the indicators of driving factors for in-depth research in the future. Future research will focus on further refining and improving the indicators of driving factors, as well as conducting in-depth studies on the specific impacts of various industries on the construction industry. This will involve collecting and analyzing relevant data from different industries, as well as conducting in-depth research on industry trends and policies. Through such in-depth research, we can have a more comprehensive understanding of the impacts of various industries on the construction industry and provide more accurate scientific evidence for the formulation of corresponding policies and strategies.
Data availability statement
The original contributions presented in the study are included in the article/Supplementary Material, further inquiries can be directed to the corresponding author.
Author contributions
ZZ: Conceptualization, Investigation, Methodology, Project administration, Software, Writing–original draft. ZW: Conceptualization, Software, Validation, Visualization, Writing–original draft, Writing–review and editing. XY: Validation, Visualization, Writing–review and editing. BC: Conceptualization, Writing–review and editing. ZL: Data curation, Writing–review and editing.
Funding
The author(s) declare financial support was received for the research, authorship, and/or publication of this article. This paper is supported by the Fujian Provincial Natural Science Foundation Project (2018J0102 and 2022J05191), and the Research Project of the Fujian Province Financial Department (GY-S22001).
Conflict of interest
The authors declare that the research was conducted in the absence of any commercial or financial relationships that could be construed as a potential conflict of interest.
Publisher’s note
All claims expressed in this article are solely those of the authors and do not necessarily represent those of their affiliated organizations, or those of the publisher, the editors and the reviewers. Any product that may be evaluated in this article, or claim that may be made by its manufacturer, is not guaranteed or endorsed by the publisher.
Supplementary material
The Supplementary Material for this article can be found online at: https://www.frontiersin.org/articles/10.3389/fenrg.2024.1330614/full#supplementary-material
References
Anselin, L., Rey, S., and Montouri, B. (1991). Regional income convergence: a spatial econometric perspective. Reg. Stud. 33 (2), 112–131.
Berkhout, P. H. G., Muskens, J. C., and Velthuijsen J, W. (2000). Defining the rebound effect. Energy Policy 28 (6), 425–432. doi:10.1016/s0301-4215(00)00022-7
Cao, J., Xia, A., and Xu, Y. (2022). Spatial-temporal characteristics and heterogeneity analysis of marginal abatement costs of construction industry. Environ. Sci. Technol. 45 (09), 142–152.
Chen, J., Shen, L., Shi, Q., Hong, J., and Ochoa, J. J. (2019). The effect of production structure on the total CO2 emissions intensity in the Chinese construction industry. J. Clean. Prod. 213, 1087–1095. doi:10.1016/j.jclepro.2018.12.203
Cheng, C., Ren, X. H., Dong, K. Y., and Wang, Z. (2020). How does technological innovation mitigate CO2 emissions in OECD countries? Heterogeneous analysis using panel quantile regression. J. Environ. Manage. 280, 111818. doi:10.1016/j.jenvman.2020.111818
Dietz, T., and Rosa, E. A. (1997). Effects of population and affluence on CO2 emissions. Proc. Natl. Acad. Sci. 94 (1), 175–179. doi:10.1073/pnas.94.1.175
Fan, Y., Liu, L.-C., Wu, G., and Wei, Y. M. (2006). Analyzing impact factors of CO2 emissions using the STIRPAT model. Environ. Impact Assess. Rev. 26 (4), 377–395. doi:10.1016/j.eiar.2005.11.007
Feng, B., and Wang, X. (2015). Empirical research on energy economic efficiency and energy environmental efficiency of China's construction industry——based on the SBM-tobit two-stage model. J. Beijing Inst. Technol. Sci. Ed. 17 (01), 14–22. doi:10.15918/j.jbitss1009-3370.2015.0103
Grepperud, S., and Rasmussen, I. (2004). A general equilibrium assessment of rebound effects. Energy Econ. 26 (2), 261–282. doi:10.1016/s0140-9883(03)00080-x
Hanley, N., McGregor, P. G., Swales, J. K., and Turner, K. (2009). Do increases in energy efficiency improve environmental quality and sustainability? . Ecol. Econ. 68 (3), 692–709. doi:10.1016/j.ecolecon.2008.06.004
Hui, M., and Su, Y. (2018). Spatial characteristics of carbon emission efficiency in China construction industry and its influencing factors. Environ. Eng. 36 (12), 182–187.
Huo, T., Cao, R., Xia, N., Hu, X., Cai, W., and Liu, B. (2022). Spatial correlation network structure of China’s building carbon emissions and its driving factors: a social network analysis method. J. Environ. Manage. 320, 115808. doi:10.1016/j.jenvman.2022.115808
Huo, T., Li, X., Cai, W., Zuo, J., Jia, F., and Wei, H. (2020). Exploring the impact of urbanization on urban building carbon emissions in China: evidence from a provincial panel data model. Sust. Cities Soc. 56, 102068. doi:10.1016/j.scs.2020.102068
Jeon, H. (2022). CO2 emissions, renewable energy and economic growth in the US. Electr. J. 35 (7), 107170. doi:10.1016/j.tej.2022.107170
Jiao, J. L., Jiang, G., and Yang, R. (2018). Impact of R&D technology spillovers on carbon emissions between China’s regions. Struct. Change Econ. Dynam. 47, 35–45. doi:10.1016/j.strueco.2018.07.002
Kang, Z.-Y., Li, K., and Qu, J. (2018). The path of technological progress for China’ s low-carbon development: evidence from three urban agglomerations. J. Clean. Prod. 178, 644–654. doi:10.1016/j.jclepro.2018.01.027
Khan, A. N., En, X., Raza, M. Y., Khan, N. A., and Ali, A. (2020). Sectorial study of technological progress and CO2 emission: insights from a developing economy. Technol. Forecast. Soc. Change 151, 119862. doi:10.1016/j.techfore.2019.119862
Li, S., Tao, D., and Xia, Q. (2017). Research on Influencing factors of carbon emission of construction industry in China based on the extended STIRPAT model. Mod. Manag. 37 (3), 96–98.
Li, S., Wu, Q., Zheng, Y., and Sun, Q. (2021). Study on the spatial association and influencing factors of carbon emissions from the Chinese construction industry. Sustainability 13 (4), 1728. doi:10.3390/su13041728
Lin, B., and Liu, X. (2010). China's carbon dioxide emissions under the urbanization process: influence factors and abatement policies. Econ. Res. J. 45 (08), 66–78.
Lu, N., Feng, S., and Lu, H. (2018). The tempo-spatial difference of urbanization on construction sector carbon emissions in China. J. Beijing Inst. Technol. Sci. Ed. 20 (03), 8–17.
Lu, Y., Cui, P., and Li, D. (2016). Carbon emissions and policies in China’s building and construction industry: evidence from 1994 to 2012. Build. Environ. 95, 94–103. doi:10.1016/j.buildenv.2015.09.011
Madlener, R., and Sunak, Y. (2011). Impacts of urbanization on urban structures and energy demand: what can we learn for urban energy planning and urbanization management? .Sust. Cities Soc. 1 (1), 45–53. doi:10.1016/j.scs.2010.08.006
Poumanyvong, P., and Kaneko, S. (2010). Does urbanization lead to less energy use and lower CO2 emissions? A cross-country analysis. Special Section. Ecol. Distrib. Conflicts 70 (2), 434–444. doi:10.1016/j.ecolecon.2010.09.029
Rafiq, S., Salim, R., and Nielsen, I. (2016). Urbanization, openness, emissions, and energy intensity: a study of increasingly urbanized emerging economies. Energy Econ. 56, 20–28. doi:10.1016/j.eneco.2016.02.007
Sadorsky, P. (2014). The effect of urbanization on CO2 emissions in emerging economies. Energy Econ. 41, 147–153. doi:10.1016/j.eneco.2013.11.007
Sharma, S. S. (2011). Determinants of carbon dioxide emissions: empirical evidence from 69 countries. Appl. Energy 88 (1), 376–382. doi:10.1016/j.apenergy.2010.07.022
Shi, Q., Chen, J., and Shen, L. (2017). Driving factors of the changes in the carbon emissions in the Chinese construction industry. J. Clean. Prod. 166, 615–627. doi:10.1016/j.jclepro.2017.08.056
Song, J., Yuan, X., and Wang, X. (2018). Analysis on influencing factors of carbon emissions intensity of construction industry in China. Environ. Eng. 36 (1), 178–182.
Sun, Y., Hao, S., and Long, X. (2023). A study on the measurement and influencing factors of carbon emissions in China’s construction sector. Build. Environ. 229, 109912. doi:10.1016/j.buildenv.2022.109912
Wang, H., Ang, B. W., and Su, B. (2017). Assessing drivers of economy-wide energy use and emissions: IDA versus SDA. Energy Policy 107, 585–599. doi:10.1016/j.enpol.2017.05.034
Wang, H., and Kong, C. (2021). The research of spatial spillover effect of airport economy on regional economic growth from the perspective of dual circulation. J. Manag. 34 (3), 23–35+125.
Wang, J. M., Song, X. J., and Chen, K. (2019). Which influencing factors cause CO2 emissions differences in China’s provincial construction industry: empirical analysis from a quantile regression model. Pol. J. Environ. Stud. 29, 331–347. doi:10.15244/pjoes/105239
Wang, M., and Feng, C. (2018). Exploring the driving forces of energy-related CO2 emissions in China’s construction industry by utilizing production-theoretical decomposition analysis. J. Clean. Prod. 202, 710–719. doi:10.1016/j.jclepro.2018.08.152
Wang, Y., Li, L., Kubota, J., Han, R., Zhu, X., and Lu, G. (2016). Does urbanization lead to more carbon emission? Evidence from a panel of BRICS countries. Appl. Energy. 168, 375–380. doi:10.1016/j.apenergy.2016.01.105
Wen, Q., Chen, Y., Hong, J., Ni, D., and Shen, Q. (2020). Spillover effect of technological innovation on CO2 emissions in China’s construction industry. Build. Environ. 171, 106653. doi:10.1016/j.buildenv.2020.106653
Wu, P., Song, Y., Zhu, J., and Chang, R. (2019). Analyzing the influence factors of the carbon emissions from China’s building and construction industry from 2000 to 2015. J. Clean. Prod. 221, 552–566. doi:10.1016/j.jclepro.2019.02.200
Xiang, Y., and Zhang, H. (2020). Does environmental regulation increase the carbon productivity of the construction industry? An empirical research based on spatial econometric and threshold effect. Ecol. Econ. 36 (1), 34–39.
Xie, Q., and Liu, J. (2019). Combined nonlinear effects of economic growth and urbanization on CO2 emissions in China: evidence from a panel data partially linear additive model. Energy 186, 115868. doi:10.1016/j.energy.2019.115868
Xu, G., and Wang, W. (2020). China’s energy consumption in construction and building sectors: an outlook to 2100. Energy 195, 117045. doi:10.1016/j.energy.2020.117045
Xu, S., Ma, C., Zhang, S., et al. (2022). Measurement and influencing factors of eco-economic efficiency of China’s construction industry. Environ. Pollut. Control 44 (06), 833–840.
Yandell, B. S., and Anselin, L. (1990). Spatial econometrics: methods and models. J. Am. Stat. Assoc. 85 (411), 905. doi:10.2307/2290042
Yang, X., Jia, Z., Yang, Z., and Yuan, X. (2021). The effects of technological factors on carbon emissions from various sectors in China—a spatial perspective. J. Clean. Prod. 301, 126949. doi:10.1016/j.jclepro.2021.126949
Zhang, S., Li, Z., Ning, X., and Li, L. (2021). Gauging the impacts of urbanization on CO2 emissions from the construction industry: evidence from China. J. Environ. Manage. 288, 112440. doi:10.1016/j.jenvman.2021.112440
Zhang, X., Ren, M., and Chen, Z. (2022). Research on carbon emission prediction of construction industry based on CEEMD-SSA-ELM method. Ecol. Econ., 1–15.
Zhang, Z. Y., and Wang, B. (2016). Research on the life-cycle CO2 emission of China’ s construction sector. Energy Build. 112, 244–255. doi:10.1016/j.enbuild.2015.12.026
Zhou, K., and Dai, X. (2013). An empirical study on the relationship between urbanization and carbon emission in China. China population. Resour. Environ. 23 (04), 41–48.
Zhou, K., Yang, J., Yang, T., and Ding, T. (2023). Spatial and temporal evolution characteristics and spillover effects of China’s regional carbon emissions. J. Environ. Manag. 325, 116423. doi:10.1016/j.jenvman.2022.116423
Keywords: construction industry, the whole life cycle carbon emissions, total factor productivity, spatial econometric model, STIRPAT model
Citation: Zhang Z, Wu Z, Yang X, Cai B and Lin Z (2024) The driving factors of spatial differences on the whole life cycle carbon emissions of the construction industry: from the analysis perspective of total factor productivity. Front. Energy Res. 12:1330614. doi: 10.3389/fenrg.2024.1330614
Received: 31 October 2023; Accepted: 10 January 2024;
Published: 22 January 2024.
Edited by:
Dan Wang, Tianjin University, ChinaReviewed by:
Jian Li Jane Hao, Xi’an Jiaotong-Liverpool University, ChinaDonghua Liu, Wuhan University of Technology, China
Wanhai You, Fuzhou University, China
Wenjie Zou, Fujian Normal University, China
Copyright © 2024 Zhang, Wu, Yang, Cai and Lin. This is an open-access article distributed under the terms of the Creative Commons Attribution License (CC BY). The use, distribution or reproduction in other forums is permitted, provided the original author(s) and the copyright owner(s) are credited and that the original publication in this journal is cited, in accordance with accepted academic practice. No use, distribution or reproduction is permitted which does not comply with these terms.
*Correspondence: Binqing Cai, binq1107@163.com