Carbon neutrality in Malaysia and Kuala Lumpur: insights from stakeholder-driven integrated assessment modeling
 Maridee Weber1*
  Leeya Pressburger1
  Loon Wai Chau2
  Zarrar Khan1
  Taryn Waite1
  Michael I. Westphal1,3
  Gabriel Hoh Teck Ling2 Chin Siong Ho2
  Meredydd Evans1
- 1Pacific Northwest National Laboratory, College Park, MD, United States
- 2Low Carbon Asia Research Centre, Urban and Regional Planning, Faculty of Built Environment and Surveying, Universiti Teknologi Malaysia, Johor Bahru, Malaysia
- 3Center for Global Sustainability, School of Public Policy, University of Maryland, College Park, MD, United States
Introduction: Several cities in Malaysia have established plans to reduce their CO2 emissions, in addition to Malaysia submitting a Nationally Determined Contribution to reduce its carbon intensity (against GDP) by 45% in 2030 compared to 2005. Meeting these emissions reduction goals will require a joint effort between governments, industries, and corporations at different scales and across sectors.
Methods: In collaboration with national and sub-national stakeholders, we developed and used a global integrated assessment model to explore emissions mitigation pathways in Malaysia and Kuala Lumpur. Guided by current climate action plans, we created a suite of scenarios to reflect uncertainties in policy ambition, level of adoption, and implementation for reaching carbon neutrality. Through iterative engagement with all parties, we refined the scenarios and focus of the analysis to best meet the stakeholders’ needs.
Results: We found that Malaysia can reduce its carbon intensity and reach carbon neutrality by 2050, and that action in Kuala Lumpur can play a significant role. Decarbonization of the power sector paired with extensive electrification, energy efficiency improvements in buildings, transportation, and industry, and the use of advanced technologies such as hydrogen and carbon capture and storage will be major drivers to mitigate emissions, with carbon dioxide removal strategies being key to eliminate residual emissions.
Discussion: Our results suggest a hopeful future for Malaysia’s ability to meet its climate goals, recognizing that there may be technological, social, and financial challenges along the way. This study highlights the participatory process in which stakeholders contributed to the development of the model and guided the analysis, as well as insights into Malaysia’s decarbonization potential and the role of multilevel governance.
1 Introduction
As the world continues to feel the effects of climate change, almost every country is making plans to mitigate their emissions (UNFCCC, 2023). Since the Paris Agreement was enacted in 2016, 195 signatories have submitted their Nationally Determined Contribution (NDC) to reduce emissions and adapt to climate-related impacts. While this is a step towards limiting global warming, the level of ambition behind and capacity to develop and fulfill these NDCs varies greatly by country. As the third highest emitter of carbon dioxide (CO2) per capita in Southeast Asia (World Development Indicators, 2023), Malaysia has developed numerous plans to reduce emissions and meet their NDC, which includes an unconditional pledge to reduce its economy-wide carbon intensity (against GDP) by 45% in 2030 compared to the level in 2005 (‘Malaysia’s update of its first nationally determined contribution’, 2021). There are several methods available to help countries plan their mitigation strategies, including using integrated assessment models (IAMs).
While IAMs, which link human and earth systems interactions, have been used sub-nationally in Malaysia to help inform emissions mitigation plans (Chau et al., 2021; Hibino and Masui, 2023), they have not yet been openly utilized for national decarbonization strategies or to assess city-national dynamics, and can be a useful tool to help Malaysia reach its climate goals. Integrated assessment modeling has been used for decades to help evaluate the future of climate change, including the use of the Global Change Analysis Model (GCAM, described in section 2.2) (Edmonds and Reilly, 1986; Weyant et al., 1996; Calvin et al., 2019). GCAM analysis can be more beneficial when stakeholders and those with regional knowledge are involved in the modeling process. Stakeholder participation in climate-related integrated assessment modeling can improve the quality of decisions made throughout the analysis, build trust and acceptance of results, better identify key policies, goals, and targets, and define the most relevant scenarios (Cohen, 1997; Parker et al., 2002; Salter, Robinson and Wiek, 2010). Despite these benefits, there is a need to involve stakeholders more closely in the scenario design process to improve the reliability and applicability of this work (O’Neill et al., 2020).
Malaysia can benefit from this stakeholder-driven analysis as the country is currently in the process of developing its long-term low-emission development strategy (LT-LEDS), led by the Ministry of Natural Resources, Environment, and Climate Change (NRECC)1. This LT-LEDS will be submitted to the United Nations Framework Convention on Climate Change (UNFCCC), and will describe Malaysia’s long-term emissions reduction plans. While the LT-LEDS has not been submitted and there is no formal commitment for long-term emissions reductions, in 2021 the former prime minister of Malaysia announced a goal to reach carbon-neutrality as early as 2050 (Malaysia Ministry of Economy, 2021). Currently, Malaysia does not have concrete national decarbonization strategies with targets extending beyond 2040, though individual cities have made plans out to 2050 (Kuala Lumpur City Hall, 2021b).
Cities will play a vital role in Malaysia achieving its NDC and 2050 carbon-neutral target, as urban growth continues and has a significant impact on emissions (Lwasa et al., 2022). Some major cities and urban regions, such as Kuala Lumpur and Iskandar Malaysia, have developed comprehensive plans to tackle climate change and its impacts (Universiti Teknologi Malaysia Low Carbon Asia Research Center, 2013; Ho et al., 2020; Kuala Lumpur City Hall, 2021a; 2021b). With cities accounting for more than 70% of CO2 emissions globally (Lwasa et al., 2022), these plans, as well as collaboration with the national government, will be important to the achievement of Malaysia’s national and sub-national emissions goals.
In this work, we explored pathways to reduce CO2 emissions and reach carbon neutrality in Malaysia and Kuala Lumpur through stakeholder-driven integrated assessment modeling. Using GCAM, we modeled three scenarios informed by current climate planning documents and stakeholder feedback. We formed knowledge-sharing partnerships with three stakeholders in Malaysia at both the national and sub-national levels, and engaged with each of them regularly throughout the study, both virtually and in-person. Through this process, we collaborated to understand the needs of stakeholders and the direction of the analysis that would be most useful for their emissions mitigation planning and policy development. Additionally, we established a partnership between Pacific Northwest National Laboratory (PNNL) and the Universiti Teknologi Malaysia (UTM) to help facilitate the analysis and build capacity to run GCAM in-country, and understand model outputs for use by the stakeholders. This inclusive and participatory process resulted in applicable insights and recommendations as Malaysia continues to work toward their NDC and develops their LT-LEDS.
Section 2 of this paper describes our methods, including details on the stakeholder engagement and model development processes. Section 3 assesses the results of our modeling, highlighting five main areas: emissions reduction potential (3.1), decarbonizing the power sector (3.2), end use and demand side measures (3.3), the need for advanced technologies (3.4), and the role of Kuala Lumpur in Malaysia’s decarbonization (3.5). Finally, Section 4 provides insights and recommendations on the stakeholder-driven modeling process and our GCAM results.
2 Methods
Section 2.1 of Methods includes details about the relationship between PNNL and UTM, goals of our interactions with stakeholders, and stakeholder engagement process. Section 2.2 describes GCAM, and additional model developments that were undertaken for this work. Section 2.3 includes components of our scenario development and covers technical information about how current policies and plans were represented in GCAM.
2.1 Partnerships and engagement
2.1.1 PNNL and UTM partnership
Before developing a partnership between PNNL and UTM, PNNL established criteria to select a city and country to conduct this analysis in. This selection focused on countries with cities that were ASEAN Smart Cities; a group of Southeast Asian cities experiencing rapid urbanization. For each city, PNNL considered the level of interest in collaborating expressed by the city, their existing capacity, the existence of other networks where the city was already working with multiple stakeholders on decarbonization and smart city development (such as C40 Cities), willingness to think holistically, data availability, and replicability. Kuala Lumpur was identified as a city that met several of the criteria. PNNL then began identifying partners through existing networks.
UTM was chosen as PNNL’s partner institution through a detailed selection and prioritization process led by PNNL. One of the selection criteria was that the research partners were part of existing energy or integrated assessment modeling networks, recognizing that teams who had participated in international modeling exercises likely had strong capacity and an understanding of modeling best practices. PNNL did additional research on potential partners to get a sense of their modeling and analysis capabilities, as well as knowledge on decarbonization. After identifying UTM as a candidate, PNNL reached out to them by email to arrange a call to better learn about their interest, capacity, and existing stakeholder relationships at the city and national levels in Malaysia. UTM had connections with several entities at the city and national levels, was familiar with integrated assessment modeling, had authored low carbon plans for Kuala Lumpur and 17 other Malaysian cities, and was interested in working together. This collaboration served to better PNNL’s understanding of the local context, data, and climate action measures by having an in-country partner, and to build capacity for GCAM modeling in Malaysia through UTM’s existing relationships with Malaysian stakeholders. By combining PNNL’s technical expertise with UTM’s local knowledge and connections, we were able to foster a two-sided engagement that resulted in a more robust and inclusive analysis.
2.1.2 Stakeholder engagement
Using UTM’s existing connections and through the US Embassy in Kuala Lumpur, our team collaborated with three stakeholders in Malaysia: the Kuala Lumpur City Hall (DBKL, based on its Malaysian acronym), the Sustainable Energy Development Authority Malaysia (SEDA), and NRECC (Table 1). While establishing the partnership between PNNL and UTM, our team discussed which government entities to engage with. UTM had worked directly with DBKL on climate action plans for Kuala Lumpur, and had connections with SEDA and NRECC. The roles and expertise of these stakeholders were considered during this process, as it was important to engage with those who were knowledgeable on Malaysia’s current climate plans and goals, and participate in the decision-making processes around these matters. After expressing interest in working with DBKL, SEDA, and NRECC as stakeholders, UTM and the US Embassy in Kuala Lumpur helped PNNL arrange meetings with them. Before formalizing consistent engagement, PNNL and UTM jointly had multiple meetings with DBKL, and UTM had meetings with SEDA and NRECC to discuss their involvement in the analysis. We then engaged these entities throughout the modeling process; they provided us with feedback on assumptions, results, and the goals of our analysis while also learning from our modeling expertise. This partnership was facilitated through a series of workshops, resulting in four principal meetings each at the national and sub-national levels.
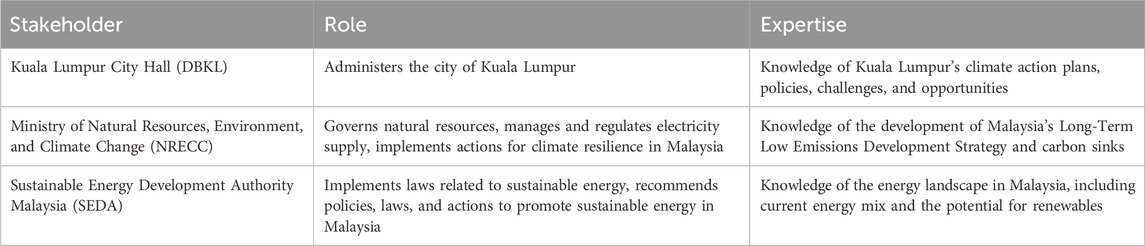
Table 1. Names of our collaborators and an overview of their roles and expertise related to this analysis.
Meetings with stakeholders were conducted through alternating webinars and in-person meetings, though additional communication through email was required for planning and follow-up. Separate webinars were organized for national and sub-national stakeholders, meaning that we met with NRECC and SEDA at the same time and DBKL separately. For in-person meetings, we met with each stakeholder group separately, aside from a workshop that included all three stakeholders. Supplementary Table S1 gives an overview of each of these meetings, including topics that were discussed. The following sections provide information on the goals of each of our meetings and how these engagements informed our modeling and analysis.
2.1.2.1 Meeting summaries
PNNL and UTM prepared a presentation for each meeting to guide the discussion, which was sent to the stakeholders beforehand. Typically, meetings included an introduction and recap of previous conversations, presentation of GCAM results, next steps, and open discussion. Meetings were led by PNNL and UTM, with stakeholders encouraged to ask questions or contribute at any time.
The goals of the first set of meetings were to familiarize the stakeholders with GCAM, identify their priorities for the analysis, and discuss scenario development (Section 2.3) and policies (Section 2.3.1). These discussions were imperative to ensure our work aligned with the stakeholders’ needs, and that the results could help inform their decarbonization planning. From this, we learned about current emissions mitigation planning strategies and areas where we could add to their existing knowledge, especially in terms of gaps in their scenarios. The second meetings took place in Malaysia, and were focused on reviewing our preliminary results with the stakeholders. Meeting the stakeholders in-person facilitated a stronger working relationship, and allowed them to provide feedback and express any concerns about the initial model results. From these discussions, we were able to further develop our analysis in line with up-to-date data to provide the most accurate results, resulting in more trust in and validity of our analysis. Once the stakeholder feedback was incorporated (Section 2.1.2.2), we had a third round of meetings with the national and sub-national stakeholders to review the updated results and provide an opportunity for the partners to request additional information before we finalized the results. The fourth meetings again took place in Malaysia, where we were able to meet with DBKL and NRECC individually. These meetings primarily served as a setting to present our final modeling results and recommendations, and to discuss potential next steps and future collaboration. Our key insight from this is that periodic engagement with the stakeholders was vital for a successful outcome, especially early in the analysis. The preliminary results review was a formative step in the process; without the opportunity to get this feedback, our analysis could have been misguided.
2.1.2.2 Incorporating feedback
In these meetings we received feedback from the stakeholders on the study scope and design, policies we were modeling, scenarios, and GCAM results. Our first two sets of meetings were particularly important for and focused on receiving feedback, since at this stage we were working on scenario development and reviewing preliminary results. Virtual meetings were recorded through Microsoft Teams and the transcript function was used for notetaking, in addition to taking notes by hand, to ensure all stakeholder feedback was captured. This allowed us to look back on conversations and confirm details. For in-person meetings, we took notes by hand.
Our first workshop with DBKL, SEDA, and NRECC resulted in feedback on the policies we planned to model in GCAM based on Malaysia’s and Kuala Lumpur’s decarbonization planning documents. Feedback on these policies included using more up-to-date target values or years from plans that had not yet been released and removing policies that were no longer being considered. We used this feedback to update the policy inputs for our scenarios. For example, we adjusted the amount of public transportation being targeted in the future and removed nuclear power as an option for electricity generation. We also received feedback on the three scenarios we had developed, especially our Carbon Neutral scenario. Feedback on this scenario was centered around additional policies and technologies that the Malaysian government is considering, but are not included in official plans. Figure 1 illustrates our engagement process, including when feedback was incorporated.
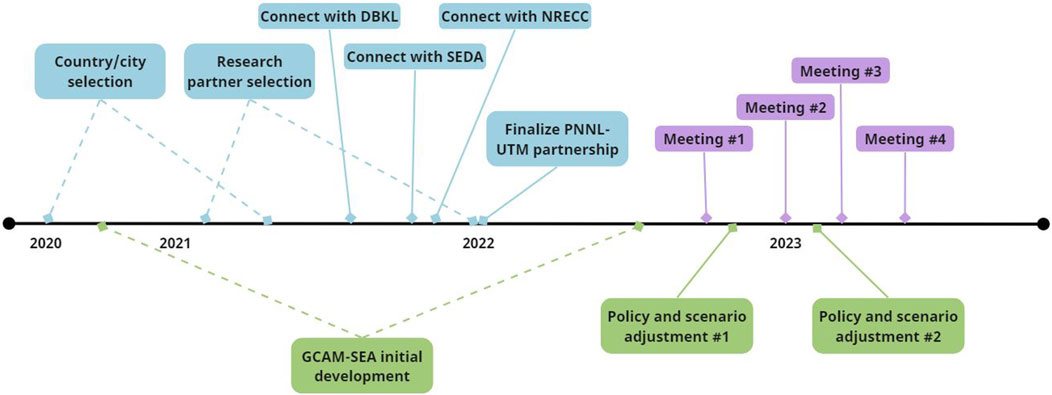
Figure 1. An overview of our partnership and engagement process. Blue events are related to selecting and establishing connections, green are modeling, and purple are principal meetings.
The second set of meetings took place in Malaysia 4 months after the first meetings, and stakeholders were able to review our changes based on their initial feedback as well as preliminary GCAM results. These meetings resulted in feedback on more policy changes, like including an ambitious hydrogen fuel policy and adding hydropower expansion for renewable energy. Feedback from our GCAM results included changing some terminology on our figures, and showing additional figures for results like indirect emissions and carbon prices. This input was incorporated through more adjustments to the policies included in our scenarios, and an updated and expanded set of figures for GCAM results. Our third and fourth meetings prioritized discussing final results, insights, recommendations, and future collaboration and involved incorporating only minor feedback into our modeling and analysis.
2.2 Global change analysis model
Due to the multisector involvement required for decarbonization and impacts on multiple systems, GCAM was well-suited to conduct this analysis. GCAM is an established, open-source, IAM that represents the interactions between five systems: land use and agriculture, energy, water, climate, and the economy. It models the global energy system with a spatial resolution of 32 geopolitical regions, and agriculture and land use with a spatial resolution of 384 regions based on the intersection of the energy regions with water basins. GCAM has been prominent in analyzing decarbonization pathways, including for the United States Long-Term Strategy (Hultman et al., 2020; Ou et al., 2021; United States Department of State and United States Executive Office of the President, 2021; Bergero et al., 2022; Cui et al., 2022; Kim et al., 2022; Fuhrman et al., 2023). This study used a version of GCAM 6.0, with additional region-specific developments described in Sections 2.2.1, 2.2.2. The model runs in 5-year intervals from 1975 through 2100. GCAM uses historical data from 1975 to 2015 and is based on market-equilibrium economics to solve for 2020–2100. For this study, we ran GCAM through 2050 as a reasonable mid-century decarbonization goal based on statements from Malaysia’s government (Malaysia Ministry of Economy, 2021).
2.2.1 City-level modeling
For this analysis, we developed a version of GCAM, GCAM-SEA, that includes Kuala Lumpur, Rest of Malaysia (RoM), and Malaysia as regions in the model, where RoM represents all of Malaysia except Kuala Lumpur. We downscaled the base model’s data based on historical and projected population and gross domestic product (GDP) data for Malaysia and Kuala Lumpur. For Malaysia, a median variant projection from the United Nations was used for population (United Nations Department of Economic and Social Affairs, 2022), and a projection from shared socioeconomic pathway 2 (SSP2) was used for GDP (International Institute for Applied Systems Analysis, 2018). For Kuala Lumpur, population and GDP projections are based on official projections by the Department of Statistics Malaysia used in the Kuala Lumpur Structure Plan 2040 (Kuala Lumpur City Hall, 2021a). These projections represent future population and GDP pathways that do not vary much from historical trends. This region-specific version of GCAM allowed us to gather insights on national and sub-national dynamics, including the role that Kuala Lumpur can play in Malaysia’s decarbonization, which provided valuable insights for DBKL. At the sub-national level, we used GCAM-SEA to gain insight into the buildings, industry, and transportation sectors. Table 2 shows the general methods used for downscaling each sector to the city-level, though additional adjustments were made in some cases. Primary energy, electricity generation, and the land and water systems are all modeled at the national level, as individual cities typically have less governance over these areas.
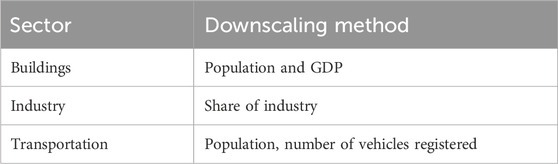
Table 2. Brief descriptions of the downscaling methods used to model sectoral energy demand at the city-level.
Additional adjustments were made for the buildings and transportation sectors to better capture city-specific representation. For buildings, we modeled a 100% urban population in Kuala Lumpur (Department of Statistics Malaysia, 2020) (explained in Section 2.2.2), which captures a different portfolio of building technologies and energy demands than a rural area. For transportation, we adjusted public and private ground transportation shares based on city-level data, where Kuala Lumpur has a higher share of public transit use than the RoM. For transportation related to shipping and aviation, we assumed 1% of all energy demands were attributed to Kuala Lumpur, after receiving feedback that the city-level emissions from these modes were too high based on downscaling by population.
2.2.2 Detailed-buildings modeling
We developed a detailed representation of the buildings sector that distinguishes between urban and rural residential buildings and commercial buildings, and includes expanded set of technologies to capture impacts from national and sub-national planned policies that target specific building technologies. Notably, an aggregate “other” energy demand category originally in GCAM-SEA was disaggregated to include consumption details from specific appliances like ceiling fans, refrigerators, and even different types of light bulbs. This detailed buildings sector was modeled using assumptions on residential and commercial energy consumption for different appliances and fuels in Southeast Asia (Nakagami, Murakoshi and Iwafune, 2008; ‘State of residential energy consumption in Southeast Asia’, 2017; ‘Malaysia Energy Statistics Handbook, 2020’, 2020; Economic and Social Commission for Asia and the Pacific, 2018; Poolsawat et al., 2020).
2.3 Scenario development
Through an iterative process with the stakeholders, we developed three unique scenarios to explore Malaysia and Kuala Lumpur’s pathways toward carbon neutrality by 2050 (Table 3). We include a “Business as Usual” (BAU) scenario as a projection through 2050, which is GCAM-SEA’s reference scenario based on historical population, GDP, and energy and technology trends and does not include any additional assumptions. Our “Policies” scenario reflects the implementation of a broad set of currently planned national and city climate policies and targets (detailed in Section 2.3.1) and represents the pathway Malaysia is currently on, if these plans come to fruition. Finally, our “Carbon Neutral” scenario specifies that in addition to the policies modeled, Malaysia must reach carbon neutrality in 2050; we refer to this requirement as an emissions constraint (Section 2.3.1.5). This scenario provides the least-cost pathway to reach carbon neutrality by 2050 through sector-specific reductions, given that current measures in the Policies scenario do not achieve this. Note that there is a difference between carbon neutral and net-zero, with the former relying on emissions capture and sequestration to offset any CO2 that is produced, while the latter reduces CO2 and other greenhouse gas emissions in addition to using emissions removal and sequestration technologies.
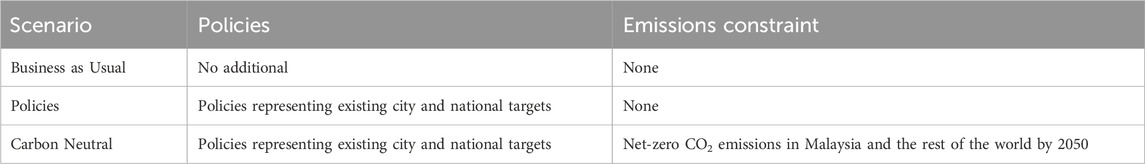
Table 3. Scenario names and components, including if policies or an emissions constraint are included.
These scenarios provide an overview of potential future pathways for Malaysia and Kuala Lumpur, and can highlight trade-offs between different policy and technology options, giving valuable insights to decision-makers on potential impacts. While they do not represent every possible pathway to reach carbon neutrality, these three scenarios were selected to show a set of options relevant to the pathways currently being discussed for Malaysia. These scenarios are reasonable for this analysis because they demonstrate potential outcomes if emissions continue without intervention (BAU) or planned policies are enacted (Policies), or if additional technologies and timelines may be needed to reach carbon neutrality (Carbon Neutral).
2.3.1 Modeling policies
Designing a scenario requires making sectors in GCAM-SEA respond to an imposed policy. With user-defined policies, GCAM-SEA incorporates user-defined exogenous information into its solving process. The policies that we model in our Policies and Carbon Neutral scenarios include changes to the buildings, industry, transportation, and electricity generation sectors. These policies were sourced from Malaysia and Kuala Lumpur plans and targets (Table 4), with insights and guidance from the stakeholders. While the policies modeled here represent the majority of on-the-books plans, note that we did not include all policies currently in place or planned in Malaysia or Kuala Lumpur, such as those to reduce emissions from waste in Kuala Lumpur.
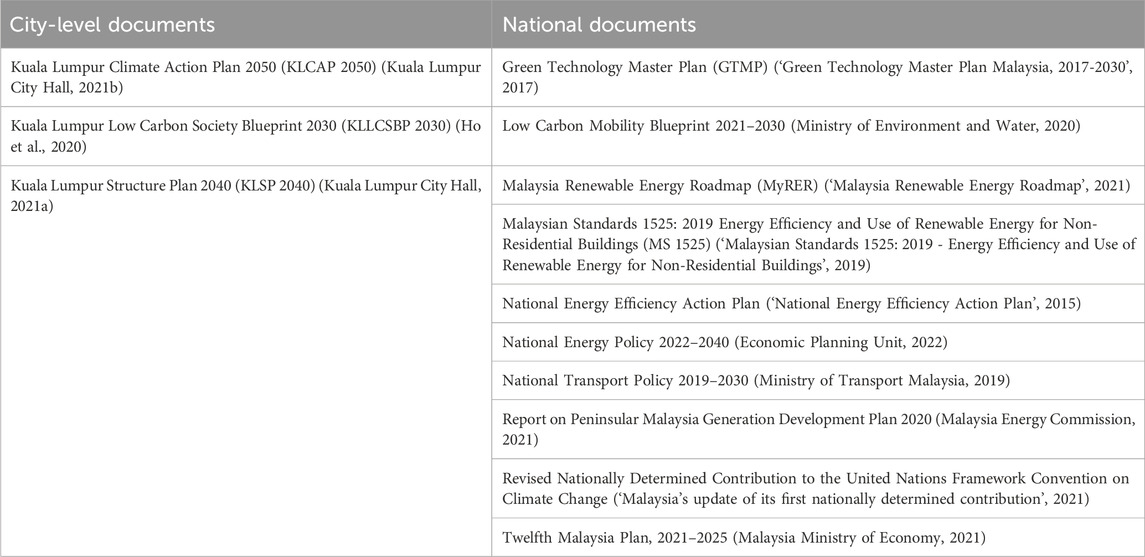
Table 4. A list of Malaysian policies, plans, and commitments related to carbon neutrality that were used to model our scenarios.
In the Policies scenario, where available, we used a numeric target that was explicitly specified in a plan for a given year, such as 80% public transit in Kuala Lumpur by 2050. To create scenarios that are as realistic as possible with the available data, target values were sourced from both Kuala Lumpur’s and Malaysia’s policy and planning documents. This means that for some targets, we applied either city or national values to both Kuala Lumpur and RoM if there was only data at one level. These details are in noted in Supplementary Table S2, and Sections 2.3.1.1–2.3.1.4 explain the technical implementation of these policies.
2.3.1.1 Building policies
Kuala Lumpur identified improving new and existing building energy efficiency as a key component of its strategy to achieve carbon neutrality by 2050 in the KLCAP 2050, and the MS 1525 supports this concept at the national level. One approach to increasing energy efficiency in buildings is improving the building envelope, which attempts to maximize the energy efficiency of a building’s exterior. Here, we model a gradual increase in efficiency of the building envelope by reducing the energy demand for cooling required to keep buildings at a given temperature. Additional measures to improve energy efficiency include increasing the efficiency of specific appliances such as Air-Conditioning and Mechanical Ventilation (ACMV) systems or using high-efficiency lighting. The KLLCSBP 2030 identifies specific targets for the share of high-efficiency appliances. We reflect this in GCAM-SEA by increasing the share of high-efficiency technologies like air conditioners and ceiling fans and decreasingpossible with the available data, target values were sourced from both the share of low-efficiency technology options. Furthermore, in alignment with the KLLCSBP 2030’s commitments to only use energy-efficient lighting in new buildings and upgrade the lighting in existing buildings, we implement a phase-out of non-efficient lighting options so that only LEDs are left in the market in 2050.
2.3.1.2 Industry policies
Policies for the industry sector target a general efficiency increase in industrial processes and an exploratory hydrogen fuel policy. We gradually increase overall energy efficiency for the industrial sector at a modest rate to reflect developments in industrial technologies like efficient motors and new manufacturing techniques. Because heavy industry is difficult to decarbonize and may require advanced technologies, we also include hydrogen as a fuel source for industry. The 12th Malaysia Plan discusses the potential of hydrogen use as an innovative technology and alternate green fuel source, and the National Energy Policy identifies Malaysia’s competitive advantage in becoming a net hydrogen exporter. As a long-term hydrogen roadmap is still being developed, we chose to model the introduction of hydrogen to industry in 2030.
2.3.1.3 Transportation policies
Transportation policies include a modal shift from private to public transportation and an increase in electric vehicles (EVs). The KLSP 2040 emphasizes an integrated public transportation system, with goals of 60% public passenger transit in Kuala Lumpur by 2030 and 70% by 2040. This is a significant increase from the current split, which is roughly 20% public and 80% private. In GCAM-SEA, this is represented by an increase in kilometers traveled by rail, bus, cycling, and walking and a decrease in kilometers traveled by car and motorcycle. At the national level, the Low Carbon National Aspiration 2040 (LCNA 2040) in the National Energy Policy discusses a target of 50% public passenger transit by 2040. We model this shift similarly but with a greater reliance on buses, cycling, and walking than rail. Both plans also emphasize the importance of scaling up the use of EVs. The KLLCSBP 2030 and LCNA 2040 list goals of 20% EVs by 2030 in Kuala Lumpur and 38% by 2040 nationally, respectively. In GCAM-SEA, we model the increase in EVs through a pricing mechanism that lowers the cost of EVs to be equivalent to that of non-EVs in a future year, therefore making them a more affordable and attractive option.
2.3.1.4 Electricity generation policies
Renewable energy is a key factor to meet Malaysia’s goal of reducing carbon emissions intensity per GDP by 45% in 2030. The MyRER outlines the country’s plans for reducing the share of coal and gas relative to renewable sources like solar, hydropower, and biomass. GCAM-SEA captures these dynamics by matching the target share of each renewable fuel source each year. Additionally, reflecting Malaysia’s 2021 commitment to build no additional coal-fired power plants (Nathan, 2021), we impose a constraint beginning in the year 2020 that prevents new coal-fired power plants without CCS from being built in the model.
2.3.1.5 Emissions constraint
To implement an emissions constraint in GCAM-SEA, we require the model to reach a specific level of emissions in a particular year. In this case, we model net-zero CO2 emissions for Malaysia and the rest of the world in 2050. This means that all CO2 emitted must be offset through carbon sequestration or removal. Note that a separate emissions constraint must be set for the rest of the world to avoid leakage. In practice, GCAM-SEA calculates the price of carbon needed to reach the constraint in each period, and will find the least-cost pathway to satisfy the emissions constraint in terms of technology deployment. This carbon price is not included in the markets, but is instead used in the model’s solution approach. An economy-wide constraint can be used by itself or in combination with additional sectoral policies described above.
3 Results
3.1 Emissions reduction potential
Malaysia has the potential to reach carbon neutrality in 2050 through additions to existing policies and plans. Figure 2 illustrates the progression of emissions reductions from the BAU scenario to the Policies scenario, and from Policies to Carbon Neutral. Additionally, it shows both the direct and indirect emissions, where direct emissions are those from fossil fuel combustion and industrial processes, and indirect emissions are those associated with electricity consumption by a given sector. BAU emissions in 2050 total 359 MTCO2. Current policies and targets as represented in the Policies scenario reduce emissions to 190 MTCO2, less than 50% of the mitigation necessary to reach carbon neutrality. This implies that while effective, Malaysia’s current plans are not sufficient to achieve carbon neutrality in 2050. However, additional investment in large-scale electrification and increased use of advanced technologies like carbon capture and storage (CCS) and hydrogen can result in carbon neutrality, as shown in the Carbon Neutral scenario (Figures 4, 5). The following sections will discuss the details of and key insights from these results.
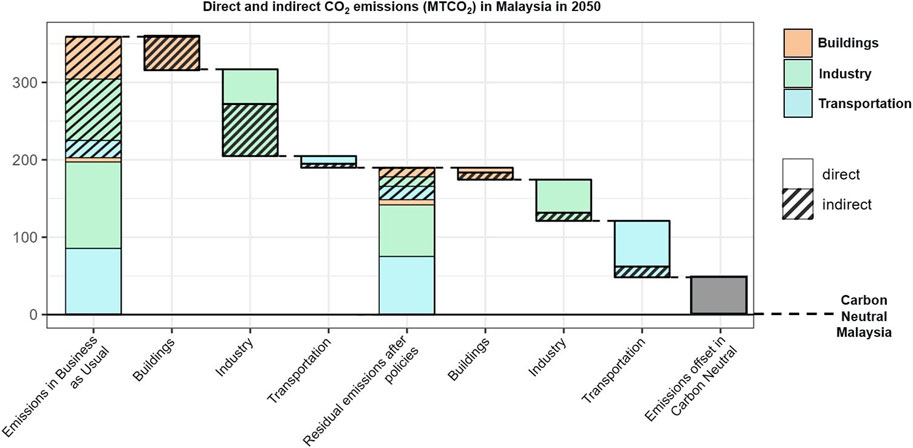
Figure 2. An overview of direct and indirect emissions in Malaysia in 2050, and the progression of emissions reductions from BAU to the Policies scenario and from Policies to Carbon Neutral.
3.2 Decarbonizing the power sector
The power sector presents significant opportunities and challenges as Malaysia’s greatest source of emissions; electricity generation made up 42% of Malaysia’s CO2 emissions in 2020 (Climate Watch Data Explorer, 2020). Both decarbonization and widespread electrification through measures described in Section 3.3 will be key factors in reaching carbon neutrality. Figure 3 describes Malaysia’s electricity generation mix in detail. In 2015, nearly 90% of the power generation in Malaysia was sourced from coal or gas, with only a fraction from renewable sources. In a BAU case, the generation mix does not change drastically into 2050, with a significant reliance of just over 75% on coal and gas, 14% from solar, and 6% from hydropower. In the Policies scenario, total electricity generation decreases relative to BAU due to policies targeting energy efficiency measures in end-use sectors. Notably, nearly three-quarters of total generation are projected to be sourced from renewables, which reduces power sector emissions by almost 75% compared to the BAU case.
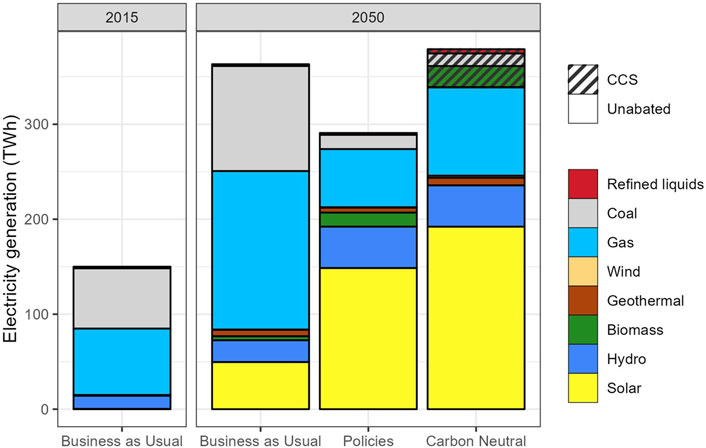
Figure 3. Electricity generation projections for Malaysia in 2050 in the BAU, Policies, and Carbon Neutral scenarios, sectioned by fuel type and sequestration method. Data for 2015 is included as a reference.
In the Carbon Neutral scenario, renewable energy and fossil fuels using CCS technologies make up nearly 75% of total electricity generation. However, total electricity generation increases in the Carbon Neutral scenario compared to BAU and Policies due to the level of electrification required to achieve carbon neutrality. We find that almost 100% of the energy consumed in the buildings sector, 80% in the transportation sector, and 42% in the industry sector will need to be sourced from electricity (Figure 4). This drives the high demand for electricity in the Carbon Neutral scenario, which further emphasizes the importance of decarbonizing the power sector. Without clean energy powering the grid, this increase in demand would cause emissions to spike. Instead, we find that 95% of power emissions are reduced in the Carbon Neutral scenario compared to BAU, implying that Malaysia can bring its largest source of emissions down to nearly zero by scaling up the use of solar and hydropower.
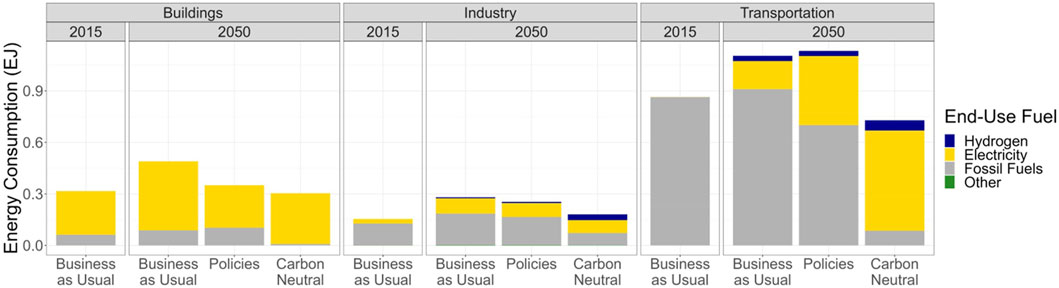
Figure 4. Aggregate energy consumption by sector for each scenario in 2050, with 2015 as a reference. The “Other” fuel category includes small amounts of biomass in industry and buildings and solar water heaters in buildings.
3.3 Energy efficiency and demand side measures
Demand-side measures to increase energy efficiency in the buildings, industry, and transportation sectors can significantly reduce energy consumption and emissions. Total energy consumption for Malaysia is projected to be 1.9 EJ in a BAU scenario in 2050; modeled policies and plans can bring this down slightly. Further electrification in the Carbon Neutral scenario reduces total energy consumption to 1.2 EJ in 2050. Figure 5 illustrates these metrics.
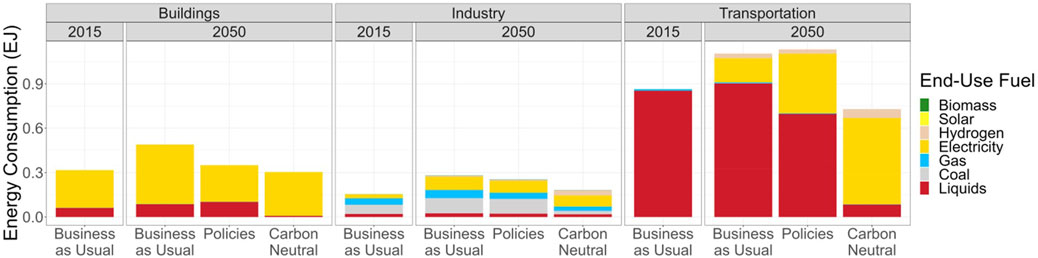
Figure 5. Energy consumption by end-use fuel in buildings, industry, and transportation in 2050, with 2015 as a reference. Note that biomass appears in buildings (rural cooking) and industry, and small amounts of solar are in the buildings sector as solar water heaters.
The buildings sector is already largely electrified, with electricity making up 82% of energy consumption in a BAU scenario in 2015 and through 2050. Therefore, there are relatively few direct emissions from buildings, and energy efficiency improvements are highly effective at lowering total energy use. In a Carbon Neutral scenario, energy consumption in buildings is reduced by almost 40% and nearly all of this consumption is from electricity. Even so, electricity use in buildings also decreases by a quarter relative to BAU, reflecting the impacts of energy efficiency improvements driven by the use of efficient lighting and appliances.
Industrial energy consumption totaled 0.15 EJ in 2015 and 0.28 EJ in a 2050 BAU case. Energy efficiency improvements and the introduction of hydrogen can lower energy consumption by 10% in the Policies scenario and 35% in the Carbon Neutral case. Furthermore, in the Carbon Neutral scenario, 60% of energy is sourced from electricity and hydrogen, up from 34% in BAU. There is a significant decrease in fossil fuel use and an increase in hydrogen required to achieve carbon neutrality relative to the Policies scenario. In both the BAU and Policies scenarios, 65% of 2050 energy consumption is sourced from fossil fuels, versus almost 40% in the Carbon Neutral case, although some of those resulting emissions are curbed by CCS.
Energy consumption for the transportation sector grows by almost a third from 2015 to 2050 in our BAU scenario. Through an increase in public transportation and the use of EVs and hydrogen vehicles, transportation energy consumption can be reduced by 15% in the Policies scenario and up to 34% in the Carbon Neutral scenario, driven by less private vehicle use. In the Carbon Neutral scenario, this decrease in energy can be attributed to the near-full electrification - 80% - of total transportation energy. This will require a large shift in transportation trends; we find that by 2050, two-thirds of passenger and 85% of freight road vehicle kilometers traveled are by EVs, and 12%–15% of both passenger and freight road vehicle kilometers traveled are from hydrogen vehicles, respectively. With these changes, emissions directly from transportation will be substantially reduced by over 80% from BAU as compared to a 12% decrease in the Policies scenario relative to BAU. In addition to the increased use of EVs, transportation becomes primarily public over private, with most of the remaining private transportation being electric or hydrogen vehicles. In a Carbon Neutral scenario in 2050, we find that over half of passenger vehicle kilometers traveled in Malaysia are from public transportation, and this increases to nearly three-quarters in Kuala Lumpur.
3.4 Advanced technologies
The Carbon Neutral scenario highlights the need for advanced technologies such as hydrogen and CCS to reduce emissions in hard-to-abate sectors, like industry. In 2050, 89 MTCO2 are captured through CCS, bioenergy CCS, or through carbon sequestration in the land sector (Figure 6), which equates to a quarter of 2050 emissions in a BAU case. In practice, these carbon storage and sink technologies could expand outside of CCS and land use, and include negative emissions options like direct air capture. We also explore the impacts of introducing hydrogen in the transportation and industry sectors, which can be seen in Figure 5. In the Carbon Neutral scenario, hydrogen makes up close to 10% of transportation final energy consumption and almost 20% of industrial energy consumption. This is particularly significant for industry as certain industrial processes depend on the use of fossil fuels, and a shift away from fossil fuels is necessary to reach carbon neutrality. Introducing hydrogen at a relatively large scale presents an alternate path to decarbonization while maintaining reasonable energy use levels and generation requirements.
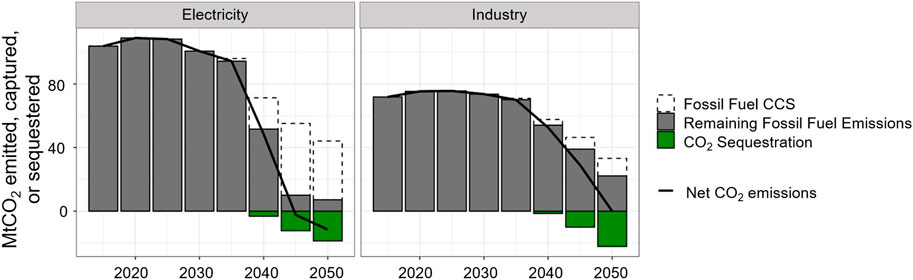
Figure 6. Reaching carbon neutrality in 2050 will require carbon sequestration for the power sector and industry. The dark grey bars represent CO2 emissions, and the green bars represent CO2 sequestration technologies. The dashed, white bars represent emissions that are immediately taken up by CCS.
3.5 Multilevel governance and the role of Kuala Lumpur
As the wealthiest and most populous city in Malaysia, contributing to about 15% of national GDP, Kuala Lumpur has the potential to significantly reduce CO2 emissions (Department of Statistics Malaysia, 2023). In the 2050 BAU scenario, Kuala Lumpur’s direct and indirect emissions were 7% of the country’s total at 26 MTCO2. In the Carbon Neutral scenario, Kuala Lumpur reduces nearly 90% of its emissions relative to BAU, resulting in residual emissions of 3 MTCO2 that are offset by measures at the national level. Figure 7 outlines the emissions in each scenario and the reductions between them. At the sector level, Kuala Lumpur contributes 13% of Malaysia’s total building emissions, 2% of industry emissions, and 13% of transportation emissions in a 2050 BAU case. While industry is a small–but nontrivial–percentage of total emissions, this reflects Kuala Lumpur’s relative lack of heavy industry compared to the rest of Malaysia.

Figure 7. An overview of direct and indirect emissions in Kuala Lumpur in 2050, and the progression of emissions reductions from BAU to the Policies scenario and from Policies to Carbon Neutral.
The impact of indirect emissions from electricity consumption in Kuala Lumpur is of particular importance, especially when it comes to collaboration between sub-national and national legislators. Increased electrification with a scale-up of renewable energy is a powerful mitigation tool, but, aside from rooftop solar power, Kuala Lumpur has limited control over this. Advances in energy efficiency, digitalization, and electrification in Kuala Lumpur need to be supported with similarly ambitious renewable energy infrastructure at the national level, otherwise, the city’s impact will be curbed. Therefore, multilevel governance and engagement are critical elements to reach carbon neutrality by 2050.
For direct emissions, Kuala Lumpur can have the most impact in the transportation sector, as this is the source of most of the city’s direct emissions. By promoting public transportation and electric vehicles, Kuala Lumpur can mitigate almost all direct transportation emissions, although its influence is limited as it only has jurisdiction within city boundaries; large-scale shifts in transportation need to be supported by the national government.
4 Discussion
With targeted, ambitious policy action in addition to what is currently planned, Malaysia can achieve its goal of carbon neutrality by 2050. Our modeling results show that widespread electrification across the buildings, industry, and transportation sectors is required to reach carbon neutrality. Vast electrification only makes the necessary impact when paired with decarbonization of the power sector. Increased deployment of renewable energy is therefore highly impactful for reducing emissions, considering the significant increase in projected future electricity consumption. On the demand side, energy-efficient measures and smart technologies can reduce energy consumption. This is particularly important for the largely electrified buildings sector and hard-to-mitigate industrial emissions. In the transportation sector, we find that near-full electrification is necessary to reach carbon neutrality alongside an increase in public transportation. In addition to these measures, the introduction of advanced technologies like hydrogen and CCS make carbon neutrality by 2050 attainable, with carbon dioxide removal playing a major role in sequestering residual emissions. Incorporating a land use sink to sequester carbon could be a valuable addition to Malaysia’s plans, but future land use change should be carefully considered as this can have a huge impact on emissions potential. Finally, we see that Kuala Lumpur contributes significantly to Malaysia’s emissions, and that ambitious city-level policies can have a large impact at the national level when supported by corresponding action in Malaysia as a whole. Including cities and a wide range of stakeholders in the development of the country’s LT-LEDS can therefore support Malaysia in achieving its various climate goals.
These results suggest a hopeful future for Malaysia’s ability to meet its NDC and beyond, but there may be implementation challenges during this energy and technology transition. Increasing the use of renewable energy while phasing out fossil fuels can result in intermittency issues due to variability in the availability of renewables, mainly solar and hydropower in Malaysia. The Malaysian government has been proactive in preparing for this emerging need for battery storage for excess renewable energy, and the MyRER states that a key action after 2025 will be to prioritize energy storage solutions (‘Malaysia Renewable Energy Roadmap’, 2021). Investment and financing can also be an obstacle, especially when it comes to advanced technologies like CCS. In Malaysia, PETRONAS, a leading global energy company, is actively collaborating with multiple major energy companies such as ExxonMobil, Shell, and JAPEX on CCS opportunities (Petroliam Nasional Berhad, 2022a; 2022b; 2023). Funding CCS development can help Malaysia reach carbon neutrality, in addition to creating jobs and improving the economy (International Trade Administration, U.S. Department of Commerce, 2023). Stakeholders in Malaysia are aware of the implementation challenges associated with decarbonization, and their climate action plans address numerous actions to face them. Discussing these barriers and the results of our analysis with stakeholders revealed many benefits of including them in IAM.
By including DBKL, NRECC, and SEDA in this analysis, we were able to receive direct feedback from the stakeholders throughout the entire process. This included conversations about data assumptions, baseline scenario results, policy information, and importantly, the alignment of our modeling process with the circumstances in Malaysia. Our engagement facilitated access to all the relevant policy and planning documents, data that may have been otherwise difficult to find, and allowed us to get clarification on content in any of these resources. These discussions allowed us to be more confident in our modeling, and for the stakeholders to be more accepting of our results. Without this stakeholder involvement, we may have designed scenarios that did not best fit their needs, lacked access to data sources and the most up to date planning documents, and conducted an analysis that was not useful. We were able to collaboratively develop scenarios that provided insights additional to analysis they had already conducted, like the Carbon Neutral scenario revealing specific further actions that are needed at the national and city levels. Now, DBKL, NRECC, and SEDA are likely to use the results we have worked toward together to inform their emissions mitigation planning.
This analysis exemplifies the benefits of stakeholder-engaged integrated assessment modeling, but the IAM itself has some areas of improvement. Due to data limitations regarding energy consumption at the sub-national level, alternative methods were used to downscale national energy consumption, as shown in Table 2. These methods may not have captured the entire scope of energy consumption and the related emissions in Kuala Lumpur, and result in downplaying the city’s true abatement potential. For example, our sub-national modeling did not include some urban technologies, such as rooftop solar, which would have increased the potential for renewable energy in Kuala Lumpur without relying on measures at the national scale. Additionally, baseline energy and emissions associated with industry and freight transport in Kuala Lumpur may be underestimated in our modeling. We downscale industry energy consumption based on the percent of industry in Kuala Lumpur, but there is a significant amount of industry clustered around the margins of the city. In GCAM-SEA, these emissions, and future emissions reductions, are attributed to the RoM. There is a similar case for freight transport, where only the energy consumed for shipping and aviation within Kuala Lumpur is allocated to the city. This fails to consider the energy associated with bringing merchandise from other areas in Malaysia to Kuala Lumpur. With additional data and engagement these limitations can be overcome, but they uncover some considerations that should be made when applying IAM to cities, like whether this level of complexity is needed.
Our experience has shown that both the IAM team and stakeholders benefit from a participatory process, such as the one used in this analysis. This engagement allowed PNNL and UTM to gain a deeper understanding of the modeling goals and needs of DBKL, NRECC, and SEDA to help inform their carbon mitigation planning. By including the stakeholders throughout this process, we were able to ensure our analysis was on the right track, and that it would be useful to the stakeholders. DBKL, NRECC, and SEDA will be able to use the results and recommendations from this analysis to develop future climate action plans and policies. Climate plans that reflect stakeholder needs can be more accurate and have a greater degree of buy-in, and hence can be a significant force aiding jurisdiction in making carbon neutral targets.
Data availability statement
The datasets presented in this study can be found in online repositories. The names of the repository/repositories and accession number(s) can be found below: https://github.com/JGCRI/gcam6p0_seasia.
Author contributions
MaW: Formal Analysis, Investigation, Methodology, Writing–original draft, Writing–review and editing. LP: Formal Analysis, Investigation, Methodology, Visualization, Writing–original draft, Writing–review and editing. LC: Methodology, Validation, Writing–review and editing. ZK: Conceptualization, Formal Analysis, Methodology, Project administration, Writing–review and editing. TW: Methodology, Visualization, Writing–review and editing. MiW: Conceptualization, Methodology, Writing–review and editing. GL: Methodology, Validation, Writing–review and editing. CH: Methodology, Validation, Writing–review and editing. ME: Conceptualization, Project administration, Supervision, Writing–review and editing.
Funding
The author(s) declare that financial support was received for the research, authorship, and/or publication of this article. This research was supported by the U.S. Department of State, Bureau of Energy Resources, Power Sector Program, in support of the Clean EDGE Asia initiative and the U.S.-ASEAN Smart Cities Partnership. PNNL is operated by Battelle Memorial Institute for the U.S. Department of Energy under Contract DE-AC05-76RL01830.
Acknowledgments
This research was supported by the U.S. Department of State, Bureau of Energy Resources, Power Sector Program, in support of the Clean EDGE Asia initiative and the U.S.-ASEAN Smart Cities Partnership. The authors would like to thank Aine Shiozaki of the U.S. Department of State and Helen Santiago Fink of the U.S.-ASEAN Smart Cities Partnership. Special thanks to the many representatives from the following Malaysian authorities who met with our team to provide input data, discuss our results, and offer invaluable feedback and suggestions: the Kuala Lumpur City Hall, Ministry of Natural Resources, Environment, and Climate Change, and Sustainable Energy Development Authority Malaysia.
Conflict of interest
The authors declare that the research was conducted in the absence of any commercial or financial relationships that could be construed as a potential conflict of interest.
The handling editor JB declared a past co-authorship with the author ZK.
Publisher’s note
All claims expressed in this article are solely those of the authors and do not necessarily represent those of their affiliated organizations, or those of the publisher, the editors and the reviewers. Any product that may be evaluated in this article, or claim that may be made by its manufacturer, is not guaranteed or endorsed by the publisher.
Supplementary material
The Supplementary Material for this article can be found online at: https://www.frontiersin.org/articles/10.3389/fenrg.2024.1336045/full#supplementary-material
Footnotes
1On 12 December 2023, NRECC was divided into the Ministry of Natural Resources and Environmental Sustainability (NRES) and the Ministry of Energy Transition and Public Utilities. Climate change matters will be handled by NRES, and this division post-dated the completion of our study.
References
Bergero, C., Binsted, M., Younis, O., Davies, E. G., Siddiqui, M. S., Xing, R., et al. (2022). Technology, technology, technology: an integrated assessment of deep decarbonization pathways for the Canadian oil sands. Energy Strategy Rev. 41, 100804. Available at:. doi:10.1016/j.esr.2022.100804
Calvin, K., Patel, P., Clarke, L., Asrar, G., Bond-Lamberty, B., Cui, R. Y., et al. (2019). GCAM v5.1: representing the linkages between energy, water, land, climate, and economic systems. Geosci. Model Dev. 12 (2), 677–698. Available at:. doi:10.5194/gmd-12-677-2019
Chau, L. W., et al. (2021). City climate change mitigation policy: a methodological perspective on the implementation of the Kuala Lumpur low carbon society blueprint (kl lcsbp) 2030. Chem. Eng. Trans. 89, 595–600. Available at:. doi:10.3303/CET2189100
Climate Watch Data Explorer (2020). Climate Watch Data Explorer. Available at: https://www.climatewatchdata.org/data-explorer (Accessed October 10, 2023).
Cohen, S. J. (1997). Scientist–stakeholder collaboration in integrated assessment of climate change: lessons from a case study of Northwest Canada. Environ. Model. Assess. 2 (4), 281–293. Available at:. doi:10.1023/A:1019077814917
Cui, R. Y., Hultman, N., Cui, D. Y., Mcjeon, H., Clarke, L., Yuan, J. H., et al. (2022). A U.S.‒China coal power transition and the global 1.5 °C pathway. Adv. Clim. Change Res. 13 (2), 179–186. Available at:. doi:10.1016/j.accre.2021.09.005
Department of Statistics Malaysia (2020). Population and housing census. Available at: https://www.dosm.gov.my/portal-main/release-content/mycensus-2020-population-well-being-social-relations (Accessed January 10, 2024).
Department of Statistics Malaysia (2023). Gross domestic product by state, Malaysia’s economic performance 2022. Available at: https://www.dosm.gov.my/portal-main/release-content/gross-domestic-product-gdp-by-state (Accessed November 9, 2023).
Economic and Social Commission for Asia and the Pacific (2018). Sustainable Energy in Asia and the Pacific: a statistical overview of energy and development. Available at: https://www.unescap.org/resources/statistical-perspectives-2018-sustainable-energy-asia-and-pacific (Accessed August 22, 2022).
Economic Planning Unit (2022). National energy policy 2022-2040. Available at: https://www.ekonomi.gov.my/sites/default/files/2022-09/National%20Energy%20Policy_2022_2040.pdf (Accessed November 20, 2022).
Edmonds, J., and Reilly, J. (1986). Global energy: assessing the future. Energy Policy 14 (5), 459–460. Available at:. doi:10.1016/0301-4215(86)90051-0
Fuhrman, J., Bergero, C., Weber, M., Monteith, S., Wang, F. M., Clarens, A. F., et al. (2023). Diverse carbon dioxide removal approaches could reduce impacts on the energy–water–land system. Nat. Clim. Change 13 (4), 341–350. Available at:. doi:10.1038/s41558-023-01604-9
Green Technology Master Plan Malaysia 2017-2030 (2017). Ministry of energy, green technology and water Malaysia. Available at: https://www.pmo.gov.my/wp-content/uploads/2019/07/Green-Technology-Master-Plan-Malaysia-2017-2030.pdf (Accessed November 4, 2022).
Hibino, G., and Masui, T. (2023). Development of AIM (Asia–Pacific integrated model) and its contribution to policy-making for the realization of decarbonized societies in Asia. Sustain. Sci. 19, 223–239. Available at:. doi:10.1007/s11625-023-01393-2
Ho, C. S., et al. (2020). Kuala Lumpur low carbon society blueprint 2030: summary for policymakers. Available at: https://www.dbkl.gov.my/kuala-lumpur-low-carbon-society-blueprint-2030/ (Accessed October 11, 2023).4
Hultman, N. E., Clarke, L., Frisch, C., Kennedy, K., McJeon, H., Cyrs, T., et al. (2020). Fusing subnational with national climate action is central to decarbonization: the case of the United States. Nat. Commun. 11 (1), 5255. Available at:. doi:10.1038/s41467-020-18903-w
International Institute for Applied Systems Analysis (2018). SSP public database. Available at: https://tntcat.iiasa.ac.at/SspDb/dsd?Action=htmlpage&page=30 (Accessed December 27, 2023).
International Trade Administration, U.S. Department of Commerce (2023). Malaysia energy carbon capture and storage. Available at: https://www.trade.gov/market-intelligence/malaysia-energy-carbon-capture-and-storage (Accessed March 21, 2024).
Kim, H., McJeon, H., Jung, D., Lee, H., Bergero, C., and Eom, J. (2022). Integrated assessment modeling of korea’s 2050 carbon neutrality technology pathways. Energy Clim. Change 3, 100075. Available at:. doi:10.1016/j.egycc.2022.100075
Kuala Lumpur City Hall (2021a). Draft Kuala Lumpur structure plan 2040. Available at: https://www.c40.org/case-studies/kuala-lumpur-structure-plan-2040/ (Accessed October 6, 2021).
Kuala Lumpur City Hall (2021b). Kuala Lumpur climate action plan 2050. Available at: https://www.dbkl.gov.my/wp-content/uploads/2021/06/C40_KLCAP2050_viewing-only-MR-single.pdf (Accessed June 13, 2022).
Lwasa, S., et al. (2022). “Urban systems and other settlements,” in Climate change 2022: mitigation of climate change. Contribution of working group III to the sixth assessment report of the intergovernmental panel on climate change. Editor P. R. Shukla (Cambridge, England: Cambridge University Press). Available at: https://www.ipcc.ch/report/ar6/wg3/downloads/report/IPCC_AR6_WGIII_FullReport.pdf (Accessed November 6, 2023).
Malaysia Energy Commission (2021). Report on peninsular Malaysia generation development plan 2020 (2021-2039). Available at: https://www.st.gov.my/ms/contents/files/download/169/Report_on_Peninsular_Malaysia_Generation_Development_Plan_2020_(2021-2039)-FINAL.pdf (Accessed November 10, 2022).
Malaysia Ministry of Economy (2021). Twelfth Malaysia plan 2021-2025. Available at: https://rmke12.ekonomi.gov.my/en (Accessed August 20, 2022).
Malaysia Renewable Energy Roadmap (2021). Sustainable energy development authority Malaysia. Available at: https://www.seda.gov.my/reportal/wp-content/uploads/2022/03/MyRER_webVer3.pdf (Accessed May 17, 2022).
Malaysia Energy Statistics Handbook 2020 (2020). Malaysia energy commission. Available at: https://www.st.gov.my/en/contents/files/download/116/Malaysia_Energy_Statistics_Handbook_20201.pdf (Accessed May 3, 2023).
Malaysian Standards 1525: 2019 (2019). Energy efficiency and use of renewable energy for non-residential buildings. Sustain. Energy Dev. Auth. Malays. Available at: https://www.seda.gov.my/pdfdownload/malaysian-standards-ms-1525-2019-energy-efficiency-and-use-of-renewable-energy-for-non-residential-buildings/ (Accessed August 20, 2022).
Malaysia’s update of its first nationally determined contribution (2021). UNFCCC. Available at: https://unfccc.int/sites/default/files/NDC/2022-06/Malaysia%20NDC%20Updated%20Submission%20to%20UNFCCC%20July%202021%20final.pdf.
Ministry of Environment and Water (2020). Low carbon mobility blueprint 2021-2030. Available at: https://www.mgtc.gov.my/wp-content/uploads/2021/11/Low-Carbon-Mobility-Blueprint-2021-2030.pdf (Accessed August 20, 2022).
Ministry of Transport Malaysia (2019). National transport policy 2019-2030. Available at: https://www.pmo.gov.my/wp-content/uploads/2019/10/National-Transport-Policy-2019_2030EN.pdf (Accessed August 20, 2022).
Nakagami, H., Murakoshi, C., and Iwafune, Y. (2008). International comparison of household energy consumption and its indicator. Available at: https://www.eceee.org/media/uploads/site-2/library/conference_proceedings/ACEEE_buildings/2008/Panel_8/8_24/paper.pdf (Accessed September 30, 2022).
Nathan, R. (2021). Malaysia sets 2050 carbon-neutral goal | Argus Media. Available at: https://www.argusmedia.com/en//news/2258221-malaysia-sets-2050-carbonneutral-goal (Accessed October 12, 2023).
National Energy Efficiency Action Plan (2015). Ministry of energy, green technology and water Malaysia. Available at: https://www.pmo.gov.my/wp-content/uploads/2019/07/National-Energy-Efficiency-Action-Plan.pdf (Accessed November 5, 2022).
O’Neill, B. C., Carter, T. R., Ebi, K., Harrison, P. A., Kemp-Benedict, E., Kok, K., et al. (2020). Achievements and needs for the climate change scenario framework. Nat. Clim. Change 10 (12), 1074–1084. Available at:. doi:10.1038/s41558-020-00952-0
Ou, Y., Iyer, G., Clarke, L., Edmonds, J., Fawcett, A. A., Hultman, N., et al. (2021). Can updated climate pledges limit warming well below 2°C?. Science 374 (6568), 693–695. Available at:. doi:10.1126/science.abl8976
Parker, P., Letcher, R., Jakeman, A., Beck, M., Harris, G., Argent, R., et al. (2002). Progress in integrated assessment and modelling1A summary of a workshop on integrated assessment and modelling, held at EcoSummit 2000: integrating the sciences, halifax, june 18–22, 2000. See costanza and jorgensen (2001) for a further report on Ecosummit.1. Environ. Model. Softw. 17 (3), 209–217. Available at:. doi:10.1016/S1364-8152(01)00059-7
Petroliam Nasional Berhad (2022a). PETRONAS and Shell collaborate on carbon capture and storage solutions. Available at: https://www.petronas.com/media/media-releases/petronas-and-shell-collaborate-carbon-capture-and-storage-solutions (Accessed March 21, 2024).
Petroliam Nasional Berhad (2022b). PETRONAS partners with JAPEX on carbon capture and storage solutions. Available at: https://www.petronas.com/media/media-releases/petronas-partners-japex-carbon-capture-and-storage-solutions (Accessed March 21, 2024).
Petroliam Nasional Berhad (2023). PETRONAS, ExxonMobil sign CCS project development agreements. Available at: https://www.petronas.com/media/media-releases/petronas-exxonmobil-sign-ccs-project-development-agreements (Accessed March 21, 2024).
Poolsawat, K., Tachajapong, W., Prasitwattanaseree, S., and Wongsapai, W. (2020). Electricity consumption characteristics in Thailand residential sector and its saving potential. Energy Rep. 6, 337–343. Available at:. doi:10.1016/j.egyr.2019.11.085
Salter, J., Robinson, J., and Wiek, A. (2010). Participatory methods of integrated assessment—a review. WIREs Clim. Change 1 (5), 697–717. Available at:. doi:10.1002/wcc.73
State of residential energy consumption in Southeast Asia (2017), State of residential energy consumption in Southeast Asia. Available at: https://www.belda.asia/wp/wp-content/uploads/2017/11/eceee-2017-presentation-7-013-17-Chiharu-Murakoshi.pdf.
Unfccc (2023). Nationally determined contributions registry. Available at: https://unfccc.int/NDCREG (Accessed November 9, 2023).
United Nations Department of Economic and Social Affairs (2022). World population prospects. Available at: https://population.un.org/wpp/Graphs/Probabilistic/POP/TOT/458 (Accessed December 27, 2023).
United States Department of State and United States Executive Office of the President (2021). The long-term strategy of the United States, pathways to net-zero greenhouse gas emissions by 2050. Available at: https://www.whitehouse.gov/wp-content/uploads/2021/10/US-Long-Term-Strategy.pdf (Accessed November 4, 2023).
Universiti Teknologi Malaysia Low Carbon Asia Research Center (2013). Low carbon society blueprint for iskandar Malaysia 2025. Available at: https://www.greenpolicyplatform.org/sites/default/files/downloads/resource/Low%20Carbon%20Society%20Blueprint%20For%20Iskandar%20Malaysia%202025%20Summary%20for%20Policymakers.pdf (Accessed: October 14, 2023).
Weyant, J., Davidson, O., Dowlatabadi, H., Edmonds, J., Grubb, M., Parson, E. A., et al. (1996). “Integrated assessment of climate change: an overview and comparison of approaches and results,” in Climate change 1995 - economic and social dimensions of climate change (Cambridge, England: Cambridge University Press), 367–396. Available at: https://wecanfigurethisout.org/ENERGY/Web_notes/Bigger_Picture/Where_do_we_go_Supporting_Files/1996%20-%20Weyant%20-%20Integrated%20Assessment%20of%20Climate%20Change%20-%20An%20Overview%20&%20Comparison%20of%20Approches%20&%20Results.pdf (Accessed: May 15, 2023).
World Development Indicators (2023). The world bank. Available at: https://databank.worldbank.org/source/world-development-indicators/Series/EN.ATM.CO2E.PC (Accessed October 12, 2023).
Keywords: integrated assessment model (IAM), stakeholder engagement, Malaysia, Kuala Lumpur, cities, decarbonization
Citation: Weber M, Pressburger L, Chau LW, Khan Z, Waite T, Westphal MI, Ling GHT, Ho CS and Evans M (2024) Carbon neutrality in Malaysia and Kuala Lumpur: insights from stakeholder-driven integrated assessment modeling. Front. Energy Res. 12:1336045. doi: 10.3389/fenrg.2024.1336045
Received: 09 November 2023; Accepted: 01 April 2024;
Published: 18 April 2024.
Edited by:
Jeffrey M. Bielicki, The Ohio State University, United StatesReviewed by:
Kelsea Best, The Ohio State University, United StatesMikiko Kainuma, Institute for Global Environmental Strategies, Japan
Copyright © 2024 Weber, Pressburger, Chau, Khan, Waite, Westphal, Ling, Ho and Evans. This is an open-access article distributed under the terms of the Creative Commons Attribution License (CC BY). The use, distribution or reproduction in other forums is permitted, provided the original author(s) and the copyright owner(s) are credited and that the original publication in this journal is cited, in accordance with accepted academic practice. No use, distribution or reproduction is permitted which does not comply with these terms.
*Correspondence: Maridee Weber, maridee.weber@pnnl.gov