Effect of steam reinjection mass flow rate on the SOFC–GT system with steam reinjection
 Hang Zhao1
  Puyan Zheng1*
  Qunzhi Zhu1
  Xiangpeng Zhang1 Zehua Lan2 Zaiguo Fu1 Tian Luo1 Renhu Shen1 Jiahao Cheng1
- 1College of Energy and Mechanical Engineering, Shanghai University of Electric Power, Shanghai, China
- 2Gansu Diantong Power Engineering Design Consulting Co., Ltd., Lanzhou, Gansu, China
A solid oxide fuel cell (SOFC) is regarded as the first choice of high-efficiency and clean power generation technology in the 21st century due to its characteristics of high power generation efficiency and low pollutant emission. In this paper, hydrogen is used as a fuel for SOFCs using the EBSILON platform. A sensitivity analysis of the solid oxide fuel cell–gas turbine (SOFC–GT) system with steam reinjection is carried out to investigate the effect of the steam reinjection mass flow rate on the improvement of the electrical efficiency of the system and on the values of the other parameters. The results show that the variation in the steam reinjection mass flow rate has an effect on other parameters. Changes in several parameters affect the electrical efficiency of the system, which reaches 74.11% at a pressure ratio of 10, SOFC inlet temperature of 783.15 K, turbine back pressure of 70 kPa, and steam reinjection mass flow rate of 6.16 kg/s. Future research can optimize the overall parameter selection of the system in terms of economy and other aspects.
1 Introduction
In recent years, global energy shortages and global warming have led both developed and developing countries to recognize the importance of reliable and sustainable power generation (Morrison, 2004) and develop a strategy to control CO2 emissions (Kang et al., 2020). It is well known that traditional energy sources such as fossil fuels like oil and coal have been used for a long time and have had an impact on the environment. In particular, the greenhouse effect is caused by the large amount of carbon dioxide gas produced when these fuels are burned (Lelieveld et al., 2019). As a result, low-carbon, high-calorific value hydrogen energy is gaining importance. The use of hydrogen fuel in practical applications has been growing rapidly due to technological advances and the increasing awareness of the environmental and economic benefits of using hydrogen energy (Liu et al., 2020). Hydrogen energy is already widely used in fuel cells, rocket engines, and internal combustion engines (Ngoh and Njomo, 2012). Solid oxide fuel cells (SOFCs) convert the chemical energy in the fuel directly into electrical energy through an electrochemical redox reaction. Due to its high efficiency and low pollutant and carbon emissions, the SOFC has become the most promising way of power generation (Yi, 2000), and it also provides an efficient way of using hydrogen energy for power generation. The SOFC is a high-temperature fuel cell with an operating temperature of 923.15–1,273.15 K (Huang, 2004), and its exhaust has a high value for utilization. SOFCs can be combined with gas turbines to form a combined power generation system to improve the electrical efficiency of the system, which is an effective means to use the heat from SOFC exhaust. Some scholars have also proposed coupling the SOFC with other equipment to form a cogeneration waste heat utilization method (Wu et al., 2019; Ding et al., 2023).
The solid oxide fuel cell–gas turbine (SOFC–GT) system generally consists of a compressor, preheater, reformer, SOFC, combustion chamber, expander, and generator. Many scholars have analyzed and studied the SOFC–GT system (Chen et al., 2006; Suther et al., 2011; Gandiglio et al., 2013; Shamoushaki et al., 2017; Biert et al., 2018; Cheng et al., 2019; Yu et al., 2020), not only to perform sensitivity analysis on key parameters, such as pressure ratio (Suther et al., 2011; Gandiglio et al., 2013; Shamoushaki et al., 2017; Biert et al., 2018; Yu et al., 2020), fuel utilization (Suther et al., 2011; Shamoushaki et al., 2017; Biert et al., 2018), SOFC operating temperature (Suther et al., 2011; Shamoushaki et al., 2017; Biert et al., 2018; Yu et al., 2020), and turbine inlet temperature (Suther et al., 2011; Shamoushaki et al., 2017), but also to optimize the selection of parameters for the system. It was found that increasing the pressure within a certain range would lead to an increase in the electrical efficiency of the system, and continuing to increase the pressure would lead to a decrease in the electrical efficiency. However, the different parameter settings used in different studies lead to differences in the resulting optimal pressure ratios. The effect of fuel utilization is more complex and, together with the isentropic efficiency of the turbine, determines the system electrical efficiency. When considering the effect of the SOFC’s operating temperature, the higher the SOFC’s operating temperature, the higher the electrical efficiency of the system. The turbine inlet temperature is negatively correlated with the system electrical efficiency. At the same time, it is found through the study of the SOFC–GT system that even if there is heat recovery, the exhaust temperature grade of the system is high, and it still has great utilization value (Chen et al., 2006).
There has been a great deal on the waste heat utilization of SOFC–GT system exhaust, and since the exhaust temperature of the SOFC–GT system is generally greater than 573.15 K, some scholars pass the exhaust into the heat recovery steam generator (HRSG) to generate superheated steam (Kuchonthara et al., 2003; Motahar and Alemrajabi, 2009; Onda et al., 2003; Ahmadi et al., 2017; Chitgar et al., 2019; Kumar and Singh, 2019; Karimi et al., 2020; Mojaver et al., 2020; Singh and Singh, 2021; Zhong et al., 2022; Guo et al., 2023; Liu et al., 2023; Xia et al., 2023). A large number of studies also exist on the utilization of the superheated steam generated by the waste heat, one is to inject the generated steam into the GT in the upstream SOFC–GT system for utilization (Kuchonthara et al., 2003; Motahar and Alemrajabi, 2009; Onda et al., 2003), and the other is to utilize the generated steam in other ways to complete the waste heat utilization (Ahmadi et al., 2017; Chitgar et al., 2019; Kumar and Singh, 2019; Karimi et al., 2020; Mojaver et al., 2020; Singh and Singh, 2021; Zhong et al., 2022; Guo et al., 2023; Liu et al., 2023; Xia et al., 2023), including, but not limited to, refrigeration systems (Singh and Singh, 2021), supercritical CO2 cycle (Guo et al., 2023; Xia et al., 2023), Carina cycles (Chitgar et al., 2019), organic Rankine cycles or steam Rankine cycles (Cheng et al., 2019; Kumar and Singh, 2019; Karimi et al., 2020; Mojaver et al., 2020; Xia et al., 2023), and other utilization methods (Ahmadi et al., 2017; Zhong et al., 2022).
The SOFC–GT systems in the three studies that use steam to recover waste heat from downstream to upstream for power generation have essentially similar system structures, but there are differences. Although the structure of each system differs, the main idea of all three studies is to achieve waste heat recovery by preheating air and fuel and generating superheated steam as a way to achieve an increase in system electrical efficiency. For the way to inject steam back into the GT in the upstream SOFC–GT system for utilization, this paper is called the SOFC–GT system with steam reinjection. For the parameters of the SOFC–GT system with steam reinjection, Kuchonthara et al. (2003) investigated the effect of pressure ratio, fuel utilization, and turbine inlet temperature on the system. The results show that the system with heat and steam recovery has higher overall efficiency than the system with only heat recovery and that higher efficiency can be achieved at high turbine inlet temperatures and optimal pressure ratios. Motahar and Alemrajabi (2009) used exergy performance as an evaluation standard to study the impact of pressure ratio, current density, and pinch point temperature difference on the system. It was found that there is an optimal pressure ratio for exergy efficiency to reach the maximum. The lower the current density, the greater the exergy efficiency; the smaller the pinch point temperature difference, the greater the exergy efficiency. Onda et al. (2003) studied the effects of fuel cell operating temperature and pressure, fuel–air recirculation ratio, current density, fuel–air utilization rate, and fuel reforming rate on the power generation efficiency of the system.
The literature review shows that the researchers have analyzed the parameters of the systems they have studied, establishing the relationship between the variation in the system parameters and the evaluation indicators. However, we also note that for the SOFC–GT system with steam reinjection, the researchers have studied it with a defined steam reinjection mass flow rate and have not considered the effect of changes in the steam reinjection mass flow rate on the system and other thermodynamic parameters. In this paper, hydrogen is used as the fuel of the SOFC, and the electrical efficiency of the system is used as the evaluation index to study the thermodynamic characteristics of the SOFC–GT system with steam reinjection. Moreover, this study carried out the thermodynamic analysis of system parameters such as steam reinjection mass flow rate, compressor pressure ratio, fuel cell inlet temperature, and turbine back pressure. This study focuses on the variable steam reinjection mass flow rate. By studying the influence of the change in the steam reinjection mass flow rate on the trend of the system evaluation indexes and other parameters, this study not only establishes the relationship between the system parameters and evaluation indexes but also identifies the optimal value or optimal selection range of the other thermodynamic parameters, so as to provide a reference for the engineering application of the SOFC–GT system with steam reinjection.
2 System scheme
2.1 Solid oxide fuel cell–gas turbine system
Figure 1A shows the schematic diagrams of an SOFC–GT system. Air and gas fuel are directed to the air compressor (AC) and fuel compressor (FC) through pipelines 1 and 2, respectively, to be compressed to a given pressure and then through pipelines 3 and 4, respectively, into the preheater (PH1 and PH2) to absorb the heat from the turbine exhaust for preheating. The heated air and fuel are then transported to the cathode channel and anode channel of the SOFC through pipes 5 and 6. In SOFCs, the gaseous fuel reacts electrochemically with the oxygen in the air to produce electricity directly. The exhaust from the SOFC enters the afterburner (AB). The fuel that is not involved in the electrochemical reaction is reignited with the remaining oxygen in the air to further increase the temperature of the spent gas, which is then injected into the turbine (TUR) through pipeline 7 to perform expansion work. The expansion work of the turbine partly drives the AC and FC, and the other part drives the generator (GEN) to generate electricity. As the turbine exhaust temperature is still high, heat recovery is achieved using the PH to heat the compressed gas to a given temperature.
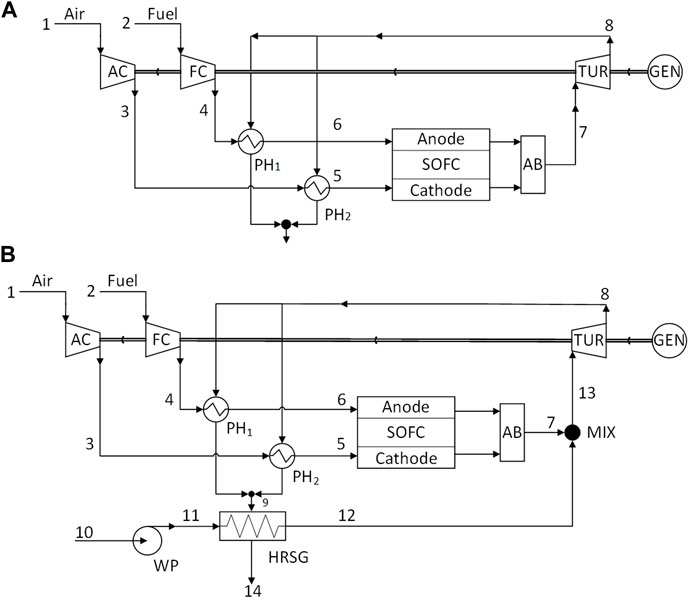
FIGURE 1. (A) SOFC–GT system; (B) SOFC–GT system with steam reinjection.
2.2 Solid oxide fuel cell–gas turbine system with steam reinjection
The research on the SOFC–GT system shows that even if the heat recovery system is set, the outlet gas temperature of pipeline 9 in Figure 1A is still high, which still has great utilization value (Chen et al., 2006). In this paper, the SOFC–GT system of steam reinjection constructed using the waste heat generated from the spent gas in pipeline 9 is shown in Figure 1B, which is called the SOFC–GT system with steam reinjection. Therefore, the SOFC–GT system can also be referred to as the SOFC–GT system without steam reinjection. As shown in Figure 1B, the top cycle part is similar to the SOFC–GT system, but the spent gas discharged from the PH1 and PH2 is directed to the HRSG through pipeline 9 to heat water and produce steam. The water at ambient temperature and pressure enters the water pump (WP) through pipe 10 and pressurizes to a pressure higher than the outlet pressure of AB and then enters the HRSG. The water absorbs the waste heat from the top circulation exhaust in the HRSG and converts it into superheated steam, which is injected into the outlet of the AB through pipeline 12, mixed with the exhaust from AB, and then, directed to the turbine for work through the pipeline.
3 Thermal performance analysis model
3.1 Solid oxide fuel cell model
The SOFC model in this paper is based on the SOFC model in EBSILON software, but the influence of input air and fuel parameter changes needs to be considered. The power generated by the SOFC is determined according to the following equation:
where WSOFC is the power generated by the SOFC. mf is the fuel mass flow rate. LHV is the low heating value of fuel. ηeSOFC is the electricity generation efficiency of the SOFC. Uf is the fuel utilization rate of the SOFC.
It has been proven that when the SOFC inlet pressure is greater than 2 bar, the inlet pressure has a negligible effect on the SOFC electricity generation efficiency. However, the inlet temperature of the SOFC has a certain effect on the SOFC electricity generation efficiency. The relationship between SOFC electricity generation efficiency and SOFC inlet temperature was investigated by Hanbing et al. (2021), and the results are shown in Figure 2.
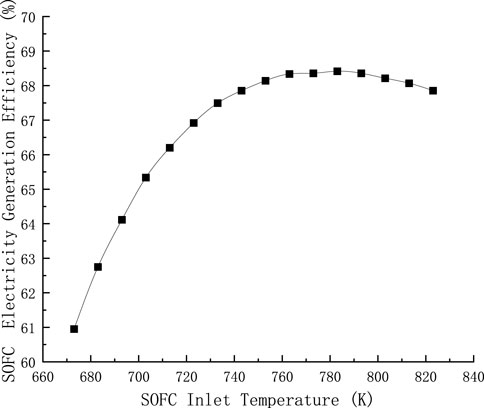
FIGURE 2. Effect of SOFC inlet temperature on electricity generation efficiency.
The SOFC electricity generation efficiency in Eq. 1 can be derived from the relationship between SOFC electricity generation efficiency and inlet temperature in Figure 2, which can be obtained by curve fitting as follows:
where TinSOFC is the SOFC inlet temperature.
The mass conservation equation for each component in the fuel cell is shown in Eq. 3
where subscript i is the gas composition. Subscript k is the chemical reaction component. Min is the mass flow rate of gas into the SOFC. Mout is the mass flow rate of gas out of the SOFC. V is the chemical reaction equivalence factor. R is the chemical reaction rate.
3.2 Compressor model
The compressor is used to increase the pressure of liquid from the condenser, and the outlet pressure of the compressor can be calculated as follows (Wu et al., 2021):
where PinC and PoutC are the pressures of compressor inlet gas and outlet gas, respectively. πC is the compressor pressure ratio.
Neglecting the heat loss of the compressor, its isentropic efficiency is defined as shown in Eq. 5
where ηC’ is the isentropic efficiency of the compressor. hinC and houtC are the enthalpies of the inlet and outlet gases of the compressor, respectively.
Since the gas mixture is an ideal gas, the isentropic enthalpy of the compressor can be derived from Eq. 6 (Wu et al., 2021). Then, the power consumption of the compressor can be found according to Eq. 7 (Wu et al., 2021).
where TinC and
3.3 Turbine model
The outlet pressure of the turbine can be found using the following equation (Chen et al., 2019):
where PinTUR and PoutTUR are the pressures of turbine inlet gas and outlet gas, respectively. πTUR is the expansion ratio of the turbine.
Similar to the compressor, the isentropic temperature for TUR adiabatic operation can be found when the gas mixture is an ideal gas, and the isentropic enthalpy can be determined from the isentropic temperature. The isentropic enthalpy is incorporated into Eq. 9 (Chen et al., 2019) to find the actual outlet enthalpy.
From this, the work done by the turbine can be found according to the following equation (Chen et al., 2019):
where WTUR is the TUR output power.
3.4 Afterburner model
Neglecting the heat dissipation loss in the AB, the temperature of the gas mixture after complete combustion of the fuel is obtained according to the following equation (Zhang, 2022):
where ηAB is the AB combustion efficiency. TinAB and ToutAB are the temperatures of the gas inlet and outlet of the AB, respectively.
The temperature after the mixing of steam with the outlet gas of the AB can be obtained according to Eq. 12, and the mass flow rate can be obtained according to Eq. 13.
where ToutMIX is the outlet temperature of the mixing point. Tins is the steam temperature. moutMIX is the mass flow rate of the mixing point outlet.
3.5 Heat recovery steam generator model
The HRSG consists of an economizer, evaporator, and superheater. The HRSG composite curve of hot and cold streams is depicted in Figure 3. The heat loss of the HRSG is ignored in the calculation of this paper.
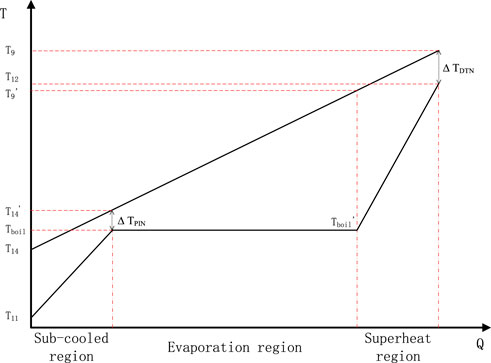
FIGURE 3. HRSG temperature profile.
The difference between the outlet temperature of the economizer and the temperature of saturated vapor is called the approach point (ΔTap). ΔTap can be ignored in the vertical tube economizer (Sanaye and Asgari, 2013). The terminal temperature difference of the HRSG is defined as follows:
In addition, the pinch point of the waste heat boiler is defined as
where ΔTDTN is the terminal temperature difference of the HRSG. ΔTPIN is the pinch point of the HRSG. Tboil is the temperature of saturated vapor.
From Figure 3, it can be seen that according to the law of conservation of energy, the equation of the sub-cooling region is shown in Eq. 16
For the evaporation region, the relation is given by
For the superheated region, the relation is given by
where mgas is the hot-side mass flow rate and ms is the cold-side mass flow rate.
3.6 Performance criteria
The power generated by the GEN is derived from the following equation:
where WGEN is the power generated by the GEN. WAC is the work consumed by the AC. WFC is the work consumed by the FC. ηm is the mechanical efficiency. ηGEN is the efficiency of the GEN.
The calculation flowchart of this paper is shown in Figure 4, and the total electrical efficiency of the system is used to evaluate the energy utilization efficiency of the system. The total electrical efficiency of the system can be obtained from the following equation (Zhang, 2022):
where η is the system electrical efficiency. WWP is the pump power consumption.
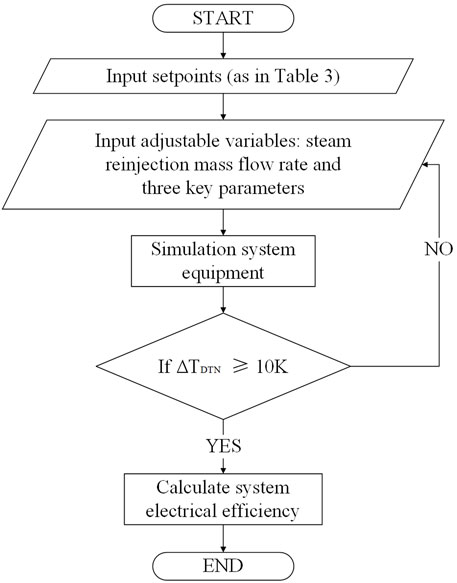
FIGURE 4. Calculation flowchart of system electrical efficiency.
3.7 Simulation
The thermal performance of the system scheme can be studied by establishing a simulation model. In this paper, the simulation models of the SOFC–GT system without steam reinjection and SOFC–GT system with steam reinjection are built using EBSILON software developed by STEAG Power.
In order to verify the accuracy of the computational model and related calculation methods used in this paper, the simulation results of the SOFC–GT system without steam reinjection were compared with the relevant data in the work of Chen et al. (2019). When the fuel mass flow rate is 9.62 g/s, the air mass flow rate is 400 g/s. The simulation results of the system are shown in Table 1.
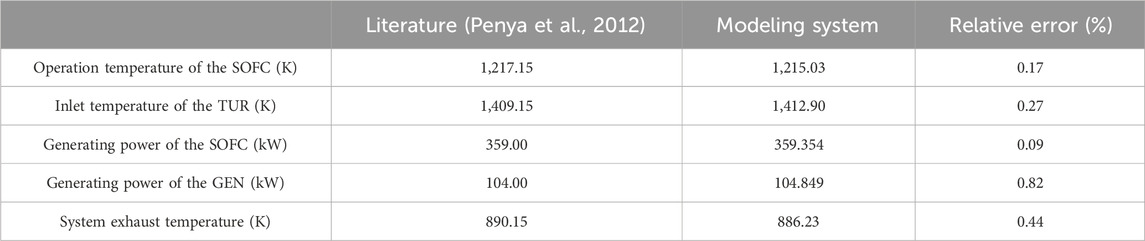
TABLE 1. SOFC–GT system simulation results.
As can be seen from Table 1, under the condition of the same parameter setting, the simulation results in this paper are in good agreement with the experimental data in the work of Penya et al. (2012), and the error is less than 1%.
4 Analysis and comparison
4.1 Comparison of systems
In this section, the SOFC–GT system with steam reinjection is compared with the SOFC–GT system without steam reinjection through simulation, while the system parameter settings are given in Table 2.
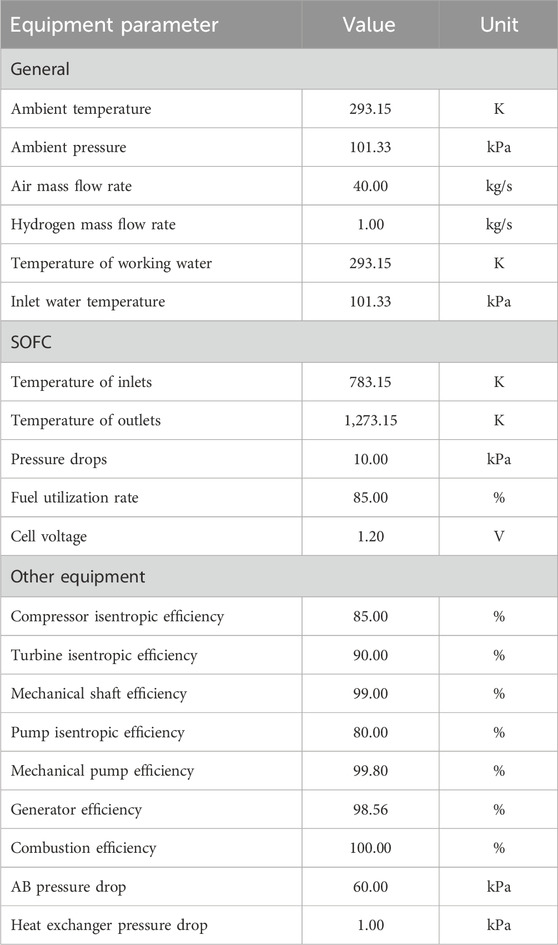
TABLE 2. System design parameter.
For SOFC–GT systems with steam reinjection, when the pressure loss of each piece of equipment in the system is fixed, the pressure ratio determines the outlet pressure of the AB. The pressure of the injected steam is set to 1 kPa above the pressure at the outlet of the AB so that the pressure ratio determines the pressure of the injected steam. The temperature of the injected steam is determined by the terminal temperature difference of the HRSG. The saturation temperature of the steam, Tboil, can be determined given the pressure of the steam to be injected. Combining Eqs 17 and 18, 21 is obtained. For the evaporation and superheat regions, there are
Since the temperature and mass flow rate of the flue gas are constant, i.e., h9 and mgas are known, the saturation temperature of the steam, Tboil, is determined with the known return steam pressure, i.e., hboil. The mass flow rate of the reinjection steam can be determined by different ΔTPIN, provided that ΔTDTN remains unchanged. The smaller the pinch point, the higher the mass flow rate. In addition, the value of the terminal temperature difference is generally in the range of 10–20 K. In this paper, we take the end difference of the HRSG as 10 K. The value of the pinch point is generally in the range of 8–10 K, and the pinch point of the HRSG is taken as 8 K in this study. For a given parameter setting, the maximum steam reinjection mass flow rate of the SOFC–GT system with steam reinjection can reach 8.13 kg/s, while when the steam reinjection mass flow rate is 0 kg/s, the system is a SOFC–GT system without steam reinjection.
Table 3 shows the calculated results for each point of the SOFC–GT system without steam reinjection and the SOFC–GT system with steam reinjection at a steam reinjection mass flow rate of 8.13 kg/s. For a given parameter, each point of the two systems from point 1 to point 7 corresponds to the same parameter. There is a small drop in the inlet temperature of the TUR after the steam is injected back into the outlet of the AB. The exhaust temperature of the SOFC–GT system with steam reinjection decreases significantly compared with that of the SOFC–GT system without steam reinjection, from 856.33 K to 373.62 K.
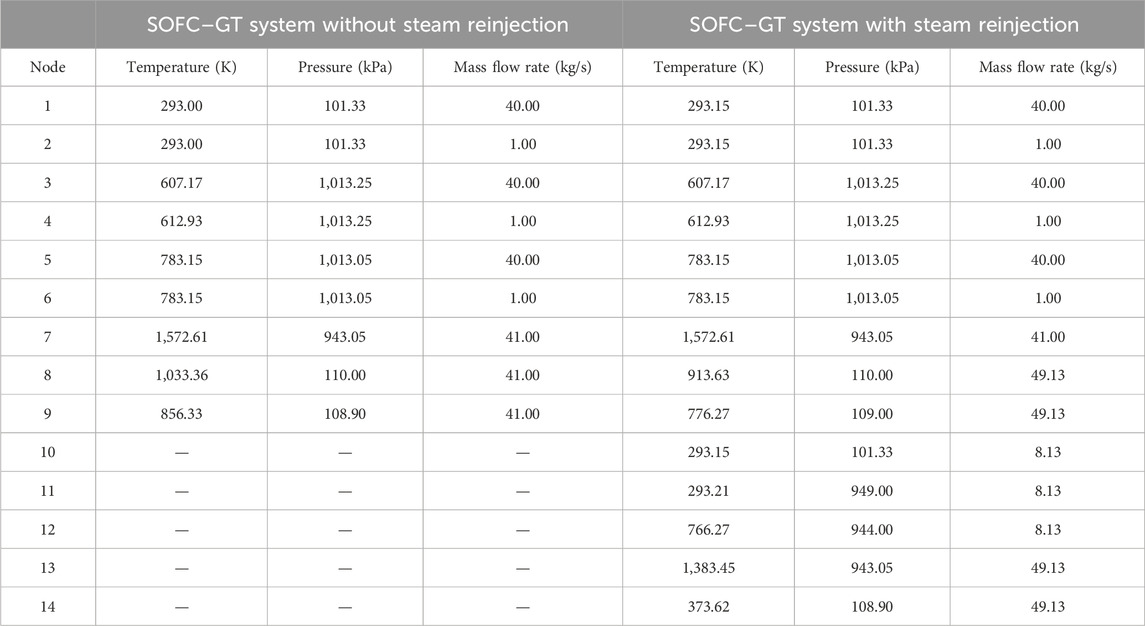
TABLE 3. Calculation results of system parameters at each point.
Table 4 shows the calculation results of system performance of the two systems. As can be seen from Table 4, compared to the SOFC–GT system without steam reinjection, the power consumption of the compressor in the SOFC–GT system with steam reinjection remains unchanged, but the power of the TUR increases by 4.12 MW. As a result, the SOFC–GT system with steam reinjection adds a WP with a power consumption of 0.009 MW, but the total power generated by the system increases by 4.06 MW and the electrical efficiency of the system increases from 70.14% to 73.52%.
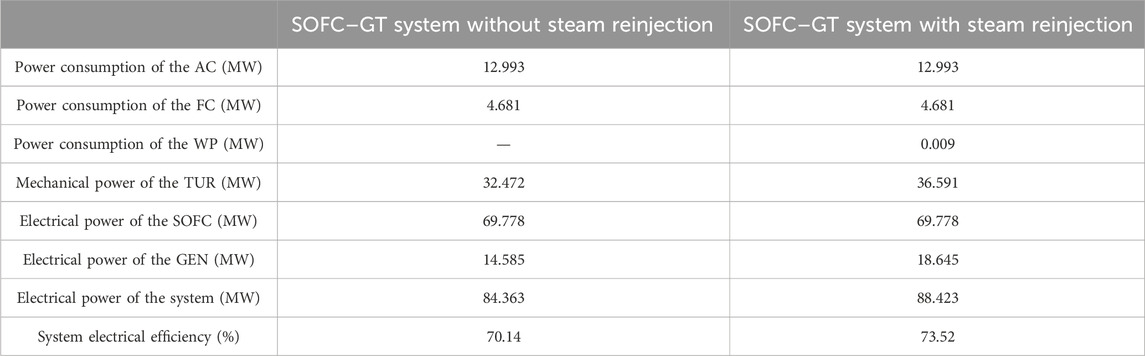
TABLE 4. Calculation results of the energy efficiency of the key equipment of the system.
4.2 Effect of steam reinjection mass flow rate on the electrical efficiency of the system
In this section, to study the effect of steam reinjection mass flow rate on the SOFC–GT system with steam reinjection, the AC and FC pressure ratio is set to 10, the SOFC inlet temperature is 783 K, and the TUR back pressure is set to 110 kPa. The steam reinjection mass flow rate can vary from 0 kg/s to the maximum value that can be achieved.
Figure 5 depicts the variation in electrical efficiency, steam temperature, system exhaust temperature, and dew point temperature with steam reinjection mass flow rate. Under a given parameter condition, as the steam reinjection mass flow rate increases, the steam temperature decreases slightly, the exhaust temperature of the system decreases substantially, and the electrical efficiency of the system increases. The reason for this phenomenon is that the working water absorbs heat from the TUR exhaust and mixes with the AB exhaust. However, lowering the inlet temperature of the TUR reduces the efficiency of the thermal cycle and concurrently increases the power consumption of the WP. At the same time, it also increases the mass flow rate into the TUR to perform work and causes the exhaust temperature of the TUR to drop significantly, thus increasing the system electrical efficiency. In addition, the dew point temperature of the system exhaust increases slightly when the steam reinjection mass flow rate increases, but the system exhaust temperature is always higher than the dew point temperature. This indicates that the water at the turbine outlet is always in a liquid state and does not undergo condensation.
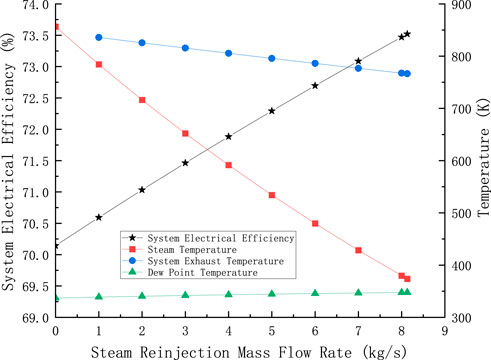
FIGURE 5. Effect of steam reinjection mass flow rate on system electrical efficiency, steam temperature, and system exhaust temperature.
4.3 Effect of steam reinjection mass flow rate on different pressure ratios
The SOFC inlet pressure at greater than 200 kPa has no significant effect on the efficiency of the SOFC, but the change in pressure ratio will cause a change in compressor power consumption. At the same time, it will also affect the pressure of reinjection steam and, thus, affect the electrical efficiency of the system. In this section, we aim to study the effect of the pressure ratio on the SOFC–GT system with steam reinjection. The inlet and outlet temperature and power generation of the SOFC do not change, and only the inlet and outlet pressures are changed. In other words, it is considered that the change in air and fuel pressure has no influence on the SOFC. In addition, the TUR back pressure is fixed at 110 kPa.
Figure 6A depicts the relationship between system electrical efficiency and steam reinjection mass flow rate for different pressure ratios. When the pressure ratio is determined, the system electrical efficiency increases with the increase in the steam reinjection mass flow rate. At the same time, the maximum steam reinjection mass flow rate decreases as the pressure ratio increases.
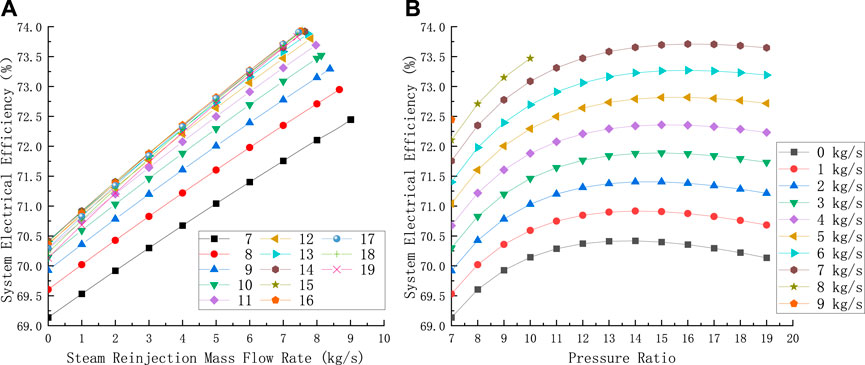
FIGURE 6. (A) Effect of steam reinjection mass flow rate at different pressure ratios on the electrical efficiency of the system; (B) effect of the pressure ratio at different steam reinjection mass flow rates on the electrical efficiency of the system.
Figure 6B shows the variation in the system electrical efficiency with the pressure ratio for different steam reinjection mass flow rates, from which it can be seen that there is an optimal pressure ratio to maximize the system electrical efficiency. However, this optimal pressure ratio is affected by the steam reinjection mass flow rate, and as the steam reinjection mass flow rate increases, not only does the system electrical efficiency increase but also the optimal pressure ratio increases. When the steam reinjection mass flow rate is high, the pressure ratio limits the mass flow rate of steam injected, making the optimal pressure ratio not appear. The maximum electrical efficiency of the system at this point depends on the maximum steam reinjection mass flow rate. The reason for the above phenomenon is that when the pressure ratio increases, the work done by the TUR increases, and at the same time, the work consumed by the AC and FC also increases. Therefore, there is an optimal pressure ratio that maximizes the system’s electrical efficiency. When steam is injected into the TUR, the work done by the TUR increases while the work consumed by the AC and FC remains the same, so the optimal pressure ratio increases. Therefore, when considering the selection of the optimal pressure ratio, the effect of the steam reinjection mass flow rate needs to be considered as well.
Figure 6B shows that the maximum electrical efficiency of the system is not only related to the pressure ratio but also to the steam injected mass flow rate. Figure 6 shows the maximum steam reinjection mass flow rate at different pressure ratios and the variation in the maximum electrical efficiency of the system at this pressure ratio. From Figure 7, it can be concluded that as the pressure ratio increases, the maximum steam reinjection mass flow rate gradually decreases, but the corresponding system electrical efficiency shows a trend of increasing and then decreasing. The maximum system electrical efficiency of 73.93% was reached at a pressure ratio of 15, corresponding to a maximum steam reinjection mass flow rate of 7.56 kg/s. At this point, the system electrical efficiency is higher than the maximum electrical efficiency corresponding to the steam reinjection mass flow rate of 7 kg/s in Figure 6B, but the optimal pressure ratio is less than its corresponding optimal pressure ratio.
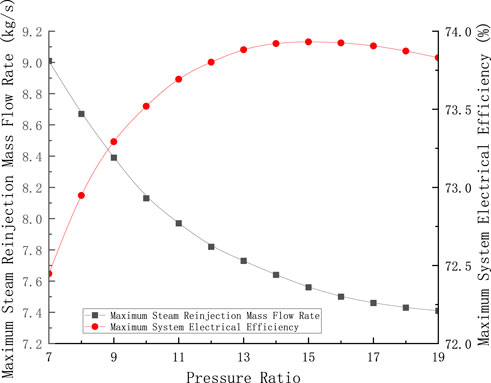
FIGURE 7. Effect of pressure ratio on maximum steam reinjection mass flow rate and system electrical efficiency.
In addition, it is easy to see from Figure 6B that when the pressure ratio is greater than 13, the system electrical efficiency does not improve significantly as the pressure ratio increases. This means that when the pressure ratio is greater than 13, there is not much benefit from continuing to increase the pressure ratio.
4.4 Effect of steam reinjection mass flow rate on different SOFC inlet temperatures
The inlet temperature of the SOFC has a significant effect on the electrical efficiency of the SOFC in a certain temperature range, as shown in Figure 2. It also has an impact on system electrical efficiency. When analyzing the influence of SOFC inlet temperature on the system, the pressure ratio is set at 10, and the TUR back pressure is set at 110 kPa. At the same time, the SOFC outlet temperature is controlled to 1,273.15 K through the SOFC cooling system.
The effect of the steam reinjection mass flow rate on system electrical efficiency at different SOFC inlet temperatures is given in Figure 8A. At a given SOFC inlet temperature, the system electrical efficiency increases with an increase in steam reinjection mass flow rate until the maximum steam reinjection mass flow rate is reached. At the same time, the maximum steam reinjection mass flow rate decreases as the inlet temperature of the SOFC increases.
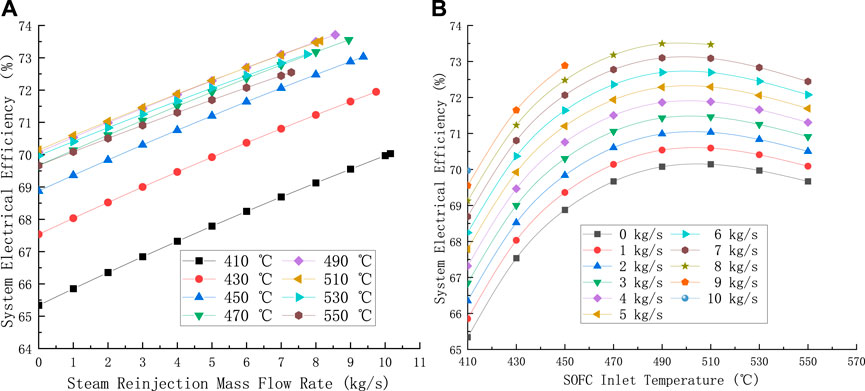
FIGURE 8. (A) Effect of steam reinjection mass flow rate on system electrical efficiency at different SOFC inlet temperatures; (B) effect of SOFC inlet temperature on system electrical efficiency at different steam reinjection mass flow rates.
The variation in system electrical efficiency with SOFC inlet temperature for different steam reinjection mass flow rates is given in Figure 8B. It can be seen that there is an optimal SOFC inlet temperature that maximizes the electrical efficiency of the system, and the optimal SOFC inlet temperature tends to decrease as the steam reinjection mass flow rate gradually increases. As the SOFC inlet temperature increases, the mass flow rate of steam reinjection is limited, so the maximum system electrical efficiency at this point depends on the maximum mass flow rate of steam reinjection. This is due to the fact that when the SOFC inlet temperature increases, on one hand, the power generation efficiency of the SOFC itself first increases and then decreases, and on the other hand, an increase in the SOFC inlet temperature leads to a decrease in the temperature of the spent gas entering the HRSG, resulting in a decrease in the temperature and mass flow rate of the injected steam, which leads to a decrease in the power generated by the GEN.
The effect of SOFC inlet temperature on the maximum steam reinjection mass flow rate and the maximum system electrical efficiency is given in Figure 9. It can be seen that the maximum steam reinjection mass flow rate decreases as the SOFC inlet temperature increases. In addition, the corresponding system electrical efficiency shows a trend of increasing and then decreasing, reaching a maximum of 73.71% at the SOFC inlet temperature of 763.15 K, corresponding to a steam reinjection mass flow rate of 8.56 kg/s. This indicates that for a given pressure ratio, there is a maximum mass flow rate of the return steam, resulting in a system generation efficiency that is affected by both the pressure ratio and the steam reinjection mass flow rate, and that the steam reinjection mass flow rate has an effect on the SOFC inlet temperature.
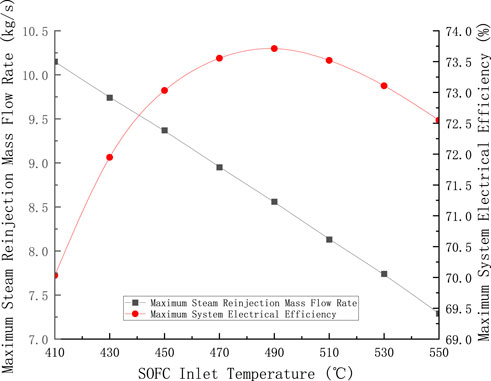
FIGURE 9. Maximum steam reinjection mass flow rate and maximum system electrical efficiency curves at different SOFC inlet temperatures.
According to Figure 8B, the maximum system electrical efficiency does not fluctuate much when the SOFC inlet temperature is varied between 743.15 K and 783.15 K. The optimal SOFC inlet temperature can be found within this range for a given parameter.
4.5 Effect of steam reinjection mass flow rate on different turbine back pressures
For SOFC–GT systems with steam reinjection, it is possible to take a lower value than atmospheric pressure for the turbine back pressure due to the fact that the steam generated from the waste heat is passed into the turbine, which increases the humidity of the gas mixture in the turbine. Therefore, it is necessary to study the effect of the variation of the turbine back pressure on the power generation efficiency of the system. Under certain conditions, decreasing the TUR back pressure will make the TUR work capacity increase but will reduce the TUR exhaust temperature resulting in a reduction of heat recovery. In addition, when the back pressure is lower than atmospheric pressure, additional fans are needed to draw the spent gas out of the system and provide resistance to overcome the flue gas side of the HRSG, which will eventually exhaust the flue gas to the atmosphere. At this time, the influence of fan power WF should be considered in the calculation of system electrical efficiency. In other words, the system electrical efficiency at this time can be obtained according to the following equation:
For the system studied in this paper, the system exhaust pressure is equal to the TUR back pressure minus the pressure losses in the PH and HRSG. No additional treatment is performed when the system exhaust pressure is higher than atmospheric pressure. When the system exhaust is below atmospheric pressure, the system exhaust is pumped out of the system using a fan, and the fan outlet pressure is set to 105 kPa. When studying the effect of TUR back pressure on system electrical efficiency, the pressure ratio is taken as 10 and the SOFC inlet temperature is taken as 783.15 K.
Figure 10A shows the trend of system electrical efficiency at different back pressures. From Figure 10A, the system electrical efficiency increases with an increase in steam reinjection mass flow rate until the maximum steam reinjection mass flow rate is reached. In addition, as the TUR back pressure increases, the maximum steam reinjection mass flow rate gradually increases.
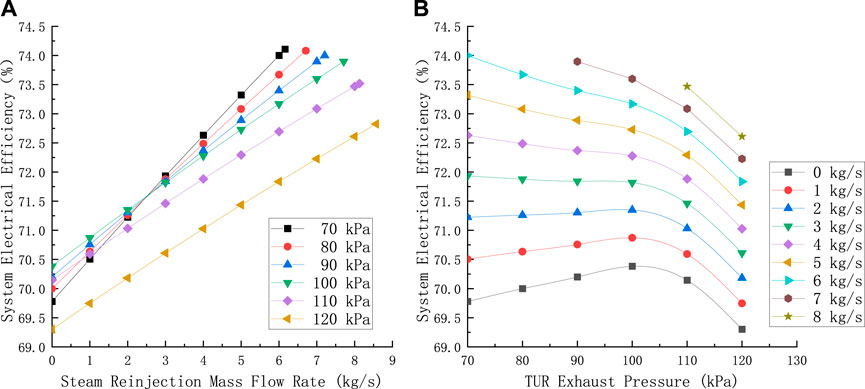
FIGURE 10. (A) Effect of steam reinjection mass flow rate on system electrical efficiency at different turbine back pressures; (B) effect of TUR back pressure on system electrical efficiency at different steam reinjection mass flow rates.
Figure 10B shows the relationship between TUR back pressure and system generation efficiency when the steam reinjection mass flow rate is from 0 kg/s to 8 kg/s. When the steam reinjection mass flow rate is small, that is, less than 3 kg/s under given conditions, there is an optimal exhaust pressure for each determined steam reinjection mass flow rate. However, when the steam reinjection mass flow rate is greater than 3 kg/s and each exhaust pressure reaches the maximum steam reinjection mass flow rate, the lower the TUR exhaust pressure, the higher the electrical efficiency of the system. Meanwhile, as shown in Figure 11, when the TUR back pressure decreases from 120 kPa to 70 kPa, the corresponding maximum steam reinjection mass flow rate under each TUR back pressure gradually decreases, while the maximum system electrical efficiency gradually increases, and the increase range gradually decreases. When the TUR back pressure is 70 kPa and the steam reinjection mass flow rate is 6.16 kg/s, the maximum electrical efficiency of the system is 74.11%.
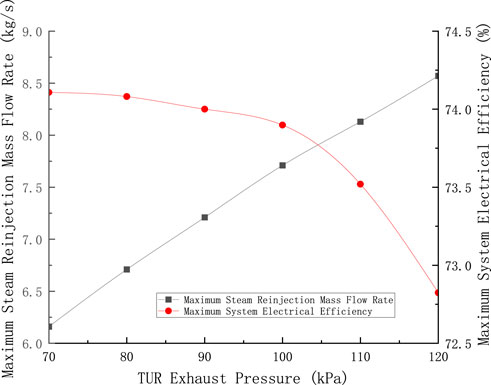
FIGURE 11. Maximum steam reinjection mass flow rate and maximum system electrical efficiency curves at different TUR back pressures.
When the system exhaust pressure is lower than the ambient pressure, additional fans are needed to pump out the system exhaust; furthermore, when the exhaust pressure decreases, the power consumption of the fans increases. Since the inlet pressure of the TUR remains constant, when the back pressure of the TUR is reduced, the expansion ratio of the system increases, causing the TUR to perform more work and making the GEN generate more power. The more the steam injected, the greater the influence of TUR work increase caused by the decrease in TUR back pressure. Therefore, when the steam reinjection mass flow rate exceeds 3 kg/s, the electrical efficiency of the system increases with the decrease in the back pressure of the TUR.
Furthermore, the lower the TUR exhaust pressure, the higher the electrical efficiency of the system. However, if the exhaust pressure is lower than 1 atm, the equipment will be in vacuum, which increases the cost and manufacturing difficulty of the equipment. Therefore, the choice of system exhaust pressure is generally greater than the atmospheric pressure.
5 Conclusion
(1) Due to the steam reinjection system, the mass flow rate of the working medium in the turbine increases, and the exhaust temperature of the system decreases significantly. Therefore, the electrical efficiency of the SOFC–GT system with steam reinjection is higher than that of the SOFC–GT system without steam reinjection, and the higher the mass flow rate of steam reinjection, the higher the electrical efficiency of the system. However, because the steam pressure is limited by the compressor pressure ratio, there is a maximum steam reinjection mass flow rate.
(2) When the SOFC inlet temperature and turbine back pressure are given, there is an optimal pressure ratio to maximize the electrical efficiency of the system. The optimal pressure ratio increases with the increase in the steam reinjection mass flow rate. For a given SOFC inlet temperature and turbine back pressure, the maximum system electrical efficiency can reach 73.93% considering the effect of steam reinjection mass flow rate and pressure ratio on the system electrical efficiency. At this time, the pressure ratio is 15, and the steam reinjection mass flow rate is 7.56 kg/s.
(3) Through the study of the steam reinjection mass flow rate and SOFC inlet temperature, it is found that there is an SOFC inlet temperature which can make the system achieve the maximum electrical efficiency. When the steam reinjection mass flow rate increases, the optimal SOFC inlet temperature tends to decrease, but the influence degree is small. When the pressure ratio is 10 and the turbine back pressure is 110 kPa, considering the influence of steam reinjection mass flow rate on the SOFC inlet temperature, the steam reinjection mass flow rate is 8.56 kg/s, and the electrical efficiency of the system is 73.71%. At this point, the SOFC inlet temperature is 763.15 K.
(4) The influence of turbine exhaust pressure on the electrical efficiency is more complex. The optimal turbine back pressure exists when the steam reinjection mass flow rate is small; however, when the steam reinjection mass flow rate is greater than or equal to 3 kg/s, the lower the turbine exhaust pressure, the higher the system electrical efficiency. At the pressure ratio of 10 and SOFC inlet temperature of 783.15 K, the maximum steam reinjection mass flow rate is 6.16 kg/s, and the electrical efficiency of the system reaches 74.11%.
Data availability statement
The original contributions presented in the study are included in the article/Supplementary Material; further inquiries can be directed to the corresponding author.
Author contributions
HZ: writing–original draft and writing–review and editing. PZ: writing–review and editing. QZ: writing–review and editing. XZ: writing–review and editing. ZL: writing–review and editing. ZF: writing–review and editing. TL: writing–review and editing. RS: writing–review and editing. JC: writing–review and editing.
Funding
The author(s) declare financial support was received for the research, authorship, and/or publication of this article. This research was supported by the Department of Science and Technology of Gansu Province under the contract No. 22ZD11GA314.
Acknowledgments
The authors gratefully acknowledge the financial support of the Department of Science and Technology of Gansu Province (No. 22ZD11GA314). Thanks are also given to the editors and reviewers for their comments and contributions to this work.
Conflict of interest
Author ZL was employed by Gansu Diantong Power Engineering Design Consulting Co., Ltd.
The remaining authors declare that the research was conducted in the absence of any commercial or financial relationships that could be construed as a potential conflict of interest.
Publisher’s note
All claims expressed in this article are solely those of the authors and do not necessarily represent those of their affiliated organizations, or those of the publisher, the editors, and the reviewers. Any product that may be evaluated in this article, or claim that may be made by its manufacturer, is not guaranteed or endorsed by the publisher.
References
Ahmadi, R., Pourfatemi, S. M., and Ghaffari, S. (2017). Exergoeconomic optimization of hybrid system of GT, SOFC and MED implementing genetic algorithm. Desalination 411, 76–88. doi:10.1016/j.desal.2017.02.013
Biert, L. V., Woudstra, T., Godjevac, M., Visser, K., and Aravind, P. (2018). A thermodynamic comparison of solid oxide fuel cell-combined cycles. J. Power Sources 397 (1), 382–396. doi:10.1016/j.jpowsour.2018.07.035
Chen, L. X., Hu, P., Sheng, C. C., Zhang, N., Xie, M. N., and Wang, F. X. (2019). Thermodynamic analysis of three ejector based organic flash cycles for low grade waste heat recovery. Energy Convers. Manag. 185, 384–395. doi:10.1016/j.enconman.2019.02.016
Chen, Q. M., Weng, Y. W., Weng, S. L., and Zhu, X. J. (2006). Performance analysis of a hybrid system based on a fuel cell and a gas turbine. Proc. CSEE 26 (4). doi:10.1016/j.apenergy.2022.120280
Cheng, T., Jiang, J., Wu, X., Li, X., Xu, M., Deng, Z., et al. (2019). Application oriented multiple-objective optimization, analysis and comparison of solid oxide fuel cell systems with different configurations. Appl. Energy 235, 914–929. doi:10.1016/j.apenergy.2018.11.038
Chitgar, N., Emadi, M. A., Chitsaz, A., and Rosen, M. A. (2019). Investigation of a novel multigeneration system driven by a SOFC for electricity and fresh water production. Energy Convers. Manag. 196, 296–310. doi:10.1016/j.enconman.2019.06.006
Ding, A., Sun, H. Z., Zhang, S. Y., Dai, X., Pan, Y., Zhang, X., et al. (2023). Thermodynamic analysis and parameter optimization of a hybrid system based on SOFC and graphene-collector thermionic energy converter. Energy Convers. Manag. 291, 117327. doi:10.1016/j.enconman.2023.117327
Gandiglio, M., Lanzini, A., Leone, P., Santarelli, M., and Borchiellini, R. (2013). Thermoeconomic analysis of large solid oxide fuel cell plants: atmospheric vs. pressurized performance. Energy 55 (15), 142–155. doi:10.1016/j.energy.2013.03.059
Guo, Y., Guo, X., Wang, J., Guan, Z., Wang, Z., Zhang, Y., et al. (2023). Performance analysis and multi-objective optimization for a hybrid system based on solid oxide fuel cell and supercritical CO2 Brayton cycle with energetic and ecological objective approaches. Appl. Therm. Eng. Des. Process. Equip. Econ. 221, 119871. doi:10.1016/j.applthermaleng.2022.119871
Hanbing, W., Zeting, Y., Daohan, W., Guoxiang, L., Guoping, X., et al. (2021). Energy, exergetic and economic analysis and multi-objective optimization of atmospheric and pressurized SOFC based trigeneration systems. Energy Convers. Manag. 239, 2023–0629. doi:10.1016/j.enconman.2021.114183
Huang, J. H. (2004). Numerical simulation of heat and mass transfer in solid oxide fuel cell. Nanjing: Nanjing University of Science & Technology. doi:10.7666/d.y624966
Kang, J., Wei, Y. M., Liu, L. C., Han, R., Yu, B. Y., and Wang, J. W. (2020). Energy systems for climate change mitigation: a systematic review. Appl. Energy 263, 114602. doi:10.1016/j.apenergy.2020.114602
Karimi, M. H., Chitgar, N., Emadi, M. A., Ahmadi, P., and Rosen, M. A. (2020). Performance assessment and optimization of a biomassbased solid oxide fuel cell and micro gas turbine system integrated with an organic Rankine cycle. Int. J. Hydrogen Energy 45, 6262–6277. doi:10.1016/j.ijhydene.2019.12.143
Kuchonthara, P., Bhattacharya, S., and Tsutsumi, A. (2003). Energy recuperation in solid oxide fuel cell (SOFC) and gas turbine (GT) combined system. J. Power Sources 117 (1/2), 7–13. doi:10.1016/S0378-7753(03)00009-0
Kumar, P., and Singh, O. (2019). Thermoeconomic analysis of SOFC-GT-VARS-ORC combined power and cooling system. Int. J. Hydrogen Energy 44 (50), 27575–27586. doi:10.1016/j.ijhydene.2019.08.198
Lelieveld, J., Klingmüller, K., Pozzer, A., Burnett, R. T., Haines, A., and Ramanathan, V. (2019). Effects of fossil fuel and total anthropogenic emission removal on public health and climate. Proc. Natl. Acad. Sci. 116, 7192–7197. doi:10.1073/pnas.1819989116
Liu, J., Sun, H., Chen, H., Li, W., Pan, P., Wu, L., et al. (2023). Thermo-economic analysis of a polygeneration system using biogas and waste tire based on the integration of solid oxide fuel cell, gas turbine, pyrolysis, and organic rankine cycle. Appl. Therm. Eng. 230, 120825. doi:10.1016/j.applthermaleng.2023.120825
Liu, W., Sun, L., Li, Z., Fujii, M., Geng, Y., Dong, L., et al. (2020). Trends and future challenges in hydrogen production and storage research. Environ. Sci. Pollut. Res. 27 (25), 31092–31104. doi:10.1007/s11356-020-09470-0
Mojaver, P., Abbasalizadeh, M., Khalilarya, S., Chitsaz, A., et al. (2020). Co-generation of electricity and heating using a SOFC-ScCO_2 Brayton cycle-ORC integrated plant: investigation and multi-objective optimization. Int. J. hydrogen energy (51), 45. doi:10.1016/j.ijhydene.2020.07.137
Morrison, P. (2004). The discovery of global warming. Phys. Today 57 (6), 60–61. doi:10.1063/1.1784277
Motahar, S., and Alemrajabi, A. A. (2009). Exergy based performance analysis of a solid oxide fuel cell and steam injected gas turbine hybrid power system. Int. J. Hydrogen Energy 34 (5), 2396–2407. doi:10.1016/j.ijhydene.2008.12.065
Ngoh, S. K., and Njomo, D. (2012). An overview of hydrogen gas production from solar energy. Renew. Sustain. Energy Rev. 16 (9), 6782–6792. doi:10.1016/j.rser.2012.07.027
Onda, K., Iwanari, T., Miyauchi, N., Ito, K., Ohba, T., Sakaki, Y., et al. (2003). Cycle analysis of combined power generation by planar SOFC and gas turbine considering cell temperature and current density distributions. J. Electrochem. Soc. 150 (12), A1569–A1576. doi:10.1149/1.1619986
Penyarat, C., and Pascal, B. (2012). The hybrid solid oxide fuel cell (SOFC) and gas turbine (GT) systems steady state modeling. Int. J. Hydrogen Energy 37 (11), 9237–9248. doi:10.1016/j.ijhydene.2012.03.005
Sanaye, S., and Asgari, S. (2013). Four E analysis and multi-objective optimization of combined cycle power plants integrated with Multi-stage Flash (MSF) desalination unit. DESALINATION 320 (1), 105–117. doi:10.1016/j.desal.2013.04.023
Shamoushaki, M., Ehyaei, M. A., and Ghanatir, F. (2017). Exergy, economic and environmental analysis and multi-objective optimization of a SOFC-GT power plant. Energy 134 (1), 515–531. doi:10.1016/j.energy.2017.06.058
Singh, O., and Singh, R. (2021). Thermodynamic evaluation of SOFC-GT hybrid power and cooling system. Energy Sources Part A Recovery, Util. Environ. Eff. 43 (16), 1975–1989. doi:10.1080/15567036.2019.1663307
Suther, T., Fung, A. S., Koksal, M., and Zabihian, F. (2011). Effects of operating and design parameters on the performance of a solid oxide fuel cell–gas turbine system. Int. J. Energy Res. 35 (7), 616–632. doi:10.1002/er.1722
Wu, C., Xu, X., Li, Q., Li, X., Liu, L., Liu, C., et al. (2021). Performance assessment and optimization of a novel geothermal combined cooling and power system integrating an organic flash cycle with an ammonia-water absorption refrigeration cycle. Energy Convers. Manag., 227. doi:10.1016/j.enconman.2020.113562
Wu, Z., Tan, P., Zhu, P., Cai, W., Chen, B., Yang, F., et al. (2019). Performance analysis of a novel SOFC-HCCI engine hybrid system coupled with metal hydride reactor for H 2 addition by waste heat recovery. Energy Convers. Manag. 191, 119–131. doi:10.1016/j.enconman.2019.04.016
Xia, M., Yao, A., and Chao Ying, C. (2023). Analysis and multi-objective optimization of SOFC/GT/SCO2 hybrid power system based on thermodynamics and economics. Appl. Therm. Eng. 232, 121033. doi:10.1016/j.applthermaleng.2023.121033
Yi, B. L. (2000). Fuel cell - efficient and environmentally friendly way to generate electricity. Beijing: Chemical Industry Publisher.
Yu, W.Xu, YuWang, H.Ge, ZhongWang, J. Z., DaofeiXia, Y., Zhu, D., et al. (2020). Thermodynamic and thermoeconomic performance analyses and optimization of a novel power and cooling cogeneration system fueled by low-grade waste heat. Appl. Therm. Eng. Des. Process. Equip. Econ. 179 (1), 115667. doi:10.1016/j.applthermaleng.2020.115667
Zhang, K. (2022). A simulation research of integrated energy system based on solid oxide fuel cell. Guangxi: Guangxi University. doi:10.27034/d.cnki.ggxiu.2022.000889
Zhong, L., Yao, E., Hu, Y., Zhao, C., Zou, H., and Xi, G. (2022). Thermo-economic analysis of a novel system integrating compressed air and thermochemical energy storage with solid oxide fuel cell-gas turbine. Energy Convers. Manag. 252, 115114. doi:10.1016/j.enconman.2021.115114
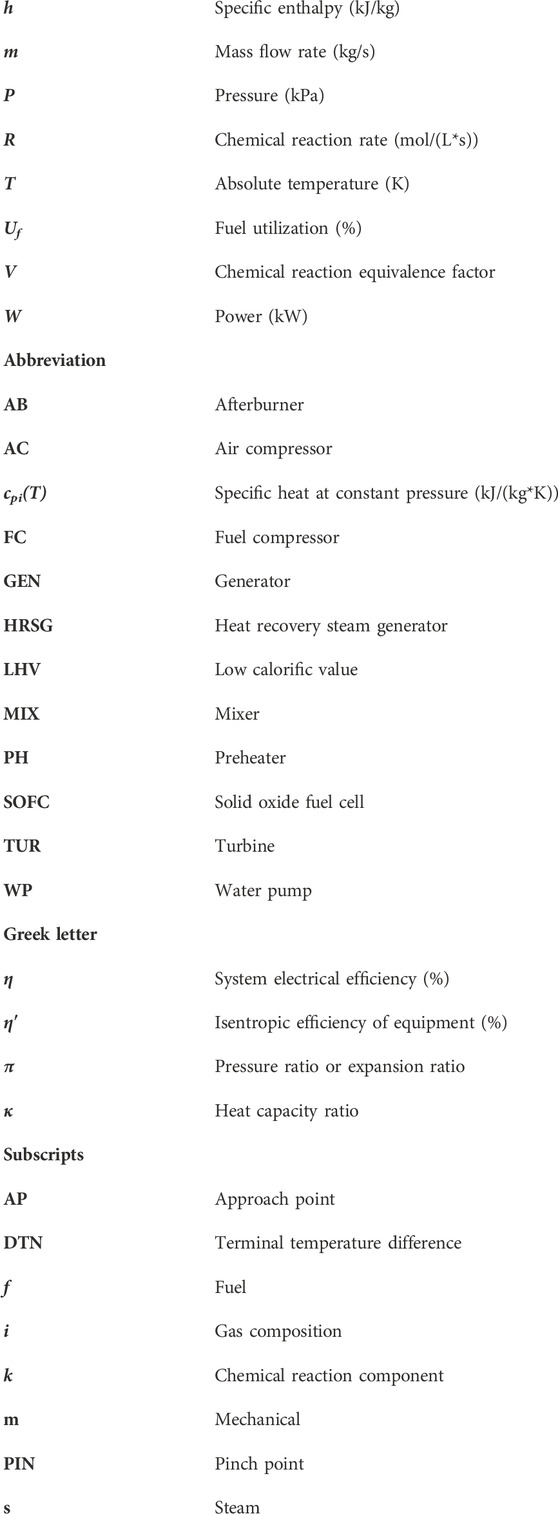
Nomenclature
Keywords: solid oxide fuel cells, gas turbine, hydrogen energy, steam reinjection, waste heat recovery
Citation: Zhao H, Zheng P, Zhu Q, Zhang X, Lan Z, Fu Z, Luo T, Shen R and Cheng J (2024) Effect of steam reinjection mass flow rate on the SOFC–GT system with steam reinjection. Front. Energy Res. 12:1336807. doi: 10.3389/fenrg.2024.1336807
Received: 11 November 2023; Accepted: 08 January 2024;
Published: 24 January 2024.
Edited by:
Houcheng Zhang, Ningbo University of Technology, ChinaReviewed by:
Tianjun Liao, Chongqing University of Technology, ChinaZhimin Yang, Yan’an University, China
Xin Zhang, Jiangnan University, China
Copyright © 2024 Zhao, Zheng, Zhu, Zhang, Lan, Fu, Luo, Shen and Cheng. This is an open-access article distributed under the terms of the Creative Commons Attribution License (CC BY). The use, distribution or reproduction in other forums is permitted, provided the original author(s) and the copyright owner(s) are credited and that the original publication in this journal is cited, in accordance with accepted academic practice. No use, distribution or reproduction is permitted which does not comply with these terms.
*Correspondence: Puyan Zheng, tyy33@163.com