Numerical simulation of gas diffusion and explosion limit of VOCs in containment integrated leak rate test
 W. Q. Weng1
  D. C. Sun
- 1China Nuclear Power Technology Research Institute Co., Ltd., Shenzhen, China
- 2School of Energy and Power Engineering, Shandong University, Jinan, China
CILRT is an important work in the overhaul of nuclear power plants. VOCs from paints and cleaners used in the containment during the overhaul will migrate inside the containment, and the numerous rooms and compartments inside the containment make the air flow impeded, and the VOCs may be enriched to bring combustion risk. The complete fire risk analysis method includes volatilization kinetics of chemicals, mixture explosion limits, and numerical simulation of VOCs diffusion and migration. The volatilization rate at the lowest room temperature of 20°C is used as a conservative input, the complement of CAITA realistic model is used as the flow domain, and the geometry is appropriately simplified, and the steady ventilation process, the internal flow and the laws of diffusion and agglomeration of 12 kinds of VOCs gases in the 9-h pressure-holding process are investigated by Computational Fluid Dynamics. The simulation results of steady ventilation show that the VOCs gases are almost uniformly carried by the air to all spaces inside the containment, and the explosion risk is low. The concentration field of the steady ventilation process was taken as the initial boundary condition and unsteady state simulation of the 9-h holding pressure process was performed. The results show that the gas flow inside the containment basically stops after 3456 s of pressure holding. With the extension of time, the VOCs gases accumulate at the bottoms of the three lower layers of the containment under the effect of laminar diffusion and gravitational settling, where the total concentration of the mixed gases reaches the highest at the bottom of the lowest layer. The total concentration of the VOCs gas mixture was below the lower explosion limit throughout the 9-h pressure-holding process, and the explosion risk was low.
1 Introduction
The containment of a nuclear power plant is the last barrier to prevent the leakage of radioactive media and an important facility to ensure the safety of nuclear power (Qi et al., 2023). To ensure the safety and reliability of the containment, the containment integrity and leakage rate test (CILRT) is required every 10 years since the first overhaul of the nuclear power plant (Gong and Zhou, 2005). The complete CILRT consists of a series of pressure-holding, pressure-raising and pressure-reducing procedures alternating with each other, with a total duration of about 128 h with the maximum pressure level of 520 kPa, and the entire process is shown in Figure 1 (Weng et al., 2019). Normally, related maintenance work should be performed before the CILRT, and chemicals containing volatile organic compounds (VOCs) are used in large quantities in this process, including paints, cleaning agents, lubricants, etc., and its volatile flammable gases. The flammable gases emitted by the containment vessel pose a risk of ignition during the CILRT, which is a direct threat to the safety of the plant and therefore needs to be evaluated.
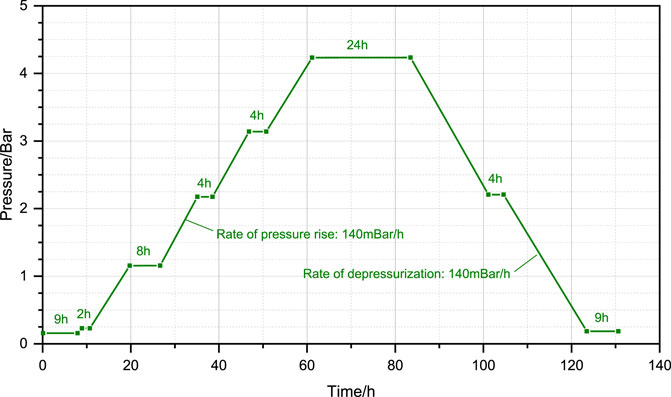
Figure 1. Containment CILRT process.
From the beginning of the CILRT until the pressure relief, the containment is kept in a closed state, and the surface of the equipment coated with chemicals will also continue to volatilize VOCs gases, which migrate, diffuse and accumulate in the local space inside the containment, and there is the possibility of an explosion when the concentration exceeds its explosion limit, which poses a great risk to the safety of the nuclear power plant in service (Zhao et al., 2017). The gas diffusion and explosion limit of VOCs has been investigated by many researchers. Koshiba et al. (2017) investigated the flammability limits and explosion pressures of alkane-alkane-nitrous-oxide mixtures and corresponding alkane-alkane-O2 mixtures. The Coward diagram was modified to improve its accuracy by Cheng and Luo, (2013) and the modified Coward method could be applied in practices by a cross-verification study. Flammability limits of binary mixtures of ammonia with HFO-1234yf, HFO-1234ze, HFC-134a, and HFC-125 were measured in dry air by Kondo et al. (2013). Modification of Le Chatelier’s equation was made by introducing Ellipse function to express the flammability limits of the mixtures. Flammability limits of binary vapor mixtures of 1,2-ethanediol + steam and 1,2-propanediol + steam were measured by the ASHRAE method (Zhang et al., 2013). Artificial neural networks were used to probe the structural groups that have significant contribution to the lower flammability limit (LFL) of pure compounds and arrive at the set of groups that can best represent LFL for about 543 substances. (Albahri, 2013). A new flammability index called F-number was utilized in a novel method of predicting flammability limits. An empirical expression of F-number has been derived to account for the flammability characteristics of various organic substances (Kondo et al., 2001). The lower flammability limits of 18 CxHyOzNw liquids were measured as a function of initial temperature by Rowley et al. (2010). A comprehensive literature review of the flammability limits of combustible mixtures is developed and the description of methodology for experiments to find the upper and lower limits of flammability of ethanol for aeronautical applications is discussed. (Coronado et al., 2012). Konovalov et al. (2015) took gas-particle partitioning and oxidation of semi-volatile organic compounds (SVOCs) into account in simulations of the mesoscale evolution of smoke plumes from intense wildfires. Thermochemical properties of target VOCs molecules were calculated using density functional theory. Higher level composite methods and the correlation consistent composite approach were considered to determine the enthalpies (Osmont et al., 2015). Experiments were performed in order to measure evaporation rates of four different VOCs and water. The evaporation correlation was obtained by fitting the experimental data. (Heymes et al., 2013). Zhang et al. (2018) proposed an improved C-history method based on the completely analytical solution of the mass transfer model describing the VOC emission process. Zuo et al. (2023a) proposed the tube outlet for the hydrogen-fueled micro planar combustor to enhance the heat transfer between the burned gas and combustor wall. Numerical investigations on the performance of micro-cylindrical combustors are conducted under different cavity length, outlet size and solid wall materials (Zuo et al., 2023b). A 3D multi-phase model of PEMFC is established and effects of cathode channel structure on the performance of PEMFC are numerically investigated (Chen et al., 2024).
In this paper, FluentV18.0 (ANSYS Inc, 2011) analysis software is used to simulate the stable ventilation process of the containment and the first 9-h pressure holding process of the CILRT, aiming to analyze the diffusion law and explosion risk of 12 kinds of VOCs gases inside the containment, and to provide technical support for the safety analysis of the CILRT process.
2 Computational models
2.1 Governing equation system
The VOCs gases volatilize from the wall liquid phase chemical varieties and diffuse into the containment carried by air. Neglecting the chemical reactions between the components and the wall phase change process, the stabilized venting process is a steady state turbulent diffusion process, and the 9 h pressure holding is an unsteady state turbulent diffusion process, which needs to follow the mass and momentum conservation equations listed in Eqs 1, 2, respectively.
However, the above equations are not closed, and in order to make the equations solvable, two covariates, turbulent kinetic energy k and dissipation energy ε, are introduced to form a system of k-ε equations as shown in Eqs 3, 4.
The component mass conservation equations is given as Eq. 5.
where
2.2 Explosive limit calculations
When the gas components of VOCs accumulate locally, if the concentration of a single component exceeds its lower explosive limit or the concentration of multiple components exceeds the lower explosive limit of the mixture, there is a possibility of explosion. Let the molar fraction of component i (molar concentration) is xi, and Li is the component’s lower explosive limit of pure mass, then the lower explosive limit of the mixture Lm is defined as Eq. 6.
Where,
Define an explosion state parameter as
3 CILRT process simulation
3.1 Process simulation assumptions
The CILRT process starts with a ventilation process and then begins with a 9-h pressure holding process, and followed by gradual pressurization, pressure holding and pressure relief. There are 49 air inlets and 6 air outlets at different heights inside the containment, and the velocity of these inlets is 0.3–2.0 m/s and the velocity of the air outlets is 2.0–7.7 m/s according to the flow rate of the fan, and the two outlets with the largest flow rates are located at the top of the containment (flow rate of 1E6m3/d) and the middle of the containment (flow rate of 1.6E6m3/d) respectively. After a long period of ventilation, both the flow and concentration fields in the containment gradually reach the equilibrium state. At the beginning of the holding pressure process, all air openings were closed, and the VOCs gas continued to volatilize. Due to the difference in density, the heavy fractions are gradually deposited towards the bottom, while the light components gradually accumulate towards the top, increasing the risk of explosion in the containment. According to the results of volatilization experiments, most of the VOCs gas will be volatilized in 3–6 h. During the subsequent pressurization and pressure holding process, the total amount of air increases, while the mass of VOCs does not increase significantly, so the risk of explosion is gradually reduced overall. Therefore, the 9 h pressure preservation process is the most dangerous stage in the CILRT process and needs to be analyzed.
Fully simulating the actual volatilization and diffusion process is very difficult and requires a lot of computational resources. The calculation should follow the principle of conservative to carry out appropriate simplification, i.e., the simplified structure, initial conditions and physical parameters are more conservative than the actual situation, so that the calculated concentration is higher than the actual situation. The actual process can be regarded as safe if the highest calculated concentration cannot even reach the lower limit of explosion. Simplifications and assumptions made in this paper are listed as follows:
a) During the steady venting phase and the subsequent 9 h holding pressure phase, multiple VOCs gases are volatilized on the same volatilization surface. Each VOCs gas is volatilized at maximum volatility.
b) The steady venting process is a steady-state flow process, and the concentration field formed during this process serves as the initial concentration field for the simulation of the 9 h holding pressure process.
c) For a certain VOCs gas, the volatilization of this VOCs gas stops when m0+m1 = mtotal. Where m0 is the total mass of that gas in the initial field, m1 with is the mass of that gas volatilized in the 9 h pressure-holding phase, and mtotal is the total mass of that gas that can be volatilized.
d) The temperature at any point in the containment remains constant during the stabilized ventilation process and the 9 h pressure-holding process.
e) The total amount of volatilized VOCs during the 9 h pressure-holding phase is negligible relative to the total mass of air inside the containment, and the medium is treated as an incompressible gas during the simulation.
3.2 Geometric and mesh models
The containment vessel is a cylinder with a diameter of 37 m and a height of nearly 56.68 m with numerous equipment and support structures inside. The geometrical model of the containment needs to be built from the drawings and the flow domain needs to be delineated. Appropriate simplifications of the real structure are needed in the establishment, including:
a) Removal of fine-sized (feature length <0.2 m) structures with little flow disturbance, including overhead pipes and corridors, steps on the floor, electrical cabinets on the walls, etc.
b) Determine the size of the volatile surface according to the area to be painted with chemicals and arrange the volatile surface on the wall according to the principle of proximity.
c) Each volatilization surface can volatilize multiple VOCs gases at the same time, and the area where each gas can be volatilized is determined according to the actual painted area, but does not exceed the area of the volatilization surface.
The geometry of the simulation is shown as Figure 2A. After establishing the geometric model, it is necessary to perform mesh dissection of the flow domain. Due to the complexity of the internal spatial structure, an unstructured mesh was first used for the dissection, and then the unstructured mesh (tetrahedral, prismatic mesh) was transformed into a polyhedral mesh using Polyhedra technology, which significantly reduces the number of meshes and ensures the computational accuracy. The coarse, medium and fine scales were established, and after the verification of mesh-independence, the 8.23 million-mesh model was selected, as shown in Figure 2B. 115 volatile surfaces were set, as shown in Figure 3.
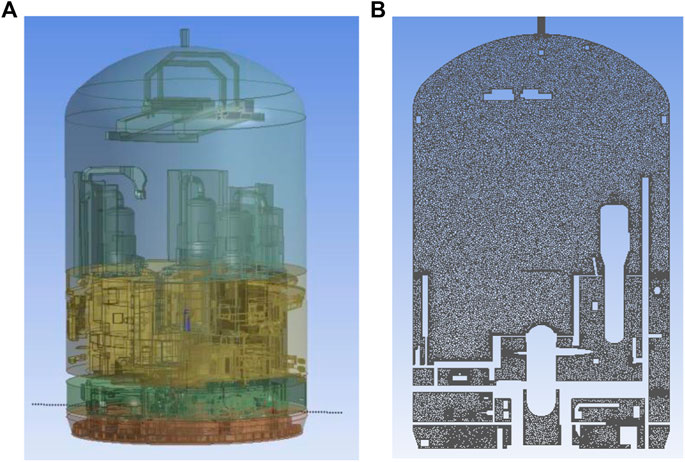
Figure 2. Geometric model (A) and messing model (B) of the simulation.
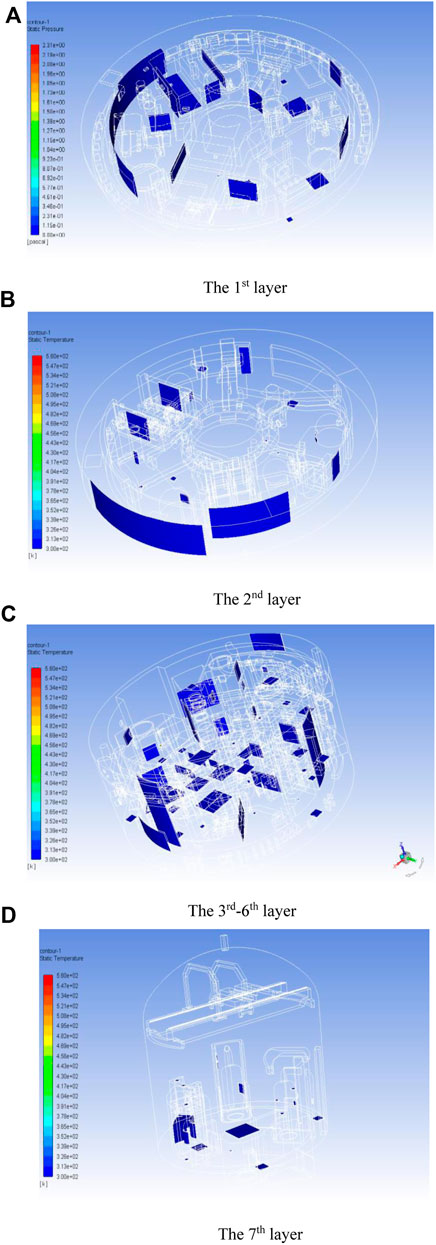
Figure 3. Volatile surface setting. (A) The 1st layer; (B) The 2nd layer; (C) The 3rd–6th layer; (D) The 7th layer.
3.3 Simulation settings
In this paper, the temperature inside the containment is assumed to be room temperature (20°C), and the saturated vapor pressure of 12 media at room temperature is calculated by NIST RefProV10.0 software (NIST, 2021), and the mass percentage of each medium on the volatilization surface is obtained by converting it to the wall boundary conditions of Fluent software, as shown in Table 1. Among them, C11-C13 medium is difficult to volatilize, and the vapor pressure can be calculated according to the highest possible temperature (40°C) inside the containment. Multiple User Defined Function (UDF) programs were developed to set the actual volatile area of each VOCs gas on each volatile surface to calculate the explosion risk of each grid cell.
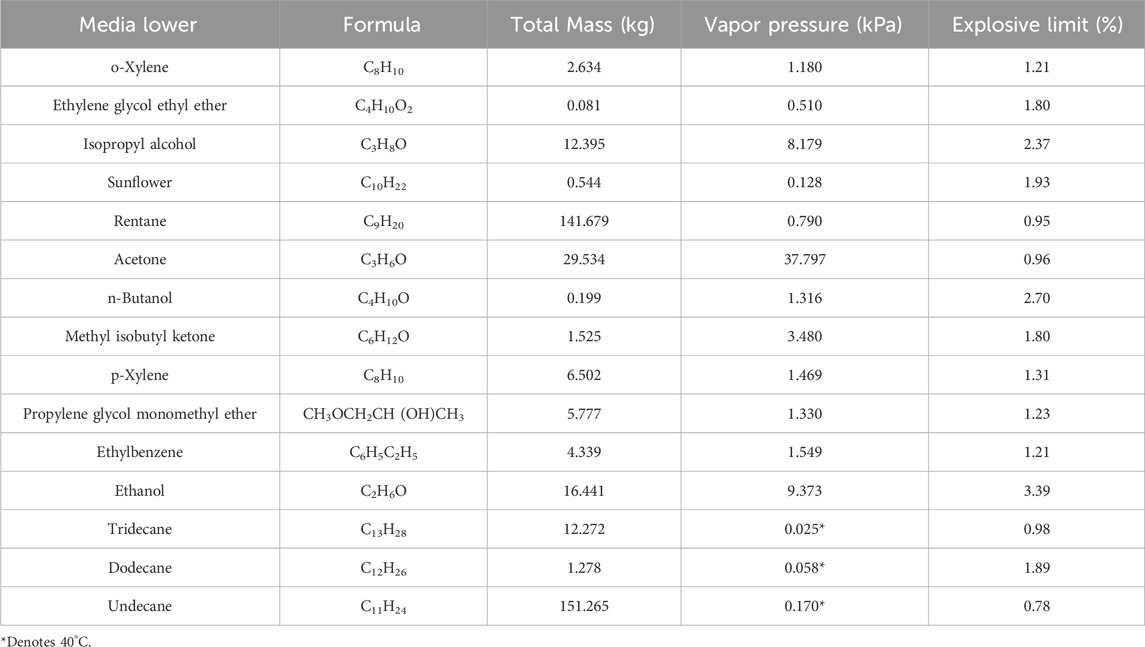
Table 1. Main parameters of 12 VOCs gases.
The steady state solver is used to simulate the steady ventilation process, and the velocity of each air outlet is calculated according to the flow rate of the fan. When the calculation converges, the unsteady state solver is used, and the time step starts from 10−4s, and then gradually increases, ensuring that the calculation process converges. The mass of each VOCs gas in the containment is detected at fixed intervals (1000 s), and the volatilization of the gas stops when it exceeds the total mass that can be volatilized.
Four polyhedral mesh numbers, 6.92 million, 7.45 million, 8.23 million and 8.94 million, have been selected in the mesh independence study and model verification. The velocity with different number of meshes at the 6th level of the ring corridor is shown in Figure 4. It can be seen that the velocity tends to level off as the number of meshes increases, and the change is less than 0.9% when the number of meshes reaches 8.23 million. As the calculation results indicate, the computational error of inlet pressure is 0.7% when the mesh number is 6.92 million taking the result of 8.23 million meshes as the benchmark, and the computational error of outlet velocity is 0.3%. When the mesh number is reached 8.94 million, the computational error of the inlet pressure is 0.3% and the computational error of the outlet velocity is 0.1%. This indicates that the effect of mesh numbers beyond 8.23 million on the calculations is decreasing significantly. Considering the computational resources and accuracy, the 8.23 million meshes is selected for the simulation and analysis.
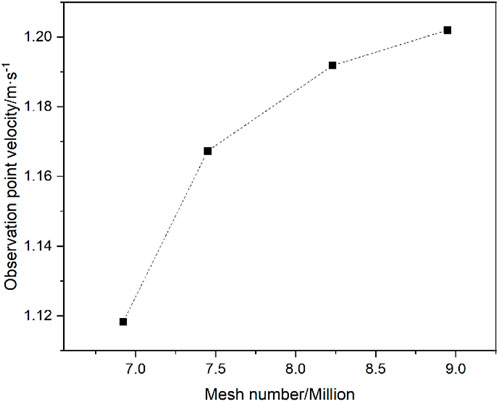
Figure 4. Observation point velocity versus number of meshes.
4 Analysis of calculation results
During ILRT, there are two sources of VOCs in the gas-phase space inside the containment. Firstly, at the beginning of ILRT, the VOC gas is already dispersed in the gas-phase space inside the containment, and can be treated as the “initial condition” of numerical calculation. Secondly, during the execution of ILRT, the VOC gas is continuously released into the gas-phase space inside the containment from the VOC gas source term. The study is mainly contains the Determination of “initial conditions” and the determination of VOC gas diffusion from the containment during ILRT implementation.
4.1 Stable ventilation process
Figure 5 shows the velocity cloud of the x = 0 section in the containment for the stabilized ventilation process, and it can be seen that most of the airflow goes out towards the two main outlets, the top and the middle. Among them, the gas flow toward the top outlet mainly flows upward along the edge of the shell, and the gas flow toward the middle outlet is pumped out directly from the middle of the space with less disturbance to the periphery, which is mainly due to the fact that there are fewer facilities in the middle space, and there is no obstacle to the gas flow. Except for the vicinity of the exit, the mainstream gas velocity is about 0.2–0.3 m/s, and the gas in rest of the space almost remains stationary.
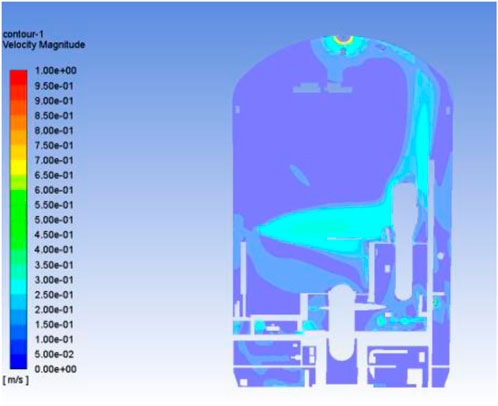
Figure 5. Stabilized ventilation x = 0 cross-section velocity.
Each mesh cell in the space is traversed to calculate the lower explosive limit of the gas mixture. Figure 6 shows the distribution of the explosion state parameter, it can be seen that the whole space
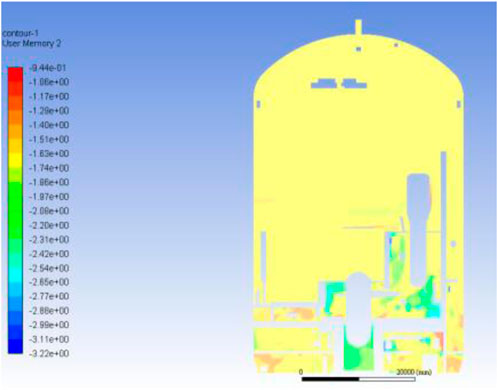
Figure 6. Stabilized ventilation x = 0 cross-section
4.2 9H pressure holding process
A non-stationary solver was used to calculate the diffusion process of VOCs gas in the 9 h holding pressure, where the initial field of VOCs gas is the concentration field after stabilizing the ventilation. As the vent is closed, the gas flow inside the containment gradually stops flowing, and the VOCs medium gradually diffuses from the wall to the adjacent area, making the explosion risk rise. Figure 7 shows the velocity cloud of the gas inside the containment at different holding pressure moments, and it can be seen that the gas flow inside the containment basically stops flowing after holding pressure for 3456 s.
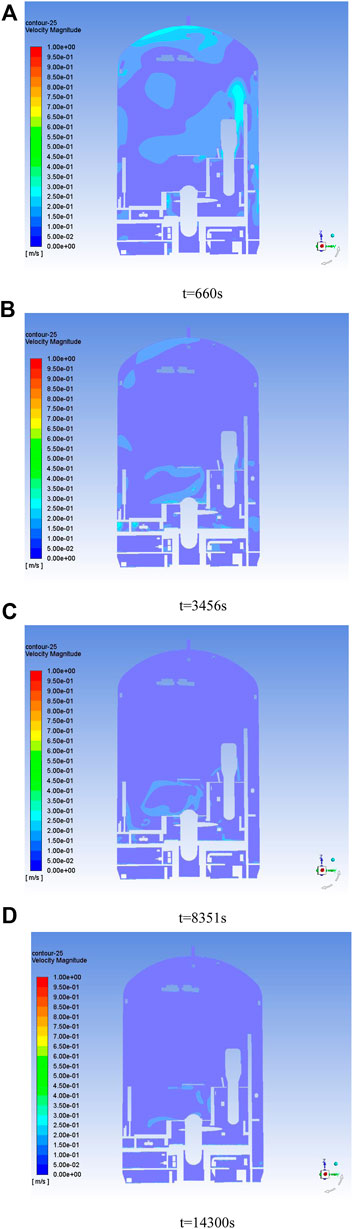
Figure 7. Velocity clouds of the containment at different times. (A) t = 660 s; (B) t = 3,456 s; (C) t = 8,351 s; (D) t = 14,300 s.
Figure 8 shows the concentration cloud of C8H10 at different moments of the pressure holding stage, and the chemicals containing this gas are mainly distributed in the middle of the containment. It can be seen that after 660 s of pressure holding, C8H10 began to accumulate near the near-wall surface, which was mainly due to the weak convective diffusion of the airflow, and the VOCs gas mainly migrated to the periphery through laminar diffusion. After 3456s of holding pressure, the gas gradually diffused to the whole horizontal layer (layer 3–6). After 8251 s of holding pressure, the gas has diffused to the top and bottom space. The concentration is slightly higher at locations in the central region since the gas is denser than air. Due to the complex connecting structure in the containment, the gas mainly diffused to the bottom through the vertical channel on the right side, and the gas gradually diffused to the bottom after holding pressure for 8251 s.
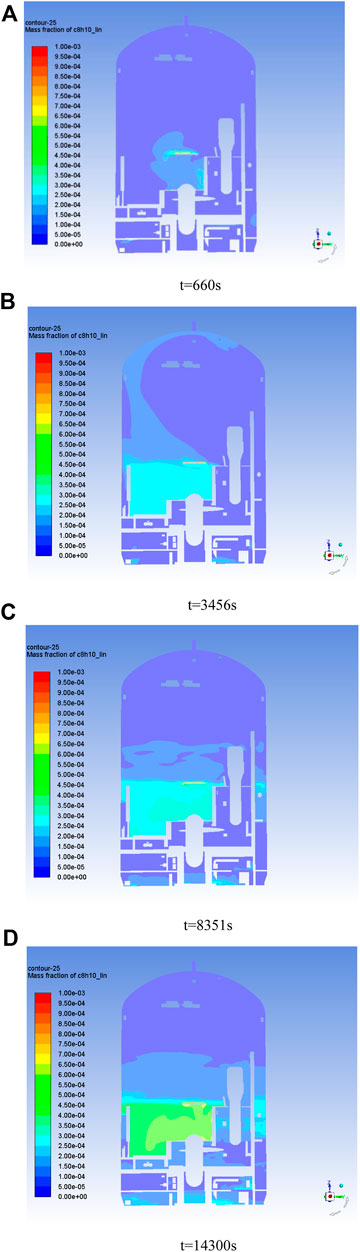
Figure 8. C8H10 concentration in the containment at different times. (A) t = 660 s; (B) t = 3,456 s; (C) t = 8,351 s; (D) t = 14,300 s.
Figure 9 shows the distribution of the total mixture concentration (expressed as
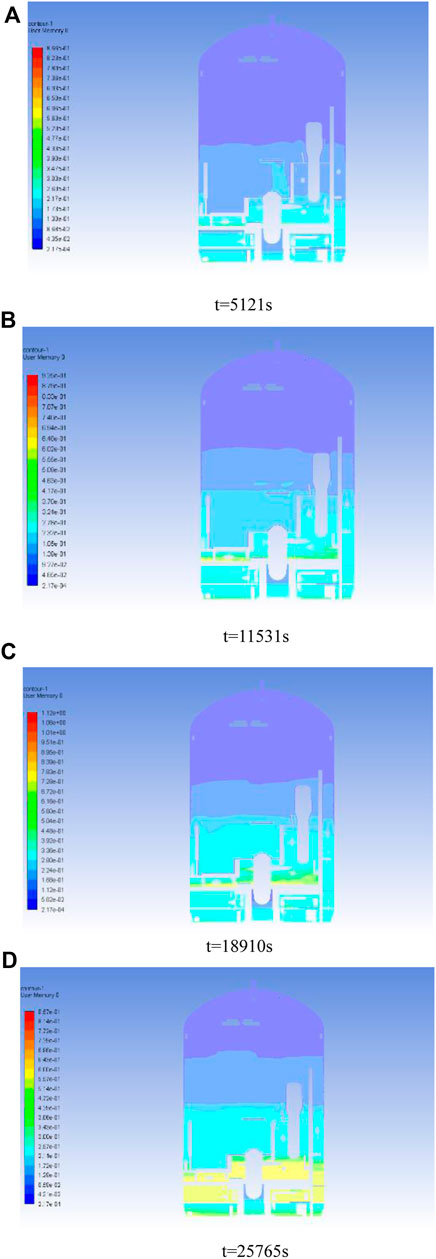
Figure 9. Total molar ratio
Figure 10 shows the cloud diagram of the explosion limit state parameter
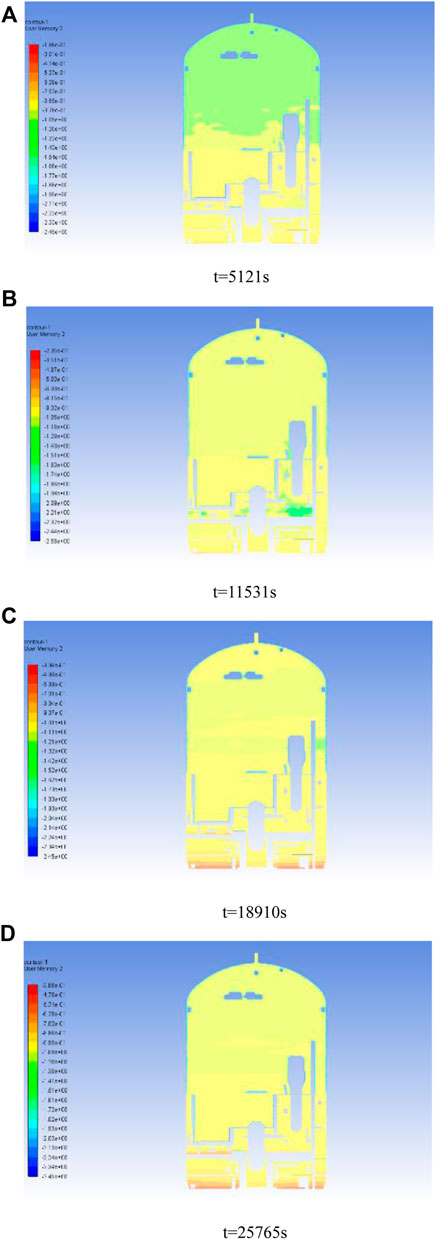
Figure 10. Explosion limit state
Figure 11 shows the mixture concentration,
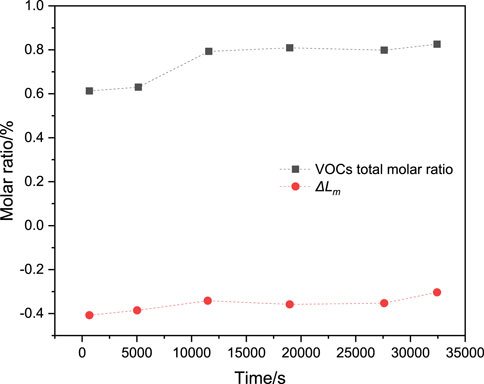
Figure 11. Mixed concentration and limit state parameter values for the highest risk of explosion in the containment at different times.
5 Conclusion
In this paper, the diffusion pattern and explosion risk of 12 major VOCs gases inside the containment during stable ventilation and 9 h pressure retention are investigated by computational fluid dynamics methods. Conservative assumptions are adopted for the diffusion process, the internal structure of the containment is simplified. The geometric and mesh models of the inner flow domain of the containment are established. 115 volatile surfaces are defined according to the principle of equal area. Steady-state simulation of the steady ventilation process was carried out to obtain the concentration fields of various VOCs gases inside the containment, which were used as the initial concentration fields for the unsteady-state simulation of the 9 h pressure holding process. The conclusions are obtained as follows:
a) Four mesh numbers are employed to verify the computational accuracy through steady state flow simulation. The relative deviation of inlet pressure and outlet velocity are compared in the mesh independence study and model verification, and 8.23 million meshes is finally selected in the consideration of computational resources and accuracy.
b) The flow characteristics inside the containment are analyzed. The process of VOC volatilization kinetic curve is simulated, and five points in the space are selected as observation points, and the results show that the maximum deviation of the values of the observation points from the experimental test values is not more than 2.1%, which indicates that the numerical simulation methodology is credible.
c) The simulation results show that the deviation between the simulated and actual values of most of the vent velocities is less than 0.05 m/s. Unsteady-state and steady-state simulations of gas diffusion in the ventilation process were carried out. The results of the unsteady state simulation show that the average change in the concentration of the main media relative to the previous moment is within 15% at 12707 s, indicating that the total mass of the VOC media in the containment tends to stabilize. The explosion limit analysis results of the gas show that the concentration in the volatile face near the unit is found to exceed its explosion limit at 429 s and 1245 s. Steady-state simulation results show that the VOC gas is quickly carried out by the gas flow, and will not accumulate in the space, and the medium is not highly concentrated in the containment.
d) Simulations of the 9H holding pressure shows that the gases are accumulated near their respective volatile surfaces. Throughout the 9H pressure-holding process, there is no explosive limit exceeding unit in the space. The explosive limit state value at the bottom of the containment is the highest relative to other areas, but there is no unit with explosive limit exceeded in the space.
Data availability statement
The raw data supporting the conclusion of this article will be made available by the authors, without undue reservation.
Author contributions
WW: Investigation, Writing–original draft, XF: Methodology, Writing–original draft, YH: Formal analysis, Writing–original draft, DL: Project administration, Writing–review & editing, DS: Writing–original draft, Writing–review & editing, SG: Supervision, Writing–review & editing, DZ: Conceptualization, Writing–review & editing.
Funding
The author(s) declare that financial support was received for the research, authorship, and/or publication of this article. Study on the Extension of Test Cycle of Containment Based on Historical Performance and Safety Assessment of Containment.
Acknowledgments
The authors would like to express their thanks to the China Nuclear Power Technology Research Institute Co., Ltd. Its sponsorship of the “Study on the Extension of Test Cycle of containment Based on Historical Performance and Safety Assessment” program.
Conflict of interest
Authors WW, XF, YH, DL, SG, and DZ were employed by the China Nuclear Power Technology Research Institute Co., Ltd.
The remaining author declares that the research was conducted in the absence of any commercial or financial relationships that could be construed as a potential conflict of interest.
Publisher’s note
All claims expressed in this article are solely those of the authors and do not necessarily represent those of their affiliated organizations, or those of the publisher, the editors and the reviewers. Any product that may be evaluated in this article, or claim that may be made by its manufacturer, is not guaranteed or endorsed by the publisher.
References
Albahri, T. A. (2013). Prediction of the lower flammability limit percent in air of pure compounds from their molecular structures. Fire Saf. J. 59, 188–201. doi:10.1016/j.firesaf.2013.04.007
ANSYS Inc (2011). ANSYS FLUENT user’s guide. Avilable at: http://www.ansys/com.
Chen, Z. J., Zuo, W., Zhou, K., Li, Q., Yi, Z., and Huang, Y. (2024). Numerical investigation on the performance enhancement of PEMFC with gradient sinusoidal-wave fins in cathode channel. Energy 288, 129894. doi:10.1016/j.energy.2023.129894
Cheng, J., and Luo, Y. (2013). Modified explosive diagram for determining gas-mixture explosibility. J. Loss Prev. Process Industries 26 (4), 714–722. doi:10.1016/j.jlp.2013.02.007
Coronado, C., Carvalho, J. A., Andrade, J. C., Cortez, E. V., Carvalho, F. S., Santos, J. C., et al. (2012). Flammability limits: a review with emphasis on ethanol for aeronautical applications and description of the experimental procedure. J. Hazard. Mater. 241, 32–54. doi:10.1016/j.jhazmat.2012.09.035
Gong, G. C., and Zhou, C. B. (2005). Operation risk analysis and control during ten year outage program (in Chinese). China Nucl. Sci. Technol. Rep. 2, 179–189.
Heymes, F., Aprin, L., Bony, A., Forestier, S., Cirocchi, S., and Dusserre, G. (2013). An experimental investigation of evaporation rates for different volatile organic compounds. Process Saf. Pro 32 (2), 193–198. doi:10.1002/prs.11566
Kondo, S., Takizawa, K., and Tokuhashi, K. (2013). Flammability limits of binary mixtures of ammonia with HFO-1234yf, HFO-1234ze, HFC-134a, and HFC-125. J. Fluor. Chem. 149 (2), 18–23. doi:10.1016/j.jfluchem.2013.02.010
Kondo, S., Urano, Y., Tokuhashi, K., Takahashi, A., and Tanaka, K. (2001). Prediction of flammability of gases by using F-number analysis. J. Hazard. Mater. 82 (2), 113–128. doi:10.1016/s0304-3894(00)00358-7
Konovalov, I. B., Beekmann, M., Berezin, E. V., Petetin, H., Mielonen, T., Kuznetsova, I. N., et al. (2015). The role of semi-volatile organic compounds in the mesoscale evolution of biomass burning aerosol: a modeling case study of the 2010 mega-fire event in Russia. Atmos. Chem. Phys. 15 (23), 13269–13297. doi:10.5194/acp-15-13269-2015
Koshiba, Y., Hasegawa, T., Kim, B., and Ohtani, H. (2017). Flammability limits, explosion pressures, and applicability of Le Chatelier's rule to binary alkane–nitrous oxide mixtures. J. Loss Prev. Process Industries 45, 1–8. doi:10.1016/j.jlp.2016.11.007
NIST (2021). NIST reference fluid thermodynamic and transport properties database. Avilable at: https://www.nist.gov/srd/refprop.
Osmont, A., Chetehouna, K., Chaumeix, N., DeYonker, N. J., and Catoire, L. (2015). Thermodynamic data of known volatile organic compounds (VOCs) in rosmarinus officinalis: implications for forest fire modeling. Comput. Theor. Chem. 1073, 27–33. doi:10.1016/j.comptc.2015.09.008
Qi, X. J., Fang, X. Z., Meng, Z. M., Sun, Z., Zhang, N., and Guo, Z. (2023). Preliminary design of the suppressive containment system based on HPR1000. Nucl. Eng. Des. 415, 112743. doi:10.1016/j.nucengdes.2023.112743
Rowley, J. R., Rowley, R. L., and Wilding, W. V. (2010). Experimental determination and re-examination of the effect of initial temperature on the lower flammability limit of pure liquids. J. Chem. Eng. Data 55 (9), 3063–3067. doi:10.1021/je901076a
Weng, W. Q., Zhang, K., and Wang, D. Y. (2019). Experimental research on lower flammability limits of the combustible vapors in containment test (in Chinese). J. Xian Jiaot. Univ. 53 (9), 176–182.
Zhang, K., Meng, X., and Wu, J. (2013). Flammability limits of bi-nary mixtures of 1,2-ethanediol + steam and 1,2-propane-diol + steam. J. Chem. Eng. Data 58 (9), 2681–2686. doi:10.1021/je400615a
Zhang, X., Cao, J. P., Wei, J. Y., and Zhang, Y. (2018). Improved C-history method for rapidly and accurately measuring the characteristic parameters of formaldehyde/VOCs emitted from building materials. Build. Environ. 143, 570–578. doi:10.1016/j.buildenv.2018.07.030
Zhao, J., Li, S. C., and Zhang, Bo. (2017). Research and application of the fire monitoring system for the containment. Nucl. Stand. Meas. Qual. 1, 47–50.
Zuo, W., Li, D. X., E, J. Q., Xia, Y., Li, Q., Quan, Y., et al. (2023a). Parametric study of cavity on the performance of a hydrogen-fueled micro planar combustor for thermophotovoltaic applications. Energy 263, 126028. doi:10.1016/j.energy.2022.126028
Keywords: containment, VOCs, numerical simulation, diffusion, explosion limit
Citation: Weng WQ, Fang X, Hu YW, Li DR, Sun DC, Guo SS and Zheng DK (2024) Numerical simulation of gas diffusion and explosion limit of VOCs in containment integrated leak rate test. Front. Energy Res. 12:1339494. doi: 10.3389/fenrg.2024.1339494
Received: 16 November 2023; Accepted: 14 March 2024;
Published: 03 April 2024.
Edited by:
Shripad T. Revankar, Purdue University, United StatesReviewed by:
Wei Zuo, Wuhan University of Science and Technology, ChinaAhmad Hussain, DHA Suffa University, Pakistan
Copyright © 2024 Weng, Fang, Hu, Li, Sun, Guo and Zheng. This is an open-access article distributed under the terms of the Creative Commons Attribution License (CC BY). The use, distribution or reproduction in other forums is permitted, provided the original author(s) and the copyright owner(s) are credited and that the original publication in this journal is cited, in accordance with accepted academic practice. No use, distribution or reproduction is permitted which does not comply with these terms.
*Correspondence: D. C. Sun, sundc@sdu.edu.cn