Integrated energy system scheduling optimization considering vertical-axis wind turbines and thermal inertia in oilfield management areas
 Xusheng Wang
 Jian Cui
 - China Petroleum Engineering and Construction Corporation North China Branch, Renqiu, Hebei, China
Traditional horizontal-axis wind turbines (HAWTs) have limited efficiency in low-wind speed regions. In this paper, an integrated energy system (IES) incorporating vertical-axis wind turbines (VAWTs) is proposed; this IES is located in an oilfield management area, which can utilize the low-wind speed resources more efficiently and improve renewable energy consumption, and it also introduces a demand response model based on thermal inertia (TI), thus smoothing out the volatility caused by the VAWT. Typical output scenarios are obtained through stochastic optimization to deal with wind turbine and photovoltaic output uncertainties, and an optimal scheduling model is proposed to minimize the system operating cost. Finally, a simulation study was conducted in a micro-oilfield management area in Shandong Province, China, to demonstrate the performance of the proposed system. The results show that the IES using a VAWT and TI can increase the renewable energy consumption capacity by 87% over the conventional HAWT system, change the user behavior, increase the economic efficiency by 12%, and achieve the smoothing of load-side fluctuation of electric and thermal loads, peak shaving, and valley filling. This paper provides a feasible solution for an IES in low-wind speed areas.
1 Introduction
1.1 Motivation
The wide distribution and vast reserves of wind and solar energy have given them unlimited potential for exploitation and utilization in space and time, and they are considered to be the most promising renewable energy sources. An integrated energy system (IES) incorporating renewable energy sources like wind and solar power is an effective means of achieving carbon neutrality and solving the energy transition issue. All countries are facing a pressing problem of carbon emissions, and an effective solution is to establish IESs (Chang et al., 2023). However, weather variations have an impact on wind speed and solar irradiation, making wind and solar output volatile and random (Wang et al., 2022a). Currently, the mainstream utilization of wind energy is based on the traditional horizontal-axis wind turbines (HAWTs); however, for low-speed winds that cannot be converted by horizontal-axis turbines, vertical-axis wind turbines (VAWTs) have better power generation ability. Moreover, its structure is simple and easy to maintain, and it does not need to adjust to the wind direction like the HAWTs (Su et al., 2020). Therefore, the VAWTs show good potential for development in the integrated energy system. However, the use of VAWTs is more sensitive to low wind speeds, resulting in greater volatility in WT output and impacting the stable operation of the system. Due to the high inertia of the thermal subsystem in an IES (Zhang et al., 2023a), the potential for energy storage and peak shaving is an effective means of dealing with the volatility introduced by VAWTs. Therefore, constructing an IES containing a VAWT is important to improve the utilization of low-wind speed resources in the oilfield management area (Petrovich and Kubli, 2023). In addition, how to make full use of thermal inertia (TI) under the market mechanism to enhance the flexibility of the IES and realize renewable energy consumption is a topic of concern (Cui and Cao, 2023). The research path of this paper is shown in Figure 1.
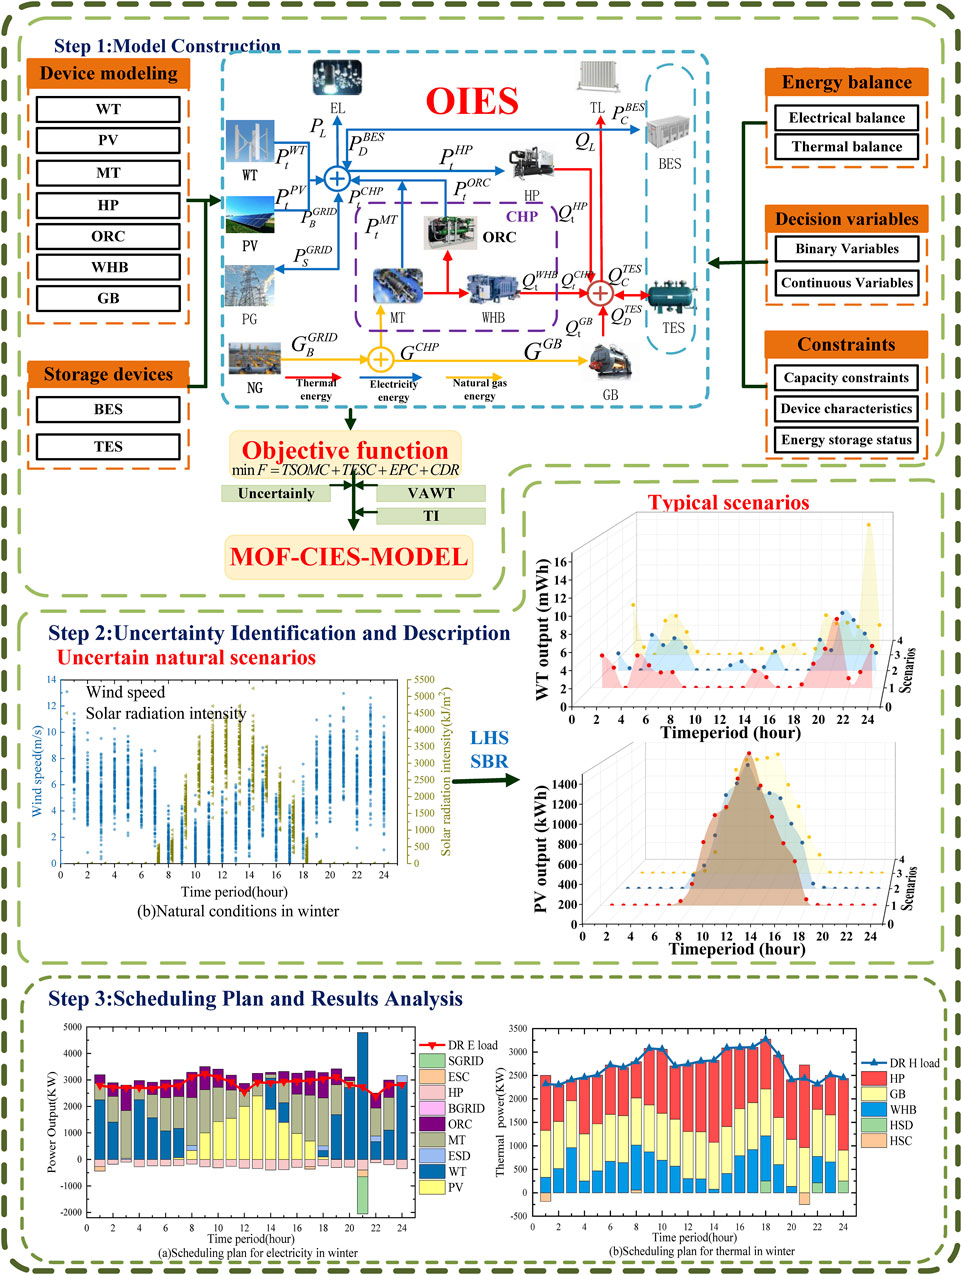
FIGURE 1. Roadmap of the proposed study.
1.2 Literature review
Conventional energy systems are often wasteful in terms of energy utilization. The IES converts energy according to user needs and realizes efficient use of energy. The community-integrated energy system (CIES) is a system involving multiple stakeholders and complex operating conditions. With the development of the social economy and the transformation of energy structures, the CIES is also evolving toward multi-energy flow, multi-scale, multi-scenario, and multi-subjects, forming a more refined and diversified energy supply and demand model (Chen et al., 2022), and the establishment of a suitable CIES is the key to solving energy problems. Li et al. (2021a) proposed a CIES with electric vehicle charging stations (EVCS) to solve the problem of renewable energy consumption. Li et al. (2021b) introduced a CIES containing a horizontal complementary substitution of electricity–gas-heat-cooling and vertical time-shift strategies to tap the energy demand-side potential. Based on this, Zhu et al. (2023) proposed a CIES containing electricity–gas-heat-cooling-electric vehicle flexible loads, which is effective in reducing CO2 emissions. Therefore, both Liu et al. (2021) and Zhang et al. (2020) proposed a CIES containing hydrogen-water system to realize the utilization of renewable energy through community microgrids (MGs) to reduce water consumption and GHG emissions. None of the above literature considers how wind renewables are consumed on the source side. The oilfield management area IES, as a complementary CIES for the oilfield, where the road dividers, the tops of the buildings, and the surroundings are full of turbulence and chaotic low-speed wind resources, is particularly important to develop the power generation potential of this CIES (Chen et al., 2020). The article takes into account the aerodynamic characteristics of WTs to establish the optimal operation model of an uncertain wind power IES. Based on this, Chen et al. (2023) improved the algorithm and proposed a short-term wind power prediction model based on VMD-GRU to improve the utilization rate of renewable wind resources; meanwhile, all of the literature studies also suggest that it is not possible to fully utilize the low wind speed. Assareh et al. (2016) used an advanced optimization model to regulate the torque of wind turbines to improve the utilization of wind energy in low-wind speed areas.
In recent years, the VAWT has emerged as a new and evolving technology that outperforms conventional HAWTs in capturing energy in low-wind regions Hand et al. (2021). Because VAWTs do not require a yaw mechanism and have a simple structural design, which makes them insensitive to the wind direction, such characteristics make them well-suited for offshore power generation and small-scale communities. In an article, Ullah et al. (2020) used the unsteady Reynolds-averaged Navier–Stokes (URANS) method to computationally verify that the cut-in wind speed of the VAWT is only required to be 2.5 m/s. The low cut-in wind speed means that the VAWT can start generating electricity at lower wind speeds, thus increasing the energy capture efficiency. Kumar et al. (2018) and Aslam Bhutta et al. (2012) pointed out the high cost of on-site wind resource measurements when applied to more complex urban situations, which is often not feasible for small power projects. Large HAWTs are relatively ineffective in this environment; from the technical line of research, VAWTs are superior compared to HAWTs in the CIES. While the above literature only considers how to utilize low-wind speed resources at the technical level, it does not consider the economics and stability of the IES. Therefore, it is especially critical to establish a CIES that includes VAWTs for scheduling optimization with the goal of stable system operation and the lowest cost. However, the utilization of low wind speed can also lead to an increase in system volatility and impact the stable operation of the system.
System volatility is an important factor limiting the smooth operation of IES. Liu et al. (2022) developed a flexibly adjustable electrothermal CIES for addressing the system volatility due to the high proportion of renewable energy in the system and the significant integration of controllable loads. Tao et al. (2021) proposed the use of shared energy storage to improve system stability using distributed energy sources. The introduction of demand response considering TIs on the load side under a market-based mechanism to utilize the potential of TIs for energy storage and peak shaving, thus smoothing out the system volatility due to the use of VAWTs, is also a potential approach to address the system volatility at present. Both Yang et al. (2021) and Zhang et al. (2023b) suggested in their articles that TI increases the energy storage capacity in the system, which can improve the consumption of renewable energy and have a positive impact on system stability. Li et al. (2020) further pointed out that TI can provide a solution to the lack of system flexibility associated with the high penetration of wind power and that grid integration of wind power can be effectively facilitated through the use of TI in the IES.
A high percentage of renewable energy use will also introduce multiple uncertainties, and such problems can be solved by stochastic optimization (SO), i.e., discretizing the distribution of the prediction errors into different scenarios using scenario generation methods that take into account the uncertainties and then transforming the stochastic optimization problem into a deterministic problem. Jiang et al. (2017) provided an overview of parameter estimation methods for the Weibull distribution and suggested that accurate parameter estimation is very significant in the assessment of low-speed wind energy resources. Han et al. (2023a) solved a complex scheduling problem involving multiple subsystems, energy interactions, and uncertainty disturbances using SO. Wang et al. (2023) proposed a scenario-based approach for solving the operational problem of urban IES (IPGHS), which effectively handles a large number of scenarios and resolves the uncertainty effects (Mei et al., 2021). Latin hypercube sampling (LHS) is a multidimensional stratified sampling method that effectively characterizes the overall distribution of a random variable with fewer sampling iterations than traditional Monte Carlo methods for wind speed datasets with large high–low disparities. It is also proposed that the introduction of similar scenes in SO introduces noise, and therefore, scene reduction is necessary. In this paper, we will use simultaneous back reduction (SBR) (Pirouzi et al., 2022). This method can better maintain the probabilistic balance of the remaining scenes and avoid the deletion of important scenes.
1.3 Contribution
To make full use of the low-wind speed resources, address the losses caused during renewable energy dispatch, decarbonize the thermal system loads, and thus achieve carbon neutrality under the market-based mechanism, the role of TI for the IES is considered to be under-exploited. In this paper, we propose an oilfield management areas’ integrated energy system containing a VAWT and TI and consider constructing a stochastic optimization model capturing multiple uncertainties with source-load bilateral uncertainties to solve the uncertainty optimization problem. The main contributions are as follows:
(1) This paper proposes a new technology of using small VAWTs in micro-oilfields compared with conventional large HAWTs with high installed capacity, taking into account the characteristics of small VAWTs that can receive winds in multiple directions and have low start-up wind speeds and making full use of a large amount of renewable low-wind energy sources that exist in the oilfields to increase the penetration rate of low-wind speeds in the micro-oilfields’ integrated energy systems.
(2) In this paper, the TI within the IES is fully considered, and an incentive-based demand response model based on TI is established under the market mechanism to utilize the potential of TI for energy storage and peak shaving, and TI is considered for smoothing out the volatility due to the use of VAWTs to dissipate low-wind speed resources, make the best use of TI, and enhance the stability of the system and the peak shifting capability.
2 System description
This paper aims to utilize the abundant wind and solar energy resources in oilfields and propose an integrated electrical and thermal energy system based on the oilfield management area, which contains a VAWT and TI. The oilfield management area is an integrated area that contains the oilfield administrative offices and a living community for oilfield workers. The system uses vertical-axis turbines and photovoltaic (PV) and micro-turbine (MT) power generation as the main sources of electricity, with the upper grid as a backup power source; the main source of natural gas is the upper grid, which provides gas for the combined heat and power (CHP) and the gas boiler (GB), and the excess electricity can be sold back to the upper grid; the energy-coupled devices, CHP, HP, and GB allow for the bi-directional flow of electrical and thermal energy. The CHP consists of a micro-gas turbine, a waste heat boiler (WHB), and a low-temperature waste heat generator based on the organic Rankine cycle (ORC), which operates in the cogeneration mode. The mode of operation is thermoelectric coupling, which can be adapted to the different operating conditions of the system; HP and GB utilize electrical energy and take up part of the heat load. The introduction of DR can smooth out the variation in the load curve, achieve the interactive coupling of electricity and heat, shave peaks and fill valleys, and lower the operating cost. It should be noted that VAWTs are used for wind power generation, and the OIES is shown in Figure 2.
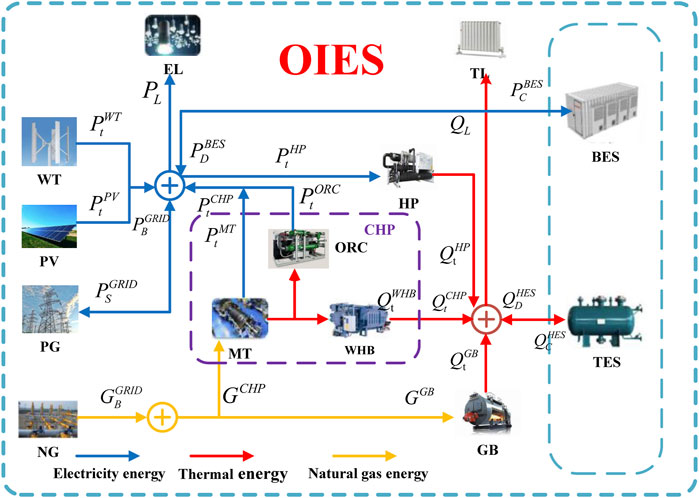
FIGURE 2. OIES structure and energy flows.
3 Modeling
First, a generalized mathematical model of the conversion-side equipment in the system is developed based on Equations 1–43, which includes CHP units, HP, and GB based on Figure 2. Then, the demand response dominated by TI is taken into account in the system to obtain the electrical and thermal load curves under the demand response. Finally, the objective function aiming at the lowest cost is constructed, and the CPLEX solver is invoked to solve this MILP problem based on the MATLAB platform under the conditions of satisfying the system output constraints, energy balance constraints, equipment energy conversion constraints, energy storage equipment constraints, and TI.
3.1 Constraints
(1) Constraints for WT (Li et al., 2022)
Equation 1 shows the relationship between the WT output and the wind speed. Equations 2 and 3 represent the constraints on capacity and ramping rate, respectively.
(2) Constraints for PV (Diab et al., 2024):
Equation 4 illustrates the output and conversion efficiency of PV. Equations 5 and 6 specify the constraints on capacity and ramping rate, respectively.
(3) Constraints for CHP (Wang et al., 2022b)
The CHP system contains the MT, ORC, and WHB, and they form an energy coupling device to adapt to different operating conditions of the CIES. The constraints for them are the following:
Equation 7 demonstrates the output and conversion efficiency of the MT, and Equation 8 shows the thermal–electric coupling of the MT. Equations 9 and 10 define the limits of the MT’s thermal and electricity power output. Equations 11 and 12 state the ramping rate of the MT. Equations 13 and 14 describe the interactions between the on/off states and the start-up/shut-down options of the MT. Equation 15 implies the minimum uptime and downtime requirements. Equations 16–20 illustrate the output and conversion and the thermal–electric coupling of CHP.
(4) Constraints for GB (Wang et al., 2019)
Equation 21 depicts the heat generated by the GB, and Equation 22 gives the boundary. Equation 23 depicts the thermal energy generated by the heat, and Equation 24 gives its boundary. Equation 25 indicates the ramping rate of the GB.
(5) Constraints for HP (Meesenburg et al., 2018)
The constraints on the HP are depicted by Equations 26 and 27. Equation 26 shows the conversion between the thermal and electricity power. Equation 27 gives the boundary.
(6) Constraints for BES and TES (Han et al., 2023b)
As shown by Equation 28, charging and discharging cannot happen simultaneously to satisfy the maximum charge and discharge power limit, which is ensured by Equations 29 and 30, respectively. Equation 31 shows the dynamic status of different energy storage devices. Equation 32 limits the maximum storage state of the energy storage devices. Equation 33 indicates the charge/discharge balance of the energy storage devices within a scheduling period.
(7) Constraints for the DR (demand response) resource (Wang et al., 2022c)
As shown by Equations 34 and 35, the electric loads that are shifted up and down have capacities. The electric loads cannot shift up and down concurrently, as indicated by Equation 36. Equation 37 requires that the electric loads shifted up and down have equal sums in the daily cycle. Analogously, the constraints for thermal loads are presented in Equations 38–41.
(8) Constraints for the system balance
Equations 42 and 43 show the energy supply and demand balance of the electric and thermal systems, respectively.
(9) Constraints for TI (Li et al., 2023)
According to the thermodynamic principle of houses, the heat model of houses is expressed by Equation 44. Equations 45–49 give the heat transfer from the building materials such as walls, windows, and other materials due to their specific heat capacity. Equation 50 depicts the heat of the buildings due to TI.
3.2 Objective functions
The objective function is set up with the minimum OIES operating costs, and internal scheduling is carried out based on the lowest costs. Costs in the model include the total system operation and maintenance cost (TSOMC), total equipment start–shut cost (TESC), energy purchasing cost (EPC), and cost of DR (CDR). The objective function is shown in Eqs 51-55.
3.3 Solution procedure
The solution process of the OIES model proposed in this paper includes the following steps:
Step 1. According to the historical meteorological data, stratified random sampling of historical wind speed and light data by LHS is used to get the wind speed and light sampling generation data
Step 2. The sampling data scene from Step 1 is cut down, SBR is used to cut down the wind and light output into three typical scenarios, and the probability of each scenario is multiplied with the corresponding scenario to get the uncertainty output.
Step 3. In the typical scenarios obtained from Step 2, the output power of VAWTs and PV power generation is compared with the historical electric and thermal load data to establish the OIES basic operation scenarios. The typical operating scenario data set is thus obtained, and the optimal operating strategy can be generated.
Step 4. Using the typical scenario set, the optimization model is established with the basic configuration parameters of the units. The objective function for decision-making is the minimization of the operating costs for a typical scenario. The decision variables are the output power levels of all units during the optimization cycle. In addition, some complex constraints are taken into account, such as the energy balance of the OIES, the power output constraints on wind and PV power, the equipment operation constraints, and the energy storage constraints.
Step 5. The optimal operation model is solved using the MATLAB optimization toolbox and the CPLEX solver to obtain the optimal operation strategies throughout the optimization cycle.
4 Case study
4.1 Data description
In this paper, a typical OIES system is selected for a case study. The system is located in a micro oilfield management community in Shandong Province, China, where wind speed and light are abundant natural resources and data are easily available, which is suitable for the OIES study proposed in this paper. The system structure is shown in Figure 2. The technical parameters of all the equipment are shown in Table 1.

TABLE 1. Parameters for components in the OIES system.
This study used one season of meteorological data and typical load data from 1 November 2021 to 31 January 2021 in the region as the inputs. It is split into three seasons based on meteorological conditions, as shown in Figure 3, where November to January is winter, and the following aspects are important:
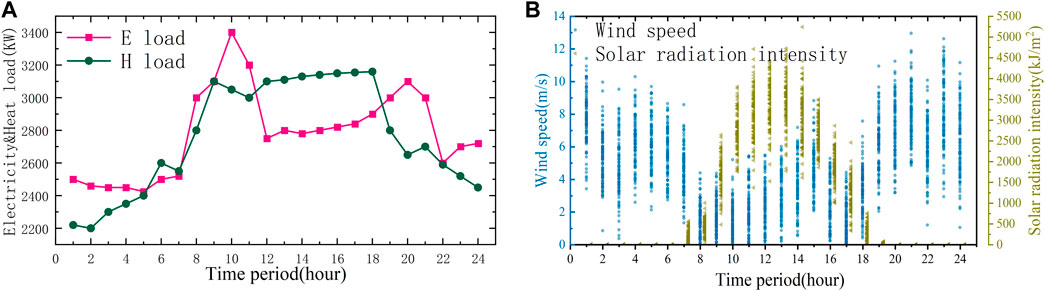
FIGURE 3. Typical load states and natural conditions in winter. (A) Electricity and Heat typical load states. (B) National conditions in winter.
From the typical power–load curve that can be obtained, the typical daily power load fluctuation is large and can be divided into peaks and valleys in three sections. During the day, the electricity consumption load state is in the valley at this time due to the fact that most of the customers are resting during the hours of 0:00–7:00 and 22:00–24:00. The electricity flat section is for 12:00–18:00; at this time, from the power–load curve, it can be seen that the load is more average and stable. Between 7:00–12:00 and 18:00–22:00, most of the users start their daily work and life during these two time periods, so the power load is high and stable. Thermal loads are also consistent with this feature, and unlike electric loads, thermal loads are consistently high in winter in northern China due to the cold temperatures and the increased demand for heat by residents. Through the method proposed above, the wind speed and light historical data, using LHS and SBR, can be obtained according to the probability distribution of the typical scenarios; the wind speed and light data and typical scenarios are shown in Figure 4, where the probability of the wind turbine power scenarios in Figure 4 is 18.6%, 21.8%, and 59.6%, and the probability of the PV power scenarios is 14.8%, 21.2%, and 64%, respectively.
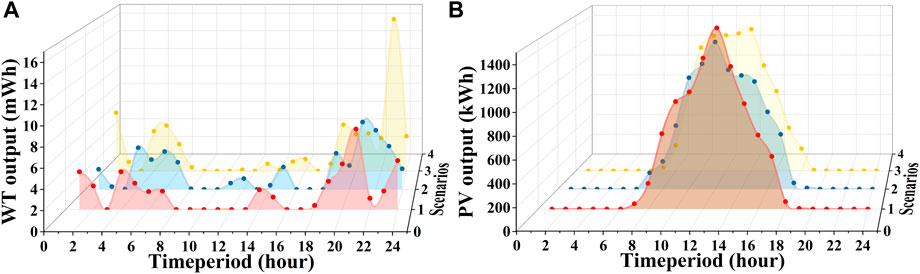
FIGURE 4. Typical renewable energy output scenarios. (A) wind turbine output scenarios. (B) photovoltaic output scenarios.
4.2 Parameter fitting and accuracy validation of the Weibull distribution
The value of the shape parameter K of the Weibull distribution reflects the width of the wind speed distribution; in general, the smaller the value, the wider the wind speed distribution. Most scholars believe that the two-parameter Weibull distribution can better simulate wind speed variations. The two parameters of the Weibull distribution are calculated using the empirical method of Lysen (EML), the ordinary least square (OLS), the maximum likelihood estimation (ML) used in this paper. In this paper, 2,160 wind speed samples with a statistical value of 1 h in 90 days are selected for analysis, and 1 m/s is used as a wind speed interval range for rate statistics. The above three Weibull distribution fitting methods are used to simulate the wind speed data to obtain the K and C values, and then, the Weibull distribution is used to find the frequency of each wind speed band. The calculation results are shown in Table 2, and the measured wind frequency distribution and the simulated distribution of the Weibull distribution are shown in Figure 5.
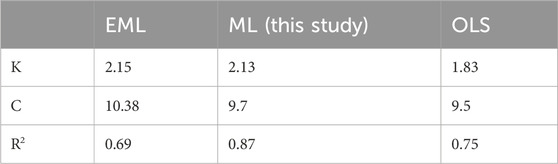
TABLE 2. Simulation results of Weibull distribution.
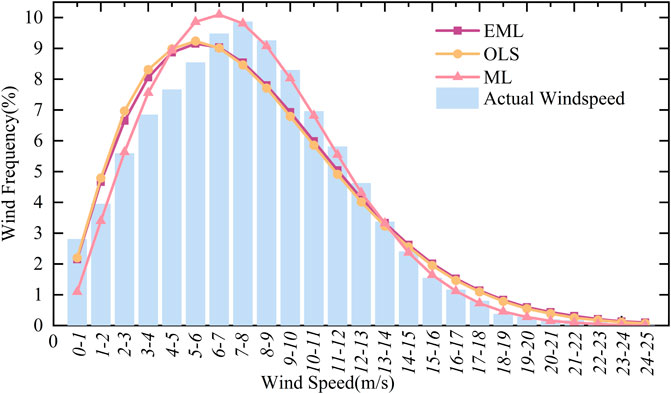
FIGURE 5. Actual wind speed and frequency and Weibull-fitted distribution.
The coefficient of determination R2 of the ML used in this paper is greater than that of EML and LLSA, and the fitting accuracy is better, as can be seen in Table 2. The results of the Weibull simulation using the empirical method EML and the least-squares method LLSA are general, with coefficients of determination of 0.69 and 0.75, respectively, and this result can also be seen in Figure 5. This also verifies that the accuracy of the wind frequency distribution fitting is crucial to the accuracy of the wind power density calculation. ML can better fit the wind frequency of the measured wind data, and it is more similar to the measured wind data when using the Weibull calculation, with a smaller error and larger value of the coefficient of determination, and its wind frequency fit is better than that of the empirical method and the least-squares method, while the empirical method and the least-squares method are relatively poorer in terms of the fit, and the corresponding error of the calculated wind power density is also larger. Therefore, the ML is used to simulate the wind frequency distribution of the wind data in the wind resource assessment of the actual project, and the wind power density is calculated to be closer to the actual wind power density, which can provide a reliable basis for a better understanding of the wind resources of the wind farm.
4.3 Comparison of VAWT and HAWT power outputs
The wind speed parameter of a VAWT is replaced by the wind speed parameter of a HAWT, i.e., the rated speed, cut-in speed, and cut-out speed of the WT are increased to 15 m/s, 4 m/s, and 25 m/s. Using MATLAB, the typical winter scenario is obtained from the SBR algorithm based on the Kantorovich distance, and then, the wind speed data are used to calculate the HAWT output by the Weibull distribution. The output of the WT when a HAWT is used in the oilfield management area under the same wind speed data is obtained and compared with that of a VAWT, and the comparison results are shown in Figure 6. Combined with the wind speed data on a typical day in winter, on comparing the output of the VAWT and HAWT power outputs at the same wind speed, the result shows that the output of the VAWT is significantly better than that of the HAWT during the low-wind speed period, and the total output of the VAWT is higher than that of the HAWT by about 83.7% on a typical day. It can be seen that the VAWT has better efficiency in capturing wind energy than the conventional HAWT in low-wind speed regions.
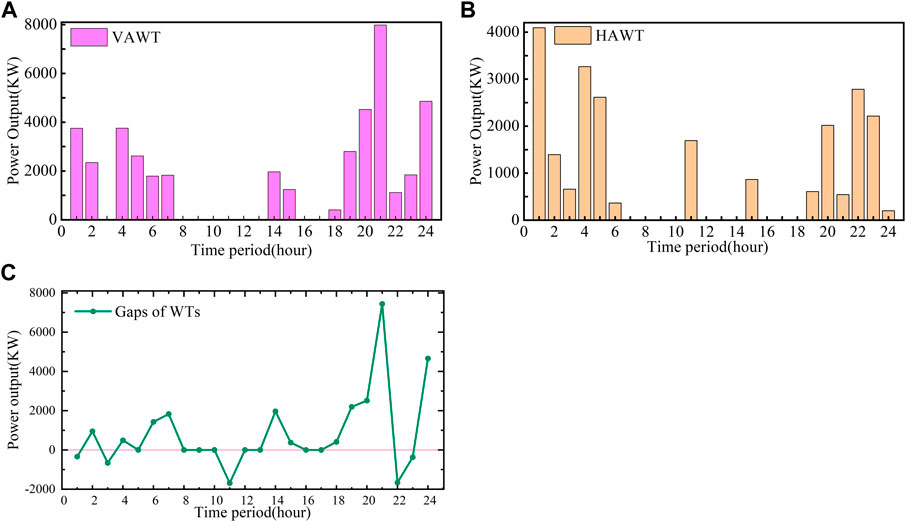
FIGURE 6. Output of VAWT and HAWT. (A) Output of VAWT. (B) Output of HAWT. (C) Output difference between VAWT and HAWT.
4.4 Scheduling result analysis
Figure 7 shows the scheduling of different energy devices in the system in winter, Figure 8 demonstrates the actual and optimized electric and thermal load curves before and after the corresponding demand, Figure 9 shows the time-shared tariff heat price curves before and after the time-shared demand response, and Figure 10 shows the indoor and outdoor temperature curves under the consideration of TI conditions. The following conclusions can be drawn from the analysis of renewable energy sources scheduling in the figure:
(1) The system relies on wind power output and power purchased from the higher grid to meet the demand of HP, HS charging, and electric load to maintain the electric power balance in that period, and the thermal load is supplied by HP, GB, and HS to realize the thermal power balance. Since the operation and maintenance cost of a wind turbine is small, it is beneficial to prioritize the use of wind turbine power to reduce the operation cost, and in the case that the wind turbine power still cannot meet the demand of the system electric load and the price of electricity in that period is low, then the higher-level grid and the CHP unit will make up for the generation of electricity. On the other hand, the efficiency of the HP heat supply is higher than that of CHP and GB; therefore, HP is preferred to supply heat, and in the case that HP cannot meet the demand of the heat load and the CHP unit does not produce power during that period, HP is preferred to supply heat, and in the case that the CHP unit does not produce power, then the CHP unit will not produce power. In case HP cannot fully meet the heat load demand and CHP is not available at that time, GB will be used to supply heat.
(2) As shown in the figure, the wind turbine can operate at 100% in all 24 h, i.e., there is no wind curtailment phenomenon; for the PV output, the PV can work at 100% in the period of 08:00–17:00, and the PV can also work at 100% in the periods of 01:00–07:00 and 18:00–24:00 because the PV output in the periods of 01:00–07:00 and 18:00–24:00 is 100%. As the PV output of 01:00–07:00 and 18:00–24:00 is 0, the utilization rate is also 0 (which can be interpreted as 100%), i.e., there is no abandoned light phenomenon. Thus, all the wind and solar energy is consumed, thus offsetting the operating cost of the normal unit. When the initial capacity configuration or the ideal wind power and various types of energy load demand change, it is possible that the wind utilization rate will not reach 100%. Because the goal of the optimal scheduling strategy proposed in this chapter is to “use new energy sources such as wind power effectively while lowering the economic cost of the system energy,” even if the wind power utilization rate does not reach 100%, it has already achieved the maximum utilization rate of wind power in the system.
(3) The electric and thermal loads before and after the demand response are shown in Figure 8. Due to the full utilization of the thermal inertia of the building, the peak shaving and valley filling of the electric and thermal loads are realized after the demand response, while the indoor temperatures are maintained constant and unchanged, as shown in Figure 10.
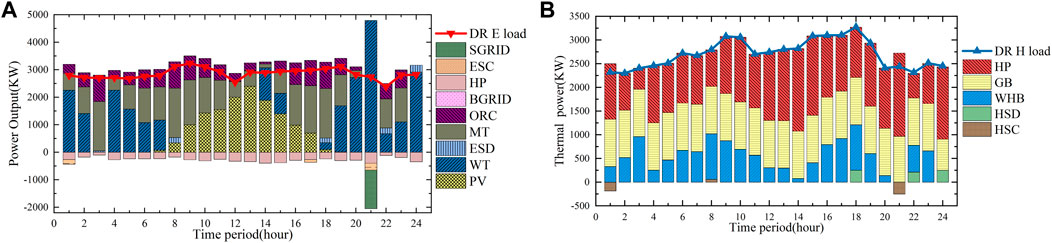
FIGURE 7. Scheduling plan for electricity and thermal energy in winter. (A) Scheduling plan for electricity in winter. (B) Scheduling plan for thermal in winter.
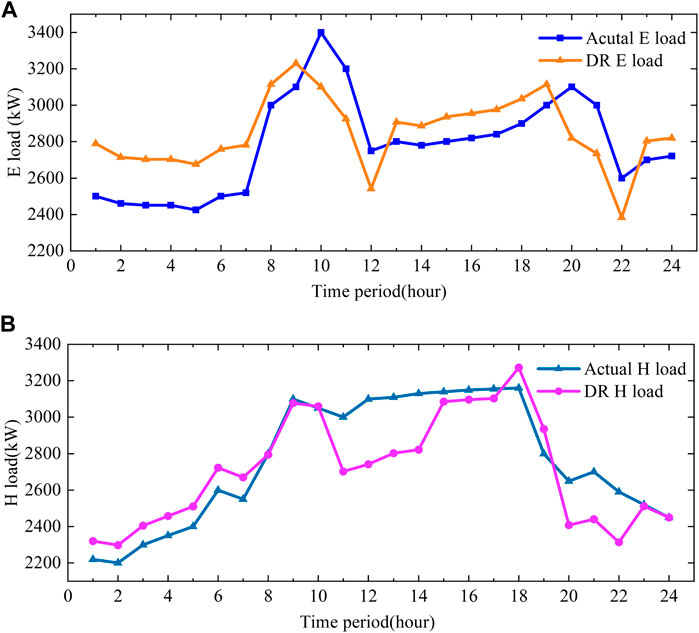
FIGURE 8. Actual and DR typical load of electricity and thermal energy. (A) Actual and DR E load. (B) Actual and DR H load.
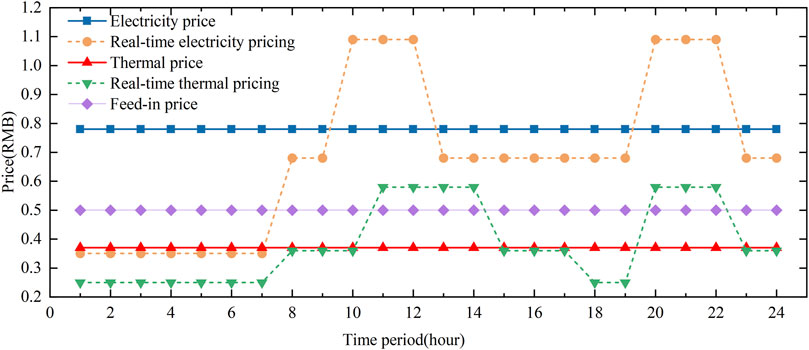
FIGURE 9. Price of electricity and thermal energy.
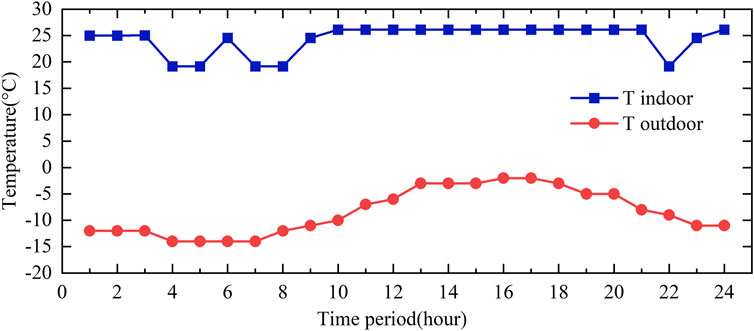
FIGURE 10. Indoor and outdoor temperature.
It is worth noting that through the analysis of typical winter scenarios, it is found that other seasons are also consistent in this feature, and the scheduling of summer and the transition seasons is shown in Figures 11 and 12.
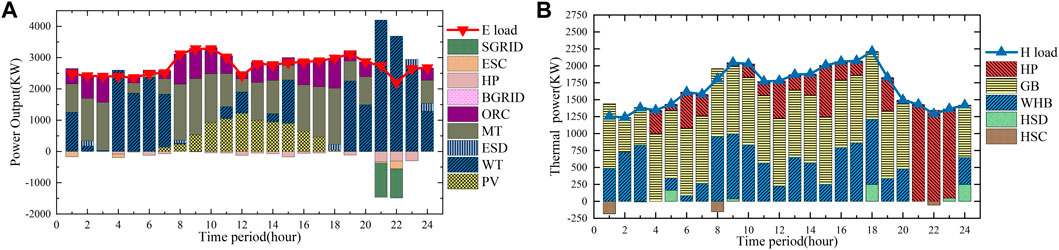
FIGURE 11. Scheduling plan for electricity and thermal energy in summer. (A) Scheduling plan for electricity in summer. (B) Scheduling plan for thermal in summer.
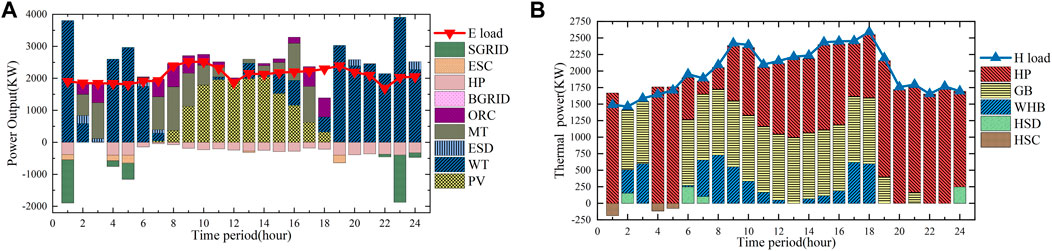
FIGURE 12. Scheduling plan for electricity and thermal energy in spring and autumn. (A) Scheduling plan for electricity in spring and autumn. (B) Scheduling plan for thermal in spring and autumn.
4.5 Comparison of the different system configuration scenarios
Since the OIES system is a complex coupled system with multiple devices operating together and each device has different parameters, they affect the stability and economy of the OIES system. Therefore, several scenarios are designed to verify the economics of the OIES proposed in this paper, considering VAWTs and community thermal inertia through the comparison of operating costs, to prove the superiority of the system proposed in this paper, in which the scenarios are set up by the following principles: taking the data in the winter typical operation cycle of the case system presented in 4.1 as the standard, designing each scenario to satisfy the electrical and thermal loads of the day, ensuring the stable operation of CIES, and each system having the advantage and potential to utilize different equipment. The scenarios designed in this paper are shown in Table 3; √ means existence, and × means inexistence.
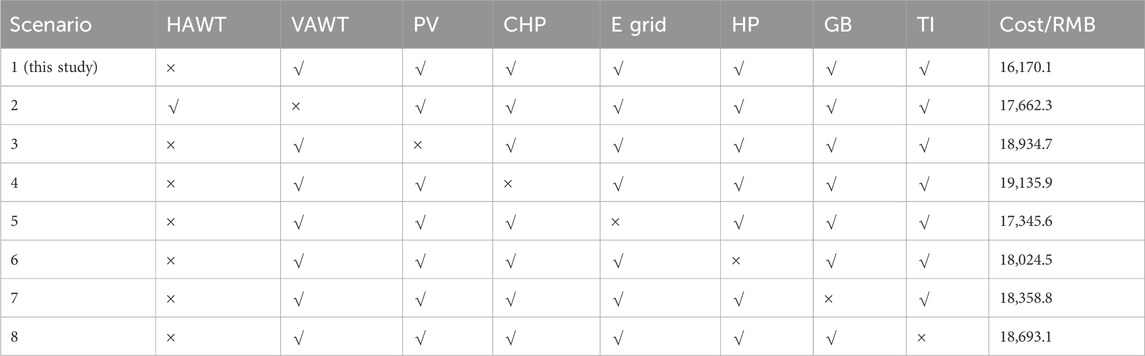
TABLE 3. Comparison of the different system configuration scenarios.
Scenario 1 is the OIES scenario proposed in this paper, in which the use of VAWTs and the consideration of community thermal inertia are fully utilized in the wind renewable energy in the low-wind speed resources and the development of thermal inertia to meet the thermal load of the system with the lowest operating costs.
Scenarios 2–5 consider the principle of electric power in the system, respectively, so that the electric power equipment in the system is reduced by one and the thermal power equipment remains unchanged to meet the thermal load of the original system with the common power of multiple types of equipment. The operation of the system still satisfies the principle of economy, and the electric power equipment with the lowest operating cost during the operating cycle is found to satisfy the electric load.
The design principle of scenarios 2 and 3 is to consider the utilization of renewable energy sources in OIES. In scenario 2, the wind turbine is replaced by a conventional horizontal-axis turbine in the scenario setup, which increases the start-up wind speed of the horizontal axis to 4 m/s compared to the vertical-axis turbine, thus preventing the utilization of wind resources from 1.5 to 4 m/s. In scenario 3, the utilization of PV is not considered, which again leaves the renewable energy source underutilized. Compared to scenario 1, the operating costs of these two scenarios are higher by 1,492.2 RMB and 2,764.6 RMB, respectively.
Compared with other scenarios, scenario 4 is set up without considering the CHP unit, in which the system power supply is dominated by the renewable energy output, the rest is satisfied by the main grid, and the heat load is satisfied by the HP and GB. This scenario reduces the start-up and shut-down cost and the O and M cost of the system from the equipment side, but due to the obvious peaks and valleys of the electric and thermal loads, the total cost of the system is still higher than that of scenario 1 by 2,965.8 RMB because the electric loads are met by the grid only.
Scenario 5 is similar, where the system is self-consistent in this way and has strong robustness in meeting loads on the load side, but the gas price is higher than the electricity price most of the time; thus, this scenario does not purchase electricity from the grid to meet loads on the load side when the electricity price is lower, and the economic cost is slightly higher than that of scenario 1, which is 1,175.5 RMB. One point worth thinking about for this scenario is that meeting loads on the load side through CHP units will increase CO2 emissions, so the environmental friendliness of the system will be a great challenge, but when carbon-capture devices are added to the system, this self-consistent system shows great potential for development.
Scenarios 6–8 consider the system heat load equipment output. In these three scenarios, the CHP unit is guaranteed to meet the heat load demand. HP as the CHP factor is a very high heat output equipment, and it makes full use of low-grade heat energy, converting it into high-grade heat energy. When scenario 6 removes the HP, it makes the system total operating cost increase by 1,854.4 RMB, and this scenario is only to increase the comparison scenario, but this self-negotiated system has potential to develop. This scenario is only to increase the comparison scenario and cannot satisfy the efficient and stable operation of the system. Scenario 7 is set to consider only the CHP unit and HP to satisfy most of the heat loads, and this scenario is similar to the principle of scenario 5, but it gives up the electricity when the price of electricity is low, and the total operation cost is higher than that of scenario 1 by 2,188.7 RMB. The scenario 8 setting is relative to the CIES system without considering thermal inertia, and the total operating cost of the system is higher than that of scenario 1 by 2,523 RMB, so it is necessary to fully develop and utilize the TI.
In summary, the economics of scenario 1 is the best among all scenarios. Although multiple devices have higher investment costs, this scheduling strategy can still maintain the economy of the system operation when the devices are built with appropriate redundancy, considering the future load growth and the same multiple devices are operated in concert to fully utilize the renewable wind PV resources in the system and the thermal inertia of the building, which also increases the environmental friendliness and robustness of the CIES.
5 Conclusion
By introducing VAWTs into the system, the full utilization of low wind speeds existing in the micro-oilfield is realized, which can be more easily adapted to the complex terrain and turbulent wind field, and the ability of the whole system to consume renewable energy is greatly improved, increasing the utilization rate of wind energy. Moreover, the VAWT can work in any wind direction without wind tracking devices, and the generator and transmission can be installed on the ground for easy installation and maintenance, reducing structural complexity and maintenance costs. In the oilfield office management community, VAWTs have a more esthetic and coordinated appearance, which can reduce the impact on the environment and the community. At the same time, the autonomous operation of the OIES is satisfied as much as possible by the CHP unit output, which is fully significant in maintaining the system’s robustness.
Thermal inertia affects the temperature and comfort of the oilfield management areas. By measuring the ability of buildings and other objects in the community to absorb and release heat, thus realizing the regulating effect of electric and thermal loads, it can shave peaks and fill valleys, smooth out load fluctuations, and lower greenhouse gas emissions and the urban heat island effect. In addition, VAWTs can increase the ventilation and cooling effect in the community by improving the distribution of the wind field, thus improving the comfort and health of the community. The use of VAWTs can enhance the efficiency and reliability of integrated energy systems in oilfield management areas and improve the environment and quality of life in communities.
This paper takes the integrated energy system of the oilfield management office community as the background, and by proposing the system structure of the VAWT and community thermal inertia, it realizes the full use of low wind speed and improves the rate of new energy consumption; through the development of community thermal inertia, this paper realizes the shaving of electric and thermal loads in the process of scheduling optimization. There are still shortcomings in the existing research; due to technical limitations, this paper cannot optimize the structure, working principle, and placement of the VAWT, so the new energy consumption in the actual scenario can still be improved.
Data availability statement
The raw data supporting the conclusion of this article will be made available by the authors, without undue reservation.
Author contributions
XW: conceptualization, writing–original draft, methodology, and software. JC: conceptualization, methodology, and writing–review and editing. BR: methodology, supervision, and writing–review and editing. YL: data curation and writing–review and editing. YH: data curation, supervision, and writing–review and editing.
Funding
The author(s) declare that no financial support was received for the research, authorship, and/or publication of this article.
Conflict of interest
Authors XW, JC, BR, YL, and YH were employed by the China Petroleum Engineering and Construction Corporation, North China Branch.
Publisher’s note
All claims expressed in this article are solely those of the authors and do not necessarily represent those of their affiliated organizations, or those of the publisher, the editors, and the reviewers. Any product that may be evaluated in this article, or claim that may be made by its manufacturer, is not guaranteed or endorsed by the publisher.
References
Aslam Bhutta, M. M., Hayat, N., Farooq, A. U., Ali, Z., Jamil, S. R., and Hussain, Z. (2012). Vertical axis wind turbine – a review of various configurations and design techniques. Renew. Sustain. Energy Rev. 16, 1926–1939. doi:10.1016/j.rser.2011.12.004
Assareh, E., Poultangari, I., Tandis, E., and Nedaei, M. (2016). Optimizing the wind power generation in low wind speed areas using an advanced hybrid RBF neural network coupled with the HGA-GSA optimization method. J. Mech. Sci. Technol. 30, 4735–4745. doi:10.1007/s12206-016-0945-4
Chang, H., Ding, Q., Zhao, W., Hou, N., and Liu, W. (2023). The digital economy, industrial structure upgrading, and carbon emission intensity —— empirical evidence from China's provinces. Energy Strategy Rev. 50, 101218. doi:10.1016/j.esr.2023.101218
Chen, H., Wu, H., Kan, T., Zhang, J., and Li, H. (2023). Low-carbon economic dispatch of integrated energy system containing electric hydrogen production based on VMD-GRU short-term wind power prediction. Int. J. Electr. Power & Energy Syst. 154, 109420. doi:10.1016/j.ijepes.2023.109420
Chen, X., Wang, C., Wu, Q., Dong, X., Yang, M., He, S., et al. (2020). Optimal operation of integrated energy system considering dynamic heat-gas characteristics and uncertain wind power. Energy 198, 117270. doi:10.1016/j.energy.2020.117270
Chen, Y., Xu, J., Wang, J., Lund, P. D., and Wang, D. (2022). Configuration optimization and selection of a photovoltaic-gas integrated energy system considering renewable energy penetration in power grid. Energy Convers. Manag. 254, 115260. doi:10.1016/j.enconman.2022.115260
Cui, H., and Cao, Y. (2023). How can market-oriented environmental regulation improve urban energy efficiency? Evidence from quasi-experiment in China's SO2 trading emissions system. Energy 278, 127660. doi:10.1016/j.energy.2023.127660
Diab, I., Damianakis, N., Chandra-Mouli, G. R., and Bauer, P. (2024). A shared PV system for transportation and residential loads to reduce curtailment and the need for storage systems. Appl. Energy 353, 122131. doi:10.1016/j.apenergy.2023.122131
Han, F., Zeng, J., Lin, J., and Gao, C. (2023b). Multi-stage distributionally robust optimization for hybrid energy storage in regional integrated energy system considering robustness and nonanticipativity. Energy 277, 127729. doi:10.1016/j.energy.2023.127729
Han, F., Zeng, J., Lin, J., Zhao, Y., and Gao, C. (2023a). A stochastic hierarchical optimization and revenue allocation approach for multi-regional integrated energy systems based on cooperative games. Appl. Energy 350, 121701. doi:10.1016/j.apenergy.2023.121701
Hand, B., Kelly, G., and Cashman, A. (2021). Aerodynamic design and performance parameters of a lift-type vertical axis wind turbine: a comprehensive review. Renew. Sustain. Energy Rev. 139, 110699. doi:10.1016/j.rser.2020.110699
Jiang, H., Wang, J., Wu, J., and Geng, W. (2017). Comparison of numerical methods and metaheuristic optimization algorithms for estimating parameters for wind energy potential assessment in low wind regions. Renew. Sustain. Energy Rev. 69, 1199–1217. doi:10.1016/j.rser.2016.11.241
Kumar, R., Raahemifar, K., and Fung, A. S. (2018). A critical review of vertical axis wind turbines for urban applications. Renew. Sustain. Energy Rev. 89, 281–291. doi:10.1016/j.rser.2018.03.033
Li, L., Wang, J., Zhong, X., Lin, J., Wu, N., Zhang, Z., et al. (2022). Combined multi-objective optimization and agent-based modeling for a 100% renewable island energy system considering power-to-gas technology and extreme weather conditions. Appl. Energy 308, 118376. doi:10.1016/j.apenergy.2021.118376
Li, P., Wang, Z., Wang, N., Yang, W., Li, M., Zhou, X., et al. (2021b). Stochastic robust optimal operation of community integrated energy system based on integrated demand response. Int. J. Electr. Power & Energy Syst. 128, 106735. doi:10.1016/j.ijepes.2020.106735
Li, X., Li, W., Zhang, R., Jiang, T., Chen, H., and Li, G. (2020). Collaborative scheduling and flexibility assessment of integrated electricity and district heating systems utilizing thermal inertia of district heating network and aggregated buildings. Appl. Energy 258, 114021. doi:10.1016/j.apenergy.2019.114021
Li, Y., Han, M., Yang, Z., and Li, G. (2021a). Coordinating flexible demand response and renewable uncertainties for scheduling of community integrated energy systems with an electric vehicle charging station: a Bi-level approach. IEEE Trans. Sustain. Energy 12, 2321–2331. doi:10.1109/TSTE.2021.3090463
Li, Z., Xu, Y., Wang, P., and Xiao, G. (2023). Coordinated preparation and recovery of a post-disaster Multi-energy distribution system considering thermal inertia and diverse uncertainties. Appl. Energy 336, 120736. doi:10.1016/j.apenergy.2023.120736
Liu, C., Wang, C., Yin, Y., Yang, P., and Jiang, H. (2022). Bi-level dispatch and control strategy based on model predictive control for community integrated energy system considering dynamic response performance. Appl. Energy 3, 118641. doi:10.1016/j.apenergy.2022.118641
Liu, J., Yang, H., and Zhou, Y. (2021). Peer-to-peer energy trading of net-zero energy communities with renewable energy systems integrating hydrogen vehicle storage. Appl. Energy 298, 117206. doi:10.1016/j.apenergy.2021.117206
Meesenburg, W., Ommen, T., and Elmegaard, B. (2018). Dynamic exergoeconomic analysis of a heat pump system used for ancillary services in an integrated energy system. Energy 152, 154–165. doi:10.1016/j.energy.2018.03.093
Mei, F., Zhang, J., Lu, J., Lu, J., Jiang, Y., Gu, J., et al. (2021). Stochastic optimal operation model for a distributed integrated energy system based on multiple-scenario simulations. Energy 219, 119629. doi:10.1016/j.energy.2020.119629
Petrovich, B., and Kubli, M. (2023). Energy communities for companies: executives’ preferences for local and renewable energy procurement. Renew. Sustain. Energy Rev. 184, 113506. doi:10.1016/j.rser.2023.113506
Pirouzi, S., Zaghian, M., Aghaei, J., Chabok, H., Abbasi, M., Norouzi, M., et al. (2022). Hybrid planning of distributed generation and distribution automation to improve reliability and operation indices. Int. J. Electr. Power & Energy Syst. 135, 107540. doi:10.1016/j.ijepes.2021.107540
Su, J., Chen, Y., Han, Z., Zhou, D., Bao, Y., and Zhao, Y. (2020). Investigation of V-shaped blade for the performance improvement of vertical axis wind turbines. Appl. Energy 260, 114326. doi:10.1016/j.apenergy.2019.114326
Tao, Y., Qiu, J., Lai, S., and Zhao, J. (2021). Integrated electricity and hydrogen energy sharing in coupled energy systems. IEEE Trans. Smart Grid 12, 1149–1162. doi:10.1109/TSG.2020.3023716
Ullah, T., Javed, A., Abdullah, A., Ali, M., and Uddin, E. (2020). Computational evaluation of an optimum leading-edge slat deflection angle for dynamic stall control in a novel urban-scale vertical axis wind turbine for low wind speed operation. Sustain. Energy Technol. Assessments 40, 100748. doi:10.1016/j.seta.2020.100748
Wang, J., Deng, H., and Qi, X. (2022a). Cost-based site and capacity optimization of multi-energy storage system in the regional integrated energy networks. Energy 261, 125240. doi:10.1016/j.energy.2022.125240
Wang, K., Liang, Y., Jia, R., Wu, X., Wang, X., and Dang, P. (2023). Two-stage stochastic optimal scheduling for multi-microgrid networks with natural gas blending with hydrogen and low carbon incentive under uncertain envinronments. J. Energy Storage 72, 108319. doi:10.1016/j.est.2023.108319
Wang, Y., Wang, X., Yu, H., Huang, Y., Dong, H., Qi, C., et al. (2019). Optimal design of integrated energy system considering economics, autonomy and carbon emissions. J. Clean. Prod. 225, 563–578. doi:10.1016/j.jclepro.2019.03.025
Wang, Y., Yang, Y., Fei, H., Song, M., and Jia, M. (2022b). Wasserstein and multivariate linear affine based distributionally robust optimization for CCHP-P2G scheduling considering multiple uncertainties. Appl. Energy 306, 118034. doi:10.1016/j.apenergy.2021.118034
Wang, Y., Yang, Y., Fei, H., Song, M., and Jia, M. (2022c). Wasserstein and multivariate linear affine based distributionally robust optimization for CCHP-P2G scheduling considering multiple uncertainties. Appl. Energy 306, 118034. doi:10.1016/j.apenergy.2021.118034
Yang, X., Chen, Z., Huang, X., Li, R., Xu, S., and Yang, C. (2021). Robust capacity optimization methods for integrated energy systems considering demand response and thermal comfort. Energy 221, 119727. doi:10.1016/j.energy.2020.119727
Zhang, H., Ding, T., Sun, Y., Huang, Y., He, Y., Huang, C., et al. (2023a). How does load-side re-electrification help carbon neutrality in energy systems: cost competitiveness analysis and life-cycle deduction. Renew. Sustain. Energy Rev. 187, 113745. doi:10.1016/j.rser.2023.113745
Zhang, J., Kong, X., Shen, J., and Sun, L. (2023b). Day-ahead optimal scheduling of a standalone solar-wind-gas based integrated energy system with and without considering thermal inertia and user comfort. J. Energy Storage 57, 106187. doi:10.1016/j.est.2022.106187
Zhang, W., Valencia, A., Gu, L., Zheng, Q. P., and Chang, N.-B. (2020). Integrating emerging and existing renewable energy technologies into a community-scale microgrid in an energy-water nexus for resilience improvement. Appl. Energy 279, 115716. doi:10.1016/j.apenergy.2020.115716
Zhu, G., Gao, Y., and Sun, H. (2023). Optimization scheduling of a wind–photovoltaic–gas–electric vehicles Community-Integrated Energy System considering uncertainty and carbon emissions reduction. Sustain. Energy, Grids Netw. 33, 100973. doi:10.1016/j.segan.2022.100973
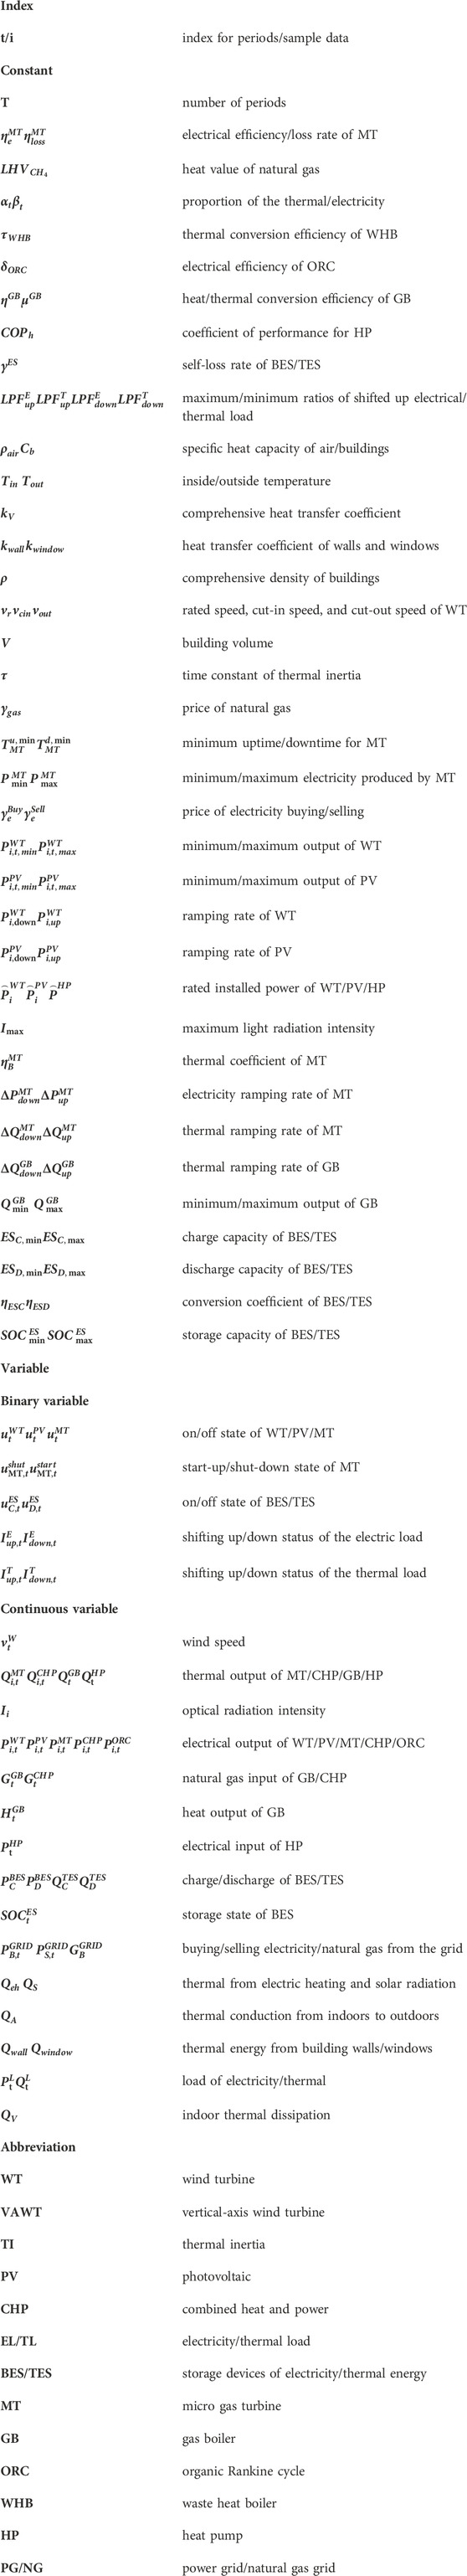
Nomenclature
Keywords: vertical-axis wind turbines, thermal inertia, oilfield management areas, uncertainty of wind and photovoltaic output, scheduling optimization
Citation: Wang X, Cui J, Ren B, Liu Y and Huang Y (2024) Integrated energy system scheduling optimization considering vertical-axis wind turbines and thermal inertia in oilfield management areas. Front. Energy Res. 12:1340580. doi: 10.3389/fenrg.2024.1340580
Received: 18 November 2023; Accepted: 22 January 2024;
Published: 08 February 2024.
Edited by:
Davide Astolfi, University of Perugia, ItalyCopyright © 2024 Wang, Cui, Ren, Liu and Huang. This is an open-access article distributed under the terms of the Creative Commons Attribution License (CC BY). The use, distribution or reproduction in other forums is permitted, provided the original author(s) and the copyright owner(s) are credited and that the original publication in this journal is cited, in accordance with accepted academic practice. No use, distribution or reproduction is permitted which does not comply with these terms.
*Correspondence: Xusheng Wang, 18066344682@163.com