Coordinated operation and optimal sizing strategy of P2G—CNG trucks scheme on wind farm for participating in retail gas market
 Athuman Salimu
 Feng Zhang
 Gang Zhang2
 - 1Key Laboratory of Power System Intelligent Dispatch and Control of Ministry of Education, School of Electrical Engineering, Shandong University, Jinan, China
- 2Yantai Research Institute, Harbin Engineering University, Heilongjiang, China
- 3Clean Energy Development Institute of State Grid Qinghai Electric Power Company, Qinghai, China
The increase in wind penetration and the stochastic nature of wind can cause some wind power to be curtailed, leading to a loss of revenue. Wind farm owners can invest in power to gas (P2G)—compressed natural gas (CNG) truck systems to utilize the curtailed wind power that would otherwise have been wasted. This paper proposes a coordinated operation and optimal sizing strategy of P2G and CNG trucks. P2G derives its power from curtailed wind power and also purchases electricity at low prices to facilitate methane (natural gas) production. The methane is directly stored in CNG trucks, which are used as temporary storage and as a means of transporting the gas, thereby reducing costs by eliminating storage tank. Firstly, a coordinated operation strategy for P2G and CNG trucks considering curtailed wind power and electricity purchased from the grid is presented. Secondly, an optimal sizing optimization model to determine the capacity of P2G and the number of CNG trucks using particle swarm optimization is presented, considering the coordinated operation strategy and operation constraints to maximize profit when the proposed system participates in the retail gas market. Finally, case studies were conducted to verify the viability of the proposed strategy using curtailed wind power data, electricity price data, and gas price data. Result show that optimal capacity of the P2G plant is 9.9 MW, and the optimal number of CNG trucks is 2. There is a 19.8% cost reduction with a payback period of 5.728 years compared to the conventional strategy with a payback period of 8.52 years. 89.74% of curtailed wind power is utilized, while only 10.26% of curtailed wind power is unutilized. Higher utilization of curtailed wind power that would otherwise have been wasted is achieved. The system earns a profit by selling the produced natural gas to a retail gas market.
1 Introduction
The penetration of renewable energy generation into the grid, especially wind power generation, continues to increase because it is low carbon, making it environmentally friendly. However, due to the intermittent nature of wind power (Zhang and Wan, 2014) and also during low-demand periods (Troncoso and Newborough, 2011), some wind power is curtailed to avoid grid instability. The curtailment of wind results in a loss of revenue and also lowers the financial incentives provided for investing in low carbon electricity (Troncoso and Newborough, 2011). P2G technology, which involves the conversion of electricity into gases such as hydrogen or methane (natural gas) (Liu et al., 2021), can accommodate curtailed wind power that would have otherwise been wasted. Therefore, integration of P2G into a wind farm to utilize curtailed wind power reduces or eliminates curtailed wind power while producing natural gas, which can be sold to earn profit. The production of natural gas involves the consumption of carbon dioxide, thus contributing to a reduction in global warming caused by carbon dioxide emissions (Thema et al., 2019; Liu et al., 2021).
The production of natural gas using P2G, with curtailed wind power as the main source of electricity supplied to operate P2G, requires effective coordinated operation, optimal sizing, and a proper method for transportation of the gas. Several researchers have presented strategies for P2G considering curtailed wind power. Reference (Diaz De Cerio Mendaza et al., 2016) presented optimal sizing and placement of P2G utilizing only curtailed wind power using particle swarm optimization. However, due to the intermittent nature of wind power, curtailed wind power alone may not always be sufficient to supply power to P2G. In instances of low or no curtailed wind power, three effects may occur: 1) low production of gas leading to reduced revenue, 2) longer nonoperational time, and 3) additional costs resulting from increased flushing of the electrolyzer due to more shutdown and startup events (Wulf and Zapp, 2018). In the study conducted by (Li et al., 2018; Mirzaei et al., 2019; Sawas and Farag, 2019; Zhang et al., 2022), curtailed wind power is utilized to supply P2G to facilitate the production of natural gas. The obtained natural gas is used by gas fired generators to generate electricity in the process called power to gas to power (P2G2P). However, the two-stage conversions, from power to gas and then gas to power, result in significant losses and, consequently, lower efficiency. The authors in (Simonis and Newborough, 2017) presented the operating and optimal sizing of P2G by proposing various capacities of P2G based on predicted curtailed renewable energy, particularly curtailed wind power at different locations. However, the strategy did not address transportation of the produced gas. To address the transportation of the produced natural gas, various methods exist, including pipeline transport in the form of compressed or liquefied gas, road transport in the form of compressed or liquefied gas, sea/ocean transport in the form of compressed or liquefied gas, and rail transport (Yang and Ogden, 2007; Nikolaou, 2010; Taheri et al., 2014; Demir and Dincer, 2018; Wulf and Zapp, 2018). The choice of method for deploying gas depends on several factors, such as costs of investment, geographical location, quantity of gas, and viability of the method. Pipeline delivery is economical for large quantities of gas over long distances (Yang and Ogden, 2007). Sea/ocean delivery depends on the geographical location. If gas production is distant from the port, it needs to be transported to the port using other means, thereby adding more costs and complexity. In the liquid delivery of gas, there is an additional cost due to liquefaction. In this paper, road transport using CNG trucks is chosen because it is economical for transporting low and medium quantities of gas over short distances (Yang and Ogden, 2007). This transportation of natural gas using CNG trucks has already been implemented in some areas and is sometimes referred to as a virtual pipeline (Virtual Pipeline - CNG - Galileo Technologies, 2024). The authors in (De Sa Neto et al., 2005) presented an integrated model consisting of a simulation model and an economic model for transporting gas using trucks by determining the optimal number of trucks and CNG trailers for a specific number of natural gas vehicular stations. The natural gas is transported to the destination points, such as underground storage (Mokhatab and Poe, 2012) or fueling station reservoirs (Farzaneh-Gord et al., 2013; Deymi-Dashtebayaz et al., 2014). The storage reservoir pressure and temperature are important parameters and should be taken into consideration for optimal operation of the storage system (Farzaneh-Gord et al., 2013; Deymi-Dashtebayaz et al., 2014).
Overall, the research outlined above considers storage tanks, which contribute to the overall costs of investment, operation, and maintenance for the system. In the case of small and medium systems, these costs can be eliminated by storing the gas directly in the CNG trucks and transporting the gas to the nearby gas network, storage, or customers. Additionally, some of the presented strategies do not address the transportation of the produced gas and rely solely on curtailed wind to power the system. Therefore, there is a need to cover the entire cycle, including the coordinated operation to produce the gas using combined curtailed wind power and purchased electricity, optimal sizing of the whole system, and transportation of the gas.
In this regard, a coordinated operation and optimal sizing strategy of P2G-CNG truck system, which eliminates the use of gas storage tanks for participating in the retail gas market through natural gas produced, are proposed. The main power source for the system is curtailed wind power, supplemented by electricity purchased from the grid. The system purchases electricity only when curtailed wind power falls below the maximum value required for P2G operation, and the grid electricity price is low enough to ensure profitability. The natural gas produced is stored directly in CNG trucks and transported directly to customers or a nearby natural gas market or gas storage. Storing the produced gas directly into CNG trucks before transporting it implies that the CNG trucks serve as temporary storage and transportation, eliminating the need for a storage tank and reducing system costs. Therefore, the proposed strategy provides a solution to use curtailed wind power, allowing wind farm owners to gain revenue that would have been wasted. It also provides a framework for the whole chain, from the availability of power to operate the system to the selling point of the natural gas, by addressing the coordinated operation and optimal sizing. In achieving this, the main contributions of this paper can be summarized as follows:
1) Coordinated operation of P2G and CNG trucks is proposed, where the CNG trucks serve as a means of temporary storage and transportation of the natural gas. This coordinated operation takes into consideration both curtailed wind power and purchased electricity at low prices. The system purchases electricity under two conditions: when curtailed wind power is insufficient to operate P2G at its maximum power, and when the electricity price is low enough for the system to make a profit.
2) Optimal sizing of P2G and number of CNG trucks is proposed to determine the optimal capacity of each component, considering a combination of curtailed wind power and purchasing electricity at low prices for participation in the retail natural gas market.
3) An algorithm is proposed for establishing the maximum electricity price at which, and below which, the system earns profit when purchasing electricity. The electricity price is set considering the investment costs and operation and maintenance costs.
4) Implementing the benefit-cost model through maximization of profit to verify that the system can earn a benefit by participating in the retail natural gas market by selling the natural gas produced. Additionally, the corresponding economic parameters at the optimal capacities, such as costs, payback period etc., are also determined.
It should be noted that the produced methane gas is a natural gas, and therefore the words methane and natural gas will be used interchangeably to imply methane gas.
The rest of this paper is organized as follows: Section 2 describes the coordinated operation strategy of P2G and CNG trucks considering curtailed wind power and purchased electricity from the grid; Section 3 presents the optimal sizing of P2G and CNG trucks for participating in the retail natural gas market and economic parameters by maximization of profit through the cost-benefit model; Section 4 covers the case studies to validate the proposed strategy; and Section 5 concludes the paper.
2 Coordinated operation strategy
In this paper, coordinated operation means the synchronized operation of P2G and CNG trucks, considering curtailed wind power and purchased electricity and their corresponding constraints to ensure the optimal operation of each component and the entire system, as shown in Figure 1. Power generated by the wind farm is normally fed to the main grid. However, some wind power is curtailed, and this curtailed wind power is the main source of power for P2G. To avoid dependence of the system on curtailed wind power only and to increase profit, availability, and usage of P2G, electricity is purchased from the grid when the price is low for the system to earn profit. The coordinated operation considers curtailed wind power available, purchased electricity, electricity prices, P2G, and CNG trucks. The natural gas produced by P2G is compressed and loaded directly into the CNG trucks for temporary storage and transportation before being sold to the retail natural gas market in real time. Temporary storage means the natural gas is directly loaded in the truck in real time after production, and when the truck is fully loaded, it transports the natural gas to the destination point. When one truck transports the gas, another truck takes over and starts loading the gas in real time before transporting it to the destination point. The retail gas market is chosen because it can be sold at a higher price since the gas is directly transported to the customers and the transportation costs have been covered by the wind farm owner. The detailed coordinated operation strategy of P2G is presented in Section 2.1, while that of CNG trucks is outlined in Section 2.2.
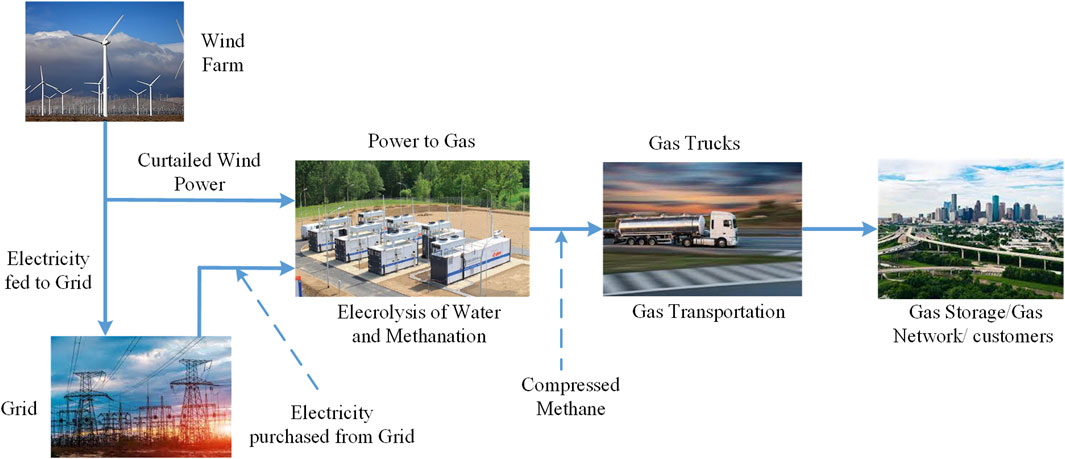
FIGURE 1. Diagram for the proposed strategy.
2.1 Power to gas operation strategy
P2G facilitates the production of methane, which is a renewable natural gas. First, electrolysis of water is conducted by decomposing water to produce hydrogen gas, as expressed by (1).
The produced hydrogen is further processed by reacting it with carbon dioxide to produce methane in a process called the Sabatier reaction, as expressed by (2).
The produced methane is loaded directly into CNG trucks for storage and transportation in real time. The real time, t, quantity of natural gas produced depends mainly on the efficiency of the electrolyzer used and is expressed by (3)
Where
Coordinated operation of P2G and wind farm to produce natural gas plays a crucial role in minimizing the curtailment of wind power and enabling integration between the electricity network and the gas network. One of the conditions for the system to earn a higher profit is to operate at maximum power as it increases natural gas production. Since curtailed wind power varies, there may be occasions when it is insufficient to operate P2G at maximum power, and in such cases, the system purchases electricity. Electricity is purchased only when the price is low enough for it to make a profit. In this scenario, P2G is supplied with both power from curtailed wind and power purchased from the grid. Since curtailed wind is free, the system prioritizes its utilization before purchasing electricity. The electricity supplied to operate P2G can be categorized as follows:
2.1.1 Insufficient curtailed wind power to operate P2G
This scenario occurs when curtailed wind power is below the minimum power required for P2G to operate. i.e.,
Where
From (4), when the price of electricity is low enough for the system to earn a profit, P2G is operated with a combination of curtailed wind power and purchased electricity from the grid. If curtailed wind power is below the minimum P2G operating power and the electricity price is above the maximum price for the system to earn a profit, then the system is shut down.
Eq. 4 is subject to another constraint expressed by (5)
Where
Inequality (5) implies that the sum of curtailed wind power and purchased electricity should not exceed the maximum operating power limit of P2G.
2.1.2 Sufficient curtailed wind power to operate the P2G
This scenario occurs when curtailed wind power is equal to or above the minimum P2G operating power but is below the maximum P2G operating power. i.e.,
From (6), the system operates under two conditions: it purchases electricity for P2G to operate at maximum power if the price is below the maximum price for the system to earn a profit, or it operates by following the values of curtailed wind power if the electricity price is above the maximum price for the system to earn a profit. Eq. (6) is also subject to the constraint presented in (5).
2.1.3 Curtailed wind power is equal to or greater than the P2G maximum operating power
This scenario is the most favorable for the system as the wind farm owner does not incur any extra costs to purchase electricity since curtailed wind power is enough to operate P2G at maximum power. i.e.,
When curtailed wind power exceeds the P2G upper power limit, the excess curtailed wind power beyond the upper power limit is not accommodated by P2G and is therefore wasted.
2.2 Compressed natural gas trucks operation strategy
Normally, CNG trucks are used for transporting the produced methane. However, in this paper, the CNG trucks not only transport the natural gas but also store the natural gas in real time before transportation. i.e., when the natural gas is produced, it is stored directly in a CNG truck, and when a CNG truck is full, the natural gas is transported to the destination point, and another CNG truck continues to load the produced natural gas. Transporting the natural gas using CNG trucks offers several advantages, such as the natural gas can be delivered easily to remote areas that are not connected to the gas network because of their terrain or that are located far from the gas pipelines; it can serve as a backup solution in case of a gas network outage; and it can reduce gas congestion in the gas network. The quantity of methane stored in real time is expressed by (8)
Where
Since the natural gas is directly stored in the CNG trucks, the operational strategy assumes that a CNG truck can go to offload the natural gas and quickly return before other CNG trucks are fully loaded. Therefore, loading time, transportation time, and unloading time do not affect the operating strategy. Storing the natural gas directly in the CNG trucks implies the CNG trucks serve as temporary storage and transportation means, resulting in a cost reduction because there is no need for any extra gas storage devices at the production site.
3 Optimal sizing of P2G and compressed natural gas trucks for participating in retail natural gas market
The proposed optimal sizing strategy to determine the optimal capacity of P2G and the number of CNG trucks when the system participates in the retail natural gas market is presented in this section. Optimal sizing ensures effective operation of the system and proper utilization of each device, therefore, it is crucial to optimize the system for technical and economic benefits. If the system is not optimized, it may result in components of the system having smaller sizes (undersizing) or larger sizes (oversizing). Smaller size of P2G implies low natural gas production as a consequence low utilization of curtailed wind power resulting in low profit, while a smaller number of CNG trucks may cause all the produced gas not to be stored and transported to the destination point. Conversely, a larger size of P2G implies an unutilized capacity of P2G, leading to an increased unnecessary cost, while a larger number of CNG trucks implies that some trucks may not be used, also leading to an increased unnecessary cost. Generally, operating the system at a smaller size than the optimal size leads to lower production of natural gas, resulting in lower profit, while operating the system at a larger size than the optimal size results in unnecessary costs, which lowers the net profit. Therefore, optimal sizing is needed for both technical and economic viability of the system and to avoid the effects caused by oversizing and undersizing of the components. The objective function is formulated to maximize the profit earned when the system operates by considering the benefits and costs. The benefit is derived from revenue obtained from the system’s participation in the retail natural gas market by selling the produced natural gas, while the costs include investment costs and operation and maintenance costs.
3.1 Objective function
The objective function to maximize profit is mathematically formulated by (9)
Where
3.1.1 Revenue
The main income of the system is through participation in the retail gas market by selling the produced methane, as expressed by (10).
Where
3.1.2 Costs
The annual total costs, which include the costs of P2G and CNG trucks, are divided into investment costs and operation and maintenance costs. The cost of purchasing electricity is also considered when the system purchases electricity from the grid. The annual total costs are expressed by (11)
Where
3.1.2.1 P2G costs
P2G costs are expressed by (12)
Where
3.1.2.2 Compressed natural truck costs
Total costs of CNG trucks, including investment costs and operation and maintenance costs, are expressed by (14) and (15)
Where
If we assume that the same type of CNG trucks are used, then
The modified sentence is as follows: Operation and maintenance costs depend on the distance the CNG truck traveled and are expressed by (16)
Where
Where
The unit operation and maintenance costs consist of wages, fuel costs, equipment and maintenance.
3.1.2.3 Costs of purchasing electricity
The system may purchase electricity when the price is low enough to earn a profit and the curtailed wind power is below the maximum operating power of P2G. The cost of purchasing electricity is expressed by (18).
Where
3.2 Constraints
The objective function (Eq. (9)) is subject to the constraints expressed in (19)—(22).
Where
3.3 Solution of the objective function
The proposed strategy is implemented in the MATLAB software. The objective function, considering the constraints, is solved using particle swarm optimization (PSO) to obtain the optimal capacity of P2G, the optimal number of trucks, and their corresponding economic parameters. PSO is a metaheuristic algorithm and is useful for solving optimization problems, especially in continuous search spaces. PSO has several advantages: it is easy to implement due to its simplicity, it can optimize both single and multi-objective problems, it is suitable for both continuous and discrete search spaces, it is not necessary for the problem to be solved to be differentiable, and it can handle both linear and non-linear functions. The maximum electricity price, below which the system makes a profit, is determined according to the flowchart in Figure 3. Subsequently, the coordinated operation and optimal sizing strategy are implemented according to the flowchart in Figure 2.
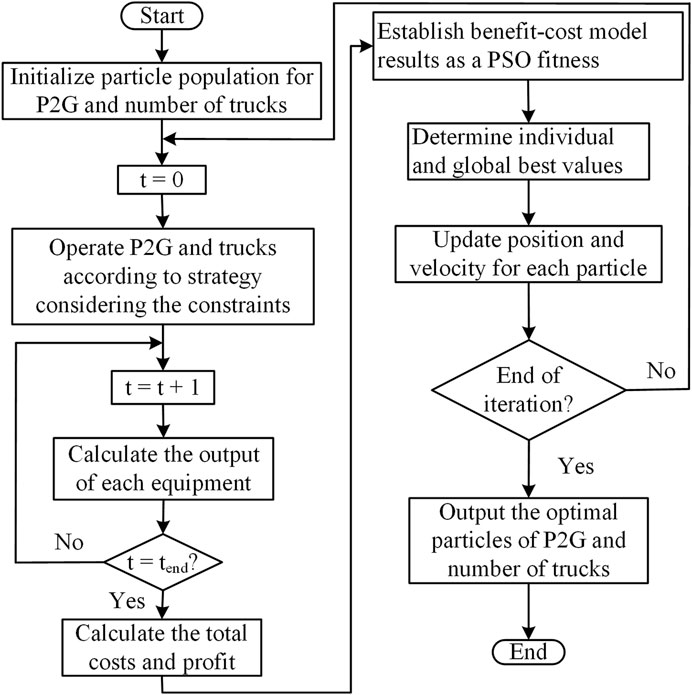
FIGURE 2. Flowchart of the proposed operating and sizing strategy.
3.4 Determination of the maximum electricity price at which the system makes a profit
Combining electricity from curtailed wind power with electricity purchased from the grid enables the system to operate at higher power levels, thereby increasing revenue, availability, and reliability of the system. Since the cost of purchasing electricity depends on the electricity price, a decrease in price leads to an increase in the system’s profit, and vice versa. Therefore, the maximum electricity price above which the system cannot earn profit needs to be determined. At that price and any price below it, the system can purchase electricity from the grid and earn a profit. The prices of electricity assume that the system earns a profit by selling natural gas after considering the costs of purchasing electricity, investment costs, operational costs, and maintenance costs. The algorithm to determine the maximum electricity price for the system to make a profit is presented in the flowchart in Figure 3.
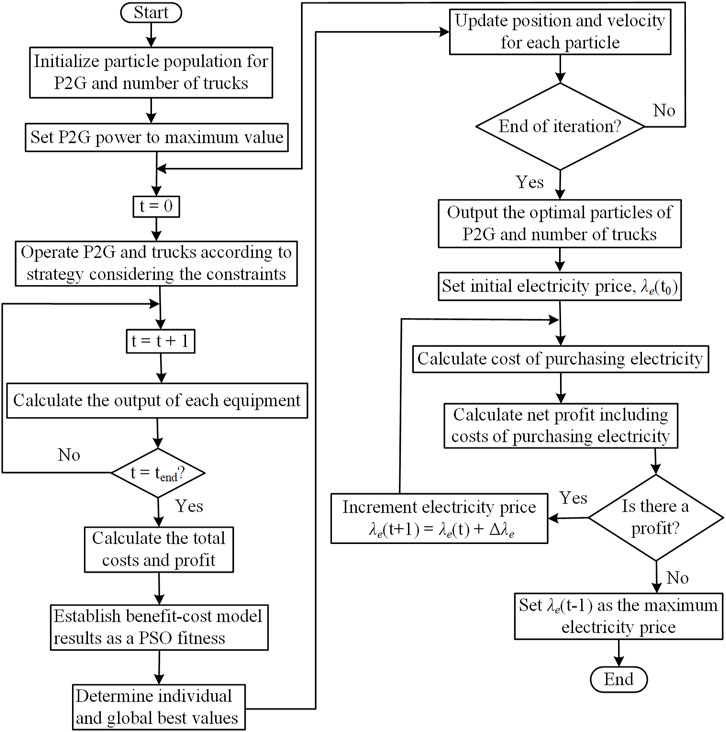
FIGURE 3. Flowchart for determining the maximum electricity price for the system to make a profit.
The algorithm assumes that all electricity used to operate the system is purchased from the grid. The flowchart in Figure 3 can be briefly explained as follows:
1) Set the operating P2G power to its maximum value. The operating P2G power is set to its maximum value because this is the maximum amount of electricity that the system can purchase.
2) Operate the system, considering constraints, and obtain the corresponding outputs.
3) Calculate the revenue and establish an objective function, excluding the cost of purchasing electricity.
4) Implement PSO to find the solution for the objective function. The solution includes parameters such as net profit, optimal capacity of P2G, number of CNG trucks, investment costs, and operation and maintenance costs. It should be noted that the net profit until this stage does not include the costs of purchasing electricity.
5) Set the initial electricity price and calculate the costs of purchasing electricity.
6) Calculate the net profit, including the costs of purchasing electricity, according to (23)
Where
7) Check whether the system earns a profit or not. If it incurs a loss, then the electricity price set just before is the maximum electricity price for the system to earn a profit. If the system earns a profit, increment the electricity price, recalculate the cost of purchasing electricity, and recalculate the corresponding net profit as presented in step 6 above. Iterate until the system incurs a loss, and set the electricity price just before the loss as the maximum electricity price for the system to earn a profit.
4 Case studies
Case studies are presented to validate the proposed strategy, i.e., the coordinated operation strategy of curtailed wind power, purchased electricity, P2G, and CNG trucks, along with the optimal sizing of P2G and the number of CNG trucks. Two cases have been considered to realize the strategy and verify the economic benefits of the proposed strategy.
Case 1: This case is used as a base case for comparison and includes a natural gas storage tank.
Case 2: This case is the proposed strategy, which eliminates the use of natural gas storage tank by storing the produced gas directly in CNG trucks and transporting it to the destination point. The P2G plant is assumed to be located near the wind farm; therefore, transmission losses are neglected.
4.1 Data
Input data includes curtailed wind power and electricity prices. The curtailed wind power data from Southwest Power Pool (SPP) is used for analysis of the strategy and is available at an interval of 5 minutes (Southwest Power Pool, 2022). The locational marginal prices of electricity used in this paper are also obtained from the Southwest Power Pool (SPP) at Caney River Wind Power in Kansas (Southwest Power Pool, 2023). The transportation distance was taken as 10 km. The parameters used in this paper are presented in Table 1.
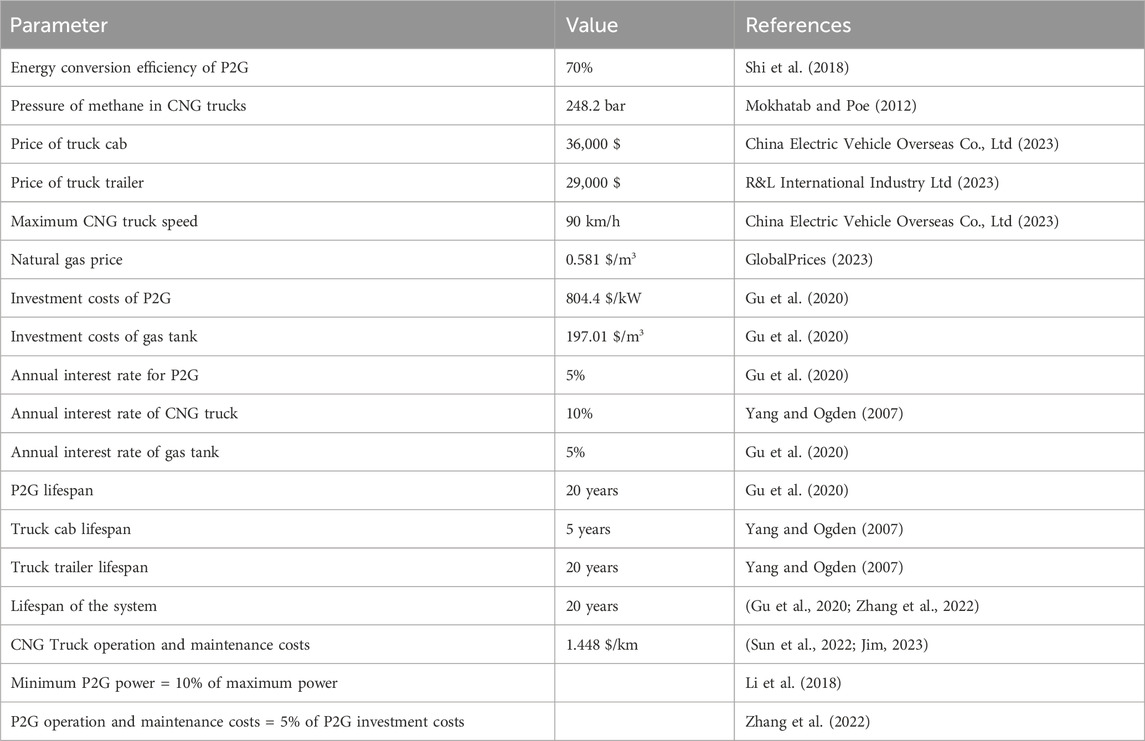
TABLE 1. Coordinated operation and optimal sizing parameters used for the strategy.
4.2 Results and discussions
As this paper proposes coordinated operation and optimal sizing, the results are divided into two parts. 1) Coordinated operation results 2) Optimal sizing results.
4.2.1 Coordinated operation results
Results for the coordinated operation strategy, as proposed in Section 2, are presented in this section. In terms of operation, cases 1 and 2 are similar except that case 1 includes a natural gas storage tank, while case 2, which is the proposed strategy, does not include a natural gas storage tank. Therefore, all the proposed coordinated operation results (case 2) are presented, while for case 1, only result for natural gas stored in the gas tank is presented. For that reason, Figure 6, Figure 7, Figure 8, and Figure 9 show results for the coordinated operation strategy for case 2, and their corresponding results for case 1 are not presented.
The original curtailed wind power data is scaled down to obtain the data shown in Figure 4, as the scope of this paper is focused on low and medium systems.
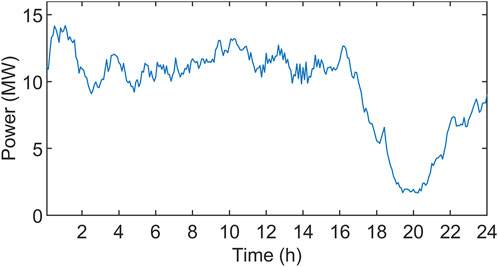
FIGURE 4. Scaled curtailed wind power.
Figure 5 shows the locational marginal prices of electricity. As can be seen, electricity prices vary over time. Based on this data set, the maximum electricity price at which, and below which, the proposed strategy makes a profit when it purchases electricity is established.
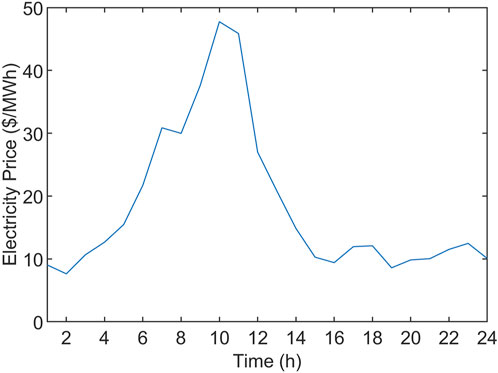
FIGURE 5. Locational marginal electricity prices.
Power supplied to P2G in real time is shown in Figure 6. It can be clearly seen that the power supplied came mainly from curtailed wind power. During the periods 02:15–03:05, 14:10–14:20, and 17:00–24:00, the system purchased electricity from the grid since curtailed power was insufficient to operate P2G at its maximum power and also because electricity prices were low enough for the system to make a profit. During the periods 04:25–05:15, 13:20–13:30, and 13:50–14:00, curtailed wind power was insufficient to operate P2G at its maximum power. However, the system did not purchase electricity since the electricity prices were high in such a way that the system could not make a profit. Actually, 85.9% of the power supplied to P2G came from curtailed wind power, while 14.1% of the power supplied to P2G was purchased from the grid. Therefore, with the addition of power purchased from the grid, the power supplied to P2G is higher, resulting in P2G operating at nearly its maximum power for all periods, hence increasing the profit of the system.
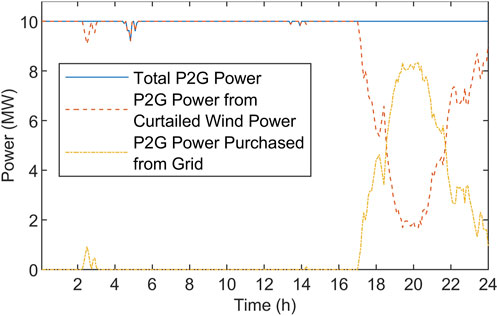
FIGURE 6. Power supplied to P2G.
Figure 7 illustrates natural gas produced after the Sabatier reaction in real time. Natural gas production is dependent on the amount of electricity supplied. Higher power supplied results in higher natural gas production. Therefore, the amount of natural gas produced due to electricity from curtailed wind was higher than that from purchased electricity. This is due to the fact that curtailed wind power contributed more electricity than electricity purchased from the grid.
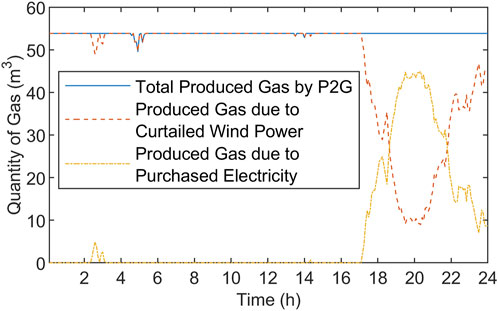
FIGURE 7. Produced natural gas by P2G.
Unutilized curtailed wind power is shown in Figure 8. Out of total curtailed wind power, P2G consumed 89.74% of curtailed wind power, and 10.26% was unutilized because of the operating constraints of P2G. The unutilized curtailed wind power is a consequence of the P2G operating within its minimum and maximum power limits. Therefore, any power exceeding the P2G’s maximum power is wasted, and any power below its minimum power is also wasted unless it is supplemented by purchased electricity from the grid to raise the power level equal to or above its minimum allowable operating power. The unutilized curtailed wind power was small (10.26%), demonstrating that P2G consumed large proportions of curtailed wind power.
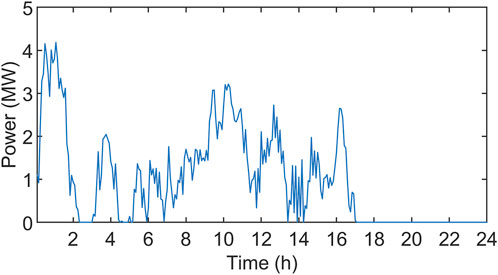
FIGURE 8. Unutilized curtailed wind power.
Figure 9 shows the quantity of compressed natural gas stored in the CNG trucks in real time. The total stored gas in the tank is the sum of the gas produced from curtailed wind power and the gas produced from purchased electricity. The greater production of natural gas from curtailed wind power is a result of the higher amount of curtailed wind power compared to purchased electricity. This complies with the aim of the strategy, which is to utilize curtailed wind power that would have otherwise been wasted.
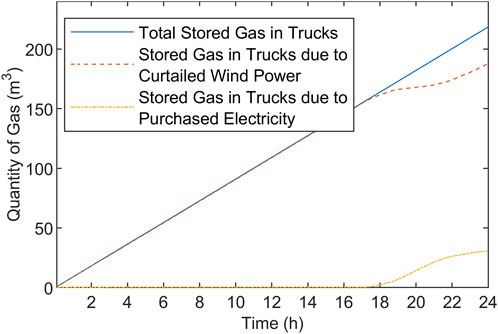
FIGURE 9. Quantity of natural gas stored in CNG trucks.
Figure 10 shows the stored gas in the tank for case 1. It is clearly seen that the quantity of natural gas produced due to curtailed wind power is greater than the quantity of natural gas produced due to purchased electricity.
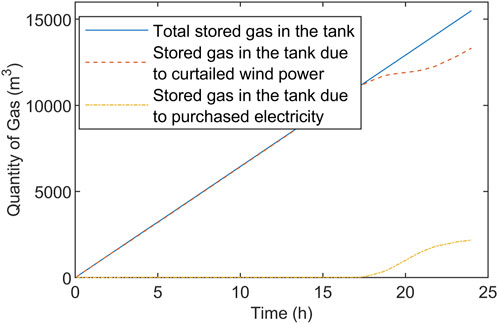
FIGURE 10. Quantity of natural gas stored in tank.
4.2.2 Optimal sizing results
This section presents the optimal sizing results for the optimal capacity of each device and their corresponding economic parameters obtained after implementing the coordinated operation and optimal sizing strategy. The implementation is summarized in flowcharts in Figure 2 and Figure 3. In the benchmark case 1, the flowcharts in Figure 1 and Figure 2 are modified to include a natural gas storage tank in the strategy. The optimal capacity of P2G is 9.9 MW, the optimal capacity of the natural gas storage tank is 1.549 × 10⁴ m3 and the optimal number of CNG trucks is 2. The total investment costs of P2G, natural gas storage tank, and CNG trucks for the full life span (20 years) of the system are 1.276×10⁷ $, 4.666×10⁶ $, and 5.160×10⁵ $, respectively. The daily operation and maintenance costs of P2G, natural gas storage tank, and CNG trucks are 87.41 $, 19.17 $ and 3.164×10² $, respectively, the daily cost of purchasing electricity is 3.505×10² $, the daily revenue for selling natural gas due to curtailed wind power is 7.736×10³ $ and the daily revenue for selling natural gas due to curtailed wind power is 1.266×10³ $. The higher revenue from the sale of natural gas produced from curtailed wind power is attributed to the fact that curtailed wind power contributes a higher share (85.9%) of electricity for natural gas production compared to electricity purchased from the grid. The higher utilization of curtailed wind power, that would have otherwise been wasted, results in an increase in the revenue of wind farm owners. Other optimal sizing and economic results for the total lifespan of the system for case 1 and case 2 are shown in Table 2.
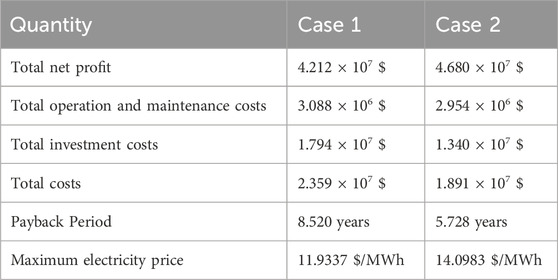
TABLE 2. Optimal sizing and economic results.
From Table 2, in both cases, the system earns a positive net profit when participating in the retail natural gas market. However, case 2 has a higher net profit than case 1, which verifies the feasibility of the proposed strategy. Case 2 has lower costs than case 1 due to the elimination of natural gas storage tank, and the cost reduction is 19.8%. This is proof that the proposed strategy significantly reduces costs. The payback period of case 2 is shorter than that of case 1 due to the lower costs and higher revenue of case 1, proving the effectiveness of the proposed strategy. In the future, the payback periods will decrease because there is a trend towards decreasing investment costs in P2G. Case 2 has a higher limit on the maximum electricity price for the system to purchase electricity and make a profit than case 1. This implies that the strategy in case 2 can purchase electricity even when the price is higher and earn a higher profit than case 1.
The effect of variations in natural gas prices on net profits is shown in Figure 11. The values of natural gas prices are given per unit of the retail natural gas price (0.581 $/m3). It is evident that as the natural gas price decreases, the net profit also decreases, and vice versa. For a given natural gas price, case 2 has a higher net profit than that of case 1 due to decreased costs in case 2 caused by the elimination of gas storage tank at the production site. The threshold natural gas price for the system to make a net profit in case 1 is (0.359 p.u = 0.209 $/m3), and in case 2, it is (0.288 p.u = 0.167 $/m3). The lower threshold natural gas price for case 2 compared to case 1 implies that the proposed strategy (case 2) can sell the produced natural gas at a lower price and still earn a profit compared to case 1.
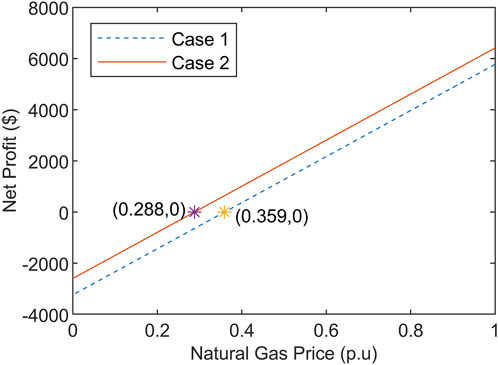
FIGURE 11. Net profits with variations in retail natural gas prices.
Further analysis is conducted to assess the impact of variations in transportation distances on the net profits, as shown in Figure 12. As transportation distance increases, the net profit decreases, and vice versa. This trend is caused by the fact that as the transportation distance increases, the costs of transportation also increase, resulting in a decrease in net profits. When comparing case 1 and case 2, it is observed that for a given transportation distance, the net profit in case 2 is higher than in case 1 due to the lower costs associated with case 2. Additionally, case 2 has a longer transportation threshold distance (212.62 km) for the system to earn a profit compared to case 1 (192.38 km). This implies that in case 2, CNG trucks can transport natural gas over a longer distance and still earn a higher profit compared to case 1.
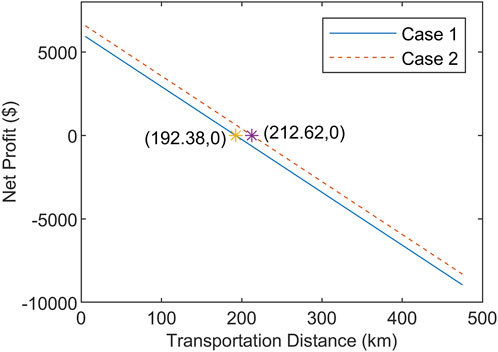
FIGURE 12. Net profits with variations in transportation distances.
Figure 13 shows payback periods with variations in transportation distances. It is clearly seen from the figure that payback periods are small at low transportation distances. However, at higher transportation distances, the payback periods increased significantly. Therefore, when making investment decisions, it is crucial to carefully select the transportation distance to ensure a shorter payback period. Furthermore, for a given payback period (e.g., equal to the lifespan of the system), Case 1 has a lower transportation distance (114.39 km) than Case 2 (154.46 km). This is another way to demonstrate the effectiveness of the proposed strategy.
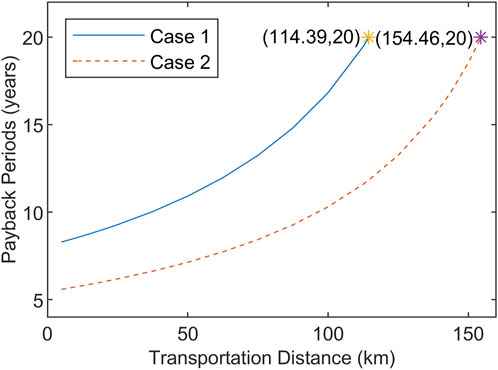
FIGURE 13. Payback periods with variation in transportation distances.
5 Conclusion
P2G plays a significant role in accommodating surplus renewable energy, particularly curtailed wind power, that would have otherwise been wasted. With proper coordinated operation and an optimal sizing strategy for the system consisting of P2G and CNG trucks, considering curtailed wind power and purchasing electricity, techno-economic benefits can be realized. This paper presented coordinated operation and optimal sizing strategy of P2G and CNG trucks. The coordinated operation strategy considered the entire chain, i.e., availability of power (power from curtailed wind and power purchased from the grid), storage, transportation of the natural gas, and selling the natural gas. The P2G was mainly supplied by electricity from curtailed wind power, with a small proportion of electricity purchased from the grid to facilitate the production of natural gas. The natural gas produced by P2G was stored directly in CNG trucks, eliminating the need for storage tanks. By eliminating the storage tanks, the system reduced costs and, hence, increased the profit earned by the wind farm owner. Optimal sizing was implemented through a cost-benefit model for maximizing profit, determining the optimal capacity of P2G, the optimal number of CNG trucks, and other economical parameters. Results verified that the proposed coordinated operation and the optimal sizing of P2G and CNG trucks led the wind farm owner to earn a profit by investing in the P2G and CNG trucks and also achieved proper utilization of curtailed wind power, that would have otherwise been wasted. The proposed strategy can be extended to cover the chain for large gas systems, where the gas is transported over long distances, by considering gas transportation methods, e.g., hybrid transportation of the gas such as pipelines and CNG trucks. Additionally, the strategy can also be extended to include the model of the destination point, such as fueling stations and underground storages.
Author contributions
AS: Conceptualization, Data curation, Formal Analysis, Methodology, Software, Writing–original draft, Validation. FZ: Data curation, Project administration, Resources, Supervision, Validation, Writing–review and editing. GZ: Investigation, Validation, Visualization, Writing–review and editing. LY: Investigation, Validation, Writing–review and editing.
Funding
This work is supported by the National Natural Science Foundation of China (No. 72271143) and the Natural Science Foundation of Shandong Province (No. ZR2021ME102).
Conflict of interest
Author LY was employed by Clean Energy Development Institute of State Grid Qinghai Electric Power Company.
The remaining authors declare that the research was conducted in the absence of any commercial or financial relationships that could be construed as a potential conflict of interest.
The author(s) declared that they were an editorial board member of Frontiers, at the time of submission. This had no impact on the peer review process and the final decision.
Publisher’s note
All claims expressed in this article are solely those of the authors and do not necessarily represent those of their affiliated organizations, or those of the publisher, the editors and the reviewers. Any product that may be evaluated in this article, or claim that may be made by its manufacturer, is not guaranteed or endorsed by the publisher.
References
China Electric Vehicle Overseas Co, Ltd (2023). China-Sinotruk-Cargo-Heavy-Duty-HOWO-Tow-6X4-Trailer-Head-Tractor-Truck. Available at: https://cevoelectriccar.en.made-in-china.com/product/qQYptEgvueka/China-Sinotruk-Cargo-Heavy-Duty-HOWO-Tow-6X4-Trailer-Head-Tractor-Truck.html (Accessed May 13, 2023).
Demir, M. E., and Dincer, I. (2018). Cost assessment and evaluation of various hydrogen delivery scenarios. Int. J. Hydrogen Energy 43, 10420–10430. doi:10.1016/j.ijhydene.2017.08.002
De Sa Neto, A., Filho, V. J. M. F., Moulin, R. G., and Fiuza, C. (2005). Development of an optimization/economic model for virtual gas pipelines. SPE Lat. Am. Caribb. Pet. Eng. Conf. Proc. doi:10.2118/94840-ms
Deymi-Dashtebayaz, M., Farzaneh-Gord, M., and Rahbari, H. R. (2014). Simultaneous thermodynamic simulation of CNG filling process. Pol. J. Chem. Technol. 16, 7–14. doi:10.2478/pjct-2014-0002
Diaz De Cerio Mendaza, I., Bhattarai, B. P., Kouzelis, K., Pillai, J. R., Bak-Jensen, B., and Jensen, A. (2016). “Optimal sizing and placement of power-to-gas systems in future active distribution networks,” in Proc. 2015 IEEE Innov. Smart Grid Technol. - Asia, ISGT ASIA, Bangkok, Thailand, 3-6 November 2015. doi:10.1109/ISGT-ASIA.2015.7387053
Farzaneh-Gord, M., Deymi-Dashtebayaz, M., and Rahbari, H. R. (2013). Effects of gas types and models on optimized gas fuelling station reservoir’s pressure. Braz. J. Chem. Eng. 30, 399–411. doi:10.1590/S0104-66322013000200017
GlobalPrices (2023). Natural-gas-prices. Available at: https://globalprices.net/usa/natural-gas-prices (Accessed March 9, 2023).
Gu, J., Mei, F., Lu, J., Lu, J., and Yang, B. (2020). “Energy storage planning and economic dispatch of microgrid considering power to gas,” in Asia-Pacific Power Energy Eng. Conf. APPEEC, Nanjing, China, 20-23 September 2020. doi:10.1109/APPEEC48164.2020.9220651
Jim, E. (2023). Paragon. Available at: https://www.paragonrouting.com/en-us/blog/post/want-optimize-your-fleet-know-your-average-trucking-cost-mile/(Accessed April 10, 2023).
Li, Y., Liu, W., Shahidehpour, M., Wen, F., Wang, K., and Huang, Y. (2018). Optimal operation strategy for integrated natural gas generating unit and power-to-gas conversion facilities. IEEE Trans. Sustain. Energy 9, 1870–1879. doi:10.1109/TSTE.2018.2818133
Liu, J., Sun, W., and Yan, J. (2021). Effect of p2g on flexibility in integrated power-natural gas-heating energy systems with gas storage. Energies 14, 196. doi:10.3390/en14010196
Mirzaei, M. A., Sadeghi Yazdankhah, A., and Mohammadi-Ivatloo, B. (2019). Stochastic security-constrained operation of wind and hydrogen energy storage systems integrated with price-based demand response. Int. J. Hydrogen Energy 44, 14217–14227. doi:10.1016/j.ijhydene.2018.12.054
Mokhatab, S., and Poe, W. A. (2012). Handbook of natural gas transmission and processing. Texas, United States: Gulf professional publishing.
Nikolaou, M. (2010). Optimizing the logistics of compressed natural gas transportation by marine vessels. J. Nat. Gas. Sci. Eng. 2, 1–20. doi:10.1016/j.jngse.2010.02.001
R&L International Industry Ltd (2023). China-52000L-Tri-Axle-LNG-LPG-CNG-Fuel-Tanker-Truck-Semi-Trailer. Available at: https://sinotruckexport.en.made-in-china.com/product/UjHJZNrClWch/China-52000L-Tri-Axle-LNG-LPG-CNG-Fuel-Tanker-Truck-Semi-Trailer.html (Accessed May 13, 2023).
Sawas, A., and Farag, H. E. Z. (2019). “Optimal sizing of power-to-gas units toward elevated renewable power penetration,” in 2019 IEEE Can. Conf. Electr. Comput. Eng. CCECE, Edmonton, AB, Canada, May 5-8, 2019, 8–11. doi:10.1109/CCECE.2019.8861741
Shi, Y., Xu, B., Wang, D., and Zhang, B. (2018). Using battery storage for peak shaving and frequency regulation: joint optimization for superlinear gains. IEEE Trans. Power Syst. 33, 2882–2894. doi:10.1109/TPWRS.2017.2749512
Simonis, B., and Newborough, M. (2017). Sizing and operating power-to-gas systems to absorb excess renewable electricity. Int. J. Hydrogen Energy 42, 21635–21647. doi:10.1016/j.ijhydene.2017.07.121
Southwest Power Pool (2022). Southwest power Pool. Available at: https://portal.spp.org/pages/ver-curtailments#%2F2021 (Accessed October 19, 2022).
Southwest Power Pool (2023). Southwest power Pool. Available at: https://portal.spp.org/pages/da-lmp-by-location#%2F2022%2F11 (Accessed April 20, 2023).
Sun, K., Li, K. J., Zhang, Z., Liang, Y., Liu, Z., and Lee, W. J. (2022). An integration scheme of renewable energies, hydrogen plant, and logistics center in the suburban power grid. IEEE Trans. Ind. Appl. 58, 2771–2779. doi:10.1109/TIA.2021.3111842
Taheri, Z., Shabani, M. R., Nazari, K., and Mehdizaheh, A. (2014). Natural gas transportation and storage by hydrate technology: Iran case study. J. Nat. Gas. Sci. Eng. 21, 846–849. doi:10.1016/j.jngse.2014.09.026
Thema, M., Bauer, F., and Sterner, M. (2019). Power-to-Gas: electrolysis and methanation status review. Renew. Sustain. Energy Rev. 112, 775–787. doi:10.1016/j.rser.2019.06.030
Troncoso, E., and Newborough, M. (2011). Electrolysers for mitigating wind curtailment and producing “green” merchant hydrogen. Int. J. Hydrogen Energy 36, 120–134. doi:10.1016/j.ijhydene.2010.10.047
Virtual Pipeline - CNG - Galileo Technologies (2024). Virtual pipeline - CNG - Galileo Technologies. Available at: https://www.galileoar.com/us/www-virtualpipeline-com/(Accessed January 16, 2024).
Wulf, C., and Zapp, P. (2018). Assessment of system variations for hydrogen transport by liquid organic hydrogen carriers. Int. J. Hydrogen Energy 43, 11884–11895. doi:10.1016/j.ijhydene.2018.01.198
Yang, C., and Ogden, J. (2007). Determining the lowest-cost hydrogen delivery mode. Int. J. Hydrogen Energy 32, 268–286. doi:10.1016/j.ijhydene.2006.05.009
Zhang, F., Salimu, A., and Ding, L. (2022). Operation and optimal sizing of combined P2G-GfG unit with gas storage for frequency regulation considering curtailed wind power. Int. J. Electr. Power Energy Syst. 141, 108278. doi:10.1016/j.ijepes.2022.108278
Keywords: curtailed wind power, power to gas, natural gas, coordinated operation, optimal sizing, gas transportation, retail natural gas market
Citation: Salimu A, Zhang F, Zhang G and Yang L (2024) Coordinated operation and optimal sizing strategy of P2G—CNG trucks scheme on wind farm for participating in retail gas market. Front. Energy Res. 12:1354904. doi: 10.3389/fenrg.2024.1354904
Received: 13 December 2023; Accepted: 22 January 2024;
Published: 09 February 2024.
Edited by:
Joshuva Arockia Dhanraj, Hindustan Institute of Technology and Science, IndiaReviewed by:
Hamid Reza Rahbari, Aalborg University, DenmarkAnna Stoppato, University of Padua, Italy
Copyright © 2024 Salimu, Zhang, Zhang and Yang. This is an open-access article distributed under the terms of the Creative Commons Attribution License (CC BY). The use, distribution or reproduction in other forums is permitted, provided the original author(s) and the copyright owner(s) are credited and that the original publication in this journal is cited, in accordance with accepted academic practice. No use, distribution or reproduction is permitted which does not comply with these terms.
*Correspondence: Feng Zhang, fengzhang@sdu.edu.cn