Enhancing non-intrusive load monitoring with weather and calendar feature integration in DAE
 Zengxin Pu
 Yu Huang1*
 - 1Electric Power Research Institute of Guizhou Power Grid Co., Ltd., Guiyang, China
- 2Guiyang Power Supply Bureau of Guizhou Power Grid Co., Ltd., Guiyang, China
- 3Duyun Power Supply Bureau of Guizhou Power Grid Co., Ltd., Duyun, China
- 4Energy Development Research Institute, China Southern Power Grid, Guangzhou, China
The construction of modern power system is key to achieving dual carbon goals, where non-intrusive load monitoring (NILM) plays a vital role in enhancing energy utilization efficiency and energy management. For example, to enable prosumers to better understand the extent of their flexible loads for demand response and peer-to-peer trading, it is essential to be aware of the types and states of loads using the method of NILM. To improve the predictive accuracy and implementation effectiveness of NILM technology, this paper proposes a novel NILM method integrating meteorological and calendar features. It delves deeply into the close connection between external factors such as temperature, precipitation, wind speed, and holidays, and the energy consumption of electrical appliances, constructing additional associative mappings in the training of the Denoising Autoencoder (DAE) model. Test results on the UK-DALE public dataset show that the NILM method proposed in this paper has significant advantages over traditional NILM methods that consider only single-dimensional electrical data features, in terms of load pattern recognition and accuracy in load energy consumption monitoring. This confirms the potential of multi-dimensional feature fusion technology in the application of NILM.
1 Introduction
With the advancement of smart grid technologies and the transformation of global energy structures, the construction of modern power system has become key to achieving decarbonization goals (Sepulveda, 2016). Modern power system leverages up-to-date information technology and communication technology to enable real-time monitoring and management of electrical appliances, characterized by digitalization and decentralization (Voropai, 2020). The characteristics of modern power system have promoted an interactive electricity consumption mode between grid operators and users, where load monitoring plays the critical role (Najmeddine et al., 2008; Abubakar et al., 2017). Load monitoring technology enables grid operators to better understand and predict load variations, optimizing the allocation and utilization of electric power resources. By gaining deeper insights into user habits, this technology also aids in identifying opportunities for energy saving and emission reduction, thereby enhancing energy efficiency. Meanwhile, to facilitate prosumers in effectively gauging their variable load capacities, crucial for engaging in demand response and peer-to-peer transactions, knowledge about the variety and current conditions of loads is vital. The Hybrid Appliance Load Monitoring System (HALMS) represents a new field in load monitoring research, dedicated to accurately tracking and analyzing energy using at the device level. The establishment of this system is driven by the urgent need for a more connected, efficient electrical grid and an advanced energy infrastructure capable of meeting future energy challenges. With the rapid development of direct current microgrids, standalone energy systems, and distributed energy resources, deploying HALMS has become crucial for effective energy management (Suryadevara and Biswal, 2019).
The Appliance Load Monitoring (ALM) technology encompasses two approaches: Intrusive Load Monitoring (ILM) and NILM. ILM technology requires entering the interior of buildings or homes to gather data. The common approach is to install sensors and communication modules on each electrical device. Sensors are used to collect real-time electrical information of the device, such as current, voltage, and power, while communication modules are responsible for transmitting the collected data. On the other hand, NILM technology does not require entering the interior of buildings. It only involves collecting aggregated electrical information (current, voltage, power, etc.) of the building. By processing and analyzing the collected aggregated data, it is then possible to predict the operational status of the electrical devices inside the building, including the on/off status and power consumption of devices. The advantages and disadvantages of the ILM and NILM systems can be summarized below: ILM is more like straightforward engineering problem, as it only involves the collection and transmission of information without the need for complex computational processing. Furthermore, due to the direct collection of signals from the electrical devices themselves, ILM boasts high accuracy and real-time monitoring capabilities. However, the intrusive method requires the installation of additional transmission and collection devices on each electrical device, making the operation complex, costly, and maintenance difficult. Faults are hard to detect, and even if detected, they are difficult to locate. On the other hand, NILM requires the installation of only a few collection devices outside the building or home, significantly reducing costs compared to the intrusive method. The data collection operation is simpler, and the privacy inside the building is better preserved. However, since the non-intrusive method predicts the condition of electrical devices inside the building through collected aggregated information, its monitoring accuracy is not very high. In terms of practical application, given the large number of electrical devices within buildings, the cost and maintenance difficulties of the intrusive method make it less valuable. In contrast, the NILM system is much more cost-effective, and with the development of algorithms and the advent of neural networks, the accuracy of NILM systems has been increasing. Some models can even achieve real-time monitoring standards, making them increasingly valuable for practical applications.
In 1982, Professor Hart first introduced the concept of NILM. In the early stage, researchers mainly employed mathematical optimization algorithms to transform non-intrusive load monitoring into a mathematical problem-solving exercise. This approach involves calculating the best combination of appliance signals from the aggregated signal data collected, aiming to closely match the actual total measured electricity power. Hart and his colleagues utilized combinatorial optimization algorithms to categorize electrical devices into multiple states, assigning a specific power value to each state. They were the first to propose a method based on the clustering of appliance characteristics for decomposing electrical loads (Hart, 1992). Reference (Lin et al., 2016) presents a NILM method based on quadratic programming to provide adequate load identification accuracy for residential energy monitoring. Reference (Kong et al., 2016) proposes a hierarchical hidden Markov model framework to model home appliances. The model provides better representation for those appliances that have multiple built-in modes with distinct power consumption profiles, such as washing machines and dishwashers. Reference (Chang et al., 2013) utilized particle swarm optimization techniques to optimize the parameters of training algorithms in artificial neural networks for NILM tasks. Reference (Lin and Tsai, 2013) combined transient feature extraction schemes of multi-resolution S transform with an improved 0–1 multi-dimensional knapsack algorithm for load identification, proposing a NILM method based on ant colony optimization algorithm for combinatorial search. Reference (Piga et al., 2015) assuming that the power consumption curves of unknown appliances are piecewise constant, framed the load decomposition problem as a minimization of least square errors, proposing a sparse optimization-based algorithm that provides very accurate estimates of appliance aggregate consumption and accurately characterizes the appliance power consumption curves. However, NILM based on mathematical optimization faces two major challenges: 1) When processing complex electrical load data, mathematical methods often encounter issues with accuracy and robustness, and struggle to perform real-time monitoring as the volume of data increases. 2) Mathematical methods require manual extraction of appliance features, posing challenges in the characteristic identification for electrical appliances with diverse types and multiple states.
As machine learning technology advances, many scholars have also begun to explore the resolution of NILM through pattern recognition methods. Reference (Rahimpour et al., 2017) introduces a Sum-to-k constrained Non-negative Matrix Factorization (S2K-NMF) approach, which represents the aggregated signal as a linear combination of basis vectors within a matrix decomposition framework. Reference (Lin and Tsai, 2014) proposes a novel NILM technique featuring a hybrid classification technology. This method combines fuzzy C-Means clustering, guided Particle Swarm Optimization, and a neural fuzzy classifier that considers uncertainty, addressing the issue of fuzziness in electrical characteristics. Reference (He et al., 2016) designs a NILM approach based on Graph Signal Processing (GSP), offering fresh perspectives for NILM research. Compared to optimization algorithms, these pattern recognition-based NILM algorithms have achieved improvements in identification accuracy. However, they transform the classification problem into a mapping relationship issue of input and output. With the increasing number of devices, the volume of mapping relationships rapidly grows, significantly reducing recognition accuracy.
With the advancement of deep learning technologies, algorithms based on deep neural network models have been proposed and applied to load decomposition, achieving performance superior to traditional optimization algorithms. These algorithms offer improved prediction accuracy and is capable of real-time monitoring in the face of massive data sets. Also, deep neural networks can automatically extract key features from electricity data, enabling intelligent recognition of electrical appliances. Kelly and others (Kelly and Knottenbelt, 2015a) were pioneers in solving the NILM problem using deep learning methods. They applied deep networks such as denoising autoencoders and Long Short-Term Memory (LSTM) networks to NILM tasks. Reference (Zhang et al., 2018) proposes sequence-to-point learning, where the input is a window of the busbar electricity data and the output is a single point of the target appliance. Researchers use convolutional neural networks to train the model and systematically show that the networks can inherently learn the characteristics of the target appliances, which are automatically added into the model to reduce the identifiability problem. Reference (Rafiq et al., 2018) presents two deep recurrent neural networks models: LSTM and GRU and introduces regularization to improve proposed models’ performance. Researchers have achieved promising results with proposed regularized LSTM model in terms of accuracy, F1 score and mean absolute error. Reference (Yue et al., 2020) proposes BERT4NILM, an architecture based on bidirectional encoder representations from transformers (BERT) and an improved objective function designed specifically for NILM learning. With the adjusted loss function and masked training, BERT4NILM outperforms state-of-the-art models across various metrics on the two publicly available datasets UK-DALE and REDD. Inspired by the Fully Convolutional Networks (FCN) proposed by Shelhamer and others (Long et al., 2015), reference (Brewitt and Goddard, 2018) further introduced an FCN for sequence-to-subsequence learning, achieving better decomposition performance compared to S2P.
Although deep learning methods have achieved commendable results in NILM, existing algorithms still exhibit shortcomings in the aspect of feature extraction. Specifically speaking, current algorithms typically extract features solely from single-dimensional electrical data, such as active power (Dinesh et al., 2016), reactive power (Valenti et al., 2018), and current waveforms (Shareef et al., 2023), while overlooking the correlations of weather and calendar factors with the energy usage of electrical appliances. For instance, colder weather will increase the usage of heating appliances, and holidays generally lead to more energy consumption in household devices. This neglect of feature interrelation leads to an inadequate mapping between inputs and outputs, ultimately resulting in suboptimal prediction accuracy of deep learning models in NILM, thus influencing the effectiveness of load monitoring and energy management.
In this paper, advanced deep learning technology is utilized to conduct NILM research, employing the DAE as the main model. A notable innovation of this paper is the integration of weather and calendar information into the feature selection process, aiming to expand the application potential of deep learning methods in NILM. This approach overcomes the limitation of deep learning models in NILM that solely consider electrical data features. We explore the interrelation between weather, calendar information, and the energy consumption of electrical appliances. The UK-DALE public dataset is selected as the testing platform for this study. The results demonstrate that our proposed NILM method with multi-dimensional features significantly outperforms traditional NILM methods that consider only single-dimensional electrical data features. This is evident in metrics such as the R2 score, Explained Variance Score, Mean Absolute Error (MAE), and Normalized Mean Square Error (NMSE), in the NILM performance of various household electrical appliances. NILM considering meteorological features, compared to NILM without such features, has an R2 Score increase of 0.008, an Explained Variance Ratio increase of 0.008, a decrease in MAE by 0.117, and a reduction in NMSE by 0.008 for the fan appliance test. For the kettle appliance, the inclusion of calendar features resulted in an increase of 0.008 in the R2 Score and 0.008 in the Explained Variance Ratio, while the Mean Absolute Error (MAE) decreased by 0.231, and the Normalized Mean Square Error (NMSE) decreased by 0.007. This study provides a novel perspective and tools for applying deep learning methods and selecting multi-dimensional features in NILM research.
2 Deep learning model architecture for NILM task
2.1 The basic autoencoder
An autoencoder processes an input vector
Where
If
Where
2.2 The denoising autoencoder
DAE is an advanced neural network architecture that extends the traditional autoencoder (AE) concept. Unlike standard AEs that focus on learning compressed representations of input data through an encoder-decoder framework, DAEs introduce a significant twist: they are trained to reconstruct original, clean data from corrupted inputs, as shown in Figure 1. In this research, our selection of the DAE model instead of other models is driven by its specific advantages for the NILM task, particularly in handling noisy data and efficiently incorporating external features.
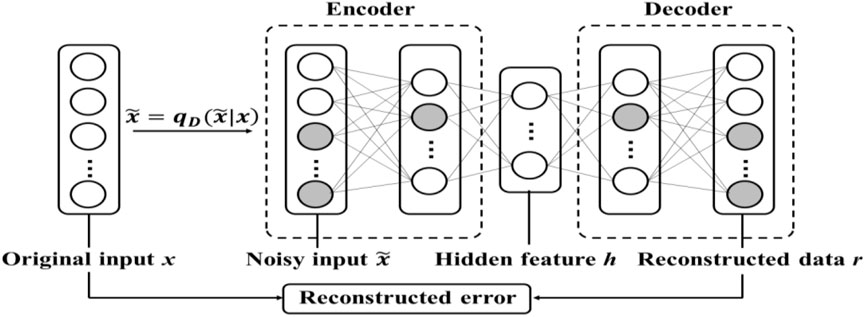
Figure 1. Schematic diagram of the DAE deep learning model.
2.2.1 Input corruption process
The first step in DAE involves corrupting the original input data
Here,
2.2.2 Encoding process
The corrupted input
Here,
2.2.3 Decoding process
The hidden representation
Here,
2.2.4 Loss function
The objective of the DAE is to minimize the reconstruction error. The loss function used is the Mean Squared Error (MSE):
This function calculates the square of the Euclidean distance between the original input
2.2.5 Optimization
The DAE model undergoes training through backpropagation and optimization algorithms to adjust the weights
Stochastic Gradient Descent (SGD) is an optimization method used to update the weights and biases of a neural network iteratively. It calculates the gradient of the loss function for a randomly selected subset of data rather than the entire dataset, making the computation more efficient. SGD updates parameters:
Where
2.2.6 Feature extraction
Through this process, DAE learns to extract robust features from noisy data. The learned weights and biases encapsulate these features, which are crucial for tasks like NILM, where distinguishing between different appliance signatures from noisy aggregate data is essential.
Generally speaking, the application of DAE in NILM is rooted in their proficiency in handling and interpreting noisy, high-dimensional data. NILM tasks involve disaggregating total energy consumption into individual appliance loads, which is inherently a noisy and complex problem. The DAE’s capability to denoise input data and extract relevant features is crucial in accurately identifying unique appliance signatures from aggregate energy data. This process involves not only recognizing patterns in the consumption data but also effectively filtering out irrelevant noise and distortions.
3 Experiments and results
3.1 Data preparation
3.1.1 Electricity data preparation
The UK Domestic Appliance-Level Electricity (UK-DALE) dataset (Kelly and Knottenbelt, 2015b) is a significant resource in the field of NILM. It provides high-resolution energy usage data from domestic environments within the United Kingdom. This dataset is instrumental for us working on algorithms and models to disaggregate total energy consumption into appliance-specific usage. The key characteristics of UK-DALE is: 1) data granularity: UK-DALE offers exceptionally fine-grained power usage data, recorded at a 1/6 Hz temporal resolution. This enables detailed analysis of appliance usage patterns and energy consumption behaviors. 2) duration and diversity: The dataset encompasses a considerable duration, spanning from the year of 2012 to the year of 2015. It includes data from a diverse range of households, thus offering a broad perspective on domestic energy usage. 3) appliance-level detail: It provides disaggregated energy consumption data of five houses in London for individual appliances.
In this paper, four typical appliances from house one are selected: fan, solar thermal pumping, kettle, and dish washer, to investigate the effectiveness of NILM with single-dimensional feature and multi-dimensional features. The dataset for the deep learning model comprises the total electricity consumption data of house one and the consumption data of each appliance, spanning from 15 June 2013, to 20 July 2013. The training and testing sets are divided in a 4:1 ratio.
3.1.2 Meteorological data preparation
The National Oceanic and Atmospheric Administration (NOAA), a key agency within the United States Department of Commerce, specializes in the study and monitoring of atmospheric and oceanic conditions. Known for its extensive meteorological data collection, NOAA is instrumental in weather forecasting, climate change research, and environmental stewardship. Its comprehensive data repositories, gathered through advanced monitoring technologies like satellites and radar systems, are invaluable for a myriad of scientific endeavors. For NILM research, NOAA’s detailed meteorological data is particularly useful, offering critical insights that can enhance the accuracy of energy usage predictions and analysis, especially in relation to environmental variables.
In this study, due to the location of house one in the UK-DALE dataset being in London, historical meteorological data from the ST JAMES PARK weather station in London was selected (NOAA National Centers for Environmental Information, 2013). ST JAMES PARK station is the nearest station to our test homes within the UK-DALE dataset that offers hourly resolution data encompassing temperature, precipitation, and wind speed. These data points are crucial for our study, and the completeness and clarity of the records at ST JAMES PARK made it the most suitable choice for our research needs. The temporal scope of the data extends from 15 June 2013, to 20 July 2013. The meteorological data types covered include temperature, precipitation, and wind speed. As depicted in Figure 2, during this period, the highest recorded temperature was 30°C, the maximum precipitation reached 71 mm/h, and the highest wind speed was 10.5 m/s.
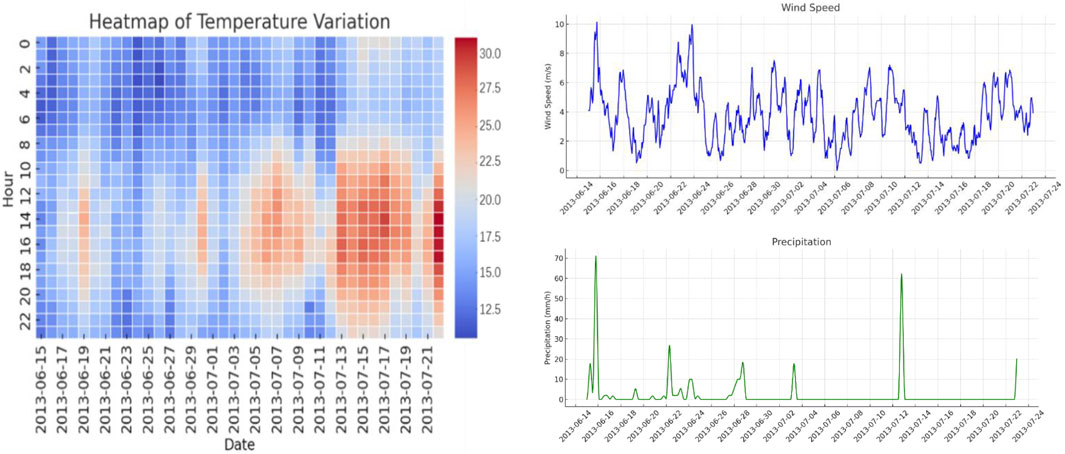
Figure 2. The overview of meteorological data.
Besides, due to the inconsistency in time scale of meteorological data and electricity data, we apply cubic spline interpolation to the meteorological data to generate interpolated values at a 6-s resolution, aligning with the electricity consumption data from the UK-DALE dataset. This method allowed us to construct a uniform time scale for both data types, ensuring that our DAE model could effectively incorporate and learn from the combined dataset.
3.1.3 Calendar data preparation
The UK-DALE dataset explicitly specifies the time periods for the electricity data, allowing us to reference the British calendar for June and July 2013 based on these time stamps when conducting deep learning training and testing. This enables the determination of calendar data, including whether the day is a weekday or weekend, a holiday or not, the day of the week, and the week of the month. By selecting these calendar features, we can enrich and refine the original single-dimensional electricity feature.
3.2 Evaluation metrics
Assessment is carried out using R2 Score, Explained Variance Score, Mean Absolute Error (MAE) and Normalized Mean Square Error (NMSE) as four evaluation metrics to compare the performance differences between NILM with multi-dimensional features and NILM with single-dimensional feature. We thoroughly evaluate their accuracy and ability to recognize load patterns.
3.2.1 R2 score
This metric is used to measure the degree to which the model explains the variance in the dependent variable. Its value ranges from 0 to 1, with values closer to 1 indicating better explanatory power of the model in terms of the dependent variable.
Where
3.2.2 Explained variance score
This metric measures the degree to which the model explains the variance in the data. Its value also ranges from 0 to 1, with values closer to 1 indicating better explanation of the data variance.
Where
3.2.3 MAE
This metric measures the average magnitude of the errors in a set of predictions, without considering their direction. It is the average over the test sample of the absolute differences between prediction and actual observation where all individual differences have equal weight.
3.2.4 NMSE
This metric evaluates the predictive error of a model relative to the variance of the observed data. It is a normalized measure that provides insight into the error size in comparison to the variability of the dataset.
These metrics provide a comprehensive assessment of model performance, including aspects such as model explanatory power, data variance, and prediction error.
3.3 Results and discussion
Our experiments initially conducted a comparative study of the NILM implementation effects considering both meteorological and electrical features versus considering only electrical features. We selected fan and solar thermal pumping as the two types of electrical appliances and utilized the DAE as the deep learning model. As shown in Figure 3, the blue line represents the actual power consumption of the fan and solar thermal pumping in the test set, while the orange line represents the NILM effect considering both meteorological and electrical features. From the blue line, it is evident that the fan is used infrequently, and data analysis reveals that the fan is only activated at moments of higher temperature. On the other hand, the solar thermal pumping exhibits relatively regular power consumption. However, statistical data indicates that the duration and power consumption of solar thermal pumping are significantly higher on sunny days compared to rainy days. The orange line shows that NILM, when considering both meteorological and electrical features, can closely follow the actual power variations and accurately predict the start and stop states of the fan and solar thermal pumping appliances. Although there are some minor deviations between the predicted power and the actual power, overall, this method has shown fairly good results in NILM tasks.
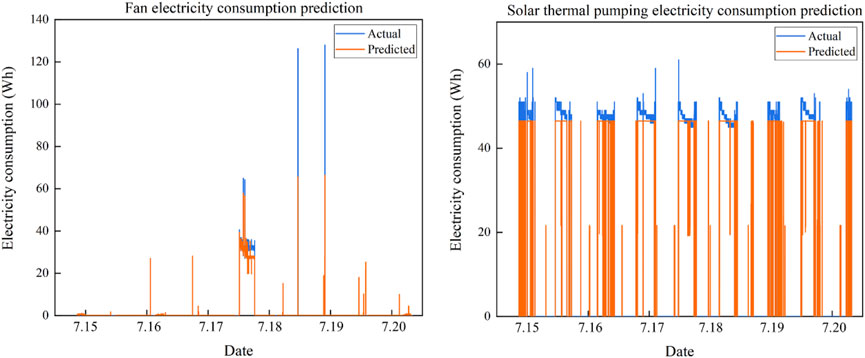
Figure 3. Effect of NILM when considering weather factors (fan and solar thermal pumping).
We also conducted a comparative study of NILM considering multi-dimensional (electricity and weather) versus single-dimensional (electricity) feature. Table 1 presents the results of NILM with and without weather features. The evaluation results indicate that NILM considering meteorological features (temperature, precipitation, and wind speed), compared to NILM without such features, has an R2 Score increase of 0.008, an Explained Variance Ratio increase of 0.008, a decrease in MAE by 0.117, and a reduction in NMSE by 0.008 for the fan appliance test. In the solar thermal pumping appliance test, NILM considering meteorological features saw a significant improvement in both R2 Score and Explained Variance Ratio over NILM not considering meteorological features, with a notable decrease in both MAE and NMSE. This demonstrates that the NILM approach proposed in this study, which takes into account meteorological features, can achieve higher prediction accuracy and more precise non-intrusive load monitoring effects compared to traditional NILM methods.
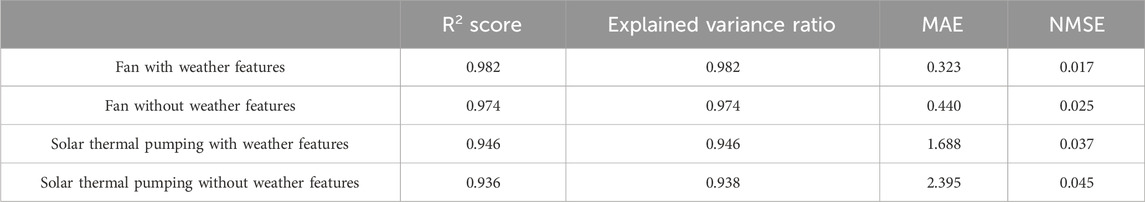
Table 1. Results of NILM with and without weather features.
Hence, from the above experiments, we can conclude that for the two types of electrical appliances, fan and solar thermal pumping, NILM that considers both meteorological and electrical features as opposed to just electrical features is better at capturing the characteristics of load variations, achieving superior prediction accuracy, and is more conducive to the implementation of energy-saving, emission reduction, and energy management strategies. The reason for this outcome is that traditional NILM, which only considers electrical features, overlooks the correlation between household electrical appliances and meteorological factors. Consequently, a deep learning model constructed solely from electrical features has an incomplete and insufficient mapping relationship between its inputs and outputs, thus limiting the predictive accuracy of NILM based on deep learning methods. By considering the three categories of meteorological features—temperature, precipitation, and wind speed—during feature selection, the model training can account for the relationship between meteorological factors and energy consumption, thereby better implementing NILM. This conclusion is not only applicable to the two types of typical electrical appliances proposed but also to high-power appliances such as air conditioners and heaters in users’ homes. The novel NILM approach based on meteorological and electrical features can further enhance predictive performance over traditional NILM methods.
In our subsequent investigations, we expanded our focus to explore the effectiveness of NILM when integrating both calendar data and electrical consumption metrics as opposed to solely relying on electrical data. For this purpose, kettle and dish washer were chosen as the representative appliances, with DAE continuing to serve as our chosen deep learning framework. The data, as illustrated in Figure 4, reveals through a blue line the real-time consumption patterns of these appliances within the test dataset. In contrast, the orange line denotes the outcomes of NILM when it synthesizes information from both calendar events and electrical usage. A notable observation from the blue line is the heightened use of these appliances, particularly during holidays, suggesting a marked uptick in energy usage compared to regular workdays. The orange line, on the other hand, showcases NILM’s adeptness at mirroring these consumption patterns, precisely indicating the operational status of kettle and dish washer. While minor variances are noted between the forecasted and actual energy usage, the overall results point to the robustness and effectiveness of this approach in NILM applications, especially in capturing regular energy use behaviors linked to calendar-specific influences.
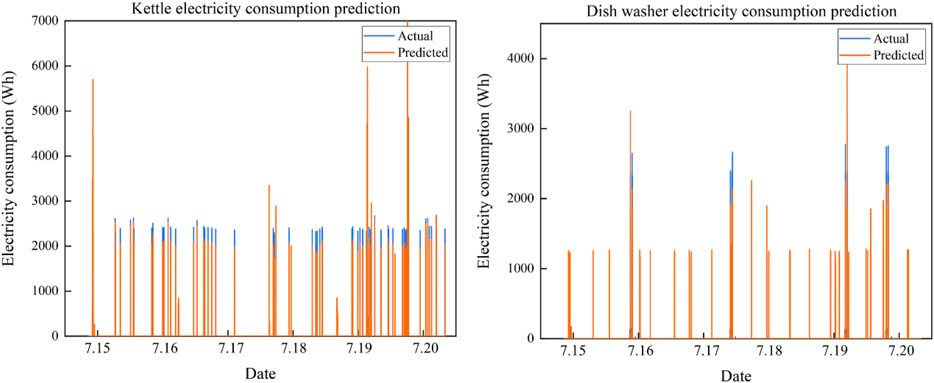
Figure 4. Effect of NILM when considering calendar features (kettle and dish washer).
Table 2 presents the results of NILM implementation with and without calendar features. For the kettle appliance, the inclusion of calendar features resulted in an increase of 0.008 in the R2 Score and 0.008 in the Explained Variance Ratio, while the Mean Absolute Error (MAE) decreased by 0.231, and the Normalized Mean Square Error (NMSE) decreased by 0.007. In the case of the dish washer appliance, incorporating calendar features led to an increase of 0.004 in the R2 Score and 0.004 in the Explained Variance Ratio, with a decrease of 0.075 in MAE and 0.005 in NMSE. This demonstrates that for these two types of appliances, considering calendar features enhances the accuracy and reliability of NILM implementation, marking a significant advancement over traditional NILM methods.
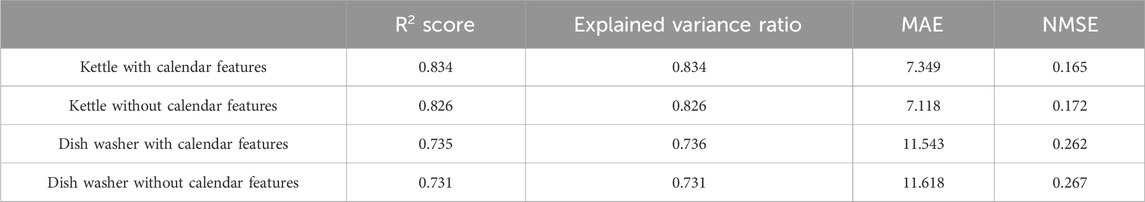
Table 2. Results of NILM with and without calendar features.
In summary, NILM implementation considering calendar features further captures the relationship between users’ daily routines and power consumption of electrical appliances. During holidays and weekends, users spend more time at home compared to workdays, leading to more frequent use of various household appliances and consequently higher electricity consumption. This conclusion is not only applicable to kettle and dish washer appliances but also extends to a broader range of household devices.
It is evident that the improved NILM method outperforms the traditional approach across all evaluation metrics for the four types of electrical appliances we focused on (fan, solar thermal pumping, kettle, and dish washer). In fact, the start-stop actions and energy consumption of household appliances are closely linked to user activities, which in turn are significantly influenced by external factors. Therefore, our proposed NILM method, incorporating meteorological and calendar features, can more comprehensively capture the factors influencing household appliance energy consumption and accurately establish correlations. By conducting training and testing in this manner, we achieve superior load monitoring results compared to the traditional NILM approach.
4 Conclusion
The NILM method proposed in this paper, integrating meteorological and calendar features, surpasses traditional non-intrusive load monitoring techniques in capturing load characteristics and establishing comprehensive energy consumption correlations for tested appliances. Specifically, for the fan, enhancements include a 0.008 increase in both R2 Score and Explained Variance Ratio, with MAE decreasing by 0.117 and NMSE by 0.008. For the kettle, the addition of calendar features similarly boosts the R2 Score and Explained Variance Ratio by 0.008 each, while MAE and NMSE decrease by 0.231 and 0.007, respectively. This approach offers a novel perspective and tools for research in the NILM domain and provides more reliable and efficient technical support for energy management and demand response in smart grids.
In future research, we will consider integrating the NILM software algorithms proposed in this paper with advanced hardware measurement technologies (such as smart plugs) to further enhance the effectiveness and capabilities of load monitoring. Smart plugs act as a complementary innovation, improving the cost-effectiveness and precision of energy monitoring. The potential functions of smart plugs to benefit load monitoring and management include (Suryadevara and Biswal, 2019): 1) device identification. 2) device scheduling and control. 3) occupancy detection. 4) thermal and overload safeguards. By combining advanced software algorithms with hardware devices, we will achieve improved energy management efficiency.
Data availability statement
The original contributions presented in the study are included in the article/Supplementary Material, further inquiries can be directed to the corresponding author.
Author contributions
ZP: Conceptualization, Data curation, Investigation, Methodology, Software, Supervision, Writing–original draft, Writing–review and editing. YH: Formal Analysis, Funding acquisition, Project administration, Resources, Validation, Visualization, Writing–original draft, Writing–review and editing. MW: Writing–original draft, Writing–review and editing. YM: Writing–original draft, Writing–review and editing. YZ: Writing–original draft, Writing–review and editing. GH: Writing–original draft, Writing–review and editing.
Funding
The author(s) declare financial support was received for the research, authorship, and/or publication of this article. This work was supported in part by the China Southern Power Grid Corporation Technology Project (066600KK52222044/GZKJXM20222165).
Conflict of interest
Authors ZP and YH were employed by Electric Power Research Institute of Guizhou Power Grid Co., Ltd. Authors MW and YZ were employed by Guiyang Power Supply Bureau of Guizhou Power Grid Co., Ltd. Author YM was employed by Duyun Power Supply Bureau of Guizhou Power Grid Co., Ltd.
The remaining author declares that the research was conducted in the absence of any commercial or financial relationships that could be construed as a potential conflict of interest.
The authors declare that this study received funding from the China Southern Power Grid Corporation Technology Project. The funder had the following involvement in the study: study design, data collection and analysis.
Publisher’s note
All claims expressed in this article are solely those of the authors and do not necessarily represent those of their affiliated organizations, or those of the publisher, the editors and the reviewers. Any product that may be evaluated in this article, or claim that may be made by its manufacturer, is not guaranteed or endorsed by the publisher.
Supplementary material
The Supplementary Material for this article can be found online at: https://www.frontiersin.org/articles/10.3389/fenrg.2024.1361916/full#supplementary-material
References
Abubakar, I., Khalid, S., Mustafa, M., Shareef, H., and Mustapha, M. (2017). Application of load monitoring in appliances’ energy management–A review. Renew. Sustain. Energy Rev. 67, 235–245. doi:10.1016/j.rser.2016.09.064
Brewitt, C., and Goddard, N. (2018). Non-intrusive load monitoring with fully convolutional networks. arXiv Prepr. arXiv:1812.03915.
Chang, H.-H., Lin, L.-S., Chen, N., and Lee, W.-J. (2013). Particle-swarm-optimization-based nonintrusive demand monitoring and load identification in smart meters. IEEE Trans. Ind. Appl. 49 (5), 2229–2236. doi:10.1109/tia.2013.2258875
Dinesh, C., Godaliyadda, R. I., Ekanayake, M. P. B., Ekanayake, J., and Perera, P. (2016). Non-intrusive load monitoring based on low frequency active power measurements. AIMS Energy 4 (3), 414–443. doi:10.3934/energy.2016.3.414
Hart, G. W. (1992). Nonintrusive appliance load monitoring. Proc. IEEE 80 (12), 1870–1891. doi:10.1109/5.192069
He, K., Stankovic, L., Liao, J., and Stankovic, V. (2016). Non-intrusive load disaggregation using graph signal processing. IEEE Trans. Smart Grid 9 (3), 1739–1747. doi:10.1109/tsg.2016.2598872
Kelly, J., and Knottenbelt, W. (2015a). “Neural nilm: deep neural networks applied to energy disaggregation[C],” in Proceedings of the 2nd ACM international conference on embedded systems for energy-efficient built environments, Seoul, South Korea, November 4-5, 2015, 55–64.
Kelly, J., and Knottenbelt, W. (2015b). The UK-DALE dataset, domestic appliance-level electricity demand and whole-house demand from five UK homes. Sci. Data 2 (1), 150007–150014. doi:10.1038/sdata.2015.7
Kong, W., Dong, Z. Y., Hill, D. J., Ma, J., Zhao, J., and Luo, F. (2016). A hierarchical hidden Markov model framework for home appliance modeling. IEEE Trans. Smart Grid 9 (4), 3079–3090. doi:10.1109/tsg.2016.2626389
Lin, S., Zhao, L., Li, F., Liu, Q., Li, D., and Fu, Y. (2016). A nonintrusive load identification method for residential applications based on quadratic programming. Electr. Power Syst. Res. 133, 241–248. doi:10.1016/j.epsr.2015.12.014
Lin, Y.-H., and Tsai, M.-S. (2013). Development of an improved time–frequency analysis-based nonintrusive load monitor for load demand identification. IEEE Trans. Instrum. Meas. 63 (6), 1470–1483. doi:10.1109/tim.2013.2289700
Lin, Y.-H., and Tsai, M.-S. (2014). Non-intrusive load monitoring by novel neuro-fuzzy classification considering uncertainties. IEEE Trans. Smart Grid 5 (5), 2376–2384. doi:10.1109/tsg.2014.2314738
Long, J., Shelhamer, E., and Darrell, T. (2015). “Fully convolutional networks for semantic segmentation[C],” in Proceedings of the IEEE conference on computer vision and pattern recognition, Boston, MA, USA, June 7 2015 to June 12 2015, 3431–3440.
Najmeddine, H., Drissi, K. E. K., Pasquier, C., Faure, C., Kerroum, K., Diop, A., et al. (2008). “State of art on load monitoring methods,” in 2008 IEEE 2nd International power and Energy Conference, Johor Bahru, Malaysia, 1-3 Dec. 2008, 1256–1258.
NOAA National Centers for Environmental Information (2013). ST JAMES PARK. Available at: https://www.ncei.noaa.gov/maps/hourly/.
Piga, D., Cominola, A., Giuliani, M., Castelletti, A., and Rizzoli, A. E. (2015). Sparse optimization for automated energy end use disaggregation. IEEE Trans. Control Syst. Technol. 24 (3), 1044–1051. doi:10.1109/tcst.2015.2476777
Rafiq, H., Zhang, H., Li, H., and Ochani, M. K. (2018). “Regularized LSTM based deep learning model: first step towards real-time non-intrusive load monitoring[C],” in 2018 IEEE International Conference on Smart Energy Grid Engineering (SEGE), Oshawa, Canada, August 12-15, 2018, 234–239.
Rahimpour, A., Qi, H., Fugate, D., and Kuruganti, T. (2017). Non-intrusive energy disaggregation using non-negative matrix factorization with sum-to-k constraint. IEEE Trans. Power Syst. 32 (6), 4430–4441. doi:10.1109/tpwrs.2017.2660246
Sepulveda, N. A. (2016). Decarbonization of power systems: analyzing different technological pathways. United States: Massachusetts Institute of Technology.
Shareef, H., Asna, M., Errouissi, R., and Prasanthi, A. (2023). Rule-based non-intrusive load monitoring using steady-state current waveform features. Sensors 23 (15), 6926. doi:10.3390/s23156926
Suryadevara, N. K., and Biswal, G. R. (2019). Smart plugs: paradigms and applications in the smart city-and-smart grid. Energies 12 (10), 1957. doi:10.3390/en12101957
Valenti, M., Bonfigli, R., Principi, E., and Squartini, S. (2018). “Exploiting the reactive power in deep neural models for non-intrusive load monitoring[C],” in 2018 International Joint Conference on Neural Networks (IJCNN), Rio de Janeiro, Brazil GCs, July 8-13, 2018, 1–8.
Vincent, P., Larochelle, H., Bengio, Y., and Manzagol, P.-A. (2008). “Extracting and composing robust features with denoising autoencoders[C],” in Proceedings of the 25th international conference on Machine learning, July 5-9, 2008, 1096–1103.
Voropai, N. (2020). Electric power system transformations: a review of main prospects and challenges. Energies 13 (21), 5639. doi:10.3390/en13215639
Yue, Z., Witzig, C. R., Jorde, D., and Jacobsen, H.-A. (2020). “Bert4nilm: a bidirectional transformer model for non-intrusive load monitoring[C],” in Proceedings of the 5th International Workshop on Non-Intrusive Load Monitoring, Virtual Event, Japan, November18, 2020, 89–93.
Keywords: deep learning, non-intrusive load monitoring, denoising autoencoder, weather feature, calendar feature
Citation: Pu Z, Huang Y, Weng M, Meng Y, Zhao Y and He G (2024) Enhancing non-intrusive load monitoring with weather and calendar feature integration in DAE. Front. Energy Res. 12:1361916. doi: 10.3389/fenrg.2024.1361916
Received: 27 December 2023; Accepted: 18 March 2024;
Published: 15 April 2024.
Edited by:
Jian Zhao, Shanghai University of Electric Power, ChinaReviewed by:
Yu Moduo, Shanghai Jiao Tong University, ChinaZhong Zhang, Dalian University of Technology, China
Chenghong Gu, University of Bath, United Kingdom
Copyright © 2024 Pu, Huang, Weng, Meng, Zhao and He. This is an open-access article distributed under the terms of the Creative Commons Attribution License (CC BY). The use, distribution or reproduction in other forums is permitted, provided the original author(s) and the copyright owner(s) are credited and that the original publication in this journal is cited, in accordance with accepted academic practice. No use, distribution or reproduction is permitted which does not comply with these terms.
*Correspondence: Yu Huang, 44891686@qq.com