Deep learning-based correlation analysis for probabilistic power flow considering renewable energy and energy storage
 Xiaotian Xia
 Liye Xiao1,2*
  Hua Ye
- 1Institute of Electrical Engineering, Chinese Academy of Sciences, Beijing, China
- 2University of Chinese Academy of Sciences, Beijing, China
Developing photovoltaic (PV) and wind power is one of the most efficient approaches to reduce carbon emissions. Accumulating the PV and wind energy resources at different geographical locations can minimize total power output variance as injected into the power systems. To some extent, a low degree of the variance amplitude of the renewable resources can reduce the requirement of in-depth regulation and dispatch for the fossil fuel-based thermal power plants. Such an issue can alternatively reduce carbon emissions. Thus, the correlation problem by minimizing the variance of total PV and wind power plays a vital role in power system planning and operation. However, the synergistic effect of power output correlation is mainly considered on the generation side, and it is often neglected for the correlation relationship between the power grid components. To address this problem, this paper proposes a correlation coefficient analysis method for the power grid, which can quantify the relationship between energy storage and the probabilistic power flow (PPF) of the grid. Subsequently, to accelerate the mapping efficiency of power correlation coefficients, a novel deep neural network (DNN) optimized by multi-task learning and attention mechanism (MA-DNN) is developed to predict power flow fluctuations. Finally, the simulation results show that in IEEE 9-bus and IEEE14-bus systems, the strong correlation grouping percentage between the power correlation coefficients and power flow fluctuations reached 92% and 51%, respectively. The percentages of groups indicating weak correlation are 4% and 38%. In the modified IEEE 23-bus system, the computational accuracy of MA-DNN is improved by 37.35% compared to the PPF based on Latin hypercube sampling. Additionally, the MA-DNN regression prediction model exhibits a substantial improvement in assessing power flow fluctuations in the power grid, achieving a speed enhancement of 758.85 times compared to the conventional probability power flow algorithms. These findings provide the rapid selection of the grid access point with the minimum power flow fluctuations.
1 Introduction
The global greenhouse effect has become a barrier to the world economic and social development. To reduce excessive exploitation and usage of fossil energy, a lot of countries highly prize renewable energy resources such as wind and solar energy. Due to their inexhaustible resource characteristics and zero-emission characteristics, promoting renewable energy development in power generation is crucial to achieve carbon neutrality (Stéphanie Bouckaert et al., 2021; Li W. et al., 2022). However, with the increasing permeability of the intermittent and uncertain renewable energy resources, real-time balancing between power generation and consumption becomes more difficult, and thus poses challenges to the safe and stable operation of the power system. Furthermore, renewable energy generation is strongly dependent on unpredictable climatic conditions (Guo et al., 2023). In fact, one of the most feasible ways to overcome these difficulties is to accumulate renewable energy sources over a broad spatial-temporal scale (Mazzeo et al., 2021; Ren et al., 2023). The superposition of renewable energy with weak correlation will enable the total power output more smooth (Schindler et al., 2021).
A lot of scientific literature is devoted to the complementarity between renewable energy resources. Taking advantage of the complementarity first needs to establish a reasonable power synergistic evaluation index (Guezgouz et al., 2021; Soukissian et al., 2021; Costoya et al., 2023). By using annual share of electricity supply droughts and coefficient of variation, Jung and Schindler assessed the synergistic interactions among wind energy resources in various regions (Jung and Schindler, 2022). Using the fluctuation coefficient as an evaluation metric can distinguish the strength of complementarity. However, it is unable to address situations where multiple peaks exist in the power curve. Therefore, Huang et al. formulated complementary metrics for assessing the time and magnitude based on the probability of renewable energy power meeting load requirements and the frequency of insufficient energy supply occurrences (Huang et al., 2022). Meanwhile, Nyenah et al. exploited the Pearson correlation coefficient to describe the complementarity under different operating conditions of the system (Nyenah et al., 2022). However, the above studies made many assumptions to attain the linear correlation coefficient. To avoid the limits of the linear correlation, Li et al. adopted the Kendall’s rank correlation coefficient to characterize the complementary characteristics (Li et al., 2023). Nevertheless, the statistical properties of renewable energy resources show they do not entirely meet the Gaussian distribution. Guezgouz et al. applied the Spearman correlation coefficient to study the relationship as a function of the spatial distribution distance (Guezgouz et al., 2021). In this regard, the above studies only discuss the smoothing effect of the renewable resource side, and thus fail to extend the scope of the power correlation evaluation to the power grid side.
It is crucial to explore the impact of power correlation related to the system operating stability and security (Zhang et al., 2023). Correspondingly, the power correlation is highly dependent on uncertain power flow analysis as well as the complementarity analysis. For probabilistic power flow (PPF) models, Monte Carlo simulation is the benchmark method due to its operation features, which repeats the sampling from the input samples domain. It is noteworthy that the terminate criterion of repeated sampling is often used as a parameter to be optimized for the algorithm improvement (Kim and Hur, 2021). Rezaeian-Marjani et al. proposed a PPF algorithm based on Latin hypercube sampling (LHS) and Cholesky decomposition, aiming to represent the statistical information of random variables with a smaller sample size (Rezaeian-Marjani et al., 2022). Although the Monte Carlo Simulation (MCS) can consider the correlation between input variables, its computational burden becomes more prominent with an increase in the uncertain variables (Ma et al., 2023). To address this problem, Zheng et al. employed an unscented transformation (UT) method to study the operation optimization problem for renewable energy sources and plug-in electric vehicles (Zeng et al., 2021). In fact, the spherical boundary radii of all weighted points in the UT method may expand with the increasing spatial dimension of the state variables in the power grid. This leads to low accuracy of the first two moments about the dependent variable. In summary, the accuracy and computational efficiency of the aforementioned probability power flow algorithms are affected by the complexity of the power grid topology and the increase in the dimensions of random variables.
On the other hand, it is of particular interesting to exploit wide-area spatiotemporal complementary effect of interconnected regional power grids with high penetration of renewable energy resources (Li J. L. et al., 2022). However, we will face challenges in computational efforts of the PPF-based correlation analysis, especially for large-scale wide-area power grids. To this end, it is essential to find the inherent law between the power correlations related to the PPF of the transmission grid. Correspondingly, more generalized regression algorithms were presented in some literature. By using sequential grid search, Pannakkong et al. optimized the hyperparameters of artificial neural networks (ANN) to enhance the precision of the model’s regression predictions (Pannakkong et al., 2022). Compared with the conventional ANN with one hidden layer, Amasyali et al. found that higher accuracy can be achieved by using the Deep Neural Networks (DNN) with deeper architectures at the same sample size (Amasyali and El-Gohary, 2021). Alcantara et al. employed the DNN algorithm based on the hypernetworks method, enabling the attainment of prediction intervals with optimal coverage width for solar and wind energy (Alcantara et al., 2022). Parizad and Hatziadoniu adopted the random search algorithm to confine the search range of hyperparameters within a local region. Subsequently, the grid search algorithm is utilized to screen for the optimal hyperparameters of the DNN (Parizad and Hatziadoniu, 2022). Even though DNN has good performance in various fields, whether hyperparameters such as the number of neurons in each layer and learning rate can be set reasonably will affect the output accuracy of the regression model.
In this paper, depending on the PPF, a deep learning-based wide-area correlation analysis methodology is proposed, implemented, and verified. The main contributions of this paper are threefold as follows:
1) A scheme of reducing active power fluctuation based on grid-side power correlation coefficients is proposed. Moreover, the effectiveness of the proposed scheme is verified in IEEE 9-bus system and the IEEE 14-bus system.
2) The nonlinear correlation coefficients for quantifying power flow fluctuations in the power grid are proposed. Furthermore, machine learning algorithms are employed to validate and analyze the existence of feature associations between the power correlation coefficients and power flow fluctuations in the grid.
3) The DNN model, combined multi-task learning with attention mechanism (MA-DNN) is proposed. This model establishes the mapping between power correlation coefficients and power flow fluctuations. In the modified IEEE 23-bus, a comparison with various PPF algorithms indicates that our proposed model can efficiently and accurately evaluate power flow fluctuations in the power grid.
The remainder of this paper is organized as follows: Section 2 introduces the modeling approach of power correlation coefficients. Section 3 proposes the MA-DNN model to accelerate the assessment process of power flow fluctuations in the grid. Feature analysis and the proposed model performance are validated based on the three types of IEEE power grids in Section 4. Finally, the conclusions of this work are outlined in Section 5.
2 Power correlation analysis of power grid with energy storage
In this section, a method for analyzing the operating features of AC/VSC-HVDC hybrid power grids considering the uncertainty and complementarity of renewable energy resources is described in Supplementary Material SA. On this basis, establishing the quantitative index of power correlation for the power grid. To clearly illustrate the relationships between the modeling sections of this paper, a logical block diagram is drawn, as shown in Figure 1, where “Eqs A1–A8” denotes the formula A1–A8 in Supplementary Material SA.
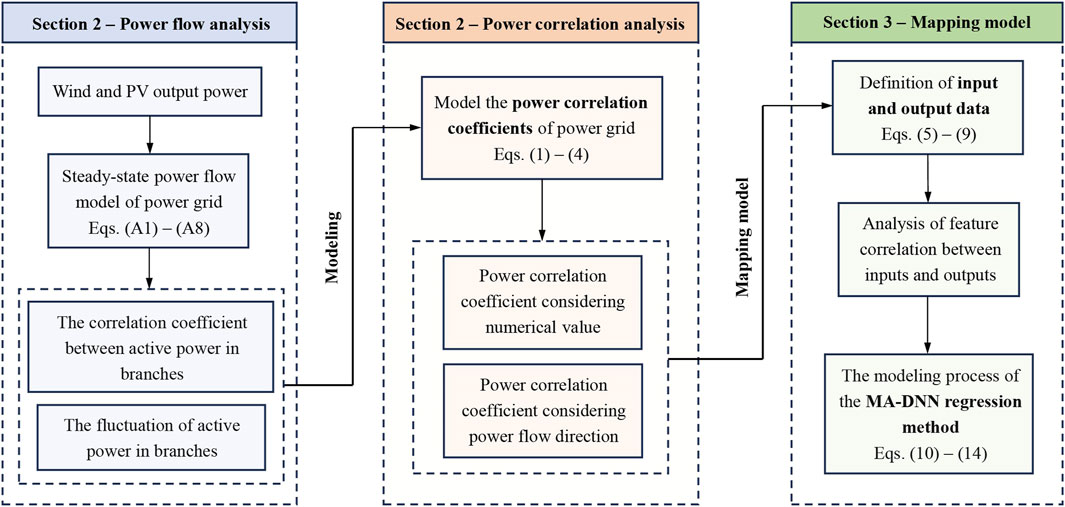
Figure 1. Logical block diagram of modeling.
As a balancing node for the entire power grid, an energy storage station can absorb imbalanced power from different lines throughout the operational cycle of the power grid. It enables an assessment of the responsiveness of an energy storage station to power flow fluctuations in different locations by studying the correlation between energy storage output power and the power variation trend of other branches. Based on this, it can serve as a criterion for selecting the optimal access point of renewable energy and the optimal interconnection point of the regional grid. Therefore, this paper proposes the power correlation coefficient to analyze the influence mechanism of power correlation from the grid side.
2.1 Power correlation coefficient considering numerical value
This paper defines the correlation coefficient between the active power of the energy storage power station and the active power flowing through the bus as the power correlation coefficient. In the case where power correlation coefficients consider the numerical values of power
where
2.2 Power correlation coefficient considering power flow direction
In the power grid, branches are connected to different buses at both ends. The direction of the power flow changes with the power fluctuation on the source and load sides. This paper sets the power flowing into the bus as positive and the power flowing out of the bus as negative. In the analysis process of power correlation coefficients, there is a difference in the correlation coefficients presented by branch power when considering changes in positive and negative signs compared to the case of only considering numerical variables. To accurately characterize the correlation between branch power, Eqs 3, 4 are established, considering the power direction in the power correlation coefficients.
where
3 Accelerated method for power flow fluctuations assessment in the power grid
The previous section has established power correlation coefficients, which can provide a data foundation for the establishment of MA-DNN model to evaluate power flow fluctuations. In this section, the single factor and multi-factor feature analysis methods are used to evaluate whether there exists a mapping relationship between power correlation coefficients and power flow fluctuations. Furthermore, we propose the MA-DNN model to enhance the computational accuracy and efficiency of regression prediction between power correlation coefficients and power flow fluctuations. The specific modeling process is as follows:
3.1 Definition of input and output data
Firstly, we defined the input data set and output data set:
The input dataset
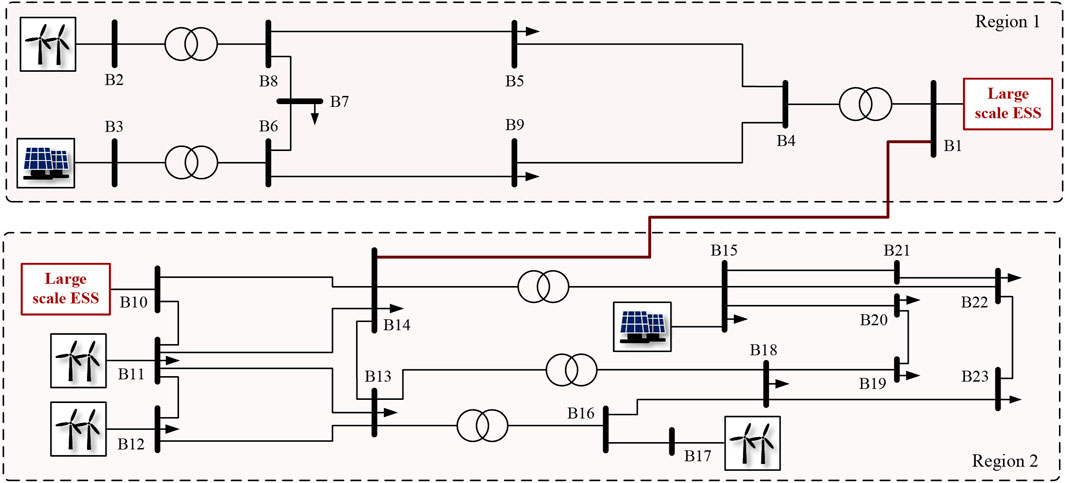
Figure 2. Topology diagram of the modified IEEE 23-bus system.
where
3.2 Configuration of experimental data
We simulate 420 sets of data in the corresponding power grid topology, with each data set having a dimension of 13 × 69. For the scientific rigor of the experiments, we randomly divide the data into training, and test sets in a ratio of 10:3. The training set is used for model construction, and the test set for independently evaluating the model’s performance.
3.3 Analysis of feature correlation
When exploring the relationship between power correlation coefficients (referred to as “features”) and power flow fluctuations, the experiment is divided into two parts: single-factor analysis and multi-factor analysis.
For single-factor analysis, we employ the Spearman correlation coefficient to calculate the correlation of each feature with power flow fluctuations (including the sum), along with the results of significance tests. Specifically, absolute Spearman correlation coefficients greater than 0.4 are considered strongly correlated, and p-values less than 0.05 are deemed statistically significant. Additionally, to provide a more intuitive representation of the relationship between features and power flow fluctuations, we categorize all features into three groups based on the following criteria: 1) Strongly correlated - situations with the absolute value of Spearman correlation coefficients greater than 0.4 and p-values less than 0.05; 2) Weakly correlated - situations with the absolute value of Spearman correlation coefficients greater than 0.2 and less than 0.4, and p-values less than 0.05; 3) Not correlated—situations not meeting the above two conditions.
For multi-factor analysis, we employ the XGBoost algorithm to construct mappings between features and the fluctuations in each active power (including the sum) to explore relationships among multiple variables. The XGBoost algorithm is a machine learning algorithm designed based on Taylor expansion, using an ensemble of weak classifiers to build a strong decision maker, demonstrating good generalization ability and accuracy (Chen and Guestrin, 2016). In our hypothesis, if modeling input features can yield high-precision prediction results, it indicates their association. Finally, the importance of each feature is characterized by counting its occurrences in the regression decision tree.
3.4 MA-DNN model-based accurate and accelerated solution method
DNN with deeply hidden layer structures can mine complex nonlinear relationships between variables, which are widely applicable to solving regression problems (Ifaei et al., 2017; Yang et al., 2021). It is worth noting that the key to achieving a high-precision mapping from input data to output data lies in how to design an appropriate deep learning network structure.
For the MA-DNN, it is primarily composed of three fully connected layers. Additionally, the first two fully connected layers include batch normalization and activation functions. As the data propagates between the fully connected layers, its dimension is reduced to half of the output dimension of the previous layer. Additionally, two optimizations were applied to the DNN:
1) Our first innovation is attention mechanism. After inputting the data into the model, a channel attention mechanism was employed to further enhance the input data (Hu et al., 2018). Its formula is as follows:
In the above formula, the input data is coupled through a weight matrix
2) Our second innovation is multi-task learning mechanism. The advantage of multi-task learning lies in leveraging the correlation between tasks, introducing inductive bias to prevent the network from getting stuck in a local optimum when dealing with a single task, and achieving a collective improvement in predictive performance across multiple tasks (Zhang and Yang, 2018). In this study, we first choose MSE as the loss function to minimize the distance between the predicted values
For the multiple tasks that the model aims to predict, we initially set
Moreover, we introduce a learning rate decay mechanism to further enhance the model’s generalization ability. The model diagram of MA-DNN is shown in Figure 3.
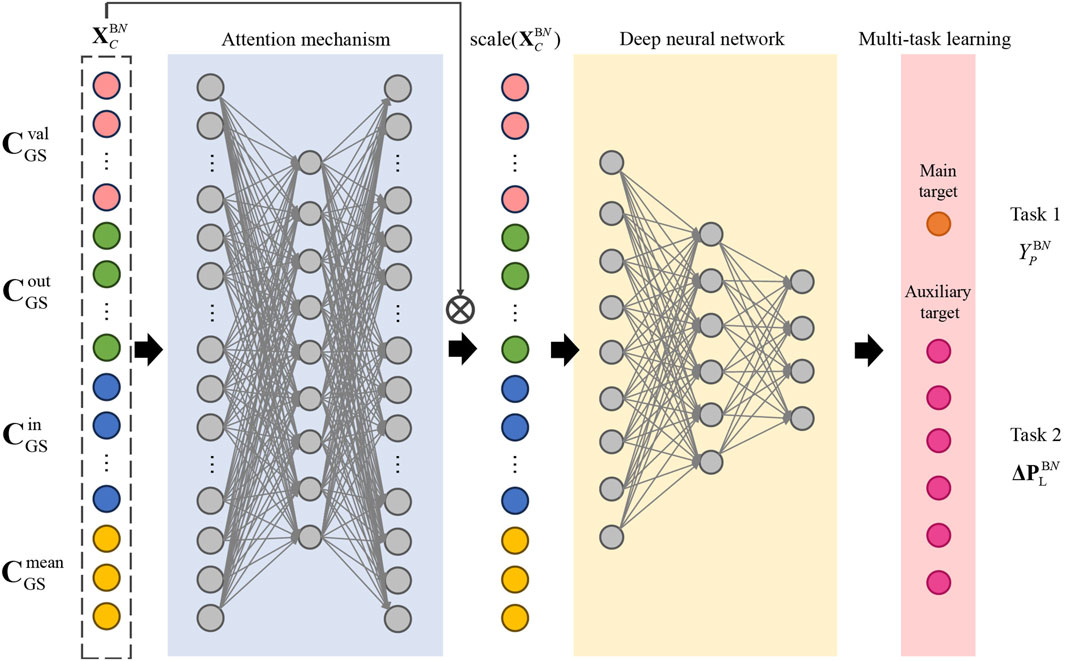
Figure 3. The structure block diagram of MA-DNN.
3.5 Experimental environment
In terms of software selection, MATLAB 2018b is used as the development environment for power flow analysis. Additionally, the hybrid AC/DC power flow algorithm is improved based on the MATPOWER 7.0 algorithm package (Zimmerman et al., 2011).
All deep learning models are implemented in Python 3.7.3 with Numpy (version ≥1.16.4), SciPy (version ≥1.3.0), Matplotlib (version ≥3.1.1), Scikit-Learn (version ≥1.10.1), Statsmodels (version ≥0.12.2), XGBoost (version = 2.0.3) and Pandas (version ≥0.25.0). All models are trained in python package named Pytorch (version = 2.0) with one Graphics Processing Unit of NVIDIA TITAN RTX (24G).
4 Verification and discussion
In this section, the influence of the power correlation coefficients on the state variables for the power grid is analyzed firstly. Then, a characteristic analysis is performed between power correlation coefficients and the fluctuation of active power to determine the degree of association. On this basis, a DNN regression model of correlation coefficients and power flow fluctuations is established. Eventually, the prediction accuracy and computational efficiency of the modified DNN model based on multi-task learning and attention mechanisms are evaluated.
4.1 Effects of power correlation on power grid operation
To simulate the grid operation characteristics considering renewable energy integration, the IEEE 9-bus topology embedded with the wind and the photovoltaic (PV) farms is selected as the test model, as shown in Figure 4. The grid capacity reference value is 100 MVA, and the base voltage is 345 kV. The installed capacity of wind and PV farms connecting to buses 2 and 3 are 400 MW, which can avoid additional interference factors caused by the different capacity ratios.
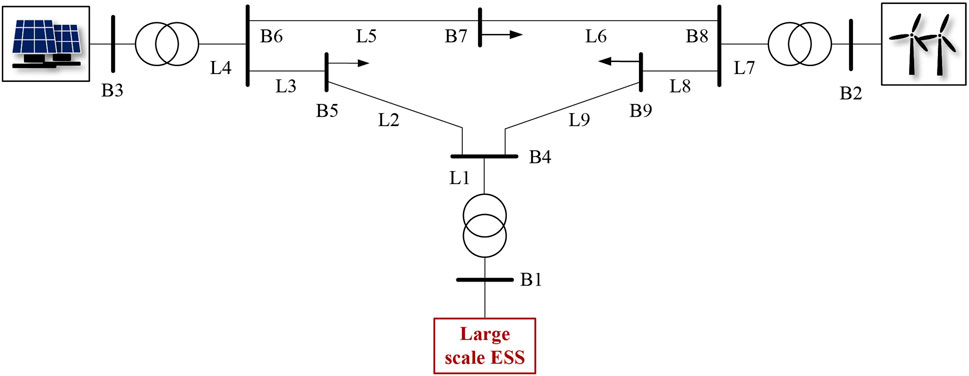
Figure 4. Grid topology for the test case.
By increasing the correlation between wind and PV output power from −0.5 to 0.9, the effect of raising source-end power correlation on grid state variables can be observed in Figure 5. “std” represents the standard deviation of the values. “Ps” and “Qs” represent the active and reactive power of the energy storage power station. “P” and “Q” denote the active and reactive power of each branch. “Va” and “Vm” represent the voltage phase angle and voltage amplitude of the bus.
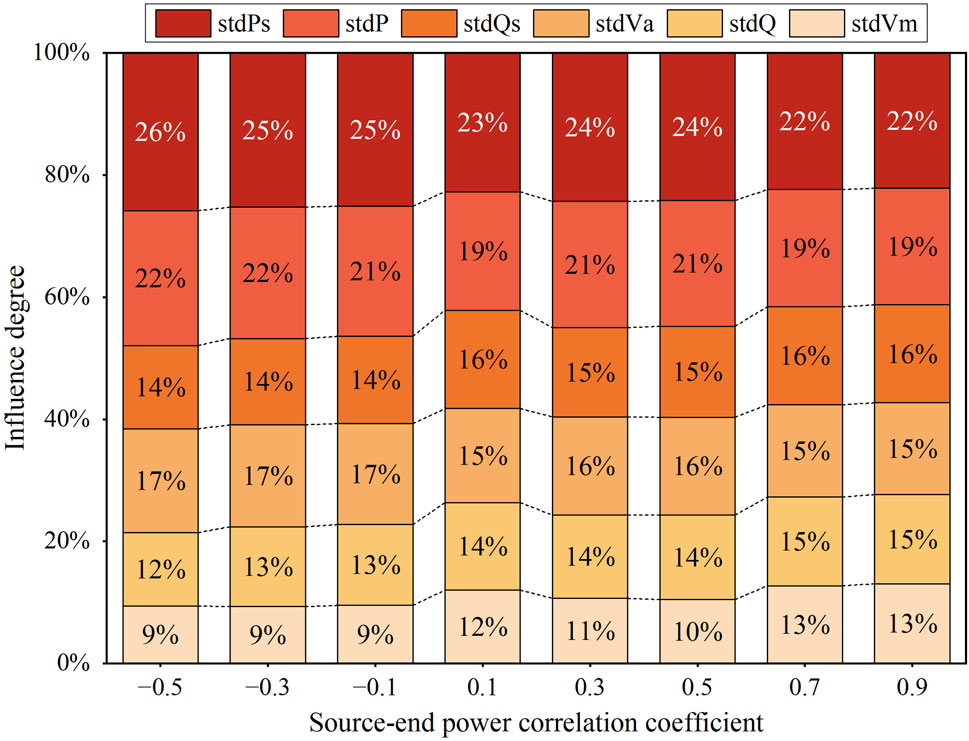
Figure 5. The influence degree of source-end power correlation on power grid state variables.
As shown in Figure 5, in the process of power correlation enhancement, the power standard deviation of the energy storage bus is slightly more affected than that of the branches. It is necessary to ensure that the statistical characteristics of meteorological data can be inherited when constructing different power correlation scenarios. Hence, the active power standard deviation of branches 4 and 7, which are the source-end power transmission lines, is close to 0, so the change rate of the power standard deviation of the branch is reduced. With the increase of source-end power correlation, the standard deviation of active power from the energy storage station and branches have the most apparent gain effect, reaching 23.88% and 20.50%. In addition, the standard deviation of voltage amplitudes, which is least affected by the enhancing correlation, accounts for 10.75% of the variation. Therefore, the following contents revolve around the influence of power correlation coefficients on active power fluctuations.
In the correlation analysis process depicted in Figure 5, the consideration is limited to the impact arising from changes in source-side power correlation, overlooking the power correlation among each branch within the power grid. As a result, the response level of the energy storage station to power flow fluctuations in other branches cannot be obtained. Furthermore, this would result in the system being unable to effectively mitigate the active power fluctuations. The impact of grid-side power correlation coefficients on active power fluctuations can be found in Supplementary Material SB. To quantify the correlation between the output power of the energy storage power station and the power flow in other lines, this paper proposes the power correlation coefficient. Simultaneously, the active power fluctuations generated from the connection of an individual renewable energy power station to the bus is taken as a metric to assess its impact on the grid.
To evaluate whether the power correlation coefficients can characterize the correlation between energy storage output power and other branches, Figure 6 conducts a characteristic analysis of the power correlation coefficients and power flow fluctuations in IEEE 9-bus system.

Figure 6. Relevance analysis (A) and significance analysis (B) between power correlation coefficients and power flow fluctuations in IEEE 9-bus system.
In Figure 6, the horizontal axis labeled “L1-L9” represents power flow fluctuations in the respective branches, while “SUM” denotes power flow fluctuations across the entire power grid. The vertical axis, where “PO” and “PI” respectively represent the branch power considering the outflowing and inflowing directions to the bus. “PN” denoting the numerical value of branch power flowing through the bus, is measured in absolute values of branch power. “ESS” denotes output power of the energy storage station. For example, “ESS-PO-L3” represents the correlation coefficient between the energy storage output power and the branch power L3 in the outflowing direction of the bus.
In Figure 6A, when the absolute value of the correlation coefficient is greater than 0.4, it indicates a significant correlation between the power correlation coefficients and power flow fluctuations. In Figure 6B, p-value less than 0.05 represents that the correlation analysis of features is statistically significant. There are characteristic correlations between the power correlation coefficients and power flow fluctuations by observing the distribution diagram of correlation coefficients and p-values. Notably, L2, L3, L5, L6, L8, and L9 exhibit a higher level of significant correlation. The exclusion of L4 and L7 is attributed to the fact that they represent branches associated with wind power and PV output power, respectively. The output power of both is solely dependent on meteorological factors and is unrelated to power grid fluctuations.
During the feature analysis process, it is found that the power correlation coefficients exhibit the highest correlation with the power flow fluctuations of L2 and L9, reaching 0.82 and 0.80, respectively. This is because branches L2 and L9 are the main transmission routes for power exchange by energy storage stations. When new fluctuating sources are integrated into the grid, the energy storage station responds to power disturbances by switching between the charging and discharging states, leading to an increase in the number of power reversals in branches L2 and L9. Therefore, the power correlation coefficients of the energy storage station exhibit the highest correlation with the power fluctuations of L2 and L9.
To observe the characteristic analysis results of the power correlation coefficients, we categorize the feature analysis objects into strong correlation and weak correlation groups based on the partitioning rules provided in Section 3.3. Table 1 exhibits the proportion of feature groups. In IEEE 9-bus system, strongly correlated features constitute the majority, reaching 92% in proportion. Hence, using the power correlation coefficients can effectively capture power flow fluctuations in the entire grid.

Table 1. The characteristic analysis results of the power correlation coefficients.
4.2 Further correlation analysis of multi factor and large-scale grid
To assess the correlation between the power correlation coefficients and power flow fluctuations in diverse power grid topologies, the IEEE 14-bus system is chosen as the analytical case, as illustrated in Figure 7. The setting of the power grid baseline values is consistent with Figure 4. The installed capacities for wind farms and PV power stations are both configured at 200 MW.
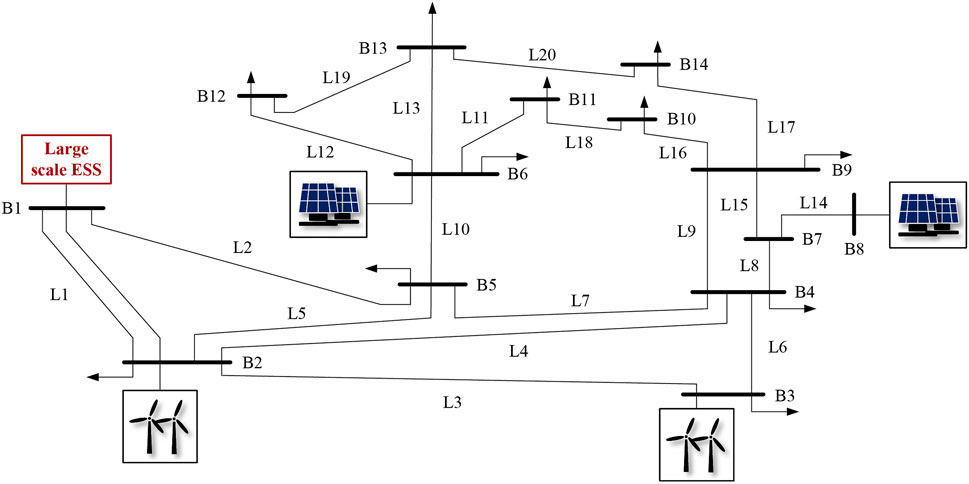
Figure 7. Topology diagram of IEEE 14-bus system.
For single-factor analysis, we employed the Spearman correlation coefficient to calculate the correlation of each feature with power flow fluctuations along with the results of significance tests, as shown in Figure 8. It is noteworthy that the significance level of the correlation coefficient and the range of p-values with statistical significance are set to be consistent with Figure 6. The meanings of the horizontal and vertical axes in Figure 8 are the same as in Figure 6. From Figure 8, except for L1 and L14, it exhibits more pronounced correlation between the power correlation coefficients and the power flow fluctuations in other branches.
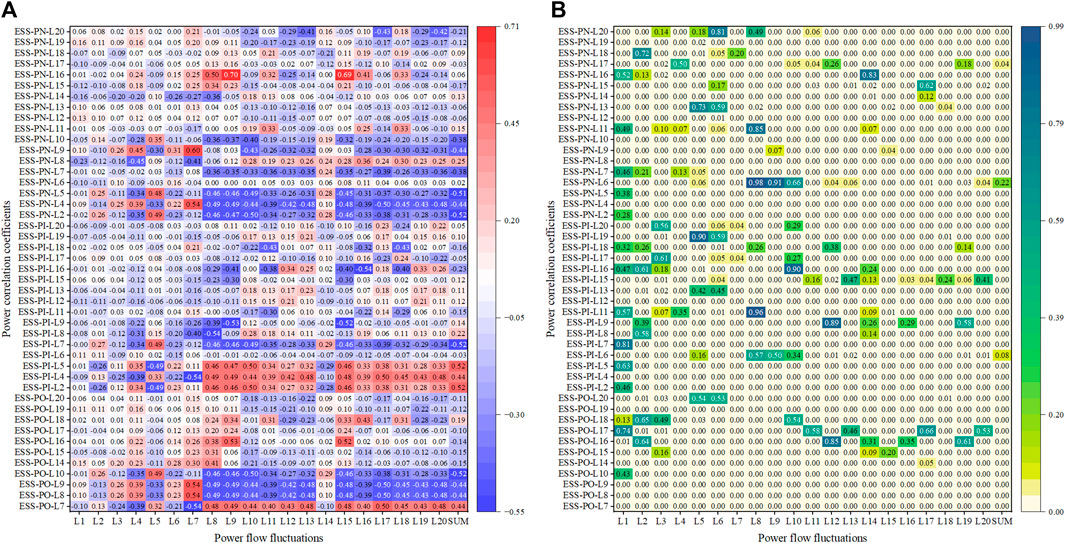
Figure 8. Relevance analysis (A) and significance analysis (B) of power correlation coefficients in IEEE 14-bus system.
In Figure 8, it can be noted that the power correlation coefficients exhibit the highest correlation with the power fluctuations of branches L9 and L15, both exceeding 0.60. The main reason is that the load is primarily distributed from B9 to B13 in the IEEE 14-bus system. L9 and L15, as branches connecting dense load distribution areas, are responsible for transmitting a significant amount of unbalanced power in the power grid. Therefore, the power correlation coefficients of the energy storage station exhibit the highest degree of correlation with L9 and L15.
Additionally, to provide a more intuitive representation of the relationship between features and power flow fluctuations, we categorize all features into strong correlation and weak correlation groups. It is worth noting that the partitioning rules for these two feature groups are the same as those in Table 1. According to the statistical results, the proportion of strongly correlated groups reaches 51%, while the proportion of weakly correlated groups is 38%.
In contrast to single-feature analysis, only the relationship between individual power correlation coefficients and power flow fluctuations is considered. Multi-factor feature analysis can verify whether all features are mapped to power flow fluctuations. It is assumed that if the power correlation coefficients can accurately predict power flow fluctuations with high precision, which demonstrates the existence of a causal relationship between them. As shown in Figure 9, the regression results of active power fluctuation in branches based on the power correlation coefficients are very close to the actual values (MSE is equal to 7).
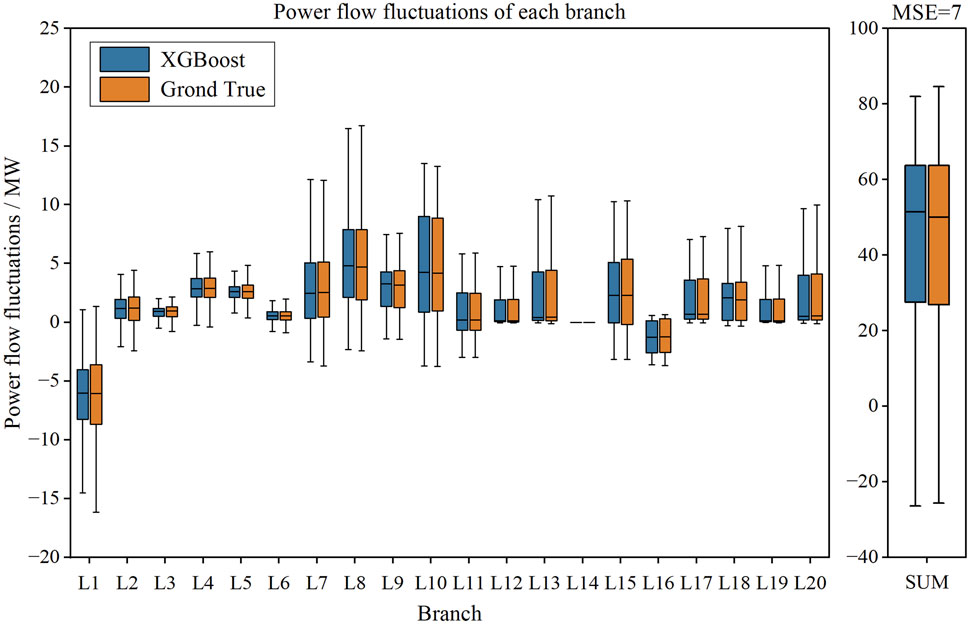
Figure 9. The regression prediction results of multi-factor analysis.
In the multi-factor feature analysis process in Figure 9, it can be observed that the regression prediction difficulty of power fluctuations for branches L1, L2, and L5 based on the power correlation coefficient of energy storage is the highest. This is because they are the main interconnection lines for external connections, used to transmit the unbalanced power absorbed by the energy storage station. As the number of disturbance sources integrated into the grid increases, it becomes more challenging to capture the power fluctuation regularity of these branches.
Figure 10 extracts the top ten influential power correlation coefficients during the regression prediction process. The importance of each feature was characterized by counting its occurrences in the regression decision tree. It is evident that the correlation coefficients between energy storage output power and active power in L17, L18, L19, and L20 are the most important features. This is because these branches are in dense load regions in IEEE 14-bus system. When the renewable energy source is integrated into the grid, the unbalanced power fluctuations around the load buses become more frequent, which are absorbed by the energy storage station.
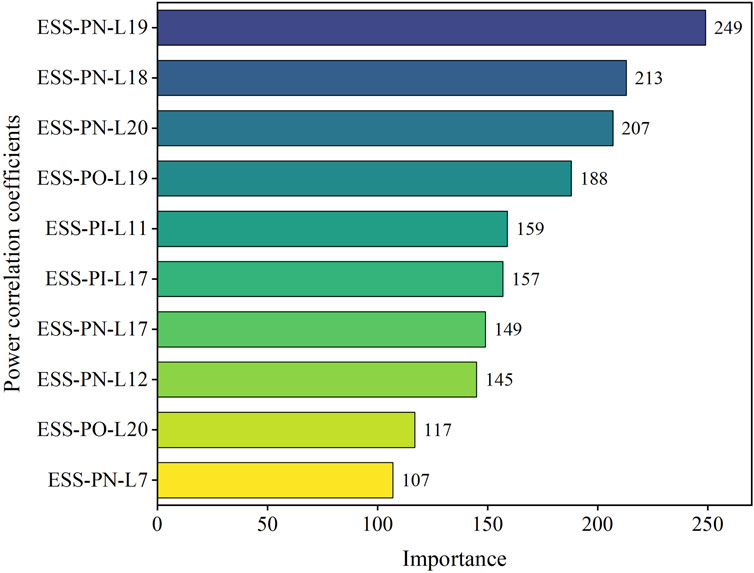
Figure 10. The importance ranking of features in multi-factor analysis.
4.3 Performance analysis of MA-DNN model-based solution method
In Sections 4.1, 4.2, a verification analysis was conducted on the causal relationship between the power correlation coefficients and power flow fluctuations in the independent IEEE 9-bus and IEEE 14-bus systems. The results indicate a significant correlation between them. To explore the possibility of establishing a mapping relationship between the correlation coefficients and power flow fluctuations in a more complex grid structure, we consider the IEEE 23-bus system, formed by the interconnection of IEEE 9-bus and IEEE 14-bus systems, as illustrated in Figure 11. Differing from the analysis cases of independent power grids, the power flow fluctuations refer to the subtraction of the active power standard deviations from two independent power grids after interconnection and before interconnection. The complexity of the patterns in power flow fluctuations in this scenario is much greater than the scenario of connecting a single renewable energy power station.
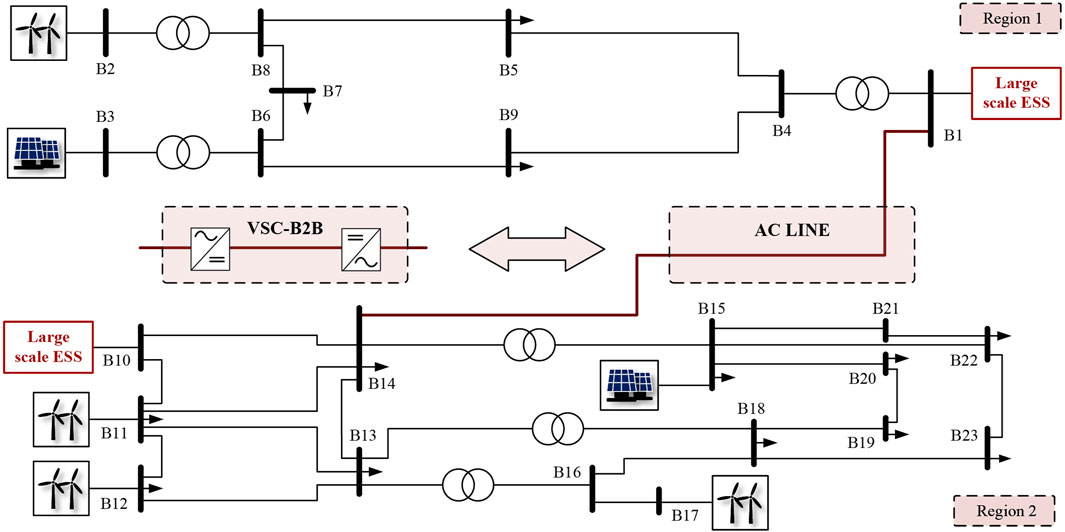
Figure 11. Schematic diagram of the regional power grid interconnection.
In this section, the regression prediction for power flow fluctuations is performed based on the MA-DNN model, using the power correlation coefficients. Distinguishing from the traditional power grid analysis methods based on the PPF, this section aims at enhancing the computational efficiency of power flow fluctuations in the grid through the regression prediction models. Subsequently, with an efficient and accurate mapping approach, the MA-DNN model provides data support for the selection of interconnection schemes of regional power grids with the minimum power flow fluctuation.
To validate the performance of the proposed method, it is necessary to select typical power flow algorithms for comparative analysis. When performing power flow analysis containing renewable energy power stations, it is essential to consider the correlation between random variables. This approach can improve the computational accuracy of the grid analysis results. Currently, methods for handling non-linear relationships between random variables mainly include Nataf transformation (Nataf), LHS, and UT methods. Therefore, we select these methods as contrast groups for evaluating the model’s performance, as shown in Table 2. Nataf is a calculation method based on the MCS method (with 8000 samples) and is typically used as a benchmark for the most accurate calculation results.
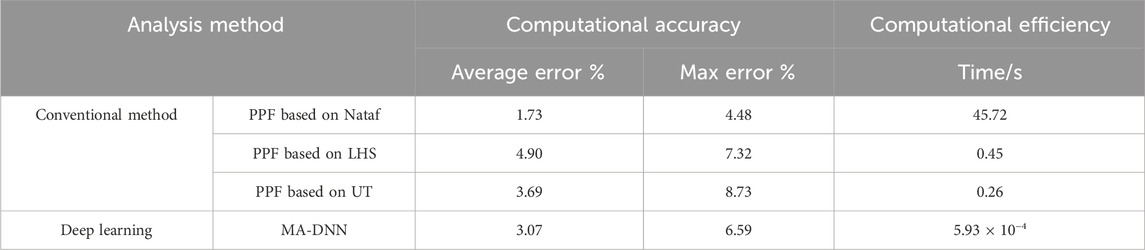
Table 2. Performance comparison of the proposed algorithm.
From Table 2, the MA-DNN model takes 5.93 × 10⁻⁴ s to perform a single power fluctuation assessment, exhibiting a computational efficiency improvement of 758.85 times and 438.45 times compared to the LHS and the UT algorithms. Meanwhile, compared to the LHS and UT algorithms, the computational accuracy of the MA-DNN model is improved by 37.35% and 16.80%, respectively. Therefore, the MA-DNN model proposed in this manuscript can efficiently and accurately evaluate the active power fluctuations of the power grid.
To evaluate the roles of various modules in the proposed algorithm, ablation experiments are performed, and the results are shown in Table 3. It is noted that the detailed impact of different parameters on the model is recorded in Supplementary Material SC. Compared to the DNN method, the MA-DNN method has reduced the MSE by 15.25%. This is because the MA-DNN model adopts an attention mechanism, allowing the regression model to automatically focus on more important data. Meanwhile, with the introduction of a multi-task learning mechanism in the MA-DNN model, it ensures that the model can avoid being trapped in the extremum of a single task by training on multiple tasks. Consequently, this enables the weights closer to the global optimum, enhancing the regression prediction accuracy of the MA-DNN model.
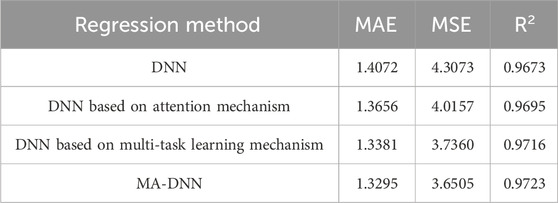
Table 3. Ablation experiment of the models.
Additionally, considering the advantages of the MA-DNN regression prediction model in the efficiency of assessing power flow fluctuations in the power grid, it can rapidly select the optimal interconnection points based on the power correlation coefficients before interconnection, minimizing the power flow fluctuations after interconnection.
By comparing with actual values, the probability of MA-DNN model selecting the optimal interconnection scheme among the 420 sets of data is 94.05%, while the probability of obtaining the suboptimal interconnection scheme is 5.95%. The power flow fluctuation in the suboptimal interconnection scheme is only 5.01% higher than that in the optimal scheme.
To evaluate the performance of the proposed model in various power grid topologies, the AC interconnection topology depicted in Figure 11 is replaced with the VSC back-to-back interconnection topology. Figure 12 provides a comparative analysis of the computed results for the power flow fluctuations based on the MA-DNN regression prediction model in both AC interconnection and VSC interconnection scenarios.
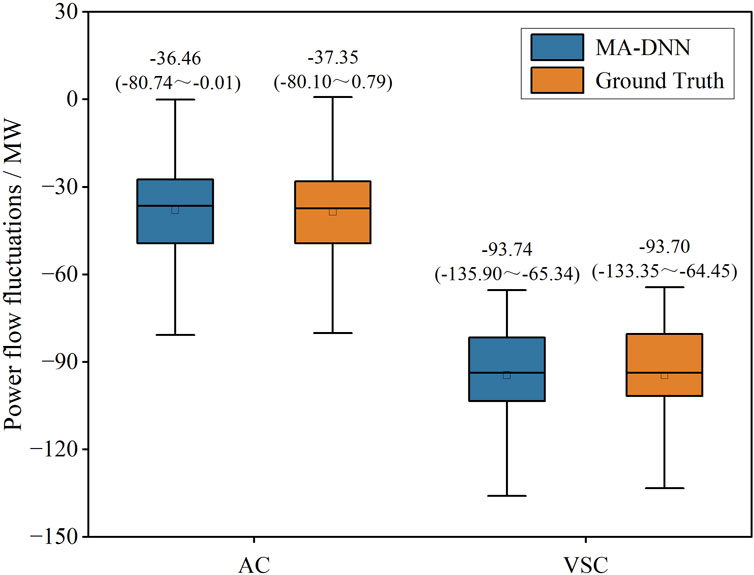
Figure 12. Computational accuracy of regression prediction model in different scenarios. The numerical values in the Figure: median (minimum maximum).
In Figure 12, the closer the predicted value of the MA-DNN model is to the Ground truth, the higher the regression prediction accuracy of the MA-DNN model is. In the AC interconnection scenario, the medians of MA-DNN predicted results and Ground Truth are −36.46 (Range: 80.74 to −0.01) and −37.35 (Range: −80.10 to 0.79), respectively. The values of both are very close. This phenomenon also exists in the VSC interconnection scenario, with medians of −93.74 (Range: −135.90 to −65.34) and −93.70 (Range: −133.35 to −64.45), respectively. It can be observed that even if the interconnection topology is replaced by the VSC back-to-back structure, the MA-DNN model can still predict power fluctuations with high accuracy.
5 Conclusion
To efficiently and accurately assess the power flow fluctuation in the power grid, this paper proposes a deep learning-based correlation analysis methodology for the PPF considering renewable energy and energy storage. From the perspectives of single-factor and multi-factor correlation, this methodology first gives the Spearman correlation coefficient and XGBoost, which can be employed for feature analysis in different power grid topologies. Based on this analysis, the MA-DNN regression prediction model is developed to establish a mapping relationship between the correlation coefficients and power flow fluctuations in the power grids with AC or VSC interconnections.
1) A scheme based on grid-side power correlation coefficients to reduce active power fluctuations caused by renewable energy integration has been presented. The results show that in IEEE 9-bus system and IEEE 14-bus system, compared with the source-side power correlation coefficients, considering the grid-side power correlation coefficients can effectively reduce the impact of renewable energy grid connection on the active power fluctuation of the grid, which is reduced by 13.21% and 13.22% respectively.
2) The proposed nonlinear correlation coefficients can effectively reflect the power flow fluctuations, specially for the energy storage outputs in the grid. The effectiveness of this approach is verified in the IEEE 9-bus system, and the simulation results reveal that the proportion of strongly correlated features of the power flow reaches 92%, while the proportion of weakly correlated features is 4%. Furthermore, this approach is also verified in the IEEE 14-bus system, which presents the proportion of 51% for the strongly correlated features, and 38% for the weakly correlated features.
3) The MA-DNN model which can efficiently and accurately evaluate power flow fluctuations is proposed. Compared with the LHS and UT methods, the computational accuracy of MA-DNN is increased by 37.35% and 16.80%, respectively. In the ablation experiment, the MSE for the regression prediction based on the MA-DNN model is reduced by 15.25%, when compared to the DNN model. Regarding the computational efficiency, compared to the LHS and UT methods, the MA-DNN computational speed increases by 758.85 times and 438.45 times, respectively.
In terms of limitations, the generalization ability of the proposed model under different power grid structures needs further verification and improvement. Meanwhile, the synergistic effects among multiple energy storage stations on the same bus are not considered in this paper, leaving room for improvement in the modeling of energy storage stations. In future research, we will explore quantitative characterization methods for the collaborative operation characteristics among energy storage stations and conduct structural optimization based on the MA-DNN model to enhance the predictive performance of the model across multiple scenarios.
This paper establishes an efficient and accurate mapping method between the power correlation coefficients and power flow fluctuations. Based on this, this paper contributes to rapidly identifying the power grid access points, so that minimal power flow fluctuations in the grid can be achieved. This work also contributes to reducing the demand for flexible power sources such as thermal power generation units in the grid. Simultaneously, the rapid regression prediction model proposed in this paper can provide data support for the formulation of power grid planning and operation schemes.
Data availability statement
The raw data supporting the conclusion of this article will be made available by the authors, without undue reservation.
Author contributions
XX: Conceptualization, Methodology, Visualization, Writing–original draft, Writing–review and editing, Software. LX: Data curation, Formal Analysis, Project administration, Supervision, Writing–review and editing. HY: Formal Analysis, Funding acquisition, Validation, Writing–review and editing, Methodology.
Funding
The author(s) declare financial support was received for the research, authorship, and/or publication of this article. This study is supported by the National Natural Science Foundation of China (NSFC, 52177123).
Conflict of interest
The authors declare that the research was conducted in the absence of any commercial or financial relationships that could be construed as a potential conflict of interest.
Publisher’s note
All claims expressed in this article are solely those of the authors and do not necessarily represent those of their affiliated organizations, or those of the publisher, the editors and the reviewers. Any product that may be evaluated in this article, or claim that may be made by its manufacturer, is not guaranteed or endorsed by the publisher.
Supplementary material
The Supplementary Material for this article can be found online at: https://www.frontiersin.org/articles/10.3389/fenrg.2024.1365885/full#supplementary-material
References
Alcantara, A., Galvan, I. M., and Aler, R. (2022). Direct estimation of prediction intervals for solar and wind regional energy forecasting with deep neural networks. Eng. Appl. Artif. Intell. 114, 105128. doi:10.1016/j.engappai.2022.105128
Amasyali, K., and El-Gohary, N. (2021). Machine learning for occupant-behavior-sensitive cooling energy consumption prediction in office buildings. Renew. Sustain. Energy Rev. 142, 110714. doi:10.1016/j.rser.2021.110714
Chen, T., and Guestrin, C. (2016). “Xgboost: a scalable tree boosting system,” in Proceedings of the 22nd acm sigkdd international conference on knowledge discovery and data mining, San Francisco, CA, USA, 785–794.
Costoya, X., de Castro, M., Carvalho, D., and Gömez-Gesteira, M. (2023). Assessing the complementarity of future hybrid wind and solar photovoltaic energy resources for North America. Renew. Sustain. Energy Rev. 173, 113101. doi:10.1016/j.rser.2022.113101
Guezgouz, M., Jurasz, J., Chouai, M., Bloomfield, H., and Bekkouche, B. (2021). Assessment of solar and wind energy complementarity in Algeria. Energy Convers. Manag. 238, 114170. doi:10.1016/j.enconman.2021.114170
Guo, Y., Ming, B., Huang, Q., Yang, Z. W., Kong, Y., and Wang, X. X. (2023). Variation-based complementarity assessment between wind and solar resources in China. Energy Convers. Manag. 278, 116726. doi:10.1016/j.enconman.2023.116726
Hu, J., Shen, L., and Sun, G. (2018). “Squeeze-and-excitation networks,” in Proceedings of the IEEE conference on computer vision and pattern recognition, Salt Lake City, UT, USA, 7132–7141.
Huang, K. D., Luo, P., Liu, P., Suk, J., Wang, Y. T., Xu, W. F., et al. (2022). Improving complementarity of a hybrid renewable energy system to meet load demand by using hydropower regulation ability. Energy 248, 123535. doi:10.1016/j.energy.2022.123535
Ifaei, P., Karbassi, A. R., Lee, S., and Yoo, C. (2017). A renewable energies-assisted sustainable development plan for Iran using techno-econo-socio-environmental multivariate analysis and big data. Energy Convers. Manag. 153, 257–277. doi:10.1016/j.enconman.2017.10.014
Jung, C. S. P., and Schindler, D. (2022). Projections of energy yield- and complementarity-driven wind energy expansion scenarios in the European Union. Energy Convers. Manag. 269, 116160. doi:10.1016/j.enconman.2022.116160
Kim, G., and Hur, J. (2021). Probabilistic modeling of wind energy potential for power grid expansion planning. Energy 230, 120831. doi:10.1016/j.energy.2021.120831
Li, J. L., Ho, M. S., Xie, C. P., and Stern, N. (2022a). China's flexibility challenge in achieving carbon neutrality by 2060. Renew. Sustain. Energy Rev. 158, 112112. doi:10.1016/j.rser.2022.112112
Li, P. Y., Lian, J. J., Ma, C., and Zhang, J. L. (2023). Complementarity and development potential assessment of offshore wind and solar resources in China seas. Energy Convers. Manag. 296, 117705. doi:10.1016/j.enconman.2023.117705
Li, W., Zhang, S. H., and Lu, C. (2022b). Exploration of China's net CO2 emissions evolutionary pathways by 2060 in the context of carbon neutrality. Sci. Total Environ. 831, 154909. doi:10.1016/j.scitotenv.2022.154909
Ma, Q., Tong, X. Q., Li, J. H., and Xiong, G. (2023). Static voltage stability influence evaluation method of distribution network including electric vehicles based on LHS-PPF. Energy Rep. 9, 277–287. doi:10.1016/j.egyr.2023.04.095
Mazzeo, D., Matera, N., De Luca, P., Baglivo, C., Congedo, P. M., and Oliveti, G. (2021). A literature review and statistical analysis of photovoltaic-wind hybrid renewable system research by considering the most relevant 550 articles: an upgradable matrix literature database. J. Clean. Prod. 295, 126070. doi:10.1016/j.jclepro.2021.126070
Nyenah, E., Sterl, S., and Thiery, W. (2022). Pieces of a puzzle: solar-wind power synergies on seasonal and diurnal timescales tend to be excellent worldwide. Environ. Res. Commun. 4 (5), 055011. doi:10.1088/2515-7620/ac71fb
Pannakkong, W., Harncharnchai, T., and Buddhakulsomsiri, J. (2022). Forecasting daily electricity consumption in Thailand using regression, artificial neural network, support vector machine, and hybrid models. Energies 15 (9), 3105. doi:10.3390/en15093105
Parizad, A., and Hatziadoniu, C. (2022). Deep learning algorithms and parallel distributed computing techniques for high-resolution load forecasting applying hyperparameter optimization. IEEE Syst. J. 16 (3), 3758–3769. doi:10.1109/jsyst.2021.3130080
Ren, G. R., Wang, W., Wan, J., Hong, F., and Yang, K. (2023). A novel metric for assessing wind and solar power complementarity based on three different fluctuation states and corresponding fluctuation amplitudes. Energy Convers. Manag. 278, 116721. doi:10.1016/j.enconman.2023.116721
Rezaeian-Marjani, S., Talavat, V., and Galvani, S. (2022). Impact of soft open point (SOP) on distribution network predictability. Int. J. Electr. Power and Energy Syst. 136, 107676. doi:10.1016/j.ijepes.2021.107676
Schindler, D., Schmidt-Rohr, S., and Jung, C. (2021). On the spatiotemporal complementarity of the European onshore wind resource. Energy Convers. Manag. 237, 114098. doi:10.1016/j.enconman.2021.114098
Soukissian, T. H., Karathanasi, F. E., and Zaragkas, D. K. (2021). Exploiting offshore wind and solar resources in the Mediterranean using ERA5 reanalysis data. Energy Convers. Manag. 237, 114092. doi:10.1016/j.enconman.2021.114092
Stéphanie, B., Pales, A. F., McGlade, C., Remme, U., Wanner, B., Varro, L., et al. (2021). Net zero by 2050 - a roadmap for the global energy sector. Paris, France: International Energy Agency.
Yang, L. B., Nguyen, H., Bui, X. N., Nguyen-Thoi, T., Zhou, J., and Huang, J. N. (2021). Prediction of gas yield generated by energy recovery from municipal solid waste using deep neural network and moth-flame optimization algorithm. J. Clean. Prod. 311, 127672. doi:10.1016/j.jclepro.2021.127672
Zeng, X., Nazir, M. S., Khaksar, M., Nishihara, K., and Tao, H. (2021). A day-ahead economic scheduling of microgrids equipped with plug-in hybrid electric vehicles using modified shuffled frog leaping algorithm. J. Energy Storage 33, 102021. doi:10.1016/j.est.2020.102021
Zhang, K., Zhang, W. R., Shi, Q. Y., Zhang, J., and Yuan, J. H. (2023). Coupling effects of cross-region power transmission and disruptive technologies on emission reduction in China. Resour. Conservation Recycl. 189, 106773. doi:10.1016/j.resconrec.2022.106773
Zhang, Y., and Yang, Q. (2018). An overview of multi-task learning. Natl. Sci. Rev. 5 (1), 30–43. doi:10.1093/nsr/nwx105
Keywords: correlation analysis, deep neural networks, probabilistic power flow, renewable energy, energy storage
Citation: Xia X, Xiao L and Ye H (2024) Deep learning-based correlation analysis for probabilistic power flow considering renewable energy and energy storage. Front. Energy Res. 12:1365885. doi: 10.3389/fenrg.2024.1365885
Received: 05 January 2024; Accepted: 26 March 2024;
Published: 08 April 2024.
Edited by:
Jianwen Zhang, Shanghai Jiao Tong University, ChinaReviewed by:
Gang Shi, Shanghai Jiao Tong University, ChinaDayi Li, Huazhong University of Science and Technology, China
Copyright © 2024 Xia, Xiao and Ye. This is an open-access article distributed under the terms of the Creative Commons Attribution License (CC BY). The use, distribution or reproduction in other forums is permitted, provided the original author(s) and the copyright owner(s) are credited and that the original publication in this journal is cited, in accordance with accepted academic practice. No use, distribution or reproduction is permitted which does not comply with these terms.
*Correspondence: Liye Xiao, xiao@mail.iee.ac.cn; Hua Ye, yehua@mail.iee.ac.cn