Application of machine learning in ultrasonic diagnostics for prismatic lithium-ion battery degradation evaluation
 Qiying Wang
 Da Song
 Xingyang Lin1,3
  Hanghui Wu
- 1School of Mechanical and Automotive Engineering, Ningbo University of Technology, Ningbo, Zhejiang, China
- 2School of Automobile, Chang’an University, Xi’an, Shanxi, China
- 3School of Energy and Electrical Engineering, Chang’an University, Xi’an, Shanxi, China
- 4China Academy of Machinery Ningbo Academy of Intelligent Machine Tool Co., Ltd., Ningbo, Zhejiang, China
Lithium-ion batteries are essential for electrochemical energy storage, yet they undergo progressive aging during operational lifespan. Consequently, precise estimation of their state of health (SOH) is crucial for effective and safe operation of energy storage systems. This paper investigates the viability of ultrasound-based methods for assessing the SOH of prismatic lithium-ion batteries. In the experimental framework, a designated prismatic lithium-ion battery was subjected to numerous charging and discharging cycles using a battery cycling system. Subsequently, ultrasonic detection experiments were conducted to record the waveforms of the transmitted and received signals. These signals were then processed through wavelet transforms to extract signal amplitude and time-of-flight data. To analyse these data, we applied four algorithms: linear regression, support vector machines, Gaussian process regression, and neural networks. The predictive performance of each algorithm was evaluated through extensive experimentation and analysis. The combination of ultrasonic signals with computational models has emerged as a robust technique for precise battery degradation assessment, suggesting its potential as a standard in battery health evaluation methods.
1 Introduction
In the last decade, there have been substantial advancements in lithium-ion battery technology, leading to its widespread utilization in various new energy devices, such as mobile phones, laptops, electric motorcycles, and electric vehicles. Nevertheless, lithium-ion batteries exhibit gradual aging during their operational lifespan. This aging phenomenon manifests itself through a reduction in the maximum usable capacity and a shortened service life. The quantification of battery aging and the detection of the state of health (SOH) of lithium-ion batteries are crucial not only for mitigating safety hazards associated with declining battery capacity and maximum usable power but also for evaluating the viability of reusing retired electric vehicle batteries. Furthermore, assessing micro-health parameters, which represent the condition of active materials and electrolyte, is essential for a detailed understanding of the battery’s internal health state, thereby providing a comprehensive measure of SOH (Xu et al., 2023).
One innovative approach to assess the SOH of lithium-ion batteries involves the application of ultrasonic detection technology. This method offers a rapid, cost-effective, and nondestructive means of evaluating the health of lithium-ion batteries in situ. Pioneering work in this field can be attributed to the Steingart research team at Princeton University. Hsieh et al. (2015), for instance, entered this domain by developing a cobalt lithium/graphite battery. Utilizing 2.25 MHz contact ultrasonic probes placed on either side of the battery, Hsieh identified variations in the received signal strength, which correlated with the battery’s state of charge (SOC). Notably, the results indicate that at a low SOC, the signal strength weakens as the health status of the battery deteriorates, while at a high SOC, the signal strength increases. Zhang et al. (2023) have further advanced our understanding by introducing non-destructive methods for the joint estimation of SOC and temperature using ultrasonic reflected waves, highlighting their importance in preventing thermal runaway and enhancing the safety of lithium battery energy storage systems. Meng et al. (2022) established a mesoscale physics-based model of lithium-ion batteries is established to explain the change of signal amplitude which carries the multiple reflections of ultrasonic waves within the multi-layered structure of the cell. Davies et al. (2017) took a synergistic approach by incorporating ultrasonic wave propagation time of flight (TOF) data within a lithium-ion battery alongside voltage data during the battery’s charging and discharging cycles. Through the application of machine learning techniques, Davies achieved commendable accuracy in predicting both the battery SOH and SOC. His experiments underscored the correlation between these parameters, and (Knehr et al., 2018) further elucidated the interaction between the TOF of ultrasonic waves within the battery and its SOH, emphasizing the profound influence of the battery’s SOC. Kim et al. (2020), in his examination of soft pack batteries, employed a single-sided dual-crystal straight probe for ultrasonic testing. He observed a gradual decrease in battery capacity with increasing cycle count, along with a simultaneous increase in the ultrasonic wave propagation time within the battery.
Notably, researchers have also initiated preliminary investigations into the mechanics governing ultrasonic wave propagation within lithium-ion batteries. For instance, Gold et al. (2017) applied the Biot theory to construct an analytical wave propagation model. This model allowed us to observe how changes in the SOC might affect the propagation time of ultrasonic waves, considering the battery as a liquid-filled porous medium. Li and Zhou, (2019) investigated the morphological changes within the internal air pockets of batteries. He constructed a finite element model of the microstructure of lithium-ion batteries and employed ultrasonic testing to detect battery failure defects. Furthermore, Princeton’s Bhadra et al. (2016) expanded this acoustic research to include zinc-manganese oxide AA batteries. In a notable extension of this approach, Chou et al. (2016), also from the same research team, integrated this approach into the monitoring of the SOC for vanadium oxide redox flow batteries.
(Ladpli et al., 2017; Ladpli et al., 2018) initiated a study involving the utilization of piezoelectric ceramic plates for ultrasound diagnostics of lithium-ion batteries. In contrast, Wu et al. (2019) employed a twin-crystal piezoelectric ceramic plate to diagnose two soft pack batteries with capacities of 1.8 Ah and 0.7 Ah. The study’s findings revealed a significant lengthening of ultrasound propagation time as the battery capacity decreased. Notably, for the 1.8 Ah battery, the signal strength increased as the capacity decreased, while the opposite trend was observed for the 0.7 Ah variant. Bommier et al. (2020a) focused on NMC/SiGr composite material soft pack batteries and employed ultrasound transmission signals from piezoelectric ceramic plates. This analysis indicated that as the battery capacity weakened, internal gas formation and accumulation occurred, leading to a consistent reduction in the ultrasound signal strength. In a subsequent study, Bommier et al. (2020b) conducted charge‒discharge experiments at various rates (0.5C, 0.7C, 0.875C, and 1C), revealing the substantial influence of the battery’s charge‒discharge rate on the ultrasound propagation time.
(Chang et al., 2020a) explored the effects of temperature on ultrasound performance during the charging and discharging of lithium-ion batteries at different temperatures by comparing the growth rate of the SEI film. Popp et al. (2019) employed a 20 kHz piezoelectric ceramic plate and established a laminated structure analytical model based on multiple scattering theory. Copley et al. (2021) proposed a novel peak calculation method, enabling the prediction of the SOC of lithium-ion batteries following ultrasonic pulse measurements using a proximally placed piezoelectric ceramic plate. McGee, (2019) observed a sharp change in ultrasound signal propagation time after overcharging and discharging a battery, similar to Oca et al. (2019), who noted a significant decrease in ultrasound signal strength for overcharged or overly discharged batteries and evaluated their impact on battery health. Pham et al. (2020) combined X-ray analysis with ultrasound diagnostics to visualize the gas formation process during battery aging and identify the layering of dense anode and cathode layers, causing ultrasonic energy dissipation and signal attenuation. Zappen et al. (2020) detected a significant decrease in ultrasound signal strength during thermal abuse in a soft pack battery, highlighting the potential of acoustic methods in identifying thermal abuse risks in batteries. This collective body of research underscores the potential of ultrasound diagnostics as a powerful tool for understanding the complex workings of lithium-ion batteries, with implications for enhancing performance, safety, and longevity.
Historically, most ultrasonic research on lithium-ion batteries has been confined to pouch cells and cylindrical batteries. However, given the critical role of prismatic cells in electric vehicle power systems, they have emerged as subjects of significant importance. Our study focused on ultrasound-based methodologies for assessing the health status of lithium-ion batteries, specifically for prismatic cells. In this study, a battery cycling system was used to charge and discharge lithium-ion batteries through a series of cycles. Subsequently, ultrasonic experiments were conducted on these batteries after cycling. The acquired data underwent wavelet pack transformation to eliminate noise, and key parameters were extracted to predict the SOH of the selected prismatic cells. These data were then partitioned for machine learning analysis using MATLAB’s regression tool, where various models were tested and compared for accuracy. Our methodology, tailored specifically to the characteristics of prismatic batteries, aims to enhance the understanding of their behavior and improve the accuracy of health assessments, setting a foundation for future advancements in battery technology and sustainability. These results signify the development of a novel, cost-effective, direct, and universally applicable method for obtaining the SOH of prismatic lithium-ion batteries.
2 Experimental methods
2.1 Experimental setup
In the experimental setup, input signals were generated using a Feeltech 6,600 waveform generator, while the output waveform signals were provided by an Owon VDS 1022 oscilloscope. Both the input and output signals were recorded and displayed using laptop control software. A dual-crystal straight probe with a central frequency of 50 kHz, manufactured by Daobo Company, was thoughtfully selected and employed. This probe was strategically positioned on one side of the battery’s surface to facilitate thorough ultrasonic inspection of the battery. The ultrasound waves generated by the transducer pass through the battery, reflected on the end surface and received by the receiver. The interaction of these waves with the battery’s internal components alters their properties, such as amplitude and time of flight, which are key indicators of the battery’s SOH. This method allows for a rapid evaluation of the battery’s internal structure and health without requiring disassembly or direct electrical measurement.
The research specimen chosen for this study was a prismatic lithium-ion battery with a rated voltage of 4.35 V and an impressive rated capacity of 50 Ah and geometry dimensions of 148*98*26 mm. The experiments were conducted in a lab environment with a controlled temperature of 23°C, maintained by high-power air conditioning. This setup ensured minimal temperature fluctuation within the batteries, with variations kept below 1.3°C. The research prismatic battery was allowed to stabilize post-discharge, incorporating a 24-h resting period every ten cycles before ultrasonic signal recording. The use of a couplant gel facilitated the transmission of ultrasonic wave energy and minimized the significant refraction and scattering of these waves caused by the coarse surface and air gap between the probe and the battery. Figure 1 provides an illustration of the experimental setup, featuring both a schematic diagram of the charging and discharging cycle system and the ultrasonic testing system. Figure 2 shows a photograph of the experimental setup. Figure 3 displays a typical test result along with the calculation of the TOF and signal amplitude (SA) of the output signal. These two parameters, CH1 and CH2, represent the input signal waveform and output signal waveform, respectively, and will be utilized for predicting the SOH of the researched prismatic cell.
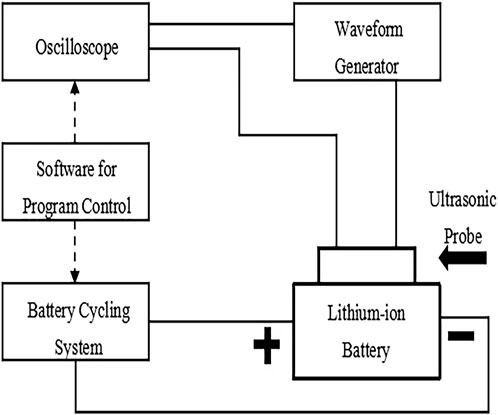
Figure 1. Schematic diagram of charging and discharging cycle.
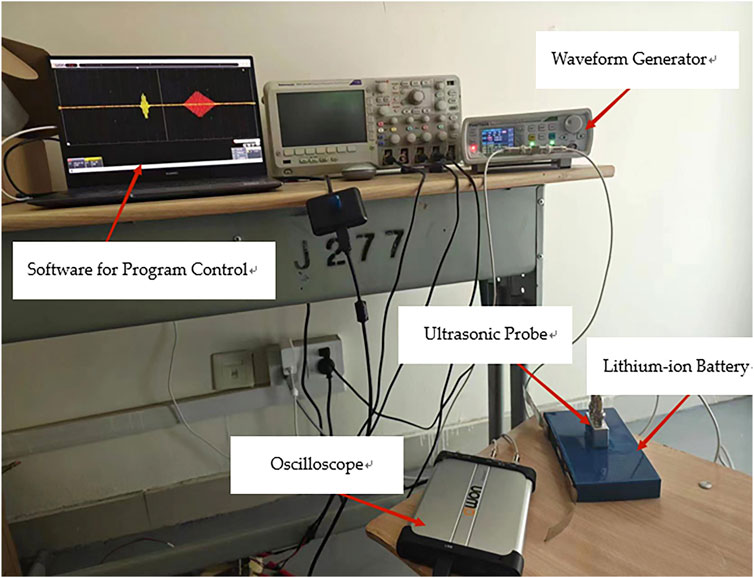
Figure 2. Schematic diagram of experimental equipment.
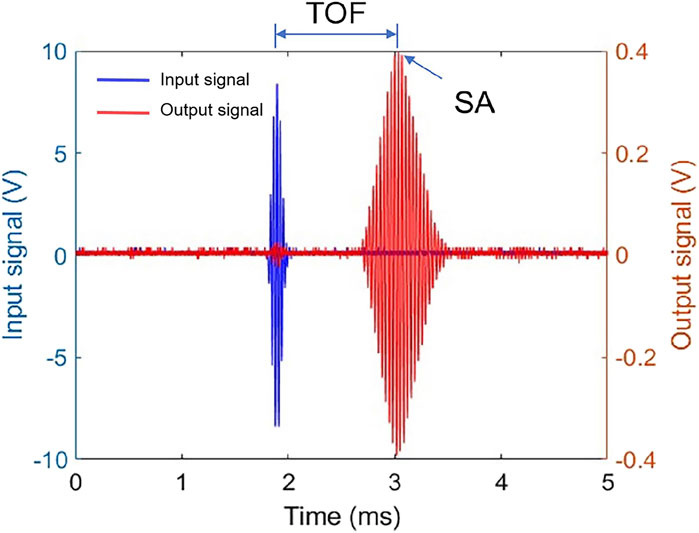
Figure 3. Schematic of TOF (time-of-flight) and SA (signal amplitude) calculation methods.
2.2 Experimental procedure and required materials
In our research, the experimental protocol comprises two main stages: charge‒discharge cycling and ultrasonic testing.
The selected battery underwent a rigorous charge‒discharge cycling process utilizing the Blue Electric Battery Test System. A typical cycle involves:
1 Discharging at a steady 40A current occurs until the battery’s voltage decreases to 2.8 V or less.
2 Maintaining a discharge at a constant voltage of 2.8 V until the current drops to 0.1 A or less.
3 Charging at a constant current of 40A until the voltage ascends to 4.2V or beyond.
4 Pursuing a charge at a consistent voltage of 4.2V until the current diminishes to 0.1A or below.
This sequence indicates the conclusion of a single charge‒discharge cycle. For the purposes of our research, each battery underwent ten comprehensive cycles.
After the completion of these ten charge‒discharge cycles, the battery is allowed to rest for a period of 24 h. It is important to note that lithium-ion batteries may experience a temperature increase after cycling. This resting interval serves two purposes: to dissipate the accumulated heat and to ensure optimal conditions for the subsequent ultrasonic testing phase.
With the battery conditioned through the aforementioned steps, our research proceeds to ultrasonic examination utilizing the techniques and equipment described earlier in our methodology. In total, 240 charge and discharge cycles were conducted, and 24 sets of acoustic data were captured to predict various SOH statuses for the prismatic battery.
This sequence marks the completion of a single charge-discharge cycle. In our research, we opted for ten comprehensive cycles for each battery to collect data points as densely as possible within a limited set of cycles, aiming to meticulously trace signal strength changes during the degradation process. This number was chosen to balance between data granularity and the increased variability introduced by fewer cycles, ensuring our results remain both informative and reliable.
The entire procedure, along with key milestones and transitions, is visually represented in Figure 4 for enhanced clarity and comprehension.
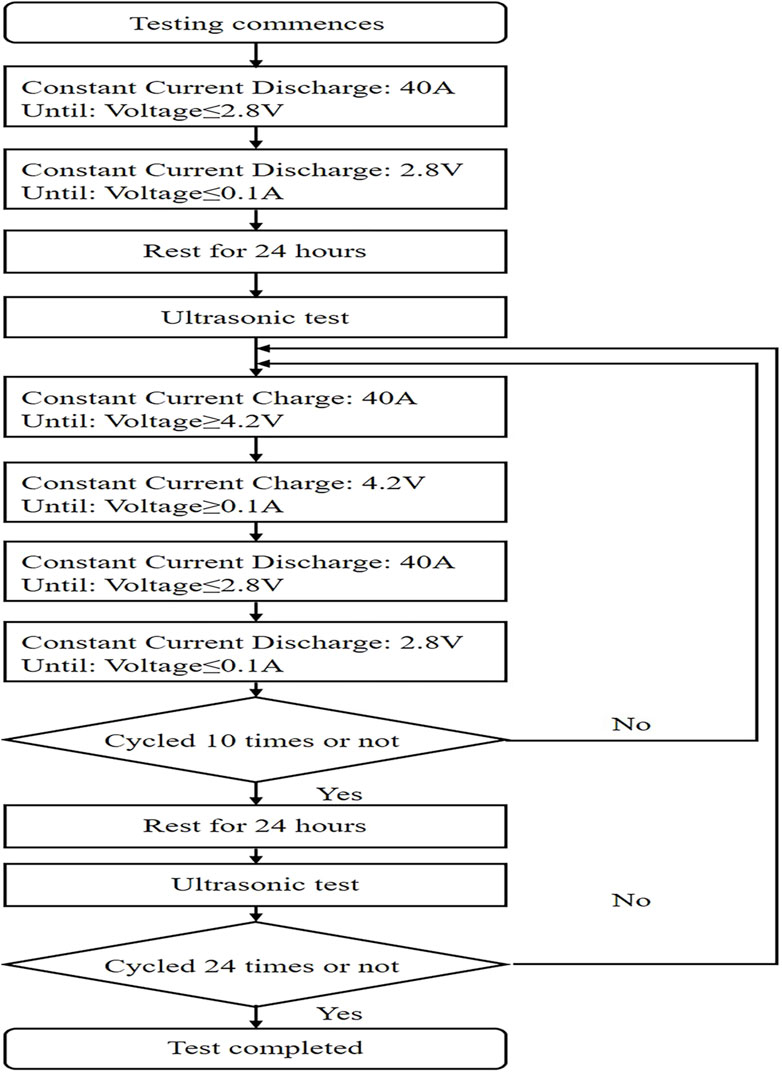
Figure 4. Experimental procedure for charging and discharging cycles.
2.3 Machine learning predictions
In this research, four distinct machine learning methodologies, each with four different presets, were employed to predict the SOH degradation of prismatic batteries using acoustic signal data.
The first method, linear regression, is utilized in four variants:
The basic linear preset assumes that the direct relationship between the predictor and the dependent variable is
where Y is the SOH of the prismatic battery to be predicted. Xi is the i th variable utilized for SOH prediction and consists of two parameters: the SA of the output acoustic signal and the TOF between the input signal and the output signal. Here, i = 25. β0 is the intercept term, and βi is the coefficient of the corresponding independent variable Xi. ϵ is the error between the SOH predicted through machine learning and the actual SOH.
The interactions linear preset, which includes interaction terms
where XiXj is the interaction term of the SA and TOF used to predict the battery SOH. βij is the co-efficient of the corresponding interaction term.
The robust linear preset, which maintains the same equation form as the standard linear model but employs a fitting process that assigns varying weights to data points, is intended to reduce the impact of outliers. Additionally, the stepwise linear preset initiates with no predictors and iteratively selects the most statistically significant predictors during the fitting process.
The second method, Support Vector Machine (SVM) Regression, is applied using four different kernels:
2.3.1 Linear SVM with kernel
where K(Xi, Xj) is the kernel function, which computes the similarity or a higher-dimensional relationship between two data points.
2.3.1.1 Quadratic SVM with kernel
where γ is a scale factor for the feature vectors. r is the constant term added to the kernel function.
2.3.2 Cubic SVM with kernel
and Fine Gaussian SVM with kernel
where ║Xi-Xj║2 is the Euclidean distance between feature vectors Xi and Xj.
Each offers different complexities in terms of data separation.
The third methodology is Gaussian Process Regression (GPR), where the prediction of SOH of a prismatic battery adops four kernel types:
2.3.2.1 Squared exponential GPR
where
2.3.3 Matern 5/2 GPR
Exponential GPR
and Rational Quadratic GPR
where α is a scale mixture parameter that controls the weighting of different length-scales, allowing for modelling functions with varying degrees of smoothness.
Each of these kernels is suitable for modelling varying degrees of smoothness in data relationships.
Finally, this research employed Neural Network Regression (NNR) and configured architectures as narrow, medium, wide, and bilayer networks. These networks vary in terms of neuron counts and layer depths, adhering to the general equation
However, the complexity and capacity for capturing nonlinear patterns in acoustic signal data vary. In the equation y is the output of the neural network, namely, the SOH of the prismatic battery. f is the activation function for the output layer. g is the activation function for the hidden layer. wij is the weight connecting various layers. xj is the input feature consisting of the SA and TOF. b is the bias for the output neuron. bj is the bias for the i th neutron in the hidden layer.
All of these methods and their presets are systematically applied and evaluated to determine the most effective approach for predicting the SOH degradation of prismatic batteries based on acoustic signal characteristics. This analysis provides a comprehensive overview of machine learning strategies in the context of battery health monitoring.
3 Results
3.1 Capacity decay
Figures 5A, B depict the evolving discharge capacity and SOH of the tested lithium-ion battery as the experiments progress. These figures offer a comprehensive overview of the battery’s performance indicators and health trajectory throughout our study as the cycle count steadily increases.
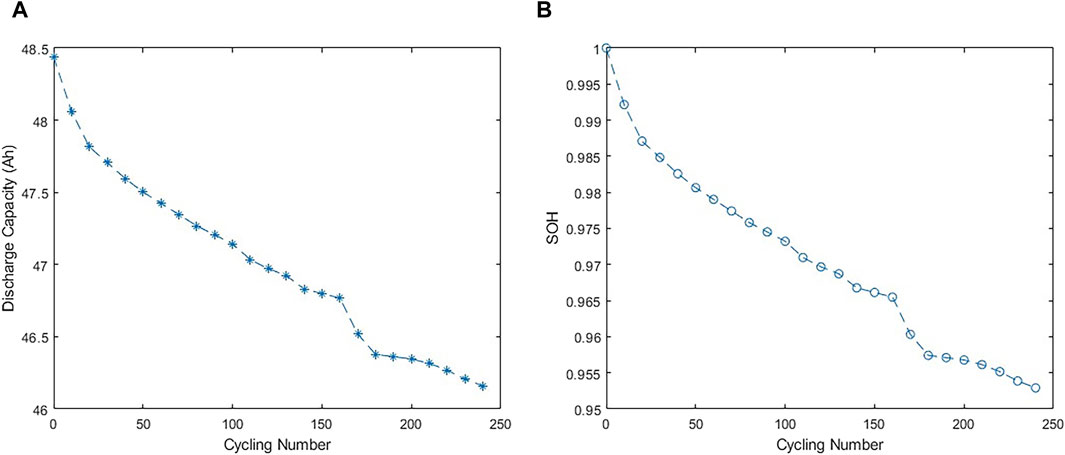
Figure 5. The decaying (A) discharge capacity and (B) SOH as the increase of cycling number.
With an increasing number of cycles, the discharge capacity of the prismatic battery decreases from an initial 48.44 Ah to 46.16 Ah by the 240th cycle. Correspondingly, after 240 cycles, the SOH decreases from one to 0.952.
Table 1 includes data from an initial set of experiments in addition to the 240 cycles of charging and discharging tests with ultrasonic signal measurements recorded every 10 cycles, totaling 25 sets of ultrasonic signals.
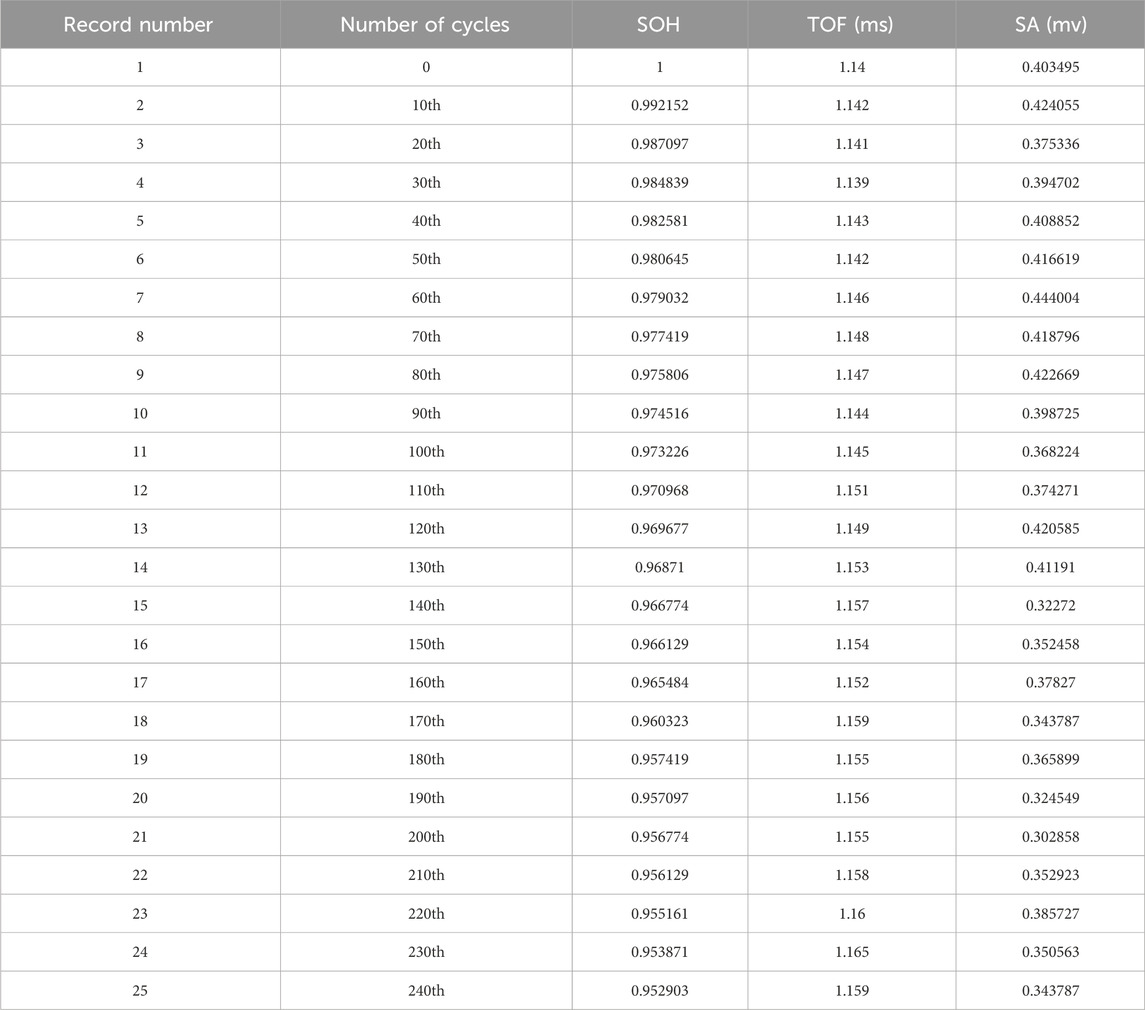
Table 1. Summary of battery SOH and the change of TOF and SA of the output signal as the cycle number increases.
3.2 Ultrasonic signal
Figure 6 shows the input and output waveforms from the initial (0th) cycle to the 240th cycle. Subfigures (a) through (f) show the signal waveforms for the 0th, 50th, 100th, 150th, 200th, and 240th cycles, respectively. These records offer a comprehensive view of the waveform evolution as the battery undergoes repeated cycles.
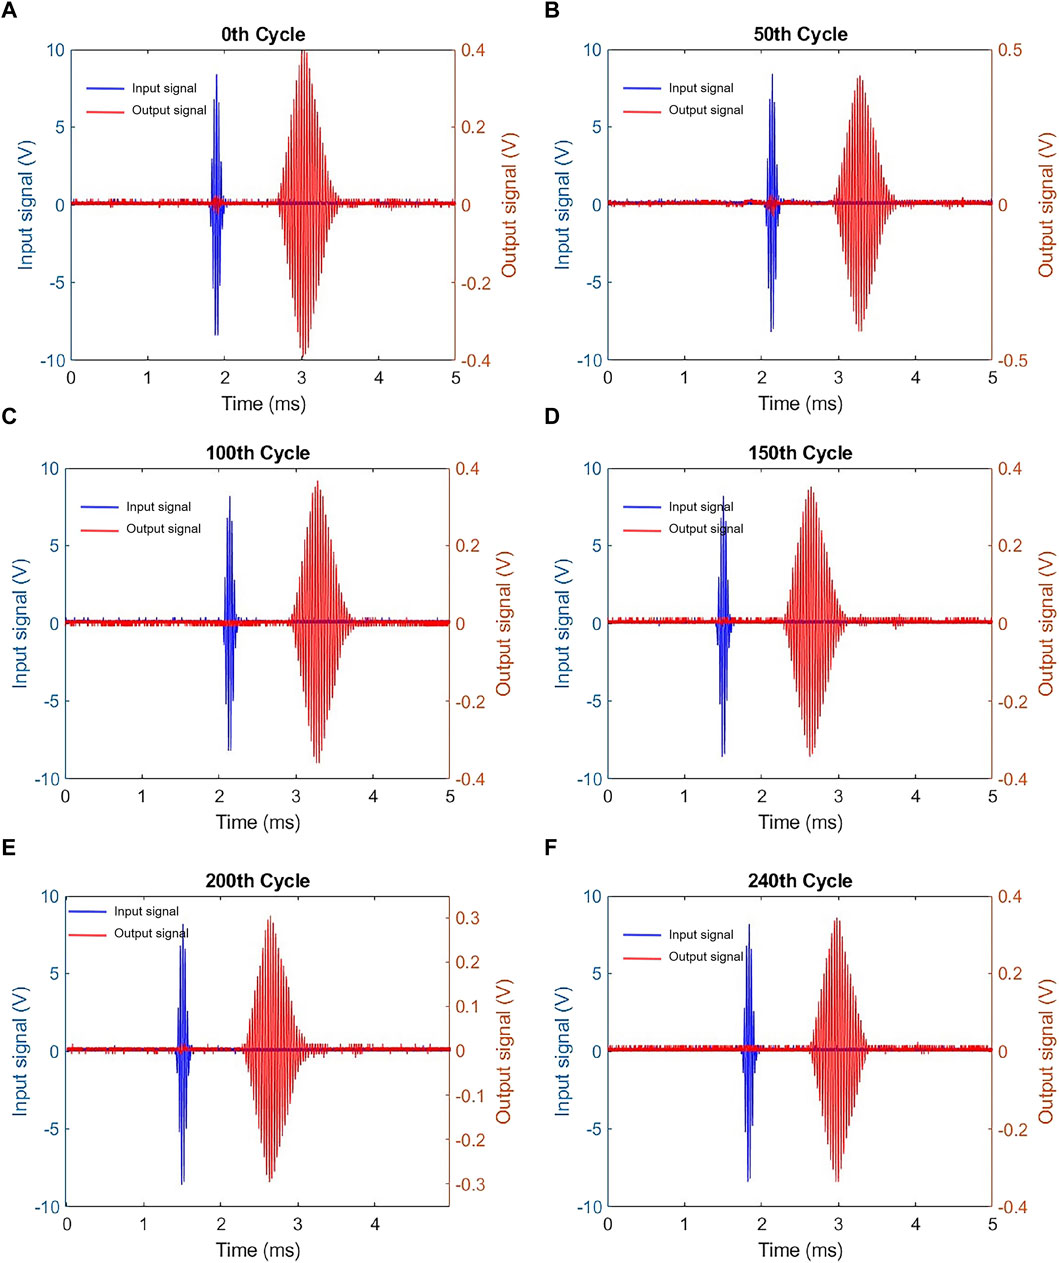
Figure 6. (A) 0th cycle; (B) 50th cycle; (C) 100th cycle; (D) 150th cycle; (E) 200th cycle; (F) 240th cycle.
To reduce noise in the output signals, a denoising method utilizing 4-level wavelet packet decomposition was employed, as depicted in Figure 7. This approach effectively removes both low-frequency and high-frequency noise, resulting in a cleaner signal representation and ensuring a more precise analysis of the battery’s performance over the designated cycles.
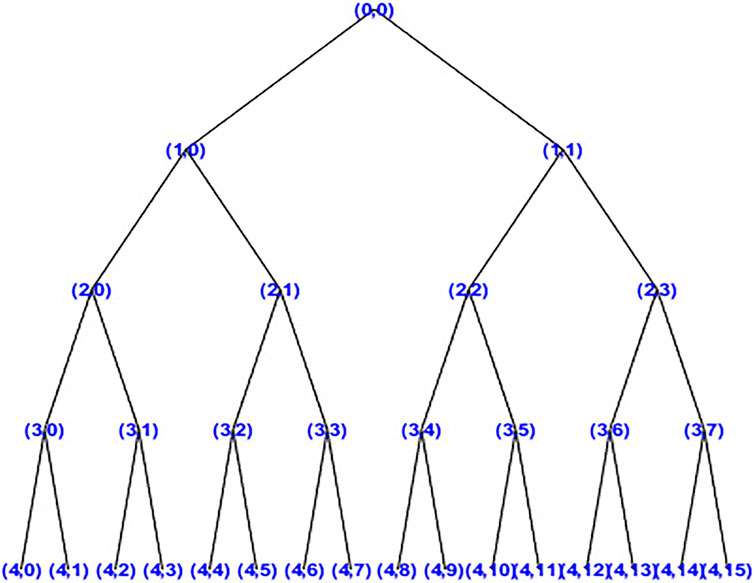
Figure 7. Wavelet packet decomposition tree.
This waveform results from the laminated structure within lithium-ion batteries, where stress waves undergo reflection, transmission, and attenuation across various internal interfaces. As batteries age, phenomena such as particle cracking, gas production, and mechanical property degradation lead to increased damping. This, in turn, diminishes the amplitude of received signals and alters the propagation speed of stress waves, thereby elongating the time difference between the incoming and outgoing waves, which increases the time of flight.
Figure 8 displays the input and output waveforms following decomposition, reconstruction, and denoising. Panels (a) through (f) represent the denoised signal waveforms at the 0th, 50th, 100th, 150th, 200th, and 240th cycles, respectively.
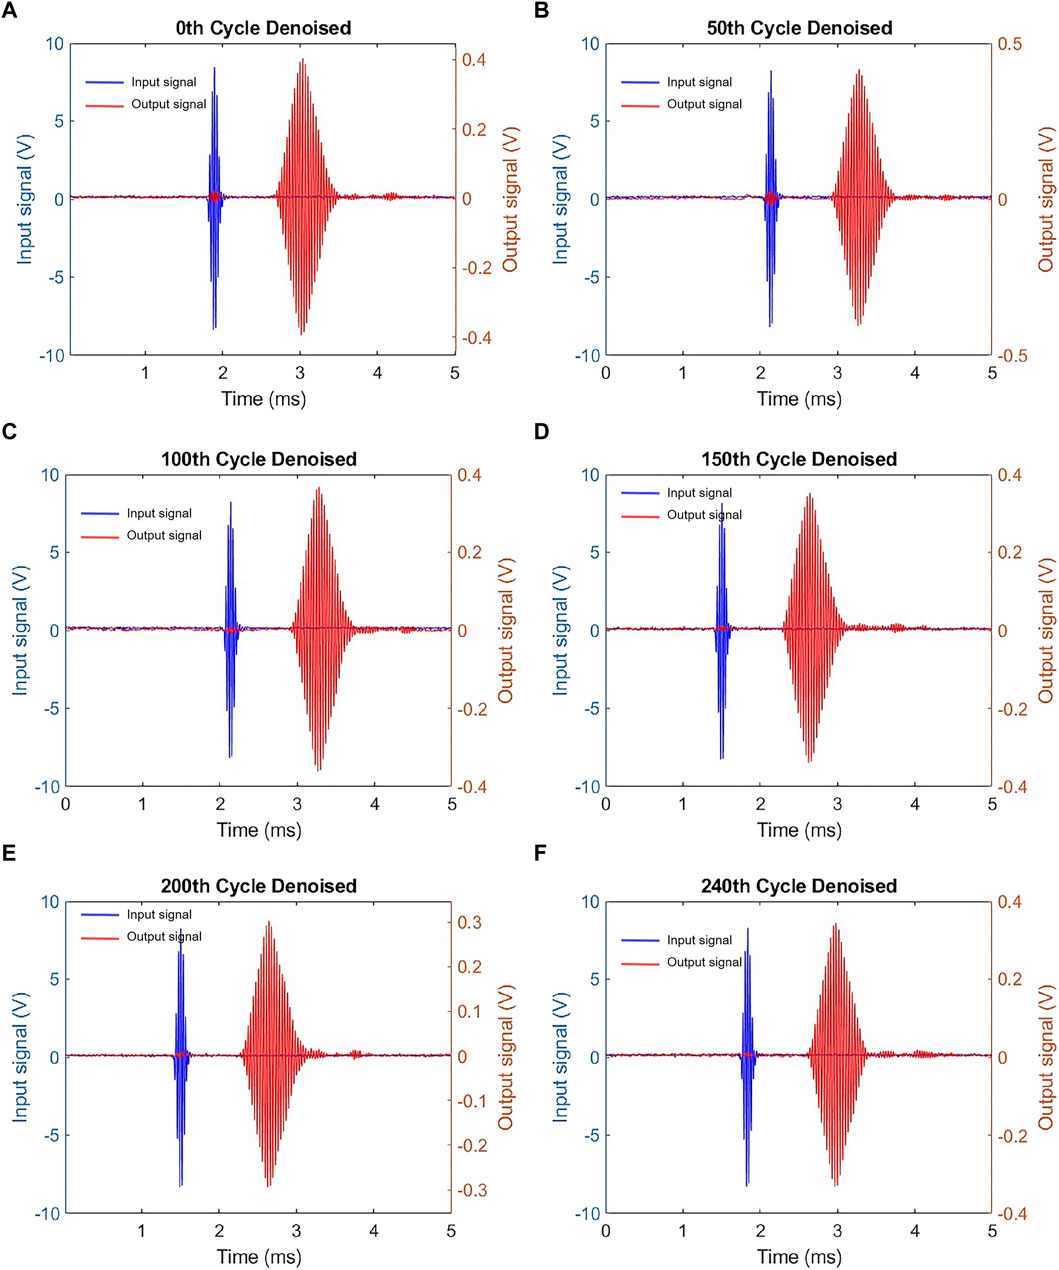
Figure 8. Denoised input and output signal: (A) 0th cycle; (B) 50th cycle; (C) 100th cycle; (D) 150th cycle; (E) 200th cycle; (F) 240th cycle.
Figure 9 shows the changes in the output SA from the 0th to the 240th cycling processes. With an increasing number of cycles, a noticeable decrease in the overall amplitude of the output signal becomes evident. This decline indicates a prevailing downwards trend as the battery undergoes repeated cycles, highlighting the evolving dynamics of the battery’s health and operational parameters with continued usage.
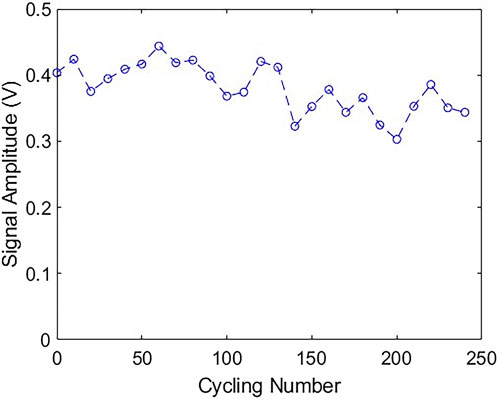
Figure 9. The change of signal amplitude of output signal with the increase of cycling number.
Figure 10 illustrates the variations in the TOF of the output signal from the 0th to the 240th cycling processes. Remarkably, as the number of cycles increases, the overall signal propagation time increases. This upwards trend as the battery progresses through its cycles may suggest underlying alterations in the battery’s internal structure or chemistry, highlighting the complex interplay of factors influencing its performance over time.
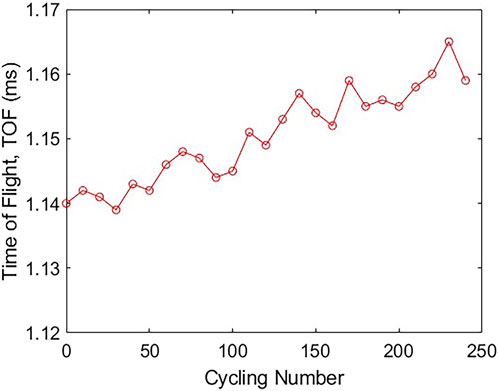
Figure 10. The change of TOF of output signal with the increase of cycling number.
The change in the SOH of the researched battery and the TOF and SA of the output signal as the cycle number increases from 0 to 240.
4 SOH prediction
To efficiently assess the SOH of the selected prismatic lithium-ion batteries using ultrasonic methods, the input parameters identified were the SA and the TOF of the output signal. MATLAB’s regression learner tool was leveraged to implement four distinct prediction methodologies: linear regression, SVM, GPR, and neural networks. Each method was configured with four different presets, resulting in a comprehensive evaluation involving 16 unique models for forecasting the SOH of lithium-ion batteries.
Figure 11 displays the results of the SOH predictions when employing the linear regression methodology with four distinct presets: linear, interaction linear, robust linear, and stepwise. The coefficients of determination (R2) for the predictions of these models were 0.86, 0.88, 0.86, and 0.85. Additionally, the Mean Absolute Error (MAE) values for the models were 3.80 × 10⁻³, 3.80 × 10⁻³, 3.73 × 10⁻³ and 3.93 × 10⁻³. Moreover, the root means square errors (RMSEs) observed for these four models were 4.73 × 10⁻³, 4.43 × 10⁻³, 4.78 × 10⁻³, and 4.85 × 10⁻³.
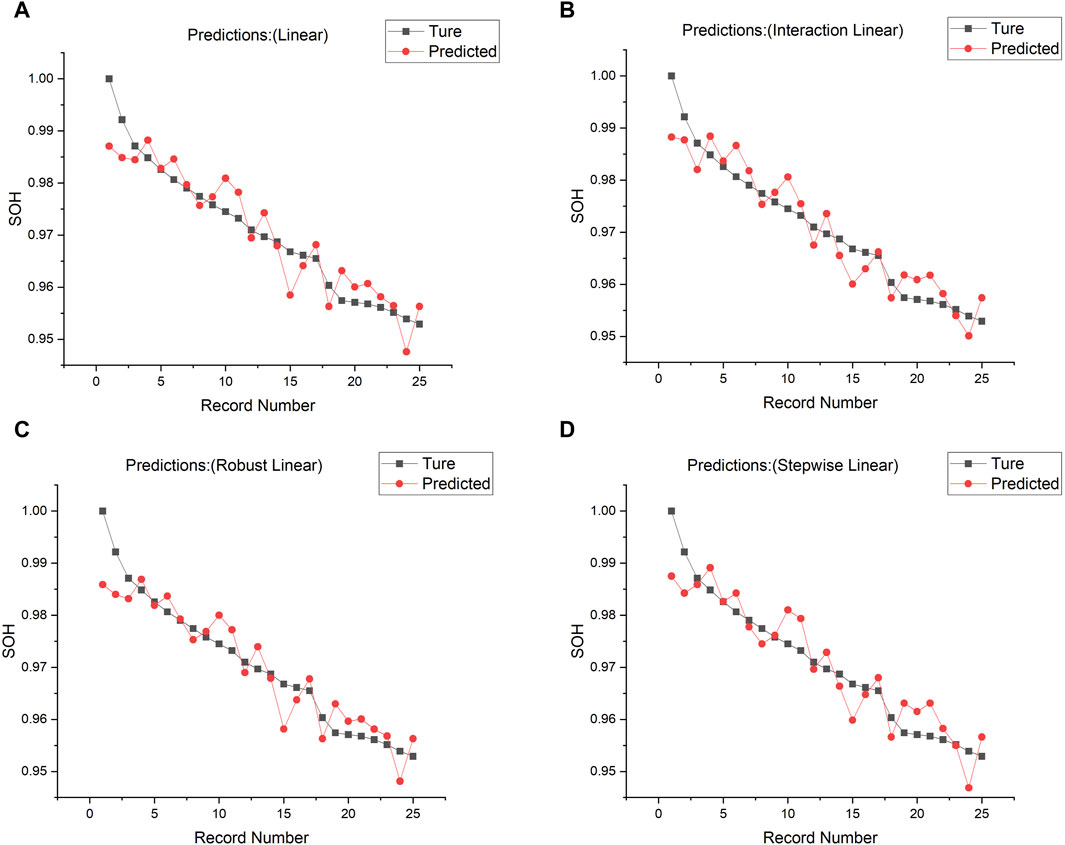
Figure 11. SOH prediction through linear regression with (A) linear, (B) interactions linear, (C) robust linear and (D) stepwise preset.
Figure 12 displays the results of SOH predictions using SVM techniques with four distinct presets: linear SVM, quadratic SVM, cubic SVM, and fine Gaussian SVM. The R2 values for these models’ predictions were determined to be 0.71, 0.82, 0.80, and 0.89. The MAEs for these models were 4.80 × 10⁻³, 4.08 × 10⁻³, 4.35 × 10⁻³, and 3.15 × 10⁻³, respectively. Furthermore, the RMSE values calculated for these SVM models were 6.73 × 10⁻³, 5.37 × 10⁻³, 5.61 × 10⁻³, and 4.19 × 10⁻³, respectively.
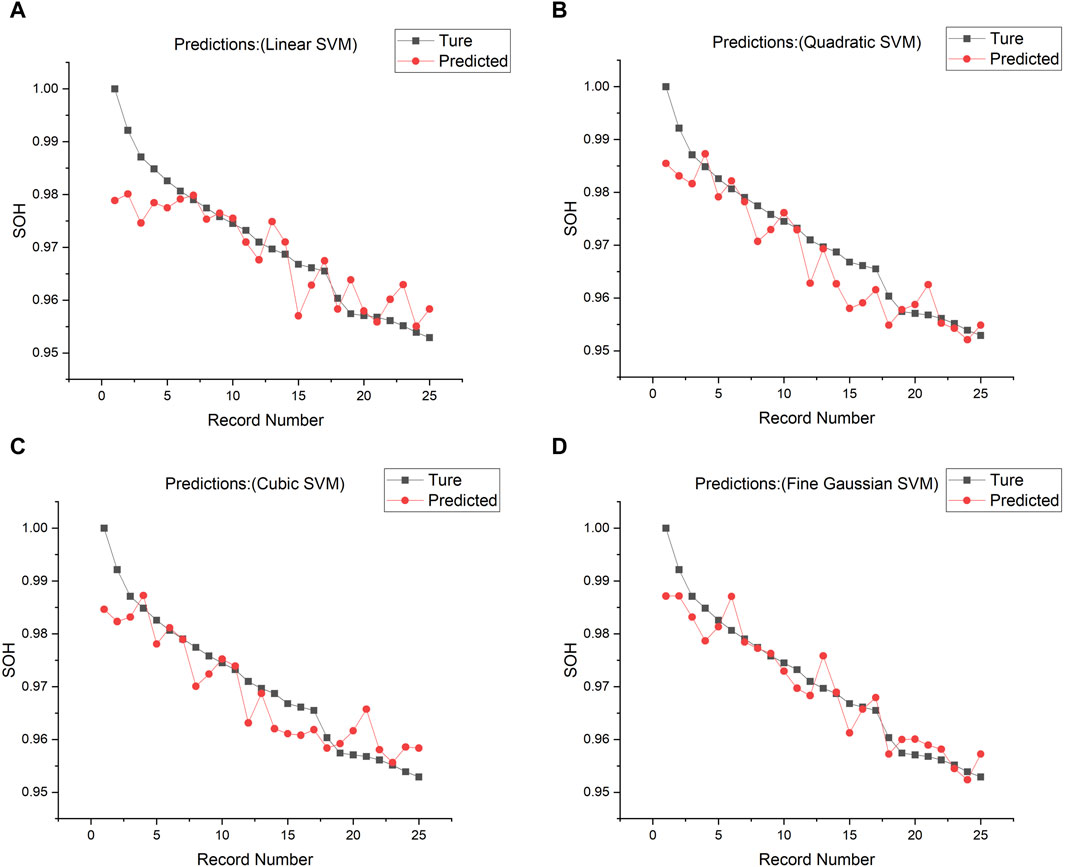
Figure 12. SOH prediction through SVM with (A) linear SVM, (B) quadratic SVM, (C) cubic SVM and (D) fine Gaussian SVM preset.
Figure 13 depicts the results of SOH prediction using GPR with four different presets: the squared exponential GPR, the Matern 5/2 GPR, the exponential GPR, and the rational quadratic GPR. The corresponding R2 values for these models were recorded as 0.88, 0.88, 0.93, and 0.88, respectively. In terms of the MAE for each model, the values were 3.58 × 10⁻³, 3.60 × 10⁻³, 2.73 × 10⁻³, and 3.58 × 10⁻³. Furthermore, the RMSE values associated with these GPR presets were determined to be 4.37 × 10⁻³, 4.37 × 10⁻³, 3.35 × 10⁻³, and 4.37 × 10⁻³, respectively.
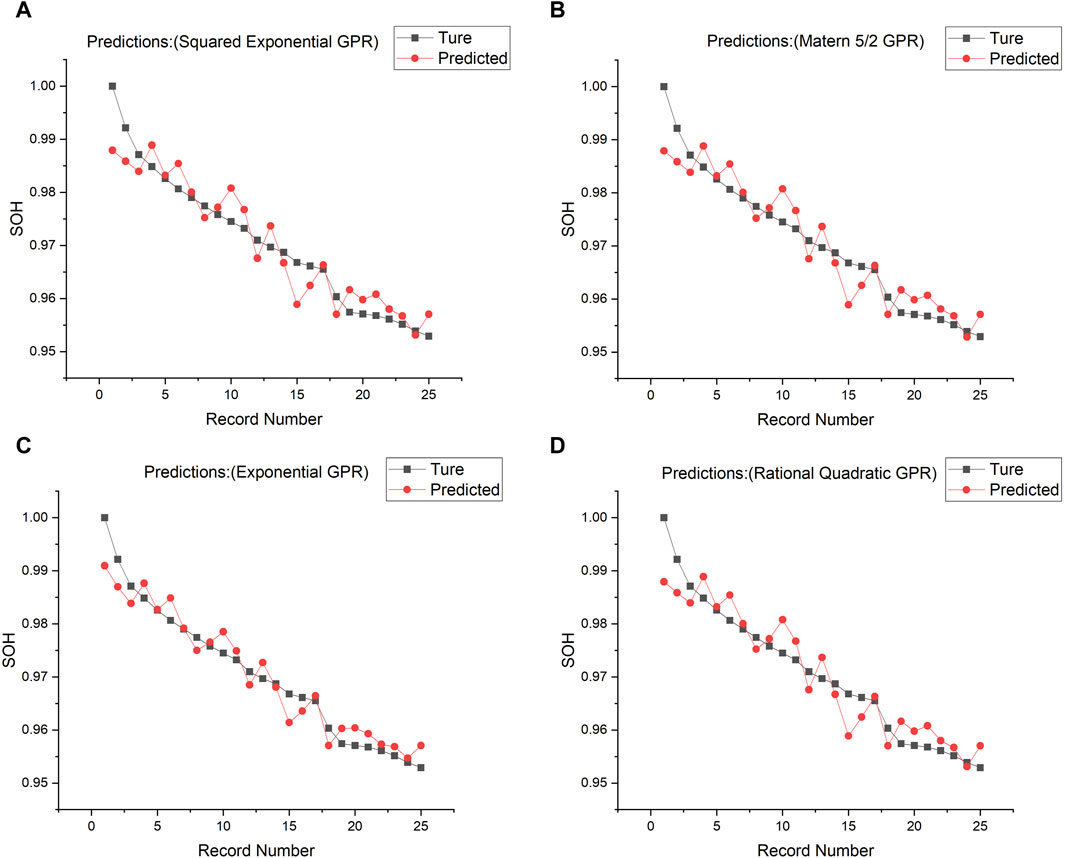
Figure 13. SOH prediction through Gaussian Process Regression (GPR) with (A) squared exponential GPR, (B) Matern 5/2 GPR, (C) exponential GPR and (D) rational quadratic GPR preset.
Figure 14 illustrates the results obtained through the application of neural network techniques for predicting SOH. Four distinct presets were used: the narrow neural network, medium neural network, wide neural network, and bilayer neural network. The achieved R2 values for these models are as follows: 0.96, 0.92, 0.99, and 0.92. When assessing the MAE for each model, the recorded values were 1.68 × 10⁻³, 2.38 × 10⁻³, 0.33 × 10⁻³, and 1.53 × 10⁻³, respectively. Furthermore, the RMSE values associated with these neural network presets were determined to be 2.46 × 10⁻³, 3.46 × 10⁻³, 1.05 × 10⁻³, and 2.94 × 10⁻³. These results underscore the robustness and versatility of neural network-based models in predicting SOH, highlighting their substantial accuracy and reliability in assessing the status of lithium-ion batteries.
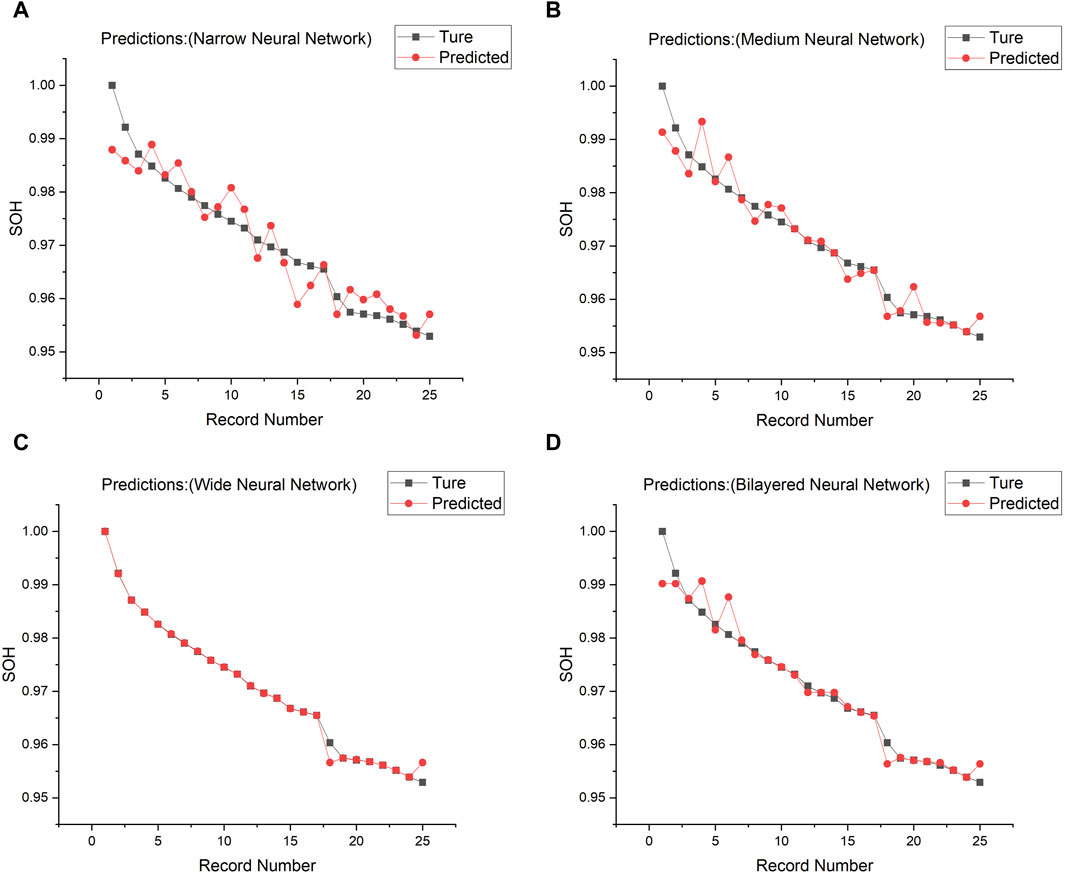
Figure 14. SOH prediction through neural network with (A) narrow neural network, (B) medium neural net-work, (C) wide neural network and (D) bilayered neural network preset.
Table 2 compiles the results obtained from employing four distinct prediction methodologies: linear regression, SVM, GPR, and neural network methods. Each method was further finetuned using four unique presets, resulting in a total of 16 model variations for predicting the SOH in lithium -ion batteries. The table presents the performance metrics, including R2, MAE, and RMSE, for each of these models. Among the analysed models, the wide neural network emerged as the superior predictor for battery SOH, exhibiting impressive accuracy metrics: an R2 value of 0.99, a MAE of 0.33 × 10⁻³, and an RMSE of 1.05 × 10⁻³. These results underscore the effectiveness of neural network-based models, particularly the wide neural network variant, in delivering highly precise SOH assessments for lithium-ion batteries.
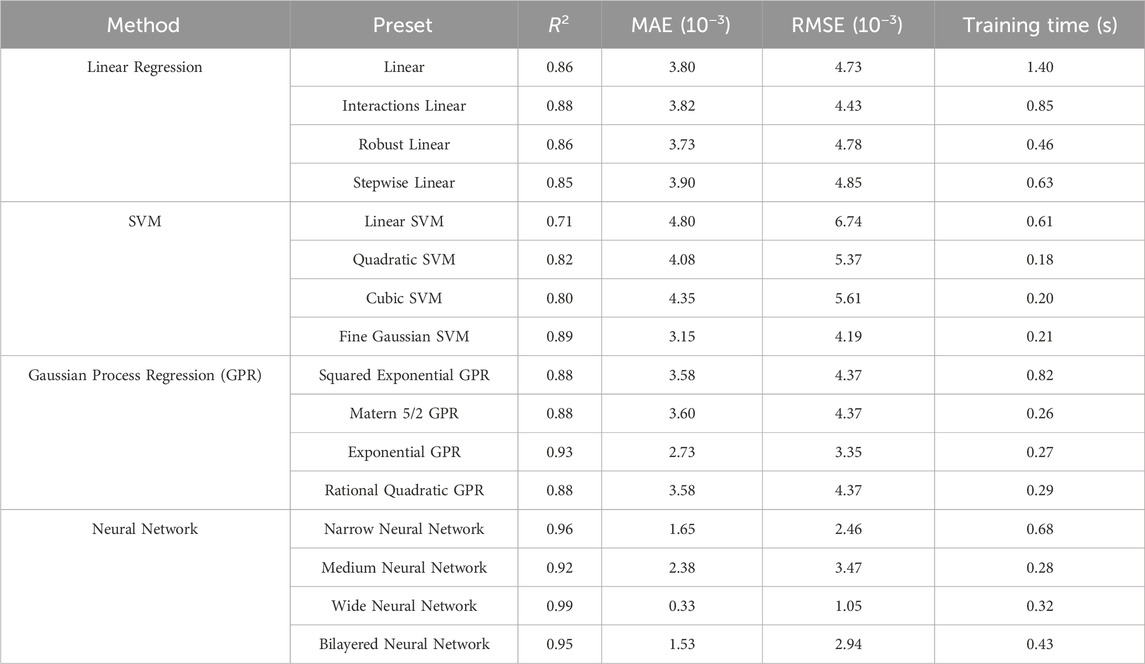
Table 2. Summary of SOH prediction results based on different models.
In this study, four distinct prediction methodologies were implemented with MATLAB’s regression learner tool: linear regression, SVM, GPR, and neural networks. Previous researches (Davies et al., 2017; Galiounas et al., 2022; Huang et al., 2022) have frequently utilized SVM and neural networks for its robustness in similar contexts. However, our exploration extends beyond conventional approaches by including a variety of machine learning techniques, particularly emphasizing the novel application of a wide neural network. This method demonstrated enhanced accuracy in predicting the SOH of batteries, distinguishing our approach from SVM applications and offering a significant contribution to the field of battery health diagnostics.
The training times for various models employed in the state of health (SOH) prediction of prismatic batteries was assessed in the comprehensive comparative analysis in Table 2, which highlighted the fine Gaussian SVM method’s optimal performance, achieving R2, MAE, and RMSE scores of 0.89, 315, and 4.19, respectively, with an efficient training time of 0.21 s. Contrastingly, the wide neural network model, among the neural network options explored, stood out for its exceptional predictive accuracy, marked by R2, MAE, and RMSE scores of 0.99, 0.33, and 1.05, respectively, albeit at a marginally higher training time of 0.32 s. The decision to adopt the neural network approach, despite the slight increase in computational demand, was driven by its significantly enhanced accuracy. This strategic choice underscores our commitment to balancing computational efficiency with predictive precision.
This novel approach, diverging from the rapid state-of-health assessments typically used for pouch cells, sets the groundwork for refining diagnostic techniques for prismatic batteries. It promises advancements in rapid post-discharge battery diagnostics, offering profound implications for their secondary use and safety performance evaluation.
It is important to note that while this approach provides valuable insights into the battery’s health in a fully discharged state, its applicability to batteries in different charge states requires further investigation. This limitation is crucial for the interpretation of our model’s predictions and outlines an avenue for future research to expand the model’s applicability across various charging conditions.
In addressing the comparative analysis between ultrasound-based methods and traditional voltage-based feature extraction for SOH estimation, it is important to highlight the distinctive advantages of utilizing ultrasound diagnostics. Unlike voltage analysis, which offers cost-effectiveness and straightforward implementation, ultrasound methods provide a more comprehensive insight into the battery’s internal health by detecting structural and electrochemical changes not immediately evident through voltage measurements. This capability allows for an earlier detection of degradation phenomena, offering a deeper understanding of the battery’s condition beyond what voltage data can reveal. The ultrasound approach, with its non-invasive and real-time monitoring advantages, represents a significant advancement in battery health diagnostics, despite its higher complexity and implementation challenges.
5 Conclusion
In this study, a comprehensive experimental framework was established to evaluate the SOH of lithium-ion batteries using ultrasonic testing methods. The study was systematically divided into charge‒discharge cycling experiments followed by ultrasonic testing. As the number of cycles increased, a noticeable decrease in the SOH of the battery was observed. With an increasing number of cycles, the SA of the output signal gradually decreased, while the TOF generally increased. Central to our analysis was the utilization of advanced tools such as MATLAB, which facilitates wavelet transformations for signal denoising, and various machine learning techniques for predictive modelling.
This study revealed the significant potential of various predictive models, with neural networks, particularly wide neural networks, emerging as the most accurate tool for SOH prediction. This model achieved an impressive R2 value of 0.99, highlighting its superior accuracy. The results demonstrate that ultrasonic methodologies, when combined with advanced machine learning algorithms, can provide an efficient, precise, and cost-effective diagnostic tool for assessing the health status of lithium-ion batteries. In summary, this research not only significantly contributes to battery diagnostics for electric vehicles but also lays the foundation for further innovations in the domain of battery health assessment.
Data availability statement
The original contributions presented in the study are included in the article/Supplementary material, further inquiries can be directed to the corresponding author.
Author contributions
QW: Conceptualization, Methodology, Writing–original draft, Writing–review and editing. DS: Data curation, Software, Writing–review and editing. XL: Data curation, Software, Writing–review and editing. HW: Investigation, Validation, Writing–review and editing. HS: Validation, Writing–review and editing.
Funding
The author(s) declare that financial support was received for the research, authorship, and/or publication of this article. This research is funded by the National Natural Science Foundation of China (51971113), Inter-Governmental S&T Cooperation Project (Research Personnel Exchange Program Between China and Serbia, China and North Macedonian), Natural Science Foundation of Zhejiang Province (LY20A020004, LY21A020002, LQ23A020001), General Project of Zhejiang Provincial Department of Education (Y202250294), Natural Science Foundation of Liaoning Province/Joint Open Fund (2022-KF-24-04), Foundation of State Key Laboratory of Automotive Simulation and Control (20210235), Natural Science Foundation of Ningbo Municipality (2023J179, 2023J389), Ningbo Major Special Project of the Plan “Science and technology innovation 2025” (2022Z11, 2023Z036), Scientific Cultivation Project of Ningbo University of Technology (2022TS15, 022TS17).
Conflict of interest
Author HS was employed by China Academy of Machinery Ningbo Academy of Intelligent Machine Tool Co., Ltd.
The remaining authors declare that the research was conducted in the absence of any commercial or financial relationships that could be construed as a potential conflict of interest.
Publisher’s note
All claims expressed in this article are solely those of the authors and do not necessarily represent those of their affiliated organizations, or those of the publisher, the editors and the reviewers. Any product that may be evaluated in this article, or claim that may be made by its manufacturer, is not guaranteed or endorsed by the publisher.
References
Bhadra, S., Hsieh, A., Wang, M., Hertzberg, B., and Steingart, D. A. (2016). Anode characterization in zinc-manganese dioxide AA alkaline batteries using electrochemical-acoustic time-of-flight analysis. J. Electrochem. Soc. 163 (6), A1050–A1056. doi:10.1149/2.1201606jes
Bommier, C., Chang, W., Li, J., Biswas, S., Davies, G., Nanda, J., et al. (2020a). Operando acoustic monitoring of SEI formation and long-term cycling in NMC/SiGr composite pouch cells. J. Electrochem. Soc. 167 (2), 020517. doi:10.1149/1945-7111/ab68d6
Bommier, C., Chang, W., Lu, Y., Yeung, J., Davies, G., Mohr, R., et al. (2020b). In operando acoustic detection of lithium metal plating in commercial LiCoO2/graphite pouch cells. Cell Re-ports Phys. Sci. 1 (4), 100035. doi:10.1016/j.xcrp.2020.100035
Chang, W., Bommier, C., Fair, T., Yeung, J., Patil, S., and Steingart, D. (2020a). Understanding adverse effects of temperature shifts on Li-ion batteries: an operando acoustic study. J. Electrochem. Soc. 167 (9), 090503. doi:10.1149/1945-7111/ab6c56
Chang, W., Mohr, R., Kim, A., Raj, A., Davies, G., Denner, K., et al. (2020b). Measuring effective stiffness of Li-ion batteries via acoustic signal processing. J. Mater. Chem. A 8 (32), 16624–16635. doi:10.1039/D0TA05552B
Chou, Y., Hsu, N., Jeng, K., Chen, K., and Yen, S. (2016). A novel ultrasonic velocity sensing approach to monitoring state of charge of vanadium redox flow battery. Appl. Energy 182, 253–259. doi:10.1016/j.apenergy.2016.08.125
Copley, R., Cumming, D., Wu, Y., and Joyce, R. (2021). Measurements and modelling of the response of an ultrasonic pulse to a lithi-um-ion battery as a precursor for state of charge estimation. J. Energy Storage 36, 102406. doi:10.1016/j.est.2021.102406
Davies, G., Knehr, K. W., Van Tassell, B., Hodson, T., Biswas, S., Hsieh, A. G., et al. (2017). State of charge and state of health estimation using electrochemical acoustic time of flight analysis. J. Electrochem. Soc. 164 (12), A2746–A2755. doi:10.1149/2.1411712jes
Galiounas, E., Tranter, T. G., Owen, R. E., Robinson, J. B., Shearing, P. R., and Brett, D. J. (2022). Battery state-of-charge estimation using machine learning analysis of ultrasonic signatures. Energy AI 10, 100188. doi:10.1016/j.egyai.2022.100188
Gold, L., Bach, T., Virsik, W., Schmitt, A., Müller, J., Staab, T. E., et al. (2017). Probing lithium-ion batteries' state-of-charge using ultrasonic transmission Concept and laboratory testing. J. Power Sources 343, 536–544. doi:10.1016/j.jpowsour.2017.01.090
Hsieh, A., Bhadra, S., Hertzberg, B. J., Gjeltema, P. J., Goy, A., Fleischer, J. W., et al. (2015). Electrochemical-acoustic time of flight: in operando correlation of physical dynamics with battery charge and health. Energy and Environ. Sci. 8 (5), 1569–1577. doi:10.1039/C5EE00111K
Huang, Z., Zhou, Y., Deng, Z., Huang, K., Xu, M. K., Shen, Y., et al. (2023). Precise state-of-charge mapping via deep learning on ultrasonic transmission signals for lithium-ion batteries. ACS Appl. Mater. Interfaces 15 (6), 8217–8223. doi:10.1021/acsami.2c22210
Kim, J., Jo, J., and Byeon, J. (2020). Ultrasonic monitoring performance degradation of lithium-ion battery. Microelectron. Reliab. 114, 113859. doi:10.1016/j.microrel.2020.113859
Knehr, K. W., Hodson, T., Bommier, C., Davies, G., Kim, A., and Steingart, D. A. (2018). Understanding full-cell evolution and non-chemical electrode crosstalk of li-ion batteries. Joule 2 (6), 1146–1159. doi:10.1016/j.joule.2018.03.016
Ladpli, P., Kopsaftopoulos, F., and Chang, F. (2018). Estimating state of charge and health of lithium-ion batteries with guided waves using built-in piezoelectric sensors/actuators. J. Power Sources 384, 342–354. doi:10.1016/j.jpowsour.2018.02.056
Ladpli, P., Kopsaftopoulos, F., Nardari, R., and Chang, F. (2017). Smart materials and nondestructive evaluation for energy systems, Battery charge and health state monitoring via ultrasonic guided-wave-based methods using built-in piezoelectric transducers, International Society for Optics and Photonics. 1017108, 10171. doi:10.1117/12.2260107
Li, H., and Zhou, Z. (2019). Numerical simulation and experimental study of fluid-solid coupling-based air-coupled ultrasonic detection of stomata defect of lithium-ion battery. Sensors 19 (10), 2391. doi:10.3390/s19102391
McGee, T., Archibald, E., Ezekoye, O. A., and Haberman, M. R. (2019). Ultrasonic inspection of lithium-ion batteries to determine state of charge, state of health, and battery safety. J. Acoust. Soc. Am. 146, 2816–2817. doi:10.1121/1.5136756
Meng, K., Chen, X., Zhang, W., Chang, W., and Xu, J. (2022). A robust ultrasonic characterization methodology for lithium-ion batteries on frequency-domain damping analysis. J. Power Sources 547, 232003. doi:10.1016/j.jpowsour.2022.232003
Oca, L., Guillet, N., Tessard, R., and Iraola, U. (2019). Lithium-ion capacitor safety assessment under electrical abuse tests based on ultrasound characterization and cell opening. J. Energy Storage 23, 29–36. doi:10.1016/j.est.2019.02.033
Pham, M. T., Darst, J. J., Finegan, D. P., Robinson, J. B., Heenan, T. M., Kok, M. D., et al. (2020). Correlative acoustic time-of-flight spectroscopy and X-ray imaging to investigate gas-induced delamination in lithium-ion pouch cells during thermal runaway. J. Power Sources 470, 228039. doi:10.1016/j.jpowsour.2020.228039
Popp, H., Koller, M., Keller, S., Glanz, G., Klambauer, R., and Bergmann, A. (2019). State estimation approach of lithium-ion batteries by simplified ultrasonic time-of-flight measurement. IEEE Access 7, 170992–171000. doi:10.1109/ACCESS.2019.2955556
Wu, Y., Wang, Y., Yung, W. K., and Pecht, M. (2019). Ultrasonic health monitoring of lithium-ion batteries. Electronics 8 (7), 751. doi:10.3390/electronics8070751
Xu, J. N., Sun, C. Y., Ni, Y. L., Lyu, C., Wu, C., Zhang, H., et al. (2023). Fast identification of micro-health parameters for retired batteries based on a simplified P2D model by using pade approximation. Batteries 9 (1), 64. doi:10.3390/batteries9010064
Zappen, H., Fuchs, G., Gitis, A., and Sauer, D. U. (2020). In-operando impedance spectroscopy and ultrasonic measurements during high-temperature abuse experiments on lithium-ion batteries. Batteries 6 (2), 25. doi:10.3390/batteries6020025
Keywords: prismatic lithium-ion batteries, degradation evaluation, predictive performance, ultrasonic signal analysis, machine learning prediction, computational model
Citation: Wang Q, Song D, Lin X, Wu H and Shen H (2024) Application of machine learning in ultrasonic diagnostics for prismatic lithium-ion battery degradation evaluation. Front. Energy Res. 12:1379408. doi: 10.3389/fenrg.2024.1379408
Received: 31 January 2024; Accepted: 11 March 2024;
Published: 20 March 2024.
Edited by:
Ki-Yong Oh, Hanyang University, Republic of KoreaReviewed by:
Chuanyu Sun, University of Padua, ItalyFabio Corti, University of Florence, Italy
Pyung Sik Ma, Korea Institute of Machinery and Materials, Republic of Korea
Bin Duan, Shandong University, China
Copyright © 2024 Wang, Song, Lin, Wu and Shen. This is an open-access article distributed under the terms of the Creative Commons Attribution License (CC BY). The use, distribution or reproduction in other forums is permitted, provided the original author(s) and the copyright owner(s) are credited and that the original publication in this journal is cited, in accordance with accepted academic practice. No use, distribution or reproduction is permitted which does not comply with these terms.
*Correspondence: Qiying Wang, wangqiying@nbut.edu.cn