Robust power control for PV and battery systems: integrating sliding mode MPPT with dual buck converters
 Arezki Fekik1,2*
  Mohamed Lamine Hamida3
  Ahmad Taher Azar4,5,6 Malek Ghanes2 Arezki Hakim3 Hakim Denoun3
  Ibrahim A. Hameed7*
- 1Department of Electrical Engineering, University Akli Mohand Oulhadj-Bouria, Bouira, Algeria
- 2Nantes Université, École Centrale Nantes, CNRS, LS2N, UMR 6004, Nantes, France
- 3Electrical Engineering Advanced Technology Laboratory (LATAGE), Tizi Ouzou, Algeria
- 4College of Computer and Information Sciences, Prince Sultan University, Riyadh, Saudi Arabia
- 5Automated Systems and Soft Computing Lab (ASSCL), Prince Sultan University, Riyadh, Saudi Arabia
- 6Faculty of Computers and Artificial Intelligence, Benha University, Benha, Egypt
- 7Department of ICT and Natural Sciences, Norwegian University of Science and Technology, Trondheim, Norway
This paper presents a comprehensive exploration of an integrated Buck-Boost converter and Sliding Mode Control (SMC) Maximum Power Point Tracking (MPPT) system for optimizing photovoltaic energy conversion. The study focuses on enhancing solar energy extraction efficiency, regulating output currents, and ensuring effective battery utilization. Through a systematic analysis of converter component sizing and operational modes, the paper delves into the intricacies of the Buck-Boost converter. The unique contribution lies in the innovative integration of SMC with the traditional Perturb and Observe (P&O) algorithm, providing robust and adaptive MPPT under varying environmental conditions. Additionally, the paper introduces a battery management system with three distinct modes, namely, Charging, Direct, and Discharging, offering intelligent control over critical scenarios. Simulation results underscore the robustness of the proposed system under diverse conditions, demonstrating its effectiveness in managing power distribution based on battery charge levels, even in scenarios of insufficient solar power. Overall, this research significantly contributes to advancing the understanding of PV/battery systems and offers a practical, sustainable solution for optimizing energy production, distribution, and storage, marking a substantial stride towards a more efficient and sustainable energy future.
1 Introduction
The systems for renewable energy production, such as photovoltaic installations, play a crucial role in the transition towards a more sustainable economy. The use of solar energy through photovoltaic panels offers several significant environmental advantages (Potrč et al., 2021; Fekik and Benamrouche, 2022; Fekik et al., 2023a; Fekik et al., 2023b). Firstly, it reduces dependence on fossil fuels, thereby contributing to mitigating greenhouse gas emissions responsible for climate change. Additionally, photovoltaic systems do not generate air pollution or toxic waste, minimizing their impact on air and soil quality. However, it is important to recognize that these technologies are not without challenges. The intermittency of solar energy production and the need for efficient storage to address seasonal and diurnal variations pose technical challenges (Hassan et al., 2023; Fachrizal et al., 2024; Khalid, 2024).
The integration of power electronics into photovoltaic systems represents a significant advancement in controlling and optimizing solar energy production. Power electronics provide functionalities such as Maximum Power Point Tracking (MPPT), enabling the best utilization of variations in sunlight to maximize energy production (Meghni et al., 2017; Meghni et al., 2018; Ammar et al., 2019). The continual pursuit of efficiency in photovoltaic systems has led to the development and study of various MPPT techniques. Among the most common methods are Perturb and Observe (P&O), which continuously adjusts the solar panel voltage to maximize output power, and Incremental Conductance, which uses an analysis of the current-voltage characteristic curve to determine the maximum power point (Vinnikov et al., 2021; Mandourarakis et al., 2022; Hai et al., 2023; Katche et al., 2023). Other approaches include the Sequential Search Algorithm, systematically exploring operating points to identify MPPT, and techniques based on artificial intelligence algorithms such as neural networks and genetic algorithms. Each method has its advantages and limitations, including responsiveness to weather changes, implementation complexity, and associated costs. Ongoing research aims to develop more sophisticated MPPT methods, combining traditional approaches with advanced algorithms to optimize solar energy production under various conditions.
Efficient power management in photovoltaic systems (PV) incorporating batteries is a central imperative to maximize the use of renewable resources and ensure a constant availability of energy. This necessity has driven the development of innovative approaches to optimize solar energy production while ensuring efficient storage. In-depth research has highlighted the inherent complexity of variable weather conditions and energy demand fluctuations. Innovative power management strategies, such as the use of advanced MPPT techniques and the integration of intelligent power converters, are at the core of these initiatives. The goal is to optimally balance the production, distribution, and storage of energy, ensuring continuous availability and efficient resource utilization while extending the system components’ useful life. Continuous innovation in this field is essential to address evolving challenges and to solidify PV/battery systems as key components of a resilient and sustainable energy infrastructure.
Benhalima et al. (2018) presented enhanced control strategies for autonomous microgrids based on solar photovoltaic systems (SVPAs) and fixed-speed synchronous generators driven by a diesel engine. To achieve this, a sliding mode regulator based on the d-q transformation theory is employed for the voltage source converter (VSC). This approach aims to mitigate harmonics, balance the diesel generator (DG) current, and inject the power generated by SVPA into the local grid.
A two-stage photovoltaic (PV) system that concurrently achieves maximum power point tracking (MPPT) and voltage regulation is presented in Manuel and İnanç (2022). Additionally, it introduces an enhanced version of the perturb and observe (P&O) algorithm, known as artificial potential fields (APF)-P&O. Simulations conducted using MATLAB/Simulink demonstrate the superior efficiency of the APF-P&O method compared to conventional approaches. This integrated approach offers a promising avenue to enhance the overall performance of photovoltaic systems by addressing both MPPT and voltage regulation in a more efficient and synchronized manner.
In the paper Haq et al., 2022, a nonlinear generalized global sliding mode controller (GGSMC) is presented to maximize the power of a photovoltaic array (PV) using a DC-DC buck-boost converter. A feed-forward neural network (FFNN) is employed to provide a reference voltage. The GGSMC is designed to track the reference generated by the FFNN, accounting for variations in temperature and sunlight. The proposed control strategy, in conjunction with a modified sliding mode control, eliminates the convergence phase, ensuring that the sliding mode persists throughout the entire duration.
The primary goal of this research is:
• Develop and evaluate an integrated Buck-Boost converter and Sliding Mode Control (SMC) Maximum Power Point Tracking (MPPT) system.
• Enhance the efficiency of solar energy extraction and regulate output currents.
• Ensure effective utilization of batteries within a photovoltaic system.
• Innovative integration of SMC with the Perturb and Observe (P&O) algorithm.
• Introduce a battery management system with distinct modes, and offer intelligent control in diverse scenarios.
• Contribute significantly to advancing the understanding of PV/battery systems.
In order to provide a comprehensive exploration of the integrated Buck-Boost converter and Sliding Mode Control (SMC) Maximum Power Point Tracking (MPPT) system for optimizing photovoltaic energy conversion, this paper is structured as follows. Section 2 delves into the system modeling, encompassing the modeling of PV cells, the design considerations for the Buck and Buck-Boost converters, and the proposed MPPT strategies. Following this, Section 3 elucidates the battery management aspect of the system. Moving forward, Section 4 presents the results and discussion derived from various tests conducted to evaluate the system’s performance. Specific attention is given to Test N°1, Test N°2, and Test N°3. Finally, Section 5 encapsulates the paper with a comprehensive conclusion, summarizing key findings, emphasizing the significance of the proposed system, and suggesting avenues for future research.
2 System modeling
The studied global system is depicted in Figure 1. This configuration consists of a photovoltaic system connected to a Buck converter controlled by an MPPT based on sliding mode control. The Buck converter is linked to batteries and a second Buck-Boost converter controlled in current. The power supply management of the batteries is carried out by a supervisory system adapted to the operating conditions.
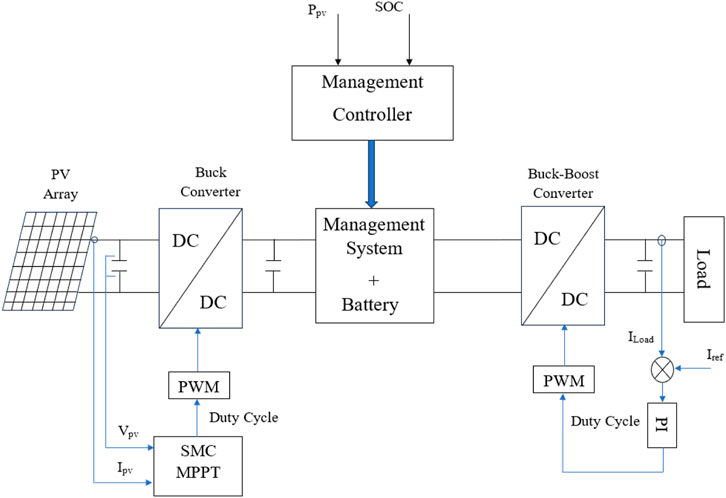
Figure 1. Global system.
2.1 PV cell modeling
Figure 2 illustrates the equivalent circuit of a solar cell. This circuit consists of a current source in parallel with a diode, accompanied by a parallel resistor and a second series resistor. Eq. (1) defines the mathematical model of the current generated by a photovoltaic cell (Fekik et al., 2023b; Fekik et al., 2022b).
Where Ipv and Vpv represent, respectively, the current and voltage output of a solar cell:
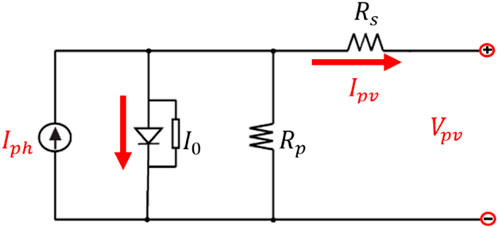
Figure 2. PV cell modeling.
Rp: is the parallel resistance, or shunt resistance, of a solar cell. In practice, the value of the resistance (Rp) is often high, so it can be neglected.
Rs: represents the series resistance.
q: is the charge of an electron (1.602 × 10^-19 Coulombs).
Iph: and Is represent, respectively, the photoelectric current and the saturation current of a diode.
N: is the ideality factor of the diode.
K: is the Boltzmann constant (1.38 × 10⁻²³ J/°K).
T: is the temperature of a cell.
The modeling of a photovoltaic panel (PV) can be performed using various methods, ranging from simple analytical models to more complex physical models based on the fundamental equations of physics. A solar module consists of a set of elementary photovoltaic cells, usually connected in series, which are then linked to other modules to form a photovoltaic generator (PVG) with the desired characteristics.
The solar generator with a power of 3,300 Wc will enable the operation of the studied system. In the context of this study, the selection of modules has been oriented towards the 330 Wc-Poly 72-cell modules, and the associated electrical parameters are presented in Table 1 below:
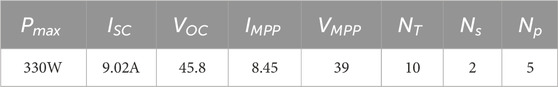
Table 1. Characteristics of the chosen photovoltaic panel.
When solar panels are connected in series, the voltage adds up with a constant current. Conversely, if they are connected in parallel, the currents add up, and the voltage remains constant. To achieve the desired characteristics, it is sometimes necessary to combine these two topologies. In the context of this study, we have 10 panels connected in a series-parallel arrangement, allowing us to obtain a PVG with the characteristics presented in Table 2 under standard operating conditions.
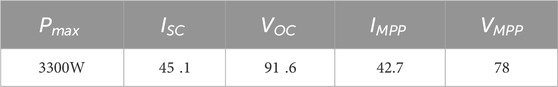
Table 2. Characteristics of the utilized photovoltaic generator.
2.2 Buck converter
The operating principle of the Buck converter shown in Figure 3 is based on the periodic switching of the switch K to create state transitions that allow energy to be stored in an inductance and released to a load (Radwan et al., 2018; Fang et al., 2021). The switch is typically controlled by a control pulse, which rapidly opens and closes based on a pulse width modulation (PWM) signal.
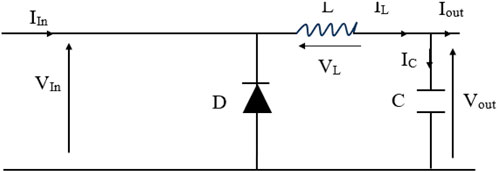
Figure 3. Equivalent circuit of the Buck converter for the closed switch K.
The choice of a buck converter over a buck-boost converter in battery chargers depends on the specific characteristics of the system and battery charging requirements. The reasons for choosing a buck converter in battery chargers are:
- Stable Input Voltage: If the input voltage of your system is generally higher than the required voltage to charge the battery, a buck converter can effectively lower this voltage to an appropriate level.
- High Efficiency: Buck converters often have higher efficiency than buck-boost converters, especially when the input voltage is close to the output voltage.
- Simplicity of Design: Buck converters tend to have simpler and more cost-effective designs than buck-boost converters. This can be an advantage in applications where complexity needs to be minimized
- Battery Characteristics: If the battery you are charging has a nominal voltage compatible with the input voltage of your system, a buck converter can be a suitable choice without requiring a boost function.
When the switch is closed (0 to DT), the diode is blocked, and the current flows through the inductance, storing energy. When the switch is open (DT to T), the diode conducts, and the current flows through it to the load. The duty cycle of the PWM signal is adjusted to regulate the desired output voltage. However, it is important to note that this device adheres to the principle of energy conservation, so if Vin > Vout, then Iin < Iout. There are two possible topologies resulting from a given position of the switch. By applying Kirchhoff’s laws to each, we can derive the equations that define them. It is worth noting that the following modeling is done for continuous conduction mode (Leng and Liu, 2017).
From 0 to DT: The switch K is closed, and the diode is reverse-biased, as shown in Figure 3.
By applying Kirchhoff’s voltage law to this circuit, the following equations (Eqs 2–5) (Ejury, 2013; Lee, 2015).
This implies:
Therefore:
Consequently:
We know that for t = 0, we will have a minimal inductor current IL, and for t = DT, we will have a maximal inductor current. Therefore, we can deduce the (Eq. 6):
So, the peak-to-peak ripple of the current, denoted as ∆iL, can be determined by the equation (Eq. 7):
The current ripple in the receiver is directly proportional to the chopping frequency used in pulse width modulation (PWM). Thus, the higher the chopping frequency, the lower the current ripple will be. This implies that a significant increase in the chopping frequency would require the use of fast-switching electronic components, such as MOSFETs, capable of rapid switching to maintain a clean voltage waveform at higher frequencies (Ejury, 2013; Lee, 2015).
From DT to T: The switch K is open, and the diode D is conducting, as shown in Figure 4.
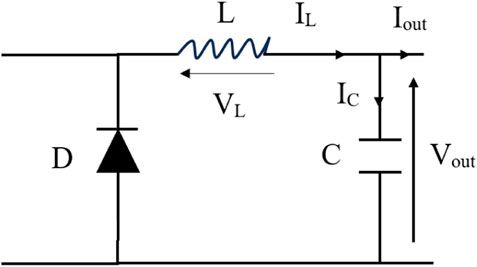
Figure 4. Equivalent circuit of the Buck converter for K open.
By applying Kirchhoff’s voltage law to this circuit, the equation (Eq. 8):
The equation (Eq. 8) becomes (Eq. 9):
And the load current is given by equation (Eq. 10)
We know that for t = DT, we will have a maximal inductor current IL, and for t = T, we will have a minimal inductor current. Therefore, we can deduce the equation (Eq. 11):
So, the peak-to-peak ripple of the current, denoted as ∆iL, can be determined by the following formula (Eq. 12):
In steady-state operation, the energy stored in each component of the Buck converter remains constant at the beginning and end of each switching cycle. Therefore, the inductor current IL flowing through the inductance also remains constant at the beginning and end of each switching cycle. This means that the current in the inductance does not change significantly during a switching period and remains practically stable [33]. The out voltage is given by equation (Eq. 13)
So:
The duty cycle D shown by the equation (Eq. 14) linearly determines the variation in the output voltage. Thus, the output voltage Vin is always less than the input voltage because the duty cycle is between 0 and 1. Under ideal conditions where there is no power loss, the average power at the input and output of the circuit is equal if we consider the inductor, diode, and switch as ideal components.
2.2.1 Dimensioning and component selection
This section presents the criteria for choosing each of the main components of the Buck-Boost converter to meet specific specifications and applications. Indeed, oversizing these components will increase the weight and cost of the circuits.
2.2.1.1 Current ripple and inductor selection
It is crucial that the sizing of the inductance L complies with the current allowed by the MOSFET transistor. If one wishes to limit the maximum current ripple ∆iL for a given value, it is essential to choose the switching frequency fs wisely. Indeed, the higher the switching frequency, the smaller the inductance core can be, which is approved by the following formula (Eq. 15), allowing us to calculate the value of L (Ejury, 2013; Lee, 2015).
This implies:
For continuous conduction mode, it is assumed that:
By combining Eqs 18, 19, we obtain a second equation allowing the calculation of the inductance value L, which is dependent on the load value:
Generally, a good estimate for the maximum tolerated ripple current of the inductance is 20%–40% of the output current (Ejury, 2013; Lee, 2015). Note that the maximum inductance value can be calculated for a duty cycle of 50%.
2.2.1.2 Voltage ripple and capacitor selection
To maintain the output voltage Vout and the current Iout constant, even during the opening of the switch, converter topologies typically include a capacitor C. The components of the converter are sized to minimize ripples in output voltages and currents during the switch transition from closing to opening and vice versa. To estimate the ripple of the output voltage, it is assumed that the current flowing through the capacitor is equal to the ripple of the current in the inductance. In other words, it is assumed that the ripple of the current flowing through the load R is zero (Choudhary and Saxena, 2014).
It is possible to observe that for each half-switching period, the capacitor stores or releases a charge ∆Vc, leading to a voltage variation across its terminals, as shown in Figure 5. This variation is given by the following formula (Eq. 21):
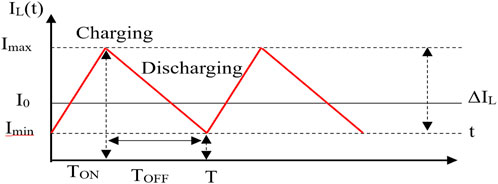
Figure 5. Charge and discharge of the output capacitor.
If the current ripple is known, then we have the following formula (Eq. 22):
For a duty cycle of 50%, we will have a maximum ripple, and this will allow us to determine the capacitor value that ensures a ripple below this value (Eq. 23):
2.3 Buck boost converter
The DC-DC converter depicted in Figure 6 is a Buck-Boost converter, a variant that controls the output voltage by delivering either a higher or lower voltage compared to the input voltage, based on the specific needs of the application. This converter amalgamates the characteristics of both Buck and Boost converters, making it suitable as an optimal transformer for generating the desired output voltage from an input voltage with reverse polarity. Additionally, it incorporates a diode for ensuring safe operation Ahmed et al., 2023; González-Castaño et al., 2022; Khan et al., 2022; Allahverdinejad et al., 2022).

Figure 6. A basic schematic of the buck-boost converter.
Therefore, the converter can be configured in two ways, and applying Kirchhoff’s laws to each allows for the extraction of equations defining it in the continuous conduction mode (Afshari et al., 2023).
2.3.1 ON-state mode of operation (switch, k, closed)
In this operational mode, the switch K remains closed for a duration of DT, where D is the duty cycle, and T is the time period. With the switch closed, offering zero resistance, the current flows through the inductor, the switch, and back to the DC input source. Throughout this period, the inductor stores energy. As the diode is in a blocked state, the inductor’s polarity reverses, enabling the current to pass through the load and the diode before returning to the inductor. Consequently, the direction of the current through the inductor remains constant (Singh et al., 2022).
Applying Kirchhoff’s voltage law to the circuit shown in Figure 7 results in the following equations, assuming the ideal characteristics of the components (Singh et al., 2022) (Eqs 24, 25):
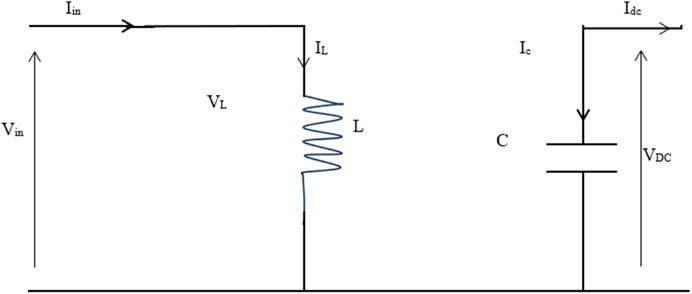
Figure 7. Structure of an Equivalent circuit of the buck-boost converter during the on-state.
By integrating the differential Eq. 10, we obtain the solution (Eq. 26):
where at
Therefore,
The peak-to-peak ripple, ∆iL in the current can be determined by utilizing the following equation (Eq. 28):
Next, we define the following:
Vin
2.3.2 OFF-state mode of operation (switch, k, open)
In the OFF cycle, from DT to T, the diode D conducts, as depicted in Figure 8. In this phase of current decay within inductor L, corresponding to the opening of switch K, the inductor discharges and redistributes the energy it had stored back to the load.

Figure 8. Equivalent Circuit of the Buck-Boost Converter during the OFF state.
Applying Kirchhoff’s voltage law to this circuit yields the following equations (Eqs 29, 30) (Singh et al., 2022):
Solving the equations with the same approach as during the ON state, the inductor current is expressed by the equation (Eq. 31)
Also, the inductor current IL, at t = T is given by the following equation (Eq. 32):
And the peak-to-peak ripple current ∆iL is determined by the following equation (Eq. 33):
The duty cycle can be derived as follows (Eq. 34):
Knowing that the output voltage is inverted, it can be written as shown in the equation (Eq. 35)
Also, the relationship between the input and the output of the converter is given as follows equation (Eq. 36):
The output voltage of the Buck-Boost converter is dictated by both the input voltage and the duty cycle, D (Mayo-Maldonado et al., 2018; Rosas-Caro et al., 2018; Singh et al., 2022). This converter functions as a step-down transformer when the duty cycle is less than 0.5 and as a step-up transformer when the duty cycle exceeds 0.5. Despite its dual functionality, it is commonly referred to as an inverting converter because the output voltage always exhibits the opposite polarity to the input voltage. While the ideal output voltage is expected to be unaffected by the load, practical considerations require regulation to offset fluctuations in the input voltage and imperfections in real components.
2.3.3 Current ripple and inductor selection
The choice of inductance in a Buck-Boost converter demands careful consideration to enhance efficiency, stability, and overall circuit performance. This optimization process involves utilizing the previously defined equations (Ejury, 2013; Lee, 2015).
Eq. 37 establishes a connection between the change in inductor current (∆iL), the direct current voltage (VDC), the inductance (L), and the time period (T) minus the product of the duty cycle and the time period (DT). This change in inductor current essentially represents the difference between the maximum and minimum inductor currents is given by equation (Eq. 37).
The given equation articulates the variation in inductor current with respect to the direct current voltage (VDC), the switching frequency (fs), the inductance (L), and the complement of the duty cycle (1 - D) as shown by the equation (Eq. 38):
Eq. 23 can be resolved to find the inductance (L) in relation to the direct current voltage (VDC), switching frequency (fs), change in inductor current (∆iL), and the complement of the duty cycle (1 - D). Additionally, the expression for VDC is provided in terms of D/(1-D) * Vin, as illustrate by the equation (Eq. 39):
Thus, we obtain the equation (Eq. 40):
2.3.4 Voltage ripple and capacitor selection
A. Selecting the suitable capacitor for the Buck-Boost converter typically involves beginning with a standard capacitor value and verifying if it aligns with the converter’s specifications. In cases where the voltage ripple exceeds acceptable limits, opting for a larger capacitor is advisable to mitigate the voltage ripple (Ejury, 2013; Lee, 2015).
By examining the current waveform depicted in Figure 9, it becomes feasible to ascertain the fluctuation in voltage across the capacitor, given by the equation (Eq. 17):
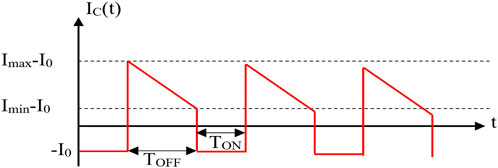
Figure 9. Current waveform across the capacitor.
This equation describes the variation in charge (∆Q) within a circuit element. It equals the negative of the product of the voltage across the element (VDC) and the reciprocal of the resistance (R), multiplied by the change in time (DT), as shown by the equation (Eq. 42):
This equation establishes a connection between the absolute value of the change in output voltage (|∆VDC|) and the ratio of the change in charge (∆Q) to the capacitance (C). Additionally, it is expressed in terms of the output voltage (VDC), resistance (R), capacitance (C), and the change in time (DT), as given by the equation (Eq. 43):
In this context, C denotes the capacitance, VDC is the output voltage, R represents the resistance, ∆VDC is the change in output voltage, fs is the switching frequency, and D stands for the duty cycle. This equation establishes a relationship between capacitance, output voltage, resistance, change in output voltage, switching frequency, and duty cycle, as shown by the equation (Eq. 44):
The provided equation expresses capacitance in terms of the output current (IDC), the change in output voltage (∆VDC), switching frequency (fs), and duty cycle (D).
Leveraging the previously discussed equations, we conducted a dimensioning process, as illustrated in Table 3 below. It is noteworthy that our approach differs from the conventional method of fixing a switching frequency (fs) and then searching for appropriate hardware. Instead, we calculated the suitable frequency based on the available hardware.
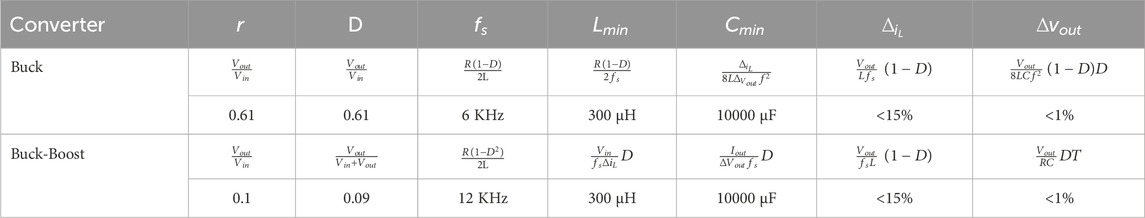
Table 3. Dimensioning of the regulation stages used in the system.
3 Proposed MPPT
Numerous algorithms have been suggested to optimize the operation of the PV array at the maximum power point (Mostafa et al., 2020). This paper employs and compares Perturb and Observe (P&O) and Sliding Mode Control (SMC) methods, as elaborated later.
3.1 Classical perturb and observe (P&O)
The Perturb and Observe (P&O) algorithm stands out as the most commonly employed method for tracking the maximum power point. The P&O MPPT technique operates by periodically perturbing the terminal voltage of the PV array, incrementing or decrementing a control parameter by a small amount until reaching the maximum power point. The process involves measuring the power, introducing a small perturbation, measuring the new power, and determining the direction of perturbation based on the sign of the power change. If the change is positive, the control system continues perturbing in the same direction; otherwise, it adjusts the operating point in the opposite direction (Bharambe and Mahajari, 2015; Lamnadi et al., 2016).
However, this method has notable drawbacks. In steady-state operation, the obtained power oscillates around the maximum power point, potentially causing the tracking to deviate under rapidly changing environmental conditions. Additionally, the step size not only defines the range of oscillation around the MPP during steady-state operation but also governs the speed of convergence to the MPP.
3.2 Sliding mode MPPT
The sliding mode control (SMC) process represents a nonlinear controller, falling within the category of dynamic controllers designed to provide robust control for intricate, high-order nonlinear dynamic plants operating in uncertain conditions (Bartoszewicz and Żuk, 2010; Singh et al., 2017; Meng et al., 2018; Vaidyanathan et al., 2019). In conjunction with this, Perturb and Observe (P&O) is utilized to track the maximum power point, acquiring Vref for subsequent comparison with the actual Vpv in varying environmental conditions (Mostafa et al., 2020). Subsequently, the current controller, employing IC, engages the hysteresis loop to generate the signal (u) for toggling the converter between on (1) and off (0).
Regarding the dynamic analysis of SMC:
With G1 and G2 are constants gain; To implement the proposed technique, (S) must be equal to zero, and dS/dt should also be zero.
From this standpoint, the derivative of equation (Eq. 45) is given by equation (Eq. 46)
And
Deriving Eqs 47 and 48, we arrive at the subsequent expression:
We have also the equations (Eqs 50–52):
By substituting Eqs 52 and 48, and Eq. 47 into Eq. 46, we obtain the following expression:
With
By substituting Eq. 53 into Eq. 54, we can express the relation as given by the equation (Eq. 55):
4 Battery management
This module incorporates a 640Ah capacity battery with a programmable state of charge, accompanied by an intelligent supervisory control system managing battery behavior in critical scenarios using three switches: “Charging,” “Direct,” and “Discharging."
The charging behavior of the battery (PLoad) can be described by the following equations:
When.
Ppv exceeds PLoad (battery charging) (see Eq. 56):
When Ppv is less than PLoad (battery discharging) (see Eq. 57):
where:
PLoad: Battery charging power (positive for charging, negative for discharging).
Ppv: Photovoltaic power (solar panels).
PBat: Battery power (positive for discharging, negative for charging, based on charging/discharging conditions and the state of the “Charging,” “Direct,” “Discharging” switches).
5 Results and discussion
The photovoltaic panel will serve as the power source for the entire system, followed by a Buck-type adaptation stage controlled by a proposed Maximum Power Point Tracking (MPPT) command, along with a load in the form of a battery. Figure 10 below illustrates the voltage-current and power-voltage characteristics of the selected module under standard operating conditions in terms of temperature and irradiation (25°C, 1000 W/m2):
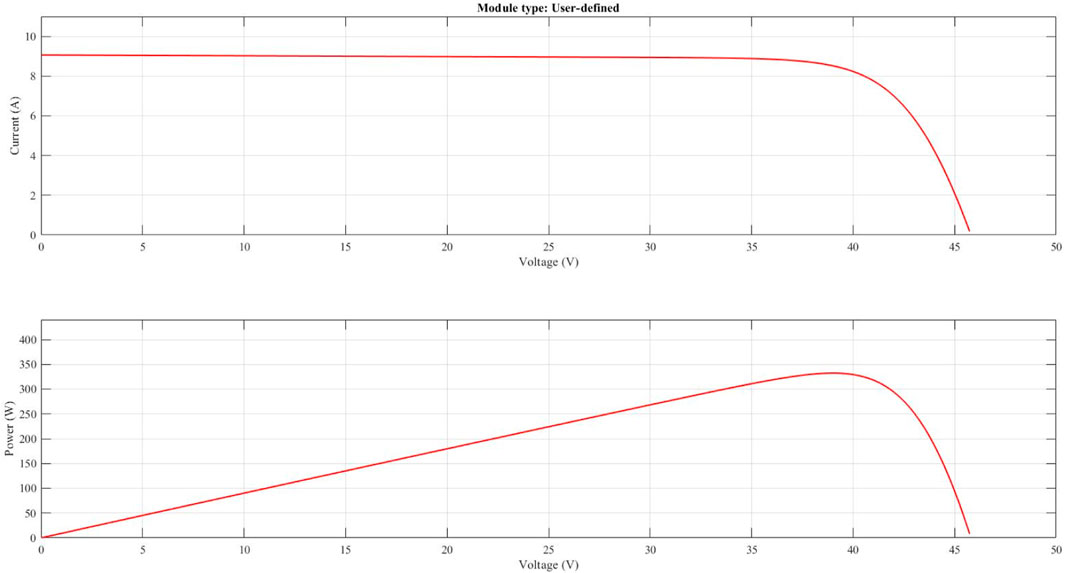
Figure 10. Characteristics of I (V) and P (V) for the selected module.
To gain a preliminary insight into the behavior of the PV generator, consisting of 2 modules in series and 5 in parallel as indicated in Table 1, we have studied its response to variations in temperature and irradiation.
From Figure 11, it can be observed that irradiance has a direct impact on current; as irradiance increases, the current intensity increases, and the I(V) curves shift towards higher values, allowing the module to produce more electrical power.
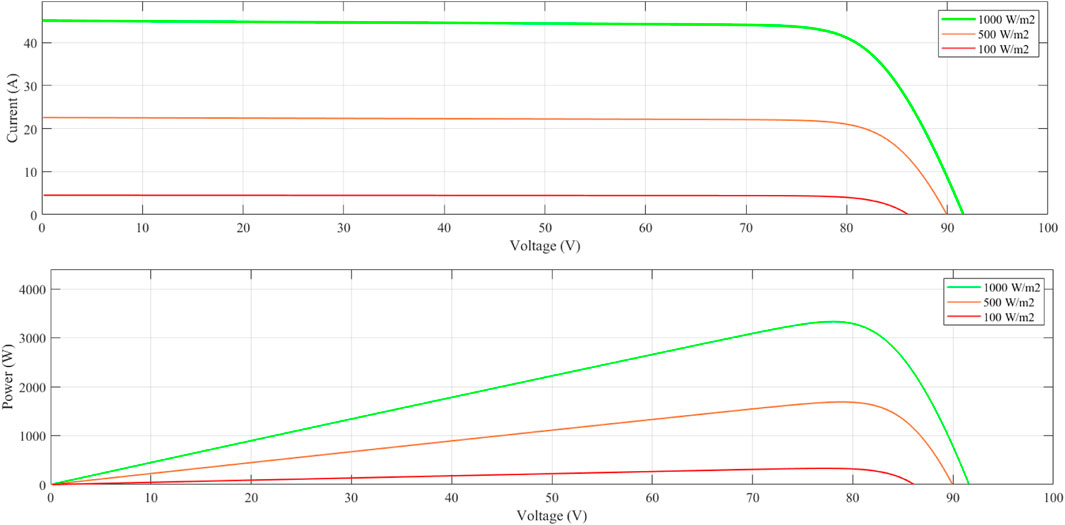
Figure 11. Characteristic of the PV generator for different irradiance values.
To test the validity and feasibility of the proposed structure and MPPT technique, three tests will be conducted.
5.1 TestN°1
In this test, the state of charge of the battery (SOC) and the irradiance are kept constant, as shown in Figures 12A,D. The state of the switches is observed, as depicted in Figure 12B,C, F.
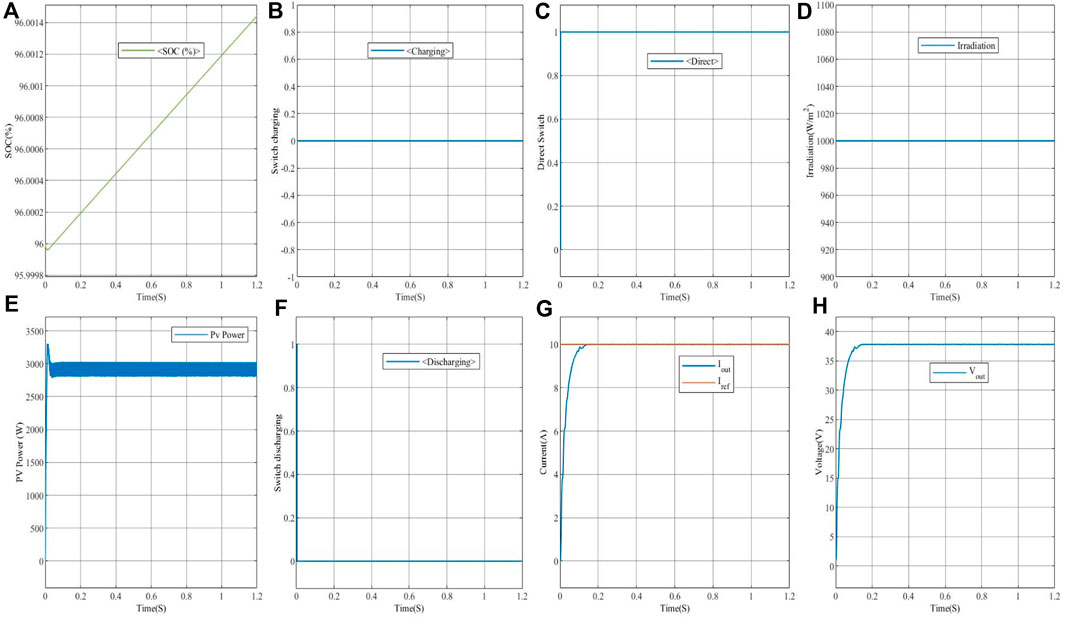
Figure 12. Simulation results for a state of charge (SOC) greater than 95% with constant irradiance = 1000 W/m2.
It is observed that when the power supplied by the panel is sufficient and constant, as shown in Figure 12E due to constant irradiance (G = 1000 W/m2) to meet the requirements of the load, the battery maintains a constant charge level. This confirms the robustness of the proposed MPPT technique based on the sliding mode. It is also noteworthy that the direct switch is activated, indicating that the load is powered by the PV generators, while the other two switches are deactivated. Figures 12G, H depict the current and voltage at the output of the buck-boost converter, maintained constant at their desired values through regulation ensured by the PI controller.
5.2 TestN°2
In this test, the state of charge of the battery (SOC) is maintained constant, as depicted in Figure 13A, while the irradiance varies according to the profile shown in Figure 13D. The state of the switches is observed, as indicated in Figures 13B,C, F.
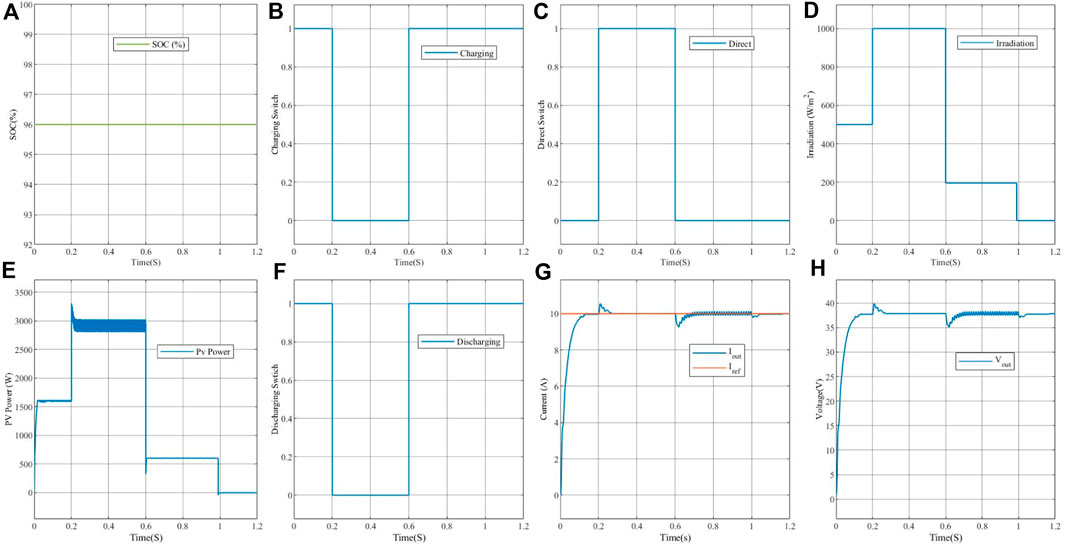
Figure 13. Simulation results for a state of charge (SOC) greater than 95% with variable irradiance.
When the power provided by the panel exceeds 1500 W and the SOC is constant, the discharge and charge switches are activated (see Figures 13B,F) to compensate for the power deficiency, ensuring that the current and voltage at the output of the buck-boost converter are maintained at their desired values and the battery remains fully charged.
From time (t = 0.2 to t = 0.6 s), with irradiance G = 1000 W/m2, as shown in Figure 13D, the power supplied by the photovoltaic generator is sufficient. It can be observed that the charge and discharge switches are deactivated, while the Direct switch is activated, as depicted in Figures 13B, C, F. The current and output voltage remain constant after a slight disturbance.
From time (t = 0.6 to t = 1.2 s), when the power supplied by the photovoltaic generator is insufficient, the discharge and charge switches are activated to compensate for the power deficiency from the PV generator with the battery, as shown in Figures 13C, E, F. This ensures that the voltage and current at the output of the buck-boost converter are maintained at their desired levels, as illustrated in Figures 13G, H.
5.3 TestN°3
In this test, the brightness remains constant, as shown in Figure 14D, while the state of charge of the battery (SOC) varies according to the profile presented in Figure 14A. The state of the switches is observed, as illustrated in Figures 14B, C, F. When the state of charge of the battery (SOC) is above 95%, the discharge and charge switches are deactivated (see Figures 14B, F), as there is no lack of power, and the battery’s state of charge is satisfactory. The power supplied by the PV generator keeps the current and voltage at the output of the buck-boost converter at their desired values, thus maintaining the battery at its full charge, with the Direct switch activated (see Figure 14C).
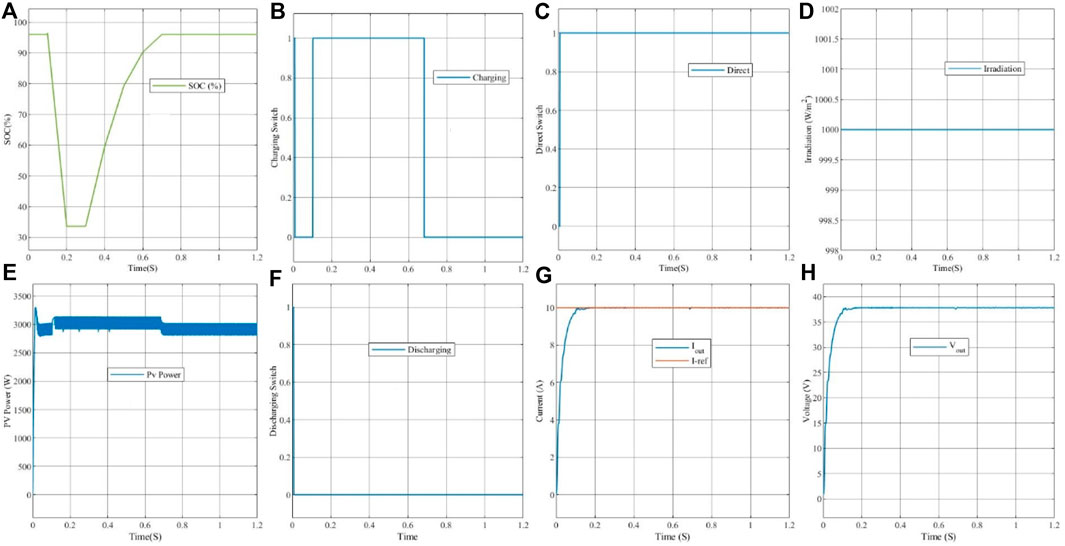
Figure 14. Simulation results for a variable state of charge (SOC) with constant irradiance = 1000 W/m2.
From time (t = 0.2 to t = 0.7 s), the state of charge of the battery varies according to the profile shown in Figure 14A. The power supplied by the photovoltaic generator remains sufficient, as shown in Figure 14E, with constant illumination. The activation of the charge switches is noted to charge the battery with the power generated by the PV generator, as shown in Figure 14B. The discharge switch remains deactivated as long as the PV power is sufficient, while the Direct switch is activated, as illustrated in Figure 14C. The current and output voltage remain constant after a slight disturbance.
From time (t = 0.7 to t = 1.2 s), the power supplied by the photovoltaic generator remains sufficient. The deactivation of the discharge and charge switches is observed, while the Direct switch is activated to maintain a constant current and voltage at their desired values.
5.4 TestN°4
In this test, both the brightness and the state of charge of the battery (SOC) remain constant, as indicated in Figures 15A,D. A charge disturbance is introduced from time t = 0.3 to t = 0.6 s, followed by deactivating the disturbance from t = 0.6–1.2 s. The state of the switches is observed, as illustrated in Figures 15B, C, F.
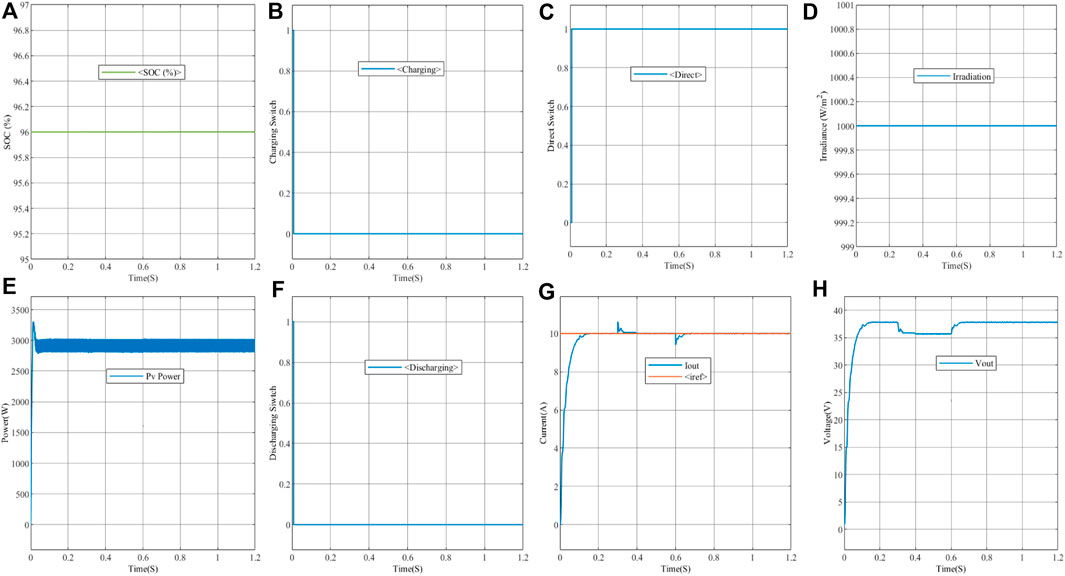
Figure 15. Simulation results for a variable load.
Upon introducing the charge disturbance, a perturbation is observed in the current curve (Figure 15G), stabilizing subsequently at the imposed reference value, Iref = 10A, confirming the robustness of the implemented controller. However, the output voltage at the load exhibits a slight drop due to the charge disturbance. Analysis of the switch states reveals that the power is supplied by the PV panel (Figure 15E).
This temporary current perturbation can be attributed to the system’s response to the load variation, while the slight voltage drop may result from the converter’s response to the disturbance. These observations demonstrate the system’s ability to maintain stability despite temporary disturbances, thereby validating the effectiveness of the implemented control.
6 Conclusion and future works
This research introduces an innovative approach to power control in PV/battery systems by integrating sliding mode MPPT with advanced energy management through a dual Buck converter. The study focuses on optimizing solar energy extraction, regulating current, and ensuring efficient battery utilization. Simulations conducted on MATLAB with two converters (buck and buck-boost) validate the proposed hybrid topology, contributing significantly to the advancement of sustainable and efficient energy solutions.
The results showcase the robustness of the sliding mode MPPT technique under various conditions. Tests conducted under constant and variable solar irradiance, coupled with State of charge (SOC) variations, demonstrate the system’s adaptability and efficiency. The supervisory system effectively manages the power supply of the buck-boost converter based on battery charge levels, addressing specific scenarios such as insufficient solar power.
This study not only advances the understanding of PV/battery power control but also underscores the potential of integrating sliding mode MPPT and dual Buck converters for optimizing energy production, distribution, and storage. The results presented herein pave the way for further exploration and implementation of these innovative techniques in real-world applications, marking a significant stride towards a more sustainable and efficient energy future.
Data availability statement
The original contributions presented in the study are included in the article/supplementary material, further inquiries can be directed to the corresponding authors.
Author contributions
AF: Conceptualization, Data curation, Formal Analysis, Funding acquisition, Investigation, Methodology, Project administration, Resources, Software, Supervision, Validation, Visualization, Writing–original draft, Writing–review and editing. MH: Conceptualization, Data curation, Project administration, Software, Visualization, Writing–original draft, Writing–review and editing. AA: Conceptualization, Formal Analysis, Funding acquisition, Investigation, Methodology, Supervision, Visualization, Writing–original draft, Writing–review and editing. MG: Conceptualization, Formal Analysis, Investigation, Methodology, Resources, Software, Supervision, Validation, Visualization, Writing–original draft, Writing–review and editing. AH: Conceptualization, Data curation, Formal Analysis, Software, Visualization, Writing–original draft. HD: Conceptualization, Methodology, Resources, Software, Validation, Visualization, Writing–original draft, Writing–review and editing. IH: Conceptualization, Formal Analysis, Funding acquisition, Investigation, Methodology, Project administration, Resources, Writing–original draft, Writing–review and editing.
Funding
The author(s) declare financial support was received for the research, authorship, and/or publication of this article. This research was funded by the Norwegian University of Science and Technology. This research is supported by Automated Systems and Soft Computing Lab (ASSCL), Prince Sultan University, Riyadh, Saudi Arabia.
Acknowledgments
The authors would like to acknowledge the support of the Norwegian University of Science and Technology for paying the Article Processing Charges (APC) of this publication. The authors would like to thank Prince Sultan University, Riyadh, Saudi Arabia for their support. Special acknowledgment to Automated Systems and Soft Computing Lab (ASSCL), Prince Sultan University, Riyadh, Saudi Arabia. In addition, the authors wish to acknowledge the editor and anonymous reviewers for their insightful comments, which have improved the quality of this publication.
Conflict of interest
The authors declare that the research was conducted in the absence of any commercial or financial relationships that could be construed as a potential conflict of interest.
Publisher’s note
All claims expressed in this article are solely those of the authors and do not necessarily represent those of their affiliated organizations, or those of the publisher, the editors and the reviewers. Any product that may be evaluated in this article, or claim that may be made by its manufacturer, is not guaranteed or endorsed by the publisher.
References
Afshari, H., Husev, O., and Vinnikov, D. (2023). “A novel isolated buck-boost dc-dc converter with wide range of voltage regulations,” in 2023 IEEE 17th International Conference on Compatibility, Power Electronics and Power Engineering (CPE-POWERENG) (Tallinn, Estonia: IEEE), 1–6.
Ahmed, N., Sher, H. A., Al-Durra, A., and Hasanien, H. M. (2023). Comprehensive analysis and design of a switched-inductor type low inductance-requirement DC-DC buck-boost converter for low power applications. IET Power Electron 16, 1239–1254. doi:10.1049/pel2.12465
Allahverdinejad, B., Modaberi, S. A., and Ajami, A. (2022). “A non-isolated buck-boost DC–DC converter with continuous input current and wide conversion ratio range for photovoltaic applications,” in 2022 13th Power Electronics, Drive Systems, and Technologies Conference (PEDSTC), Tehran, Iran, Islamic Republic of, 01-03 February 2022 (IEEE), 491–497.
Ammar, H. H., Azar, A. T., Shalaby, R., and Mahmoud, M. I. (2019). Metaheuristic optimization of fractional order incremental conductance (FO-INC) maximum power point tracking (MPPT). Complexity 2019, 1–13. doi:10.1155/2019/7687891
Bartoszewicz, A., and Żuk, J. (2010). “Sliding mode control—basic concepts and current trends,” in 2010 IEEE international symposium on industrial electronics, Bari, Italy, 04-07 July 2010 (IEEE), 3772–3777.
Benhalima, S., Miloud, R., and Chandra, A. (2018). Real-time implementation of robust control strategies based on sliding mode control for standalone microgrids supplying non-linear loads. Energies 11 (10), 2590. doi:10.3390/en11102590
Bharambe, V. R., and Mahajari, K. M. (2015). Implementation of P&O MPPT for PV System with using buck dan buck-boost converters. Int. J. Res. Electr. Eng. 2 (3), 5–10.
Choudhary, D., and Saxena, A. R. (2014). DC-DC buck-converter for MPPT of PV system. Int. J. Emerg. Technol. Adv. Eng. 4 (7), 813–821.
Fachrizal, R., Qian, K., Lindberg, O., Shepero, M., Adam, R., Widén, J., et al. (2024). Urban-scale energy matching optimization with smart EV charging and V2G in a net-zero energy city powered by wind and solar energy. eTransportation 20 (1), 100314. doi:10.1016/j.etran.2024.100314
Fang, J. S., Tsai, S. H., Yan, J. J., Chen, P. L., and Guo, S. M. (2021). Realization of DC–DC buck converter based on hybrid ${H_2} $ model following control. IEEE Trans. Industrial Electron. 69 (2), 1782–1790. doi:10.1109/tie.2021.3062268
Fekik, A., Azar, A. T., Hameed, I. A., Hamida, M. L., Amara, K., Denoun, H., et al. (2023a). Enhancing photovoltaic efficiency with the optimized steepest gradient method and serial multi-cellular converters. Electronics 12 (10), 2283. doi:10.3390/electronics12102283
Fekik, A., and Benamrouche, N. (2022). Modeling and control of static converters for hybrid storage systems. United States: IGI GLOBAL, 1–355. doi:10.4018/978-1-7998-7447-8
Fekik, A., Ghanes, M., and Denoun, H. (2023b). Power electronics converters and their control for renewable energy applications. 1st edition. Elsevier, 1–337. doi:10.1016/C2020-0-04639-6
Fekik, A., Hamida, M. L., Houassine, H., Azar, A. T., Kamal, N. A., Denoun, H., et al. (2022b). “Power quality improvement for grid-connected photovoltaic panels using direct power control,” in Modeling and control of static converters for hybrid storage systems” (United States: IGI Global), 107–142. doi:10.4018/978-1-7998-7447-8.ch005
González-Castaño, C., Restrepo, C., Flores-Bahamonde, F., and Rodriguez, J. (2022). A composite DC–DC converter based on the versatile buck–boost topology for electric vehicle applications. Sensors 22 (14), 5409–5419. doi:10.3390/s22145409
Hai, T., Zain, J. M., and Muranaka, K. (2023). A novel global MPPT technique to enhance maximum power from pv systems under variable atmospheric conditions. Soft Comput., 1–14. doi:10.1007/s00500-023-09069-w
Haq, I. U., Khan, Q., Ullah, S., Khan, S. A., Akmeliawati, R., Khan, M. A., et al. (2022). Neural network-based adaptive global sliding mode MPPT controller design for stand-alone photovoltaic systems. Plos one 17 (1), e0260480. doi:10.1371/journal.pone.0260480
Hassan, Q., Algburi, S., Sameen, A. Z., Salman, H. M., and Jaszczur, M. (2023). A review of hybrid renewable energy systems: solar and wind-powered solutions: challenges, opportunities, and policy implications. Results Eng. 20 (1), 101621. doi:10.1016/j.rineng.2023.101621
Katche, M. L., Makokha, A. B., Zachary, S. O., and Adaramola, M. S. (2023). A comprehensive review of maximum power point tracking (mppt) techniques used in solar pv systems. Energies 16 (5), 2206. doi:10.3390/en16052206
Khalid, M. (2024). Smart grids and renewable energy systems: perspectives and grid integration challenges. Energy Strategy Rev. 51 (1), 101299. doi:10.1016/j.esr.2024.101299
Khan, M. S., Nag, S. S., Das, A., and Yoon, C. (2022). Analysis and control of an input-parallel output-series connected buck-boost DC-DC converter for electric vehicle powertrains. IEEE Trans. Transp. Electrification 9 (2), 2015–2025. doi:10.1109/tte.2022.3216610
Lamnadi, M., Trihi, M., Bossoufi, B., and Boulezhar, A. (2016). Comparative study of IC, P&O and FLC method of MPPT algorithm for grid connected PV module. J. Theor. Appl. Inf. Technol. 89 (1), 242–253.
Lee, J. (2015). Basic calculation of a buck converter’s power stage. Application Note AN041. Hsinchu, Taiwan: Richtek Technology Corporation, 1–8.
Leng, Z., and Liu, Q. (2017). “A simple model predictive control for Buck converter operating in CCM,” in 2017 IEEE International Symposium on Predictive Control of Electrical Drives and Power Electronics (PRECEDE), Pilsen, Czech Republic, 04-06 September 2017 (IEEE), 19–24.
Mandourarakis, I., Gogolou, V., Koutroulis, E., and Siskos, S. (2022). Integrated maximum power point tracking system for photovoltaic energy harvesting applications. IEEE Trans. Power Electron. 37 (8), 9865–9875. doi:10.1109/tpel.2022.3156400
Manuel, N. L., and İnanç, N. (2022). Sliding mode control-based MPPT and output voltage regulation of a stand-alone PV system. Power Electron. Drives 7 (1), 159–173. doi:10.2478/pead-2022-0012
Mayo-Maldonado, J. C., Valdez-Resendiz, J. E., Garcia-Vite, P. M., Rosas-Caro, J. C., del Rosario Rivera-Espinosa, M., and Valderrabano-Gonzalez, A. (2018). Quadratic buck–boost converter with zero output voltage ripple at a selectable operating point. IEEE Trans. Industry Appl. 55 (3), 2813–2822. doi:10.1109/tia.2018.2889421
Meghni, B., Dib, D., Azar, A. T., Ghoudelbourk, S., and Saadoun, A. (2017). Robust adaptive supervisory fractional order controller for optimal energy management in wind turbine with battery storage. Stud. Comput. Intell. 688, 165–202.
Meghni, B., Dib, D., Azar, A. T., and Saadoun, A. (2018). Effective supervisory controller to extend optimal energy management in hybrid wind turbine under energy and reliability constraints. Int. J. Dyn. Control 6 (1), 369–383. doi:10.1007/s40435-016-0296-0
Meng, Z., Shao, W., Tang, J., and Zhou, H. (2018). Sliding-mode control based on index control law for MPPT in photovoltaic systems. CES Trans. Electr. Mach. Syst. 2 (3), 303–311. doi:10.30941/cestems.2018.00038
Mostafa, M. R., Saad, N. H., and El-sattar, A. A. (2020). Tracking the maximum power point of PV array by sliding mode control method. Ain Shams Eng. J. 11 (1), 119–131. doi:10.1016/j.asej.2019.09.003
Potrč, S., Čuček, L., Martin, M., and Kravanja, Z. (2021). Sustainable renewable energy supply networks optimization–The gradual transition to a renewable energy system within the European Union by 2050. Renew. Sustain. Energy Rev. 146, 111186. doi:10.1016/j.rser.2021.111186
Radwan, A. G., Emira, A. A., Abdelaty, A., and Azar, A. T. (2018). Modeling and analysis of fractional order DC-DC converter. ISA Trans. 82, 184–199. doi:10.1016/j.isatra.2017.06.024
Rosas-Caro, J. C., Valdez-Resendiz, J. E., Mayo-Maldonado, J. C., Alejo-Reyes, A., and Valderrabano-Gonzalez, A. (2018). Quadratic buck–boost converter with positive output voltage and minimum ripple point design. IET Power Electron. 11 (7), 1306–1313. doi:10.1049/iet-pel.2017.0090
Singh, A., Gupta, J., and Singh, B. (2022). “Design and control of two stage battery charger for low voltage electric vehicle using high gain buck-boost PFC AC-DC converter,” in 2022 IEEE 2nd International Conference on Sustainable Energy and Future Electric Transportation (SeFeT), Hyderabad, India, 04-06 August 2022 (IEEE), 1–6.
Singh, S., Azar, A. T., Ouannas, A., Zhu, Q., Zhang, W., and Na, J. (2017). “Sliding mode control technique for multi-switching synchronization of chaotic systems,” in Proceedings of 9th International Conference on Modelling, Identification and Control (ICMIC 2017), Kunming, China, July 10-12, 2017 (IEEE), 880–885.
Vaidyanathan, S., Azar, A. T., Akgul, A., Lien, C. H., Kacar, S., and Cavusoglu, U. (2019). A memristor-based system with hidden hyperchaotic attractors, its circuit design, synchronisation via integral sliding mode control and an application to voice encryption. Int. J. Automation Control (IJAAC) 13 (6), 644–667. doi:10.1504/ijaac.2019.102665
Keywords: buck converter, buck-boost converter, PI controller, supervisory control, hybrid power management, SMC-MPPT
Citation: Fekik A, Hamida ML, Azar AT, Ghanes M, Hakim A, Denoun H and Hameed IA (2024) Robust power control for PV and battery systems: integrating sliding mode MPPT with dual buck converters. Front. Energy Res. 12:1380387. doi: 10.3389/fenrg.2024.1380387
Received: 01 February 2024; Accepted: 14 February 2024;
Published: 08 April 2024.
Edited by:
Praveen Kumar Balachandran, Vardhaman College of Engineering, IndiaReviewed by:
Sudhakar Babu Thanikanti, Chaitanya Bharathi Institute of Technology, IndiaPriya Ranjan Satpathy, Council of Scientific and Industrial Research (CSIR), India
Veerpratap Meena, Malaviya National Institute of Technology, India
Copyright © 2024 Fekik, Hamida, Azar, Ghanes, Hakim, Denoun and Hameed. This is an open-access article distributed under the terms of the Creative Commons Attribution License (CC BY). The use, distribution or reproduction in other forums is permitted, provided the original author(s) and the copyright owner(s) are credited and that the original publication in this journal is cited, in accordance with accepted academic practice. No use, distribution or reproduction is permitted which does not comply with these terms.
*Correspondence: Arezki Fekik, a.fekik@univ-bouira.dz; Ibrahim A. Hameed, ibib@ntnu.no