An efficient multi-timescale regulation strategy for distribution networks based on active and passive resources combined
 Kewen Li
 Xinhao Lin
 Wei Zhang1
  Min Xu
 Junhao Li
- 1Electric Power Science Research Institute of Guangxi Power Grid Co., Ltd, Nanning, China
- 2Electric Power Research Institute of China Southern Power Grid, Guangzhou, China
Introducing solar and wind power into distribution networks (DNs) is an important initiative to promote the cleanliness and low-carbonization operation of DNs. However, the source and load outputs are uncertain in DNs, which will lead to problems of inaccurate regulation and insufficient renewable energy utilization. Therefore, this study provides an efficient multi-timescale regulation strategy for DNs based on active and passive resources combined. First, the day-ahead regulation model is constructed to minimize the total operating cost in a day for DNs. It aims to determine the on-load tap changer (OLTC) and capacitor bank (CB) switching schemes and consider them as the constraints for intraday regulation by power flow unification. Then, an intraday source and load uncertainty model is considered, which aims to cope with the problems of inaccuracies in the day-ahead source and load prediction. Based on this, the objective function of the intraday regulation model is set. It aims to minimize the deviation from the total day-ahead cost and then ensure the optimal system economy and determine the intraday new energy and energy storage system (ESS) short-time action scheme. Finally, the example results show that the proposed scheme can achieve the maximum utilization of renewable energy and improve the low-carbon economic operation of the whole system.
1 Introduction
With the increasing prominence of environmental issues and energy security, renewable energy development has gained importance. Renewable energy sources, such as solar and wind, are widely used in distribution networks (DNs) to enhance their low-carbon economic operation (Yang et al., 2021). However, distributed power output will lead to a voltage increase at the renewable energy access point, which may result in a voltage overrun (Karthikeyan et al., 2017; Zhang and Xu, 2020; Tewari et al., 2021; Chathurangi et al., 2022), limiting the further utilization of renewable energy. At the same time, the uncertainty of renewable energy output and the inaccuracies in renewable energy prediction make it difficult to coordinate the regulation strategy established over the day-ahead long timescale (Huo et al., 2018; Langenmayr et al., 2020; Wang et al., 2021). Therefore, it is one of the key issues to improve the benefits of distributed power grid connections, i.e., under the condition of meeting the voltage limit of the DN, to enhance renewable energy output and solve the problem of new energy output fluctuation in a short time.
Existing regulation is generally achieved by power electronic devices. For example, a SOP-based voltage regulation scheme is proposed to solve the voltage overrun problem caused by high-penetration renewable energy (Hu et al., 2020; You and Lu, 2022; Li et al., 2023). However, power electronic devices are costly, and their nonlinear and fast-switching characteristics can adversely affect power quality. The utilization of passive resources such as an on-load tap changer (OLTC) and a capacitor bank (CB), which are already present in DNs, can be cost-saving and relatively economical. Xu et al. (2023) prevented the DN voltage from being too high by reducing the voltage through the OLTC when the active power of photovoltaic (PV) is high. To ensure the safety of DN operation, the tap position of the OLTC and the number of CB casting groups are robustly optimized to effectively regulate the node voltage within the desired range (Ma et al., 2021). However, the potential of OLTC regulation in promoting renewable energy utilization is neglected. Therefore, some studies have investigated the DN voltage regulation scheme based on the OLTC and PV with its own static synchronous compensator function to regulate the DN voltage, which requires no additional equipment and is conducive to the renewable energy utilization of the DN (Dutta et al., 2020). Furthermore, interconnection scenarios have been investigated. The coordinated voltage and reactive power optimization model using the OLTC and CB demonstrated that reactive voltage regulation can improve the utilization of PV (Home-Ortiz et al., 2022). However, the above studies did not consider the combined regulation of passive resources such as the OLTC and CB and active resources such as renewable energy and energy storage systems (ESSs) under different timescales, which cannot achieve the optimal utilization of renewable energy. In addition, some scholars have established a day-ahead optimization model with the objective of achieving optimal operating costs. In the intraday optimization model, the voltage fluctuation is smoothed by optimizing the PV reactive power output to reduce the control cost (Guo et al., 2014). However, it does not consider distributed power sources such as the ESS that may still exist in the DN. A day-ahead–intraday active reactive power coordination reduction optimization model is proposed for the DN (Zhang et al., 2020). The day-ahead stage reduces voltage fluctuation through active reactive power coordination, but it only performs reactive power optimization in the intraday stage. A two-stage active–reactive power coordination optimization model is constructed, which integrates various regulation devices (Gao et al., 2017). The OLTC, CB, and ESS are used as decision variables in the day-ahead phase, and the output of the static reactive power compensator is optimized in the intraday phase, improving the economy of system operation. However, it is difficult to give full play to the fast regulation advantage of day-ahead scheduling for the ESS only.
Therefore, this study proposes an efficient multi-timescale regulation strategy for the DN based on the combined active and passive resources. It matches the intraday short-time regulation with the day-ahead OLTC and CB casting schemes for combined regulation. First, with the objective of optimal system economic cost, the regulation generates the OLTC and CB switching schemes for the next 24 h. The OLTC and CB switching schemes are taken as the intraday constraints. Then, source and load uncertainty modeling is performed in the intraday regulation stage, aiming to reduce the negative impacts on the system operation caused by renewable energy short-term output fluctuation and the source and load prediction inaccuracies in the day-ahead stage. Furthermore, to minimize the deviation between the total intraday operating cost and the day-ahead economic cost, a regulation model is established to optimize the economic performance of the system. The optimal regulation instructions for renewable energy and ESS are obtained by solving the model. In this way, the optimal utilization of renewable energy can be realized under the premise of satisfying the voltage limit of the DN, and the low-carbon economic operation capability of the system can be improved.
2 Combined active and passive resource multi-timescale regulation framework
In this study, the DN containing source and passive resources is taken as the object of study. Active resources include PV, wind turbine (WT), and ESS, and passive resources include OLTC and CB. To fully coordinate the fast- and slow-regulation characteristics of multiple resources, a multi-timescale regulation framework is proposed, as shown in Figure 1. It consists of two phases of day-ahead and intraday regulation.
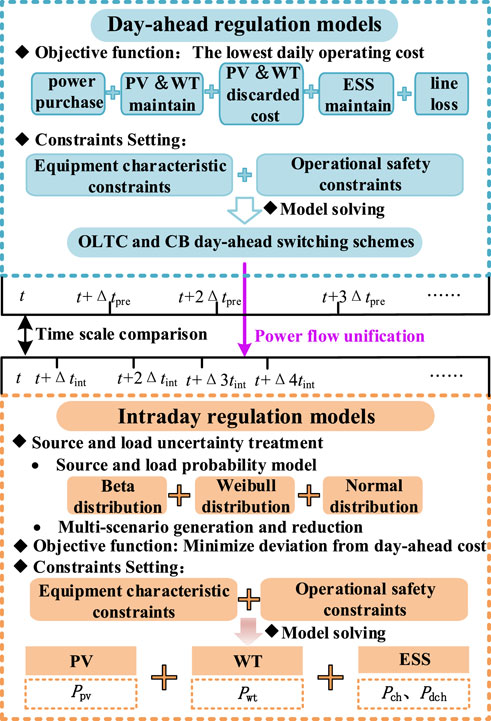
Figure 1. Framework of multi-time scale regulation.
First, basic parameters such as network lines and forecast loads are collected to determine the initial conditions for model building and solving. Then, the objective function of the day-ahead regulation model is to minimize the total operating cost in a day. It includes main grid power purchase costs, active loss costs, renewable energy and ESS maintenance costs, and wind and light discarded costs. The constraints on the characteristics of key equipment such as OLTC and CB, as well as the power flow and safety constraints on system operation, are set. The non-convex constraints in the model are relaxed using cone optimization to improve the model solution rate. The model is solved to determine the OLTC and CB switching scheme, which are used as the constraints for the intraday operation regulation using power flow unification to achieve the intraday regulation of the OLTC, thus adjusting the voltage of the root node and the renewable energy access point. In the intraday phase, the source and load uncertainty is modeled, which is based on the probabilistic model of renewable energy and load output, to cope with the high volatility and inaccuracies in the source and load prediction. On this basis, the intraday regulation model is constructed to minimize the deviation from the total day-ahead cost. At the same time, the system operation safety constraints and power flow constraints under intraday regulation are set, including the root node voltage and the CB input reactive power, which are unified with the day-ahead phase. Finally, the renewable energy and ESS action schemes under the intraday short timescale are determined to cope with the long regulation cycle of OLTC and CB taps, which is difficult to match with the real-time power demand of the source and load.
3 Multi-timescale efficient regulation strategy model for distribution networks with active and passive resources combined
3.1 Day-ahead regulation models
3.1.1 Objective function
The day-ahead regulation model aimed to minimize the total operating cost in a day and seek optimal economic efficiency. It includes main grid power purchase costs, active loss costs, renewable energy and ESS maintenance costs, and wind and light discarded costs. The objective function of the day-ahead regulation model is
where Δtpre is the day-ahead regulation time; t is the time; Fnet, Floss, Fdg, Fess, and Fqdg are the main grid power purchase cost, active loss cost, renewable energy and ESS maintenance cost, and wind and light discarded cost, respectively; cnet, closs, cpv, cwt, cess, cqpv, and cqwt are the unit main grid power purchase price, active loss price, PV maintenance cost, WT maintenance cost, ESS maintenance cost, discarded light cost, and discarded wind cost, respectively; Pg,t,
3.1.2 Restrictive condition
3.1.2.1 ESS constraints
Eq. (3) provides the charge/discharge state constraint of the ESS; Eq. (4) provides the energy state constraint of the ESS; Eq. (5) provides the upper and lower limit value constraints of the charge state of the ESS; and Eq. (6) provides the charge state constraint of the ESS. In the equation, udch,t and uch,t are the 0–1 variables, which denote the charge/discharge identifiers of the ESS, respectively; Sess,start and Sess,end are the beginning and end of the charge state, respectively;
3.1.2.2 PV and WT constraints
where
3.1.2.3 OLTC constraints
With the addition of the OLTC, the substation bus node is converted to an adjustable variable with the following substitutions:
where the BOLTC is the set of substation nodes containing the OLTC;
where rj,s denotes the difference in the square of the transformation ratio between the OLTC stall s and s-1, i.e., the neighboring regulation increment.
A limit is set on the total number of OLTC operations multiple times, considering factors such as equipment life or economy:
where
3.1.2.4 CB constraints
where BCB is the set of nodes with CBs;
Eq. (14) provides the total number of operation limits in multiple times, where NCB,max is the upper limit of the number of operations. In addition, the absolute value constraint in the above equation can be handled as follows. By defining the auxiliary variable
3.1.2.5 Power flow constraints
The DN power flow constraints are non-convex. To improve the solution rate, this study carries out two-step relaxations: phase-angle relaxation and convex relaxation (Farivar and Low, 2013a; Farivar and Low, 2013b). Let I∼ ij = │Iij│2 and V∼ i = │Vi│2; then, the power flow constraint after relaxation is
where i∈u(j) and k∈v(j) are the set of branches with j as the end and first nodes, respectively; Pij and Qij are the active and reactive power flowing from node i to node j, respectively; rij and xij are the resistance and reactance of the branch ij, respectively; Pj and Qj are the equivalent active and reactive power of node j, respectively; I∼ ij is the square of the current flowing through the branch ij; V∼ i is the square of the voltage amplitude at node i; Pload,j, Pch,j, Pdch,j, PDG,j, and PG,j are the active power of the load, the charging power of the ESS, the discharging power of the ESS, the power out of the distributed power source, and the power purchased from the grid, respectively; and Qload,j, QCB,j, and QG,j are the reactive power of the load, the reactive power out of the CB, and the reactive power from the generator.
3.1.2.6 Safe operation constraints
where Vmax and Vmin are the upper and lower limits of the node voltage, respectively, and Imax is the upper limit of the current allowed to pass through the branch.
3.2 Intraday regulation models
3.2.1 Intraday source and load uncertainty treatment
3.2.1.1 Forecast inaccuracies in the handling of load
If the mean and standard deviation of the load probability distribution function, i.e., μD and σD, are known and the range of load variations is divided into several scenarios, the probability density function πd for the dth load scenario is obtained (Heydt et al., 1981). The power value of the dth load scenario is expressed as
where
3.2.1.2 Modeling of WT output uncertainty
The wind speed generally obeys a two-parameter Weibull distribution, and let v be a random variable representing the wind speed, which can be obtained as its probability density function (Dai et al., 2023). Then, the wind speed-based turbine output model can be expressed as
where PWT is the actual WT output;
3.2.1.3 Modeling of PV output uncertainty
Statistically, the light intensity r approximately obeys a beta distribution over a certain time. According to its probability density function (Luo et al., 2020), a PV output model based on different light intensities can be obtained:
where PSTC is the rated PV output power under standard rated conditions; Gc is the irradiance at the operating point; kp is the power temperature coefficient; and Tc is the cell temperature at the operating point.
3.2.1.4 Multi-scenario generation and reduction
The Latin hypercube sampling (LHS) (Cai et al., 2022) method is used to generate many source–load–output scenarios obeying the constraints of the predicted power distribution. Finally, the scene reduction method considering the Kantorovich distance was used to reduce the scene (Fang et al., 2023).
3.2.2 Objective function
The objective function of the intraday regulation model is to minimize the deviation from the total day-ahead cost and ensure optimal system economics. The intraday total cost includes the main grid power purchase cost, active loss cost, renewable energy and ESS maintenance cost, and wind and light discarded costs. The intraday objective function is
where Δtint is the intraday regulation time; t is the time; Fnet, Floss, Fdg, Fess, and Fqdg are the main grid power purchase cost, active loss cost, renewable energy and ESS maintenance cost, and wind and light discarded cost, respectively; cnet, closs, cpv, cwt, cess, cqpv, and cqwt are the unit main grid power purchase price, active loss price, PV maintenance cost, WT maintenance cost, ESS maintenance cost, discarded light cost, and discarded wind cost, respectively; Pg,t,
3.2.3 Restrictive condition
3.2.3.1 Power flow unification constraints
where Vg_int is the root node voltage of the intraday regulation model; Vg_pre is the root node voltage obtained by solving the day-ahead regulation model; Kint is the CB gear in the intraday regulation model; and Kpre is the CB gear obtained by solving the day-ahead regulation model.
In addition to the power flow unification constraints, the ESS, PV, and WT constraints, power flow constraints, and safe operation constraints of the intraday regulation model are the same as those of the day-ahead regulation, except that the regulation time is different, which will not be repeated here.
4 Simulation verification and result analysis
In this study, a 10-kV (IEEE15 node) voltage level is selected as an example to simulate the DN; the DN structure is shown in Figure 2. The system relates to the OLTC at the connection point with the main grid, and two CBs are connected to nodes 5 and 9. Three microgrids (MGs) interact with each other through the DN with energy exchange. MG1 and MG2 are configured with the ESS and PV, MG3 is configured with WT, and the system is connected to the main grid with electronic toll collection (ETC) meters. The meters are used as a tool to measure electricity. The day-ahead load data are typical industrial load data (Ge et al., 2020), the renewable energy output data are the same as in the study by Li et al. (2021), the day-ahead regulation time Δtpre is taken as 1 h, and the intraday regulation time Δtint is taken as 15 min. The intraday source and load-predicted outputs are shown in Figure 3, and the parameters of the simulation are shown in Table 1.
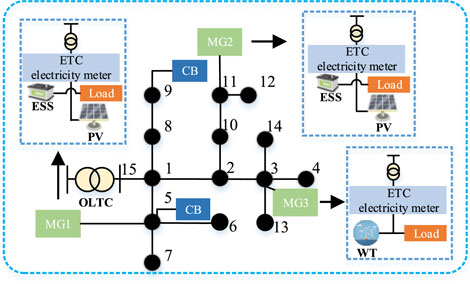
Figure 2. Diagram of DN structure.
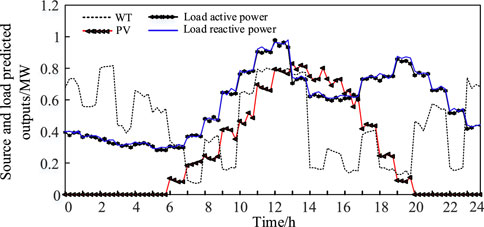
Figure 3. Output of intraday source and load predicted.
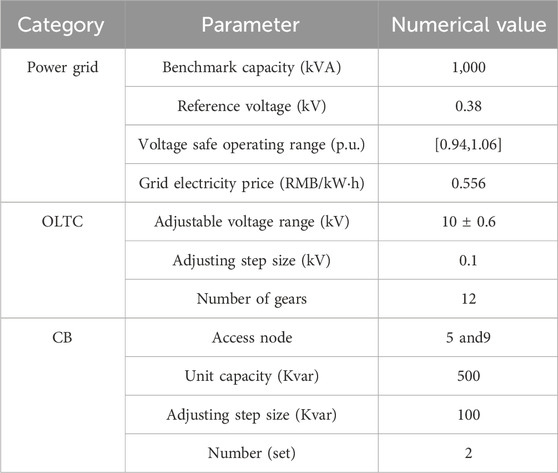
Table 1. Simulation parameters.
Two schemes are set up for comparative analysis. In the traditional scheme, active and passive resources combined are not considered, i.e., there is no consideration of the day-ahead OLTC and CB switching schemes, and only intraday regulation is considered. In the proposed scheme, the optimal scheduling model of this study is a multi-timescale efficient regulation strategy for the DN based on the combined active and passive resources. It uses the day-ahead OLTC and CB switching schemes as constraints for the intraday operation and then carries out the optimal computation of the economy; at the same time, the operation of the DN is further optimized.
4.1 Economic analysis
The regulation model is solved for both schemes, and the results are shown in Figure 4.

Figure 4. Daily operating costs/RMB.
As shown in Figure 4, the total operating cost of the proposed scheme is reduced by 11.52% compared with the traditional scheme, in which the active loss is reduced by 52.31% and the cost of light discarded is reduced by 25.01%. Therefore, an efficient multi-timescale regulation strategy for the DN based on active and passive resources combined can achieve voltage regulation through the OLTC and improve the renewable energy utilization rate. At the same time, it flexibly adjusts the system’s reactive power, reduces line losses, and ensures system economy.
Figures 5, 6 show the CB gear change in the proposed scheme and the reactive power output from the main grid-side comparison of the proposed and traditional schemes, respectively. As shown in the figures, the two sets of CBs act 10 times, and the CBs in the proposed scheme provide part of the reactive power support so that the total amount of reactive power issued from the main grid side is reduced, and the flow of reactive power in the grid is reduced. At the same time, it reduces the loss of the line due to the delivery of reactive power and improves transmission efficiency.

Figure 5. Gear position of the CB.
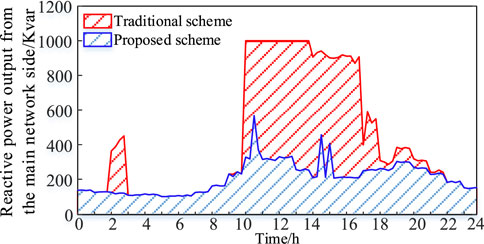
Figure 6. Reactive power output from the main grid side.
4.2 Renewable energy utilization analysis
The change in the OLTC gear position is shown in Figure 7, the comparison of renewable energy real-time utilization under the two schemes is shown in Figure 8, and the active power output from the main grid side under the two schemes is shown in Figure 9. The PV access point (nodes 5 and 11) voltages for both scenarios are shown in Figures 10, 11. The renewable energy utilization rate of the proposed scheme is higher than that of the traditional scheme, which is because, at 11:00–17:00, the renewable energy output is larger than the load power demand. It results in the backward transmission of power from the renewable energy access side to the main grid side. The traditional scheme does not consider the OLTC regulation, so the root node voltage cannot be regulated. The system restricts renewable energy output to ensure that the voltage of the renewable energy access point does not go beyond the upper limit. In the proposed scheme, the OLTC gear is reduced to 8. The system decreases the voltage at the root node by regulating the OLTC, thus decreasing the voltage at the new energy access point. Under the premise that the voltage at the new energy access point does not exceed the limit, the power emitted by photovoltaic and wind turbines is increased as much as possible to improve the rate of new energy consumption.
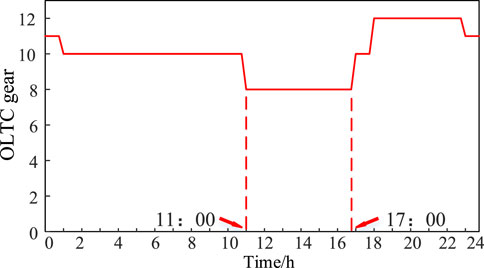
Figure 7. Gear position of the OLTC.
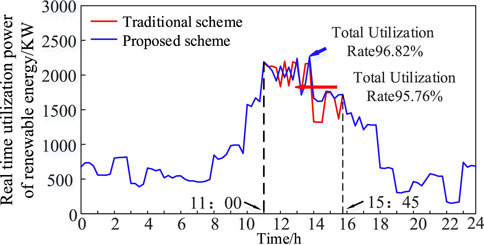
Figure 8. Real-time utilization power of renewable energy.

Figure 9. Active power output from the main grid side.
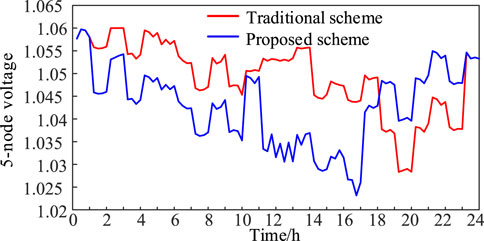
Figure 10. Five-node voltage.
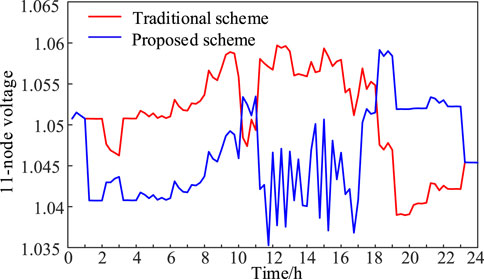
Figure 11. Eleven-node voltage.
4.3 Voltage analysis
Figure 12 shows the real-time active loss comparison of the two schemes, and Figures 13, 14 show the 24-h node voltage of the traditional and proposed schemes. The figure shows that the OLTC in the proposed scheme can improve the renewable energy utilization rate while improving the DN voltage level and reducing the system’s active loss.
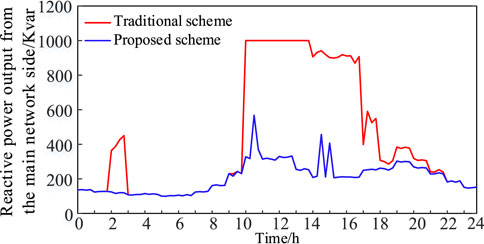
Figure 12. Real time active loss.
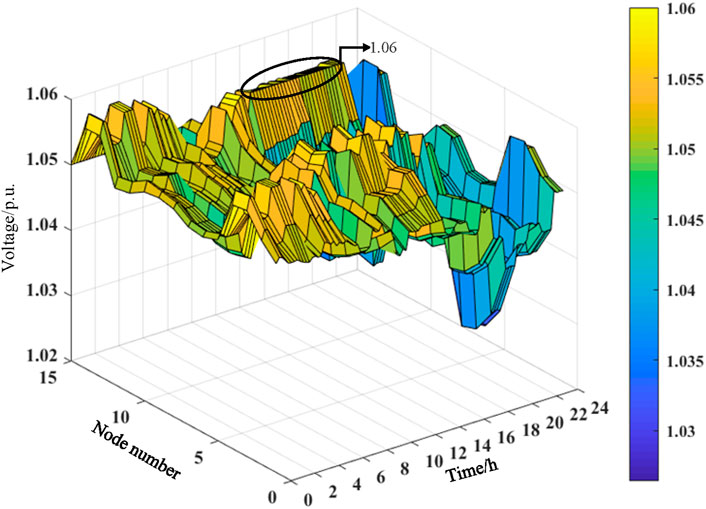
Figure 13. Diagram showing the 24-h node voltage of the traditional scheme.
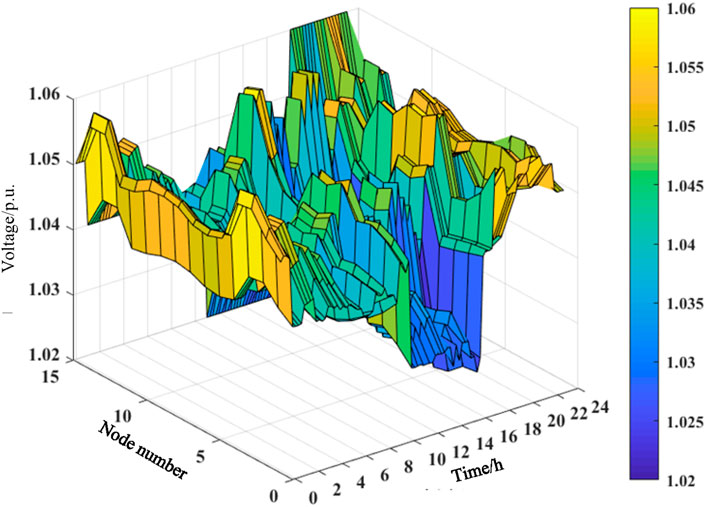
Figure 14. Diagram showing the 24-h node voltage of the proposed scheme.
5 Discussion and limitations
In the actual DN, the proposed scheme needs to be realized using communication technology. Based on the multi-timescale regulation proposed, a DN communication architecture adapted to the regulation architecture is constructed, as shown in Figure 15.
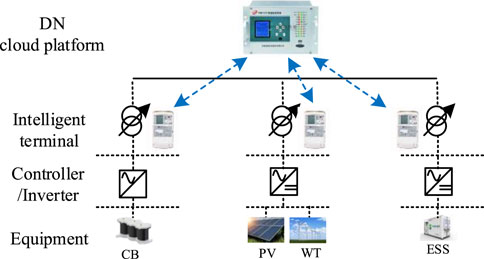
Figure 15. DN communication architecture.
First, the controller controls the reactive power output of the CB. The output power information of the PV, WT, and ESS can be obtained through the inverter. Then, the intelligent terminal collects the power information of various active and passive resources within the DN through Modbus, DL/T645, RS485 (Dai et al., 2023), and other communication protocols. The collected information is sent to the DN cloud platform through an MQTT communication protocol. On this basis, it is calculated and analyzed by the DN cloud platform. The optimal operation program can be generated and sent to various types of equipment. Thus, the low-carbon economic operation of the DN is accomplished.
It is worth pointing out that the strategy proposed in this paper provides strong support for low-carbon economic operations during the steady state of the DN. However, during special scenarios, such as three-phase imbalance and fault outage, the internal tidal current situation of the DN is more complicated, and in-depth research and optimization of the system operation state for the above scenarios will be the next direction.
6 Conclusion
This study proposes an efficient multi-timescale regulation strategy for the DN based on a combination of active and passive resources. Aiming at the problems of insufficient renewable energy utilization and the difficulty in matching the long timescale regulation with the short-time power demand of the source and load, as well as issues with OLTC and CB taps, the following conclusions are obtained through simulation verification.
1) In this study, the OLTC and CB switching schemes are used as the constraints of intraday regulation using power flow unification. It helps realize the purpose of the intraday adjustment of the OLTC gear, thus adjusting the voltage of the root node and new energy access point to promote the further output of renewable energy. The rate of renewable energy utilization increased from 95.76% under the traditional regulation strategy to 96.82%.
2) The renewable energy and ESS short-time action scheme determined by intraday short-time regulation, which solves the problem of the long regulation cycle of OLTC and CB taps, is difficult to match with the short-time power demand of the source and load. Compared with the traditional regulation strategy, the total cost of operation of the proposed strategy is reduced by 11.52%. Among them, the active loss is reduced by 52.31%, and the cost of discarded light is reduced by 25.01%. The proposed scheme improves the low-carbon economic operation capability of the whole system.
Data availability statement
The original contributions presented in the study are included in the article/Supplementary Material; further inquiries can be directed to the corresponding author.
Author contributions
KL: writing–review and editing and writing–original draft. XL: writing–review and editing and writing–original draft. WZ: writing–review and editing and writing–original draft. LY: writing–review and editing and writing–original draft. QC: writing–review and editing and writing–original draft. YL: writing–review and editing and writing–original draft. SO: writing–review and editing and writing–original draft. MX: writing–review and editing and writing–original draft. JL: writing–review and editing and writing–original draft.
Funding
The author(s) declare that financial support was received for the research, authorship, and/or publication of this article. This work is supported by Guangxi Power Grid Corporation Technology Project Funding (Project Number: GXKJXM20222173).
Conflict of interest
Authors KL, WZ, QC, and SO were employed by the Electric Power Science Research Institute of Guangxi Power Grid Co., Ltd. Authors XL, YL, MX, and JL were employed by the Electric Power Research Institute of China Southern Power Grid.
The authors declare that this study received funding from Guangxi Power Grid Corporation. The funder had the following involvement in the study: collection, analysis, interpretation of data.
Publisher’s note
All claims expressed in this article are solely those of the authors and do not necessarily represent those of their affiliated organizations, or those of the publisher, the editors, and the reviewers. Any product that may be evaluated in this article, or claim that may be made by its manufacturer, is not guaranteed or endorsed by the publisher.
References
Cai, J., Hao, L., Xu, Q., and Zhang, K. (2022). Reliability assessment of renewable energy integrated power systems with an extendable Latin hypercube importance sampling method. Sustain. Energy Technol. Assessments 50, 101792. doi:10.1016/j.seta.2021.101792
Chathurangi, D., Jayatunga, U., and Perera, S. (2022). Recent investigations on the evaluation of solar PV hosting capacity in LV distribution networks constrained by voltage rise. Renew. Energy 199, 11–20. doi:10.1016/j.renene.2022.08.120
Da, L., Yang, Q., Liu, M., Zhao, L., Wu, T., and Chen, B. (2023). Estimation of extreme wind speed based on upcrossing rate of mean wind speeds with Weibull distribution. J. Wind Eng. Industrial Aerodynamics 240, 105495. doi:10.1016/j.jweia.2023.105495
Dai, W., Miao, Z., Zimu, Y., Jiang, F., Guo, Q., and Zhou, Q. (2023). Mixed-integer second-order cone programming method for active distribution network. Front. Energy Res. 11. doi:10.3389/fenrg.2023.1259445
Dutta, A., Ganguly, S., and Kumar, C. (2020). “Model predictive control based coordinated voltage control in active distribution networks utilizing OLTC and DSTATCOM,” in 2020 IEEE International Conference on Power Electronics, Jaipur, India, 16-19 December 2020 (Drives and Energy Systems PEDES).
Fang, H., Shang, L., Dong, X., and Tian, Y. (2023). High proportion of distributed PV reliability planning method based on big data. Energies 16 (23), 7692. doi:10.3390/en16237692
Farivar, M., and Low, S. H. (2013a). Branch flow model: relaxations and convexification—Part I. IEEE Trans. Power Syst. 28 (3), 2554–2564. doi:10.1109/tpwrs.2013.2255317
Farivar, M., and Low, S. H. (2013b). Branch flow model: relaxations and convexification—Part II. IEEE Trans. Power Syst. 28 (3), 2565–2572. doi:10.1109/tpwrs.2013.2255318
Gao, H., Liu, J., and Wang, L. (2017). Robust coordinated optimization of active and reactive power in active distribution systems. IEEE Trans. Smart Grid 9 (5), 4436–4447. doi:10.1109/tsg.2017.2657782
Ge, Q., Guo, C., Jiang, H., Lu, Z., Yao, G., Zhang, J., et al. (2020). Industrial power load forecasting method based on reinforcement learning and PSO-LSSVM. IEEE Trans. Cybern. 52 (2), 1112–1124. doi:10.1109/tcyb.2020.2983871
Guo, P., Liu, W., Zheng, W., Liang, C., Zheng, J., Karthikeyan, N., et al. (2014). “A multi-time scale reactive power coordinated control strategy based on continuous and discrete VAR sources,” in 2014 IEEE PES General Meeting,Conference and Exposition, National Harbor, MD, USA, 27-31 July 2014 (IEEE), 1–5.
Heydt, G., Khotanzad, A., and Farahbakhshian, N. (1981). A method for the forecasting of the probability density function of power system loads. IEEE Trans. power apparatus Syst. (12), 5002–5010. doi:10.1109/tpas.1981.316469
Home-Ortiz, J. M., Macedo, L. H., Vargas, R., Romero, R., Mantovani, J. R. S., and Catalao, J. P. S. (2022). Increasing RES hosting capacity in distribution networks through closed-loop reconfiguration and Volt/VAr control. IEEE Trans. Industry Appl. 58 (4), 4424–4435. doi:10.1109/tia.2022.3177175
Hu, R., Wang, W., Chen, Z., Wu, X., Jing, L., Ma, W., et al. (2020). Coordinated voltage regulation methods in active distribution networks with soft open points. Sustainability 12, 9453. doi:10.3390/su12229453
Huo, D., Gu, C., Ma, K., Wei, W., Xiang, Y., and Le Blond, S. (2018). Chance-constrained optimization for multienergy hub systems in a smart city. IEEE Trans. Industrial Electron. 66 (2), 1402–1412. doi:10.1109/tie.2018.2863197
Karthikeyan, N., Pokhrel, B. R., Pillai, J. R., et al. (2017). “Coordinated voltage control of distributed PV inverters for voltage regulation in low voltage distribution networks,” in 2017 IEEE PES innovative smart grid technologies conference Europe (ISGT-Europe), Turin, Italy, 26-29 September 2017 (IEEE), 1–6.
Langenmayr, U., Wang, W., and Jochem, P. (2020). Unit commitment of photovoltaic-battery systems: an advanced approach considering uncertainties from load, electric vehicles, and photovoltaic. Appl. Energy 280, 115972. doi:10.1016/j.apenergy.2020.115972
Li, C., Dai, Y., Wang, P., and Xia, S. (2023). Active and reactive power coordinated optimization of active distribution networks considering dynamic reconfiguration and SOP. IET Renew. Power Gener. doi:10.1049/rpg2.12814
Li, Y., Wang, C., Li, G., and Chen, C. (2021). Optimal scheduling of integrated demand response-enabled integrated energy systems with uncertain renewable generations: a Stackelberg game approach. Energy Convers. Manag. 235, 113996. doi:10.1016/j.enconman.2021.113996
Luo, Y., Nie, Q., Yang, D., and Zhou, B. (2020). Robust optimal operation of active distribution network based on minimum confidence interval of distributed energy beta distribution. J. Mod. Power Syst. Clean Energy 9 (2), 423–430. doi:10.35833/mpce.2020.000198
Ma, W., Wang, W., Chen, Z., and Hu, R. (2021). A centralized voltage regulation method for distribution networks containing high penetrations of photovoltaic power. Int. J. Electr. Power and Energy Syst. 129, 106852. doi:10.1016/j.ijepes.2021.106852
Tewari, T., Mohapatra, A., and Anand, S. (2021). Coordinated control of OLTC and energy storage for voltage regulation in distribution network with high PV penetration. IEEE Trans. Sustain. Energy 12 (1), 262–272. doi:10.1109/TSTE.2020.2991017
Wan, D., Zhao, M., Yi, Z., Jiang, F., Guo, Q., and Zhou, Q. (2023). Mixed-integer second-order cone programming method for active distribution network. Front. Energy Res. 11, 1259445. doi:10.3389/fenrg.2023.1259445
Wang, J., Qi, X., Ren, F., and Zhang, G. (2021). Optimal design of hybrid combined cooling, heating and power systems considering the uncertainties of load demands and renewable energy sources. J. Clean. Prod. 281, 125357. doi:10.1016/j.jclepro.2020.125357
Xu, K., Wang, Y., Li, Z., Li, X., and Song, H. (2023). Voltage optimization control and risk assessment Technology for high-proportion distributed photovoltaic access to distribution network. J. Phys. Conf. Ser. IOP Publ. 2488 (1), 012056. doi:10.1088/1742-6596/2488/1/012056
Yang, X., Xu, C., Zhang, Y., Yao, W., Wen, J., and Cheng, S. (2021). Real-time coordinated scheduling for ADNs with soft open points and charging stations. IEEE Trans. Power Syst. 36 (6), 5486–5499. doi:10.1109/tpwrs.2021.3070036
You, R., and Lu, X. (2022). Voltage unbalance compensation in distribution feeders using soft open points. J. Mod. Power Syst. Clean Energy 10 (4), 1000–1008. doi:10.35833/MPCE.2021.000565
Zhang, C., and Xu, Y. (2020). Hierarchically-coordinated voltage/VAR control of distribution networks using PV inverters. IEEE Trans. Smart Grid 11 (4), 2942–2953. doi:10.1109/TSG.2020.2968394
Keywords: distribution networks, multi-timescale, source and load uncertainty, low-carbon operation, on-load tap changer
Citation: Li K, Lin X, Zhang W, Yu L, Chen Q, Liu Y, Ou S, Xu M and Li J (2024) An efficient multi-timescale regulation strategy for distribution networks based on active and passive resources combined. Front. Energy Res. 12:1381349. doi: 10.3389/fenrg.2024.1381349
Received: 03 February 2024; Accepted: 13 May 2024;
Published: 07 June 2024.
Edited by:
Ningyi Dai, University of Macau, ChinaCopyright © 2024 Li, Lin, Zhang, Yu, Chen, Liu, Ou, Xu and Li. This is an open-access article distributed under the terms of the Creative Commons Attribution License (CC BY). The use, distribution or reproduction in other forums is permitted, provided the original author(s) and the copyright owner(s) are credited and that the original publication in this journal is cited, in accordance with accepted academic practice. No use, distribution or reproduction is permitted which does not comply with these terms.
*Correspondence: Junhao Li, ljh17wo@hnu.edu.cn