Fault location method for distribution networks based on multi-head graph attention networks
 Lingyu Liang1
  Zhiwei Chen
- 1Digital Grid Research Institute, China Southern Power Grid, China Southern Power Grid Artificial Intelligence Technology Co., Ltd., Guangzhou, China
- 2School of Electric Power Engineering, South China University of Technology, Guangzhou, China
The precise fault localization holds significant importance in reducing power outage duration and frequency in power systems. The widespread application of synchrophasor measurement technology (PMU) has laid the foundation for achieving accurate fault localization in distribution networks. However, fault localization methods based on PMU often suffer from a significant decrease in accuracy due to topological reconstruction and inaccurate parameters. To address these challenges, this paper proposes a fault location method for distribution networks based on Multi-head Graph Attention Networks (GATs). The proposed method begins by modeling the distribution network as a graph, where nodes represent network components and edges represent the connections between these components. GATs have been employed to learn the underlying relationships between topological structure and electrical characteristics of the distribution network. The results demonstrate that our approach outperforms traditional fault location methods in terms of accuracy and speed. The proposed method achieves high precision which reducing the time required for fault location and enabling faster response times for network maintenance personnel.
1 Introduction
The reliable operation of distribution networks is of paramount importance for ensuring uninterrupted power supply to consumers. However, faults in distribution networks are inevitable and can lead to power outages and disruptions. Therefore, efficient fault location methods are crucial for minimizing downtime and improving the overall reliability of distribution networks. For highly urbanized distribution networks, precise fault localization techniques can reduce the workload of fault restoration and shorten the outage duration for end-users. On the other hand, the techniques can narrow down the patrol range and improve patrol efficiency in rural and remote areas with harsh deployment conditions. However, the current development of precise fault localization in distribution networks faces several challenges, including: 1) Complex line structure. 2) Widespread asymmetry in line parameters. 3) Incomplete measurement systems and lack of clock synchronization mechanisms to support precise fault localization technology.
In recent years, synchrophasor measurement units (PMUs) (Dashtdar et al., 2023) have been successfully applied in transmission systems (Swetapadma et al., 2022). The development of distribution network synchrophasor measurement units (D-PMUs) has achieved goals such as miniaturization, cost reduction, easy installation, and maintenance-free operation. The application and development of D-PMUs provide more clock synchronization information for fault localization in distribution networks. This advancement has led to significant developments in both traditional methods and artificial intelligence approaches.
Traditional fault location has relied on manual inspection and laborious calculations based on measurements. These methods are often time-consuming and prone to errors and they will result in delays in identifying and repairing faults. Moreover, the increasing complexity and scale of distribution networks pose additional challenges for traditional fault location approaches. Traditional fault location methods include impedance method (Ishnathevar and Ngue, 2011), traveling wave method (Tang et al., 2013) and matrix method (Wu et al., 2011; Majidi and Etezadi-Amoli, 2018). All of the aforementioned techniques assess the characteristics of distribution networks during fault occurrences, encountering issues related to reliability due to challenges in establishing thresholds and relying on single characteristics. In Dai and Xu (2017), an enhancement to the impedance method is introduced by integrating it with the phase analysis method. This approach enables the analysis of power characteristics for various fault types at the specific fault location. Zhu (2006) leverages the direct proportionality between the reactance of the faulty circuit and the fault’s distance to determine the line distance from the measurement point to the fault location. Xing et al. (2017) constructs a topological correlation matrix for each network element, offering adaptability to changes in network topology. However, it still struggles to handle complex network configurations. The methods discussed above in the distribution network domain frequently necessitate the establishment of fixed thresholds through empirical or simulation-based means to create fault diagnosis and localization criteria. This poses difficulties in adapting to structural changes in intricate distribution networks. And it presents challenges in maintaining applicability during network reconfigurations and various scenarios.
With the recent advancements in multi-source data fusion and artificial intelligence, there is a technical foundation for precise fault localization techniques based on multiple sources of information, including D-PMU data. This is expected to revolutionize fault diagnosis and localization techniques (Phadke et al., 1983). In Sapountzoglou et al. (2020), a fault diagnosis model for low-voltage smart distribution networks is developed using gradient boosting trees. It used a fixed number of interpolations are employed to replace specific branch measurements. While the aforementioned literature can to some extent adapt to changes in network topology, it falls short of accurately pinpointing fault segments.
The development of graph neural networks (GNN) has provided a solution for fault localization based on D-PMUs. Leveraging complex graph theory analysis and the feature extraction capabilities of neural networks, it can address fault localization problems in scenarios with complex topological changes. By representing a distribution network as a graph, GNN becomes possible to exploit the inherent structure and connectivity of the network for fault location purposes. Currently, the most widely used GNN include Graph Convolutional Networks (GCN) (Shervashidze et al., 2009; Kipf and Welling, 2016) and Graph Attention Networks (GAT) (Velickovic et al., 2022). Compared to GCN, GAT incorporates attention mechanisms from computer vision, allowing it to focus more on neighboring nodes, thereby better meeting the requirements of inductive learning tasks. As a result, GAT is more suitable for tasks with frequent topological changes. GATs are designed to capture the relationships between different nodes in a graph by assigning attention weights to neighboring nodes, enabling the network to focus on the most relevant information for a given task. Choi et al. (2017) suggests a novel approach that merges Long Short-Term Memory (LSTM) with an attention mechanism, employing it for the task of node classification in graph data. Meanwhile a distinct technique is introduced which effectively utilizes the graph attention mechanism for node embedding purposes (Lee et al., 2018). All of the mentioned articles have successfully applied GAT to a variety of graph tasks. However, the application of GAT in the field of fault localization in power systems is still in its nascent stages (Chen et al., 2020).
Motivated by the potential of GATs for graph-based applications, this paper proposes a fault location method based on GAT. The method aims to leverage the advantages of GATs in capturing the complex relationships between network components and improve the accuracy and efficiency of fault location. Moreover, this paper proposes the mechanism of multi-head attention on top of GAT. By employing mutually independent multi-head attention mechanisms, the allocation of attention weights among nodes becomes more explicit. This enhances the model’s learning capability while mitigating the risk of overfitting. Finally, this paper demonstrates its effectiveness through experimental evaluation. The historical fault data containing the current, voltage and topology of distribution network is used to train the GAT model. Through the training process on this dataset, the GAT model acquires the capability to discern various fault types and locations.
The subsequent sections of this paper are structured as follows: Section 2 elucidates the framework of the fault localization technique for distribution networks, which is grounded in GAT. Section 3 expounds upon the methodology which encompassing the graphical representation of the distribution network and the design of the GAT architecture. Section 4 outlines the experimental configuration and provides an assessment of the obtained results. Section 5 engages in a discussion of the outcomes and offers a concise summary of the proposed approach.
2 The framework of fault localization algorithm based on GATs using D-PMU
2.1 Acquisition of distribution network measurement data
D-PMU can provide synchronized phasor and waveform data with time stamps. It is a crucial source of information for fault localization in medium-voltage distribution networks. Additionally, it can serve as an important pathway for synchronizing and transmitting information from other new types of sensors. However, due to the characteristics of medium-voltage distribution network structures and economic considerations, it is not feasible to fully deploy D-PMUs throughout the distribution network. Therefore, the deployment of D-PMUs must ensure that the voltage and current at both ends of any line within the localization area can be calculated based on D-PMU data. In other words, the configuration of D-PMUs should meet the calculation requirements for the voltage at any bus and the current in any branch within the area. The installation positions of D-PMUs in a distribution network are illustrated in Figure 1.
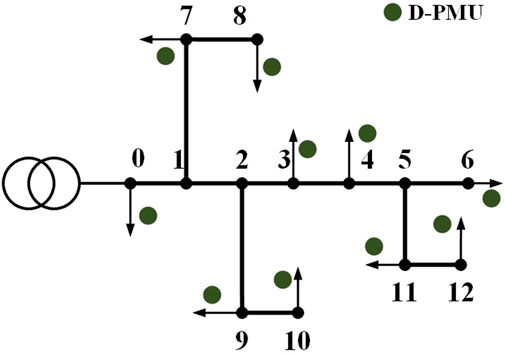
Figure 1. The installation position of D-PMU.
The measurement data obtained from D-PMU can provide synchronized data for distribution networks through the principle of double-end measurement fault localization. This enables data-driven fault localization techniques to be fully supported by comprehensive data.
2.2 Fault localization methods based on GAT
Traditional fault localization methods for distribution networks primarily rely on fault characterization. These algorithms often face challenges when dealing with intricate scenarios, such as fault reconstruction in distribution networks. In our study, this paper proposes a novel fault localization approach that integrates the topology of the distribution network which offering solutions to the aforementioned issues. Figure 2 showcases the deployment of the GAT model for fault localization in distribution networks. The model’s implementation proceeds through the following steps.
1) Step1: Acquisition of datasets. We begin by obtaining the real topology of a distribution network. Subsequently, we combine this topology with its operational data to create a comprehensive simulation environment for the purpose of fault localization in distribution networks. The distribution network fault data and labels are gathered by introducing various fault types into the network, allowing us to construct a dataset that represents different fault scenarios.
2) Step2: The construction and training of GAT. We visually represent the distribution network fault data as a graph, enabling us to partition the fault dataset efficiently. With this partitioned dataset, we proceed to build a GAT model designed specifically for fault localization within distribution networks. The training process employs end-to-end supervised learning techniques to renew the model’s parameters.
3) Step3: Applications and Testing. In the final step, we evaluate the practicality and effectiveness of our GAT model. To do so, we conduct extensive testing and application scenarios, including situations where the distribution network’s topology undergoes changes. Our model takes as input various features such as three-phase currents, voltages, and the topological information of network nodes. The model’s output consists of the identification of faulty lines and the classification of fault types, making it a valuable tool for real-world fault detection and localization in distribution networks.
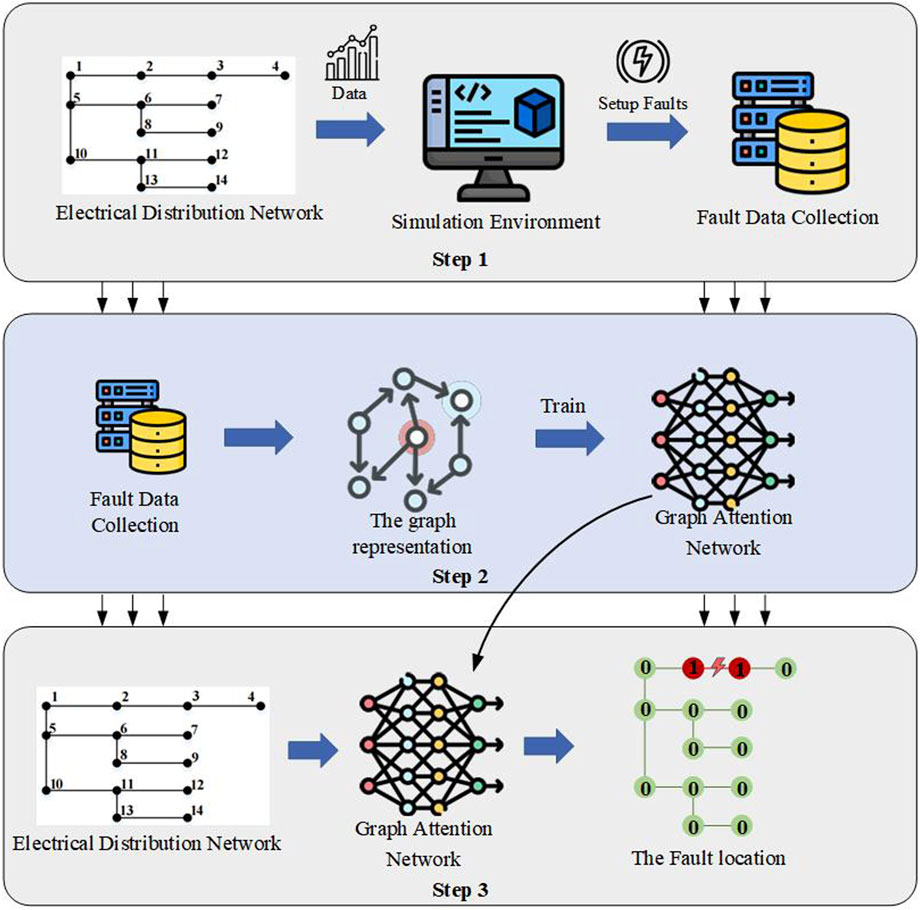
Figure 2. The process of fault localization based on graph attention networks.
3 Methodology
3.1 The graph representation of distribution network fault
Apart from considering voltage and current values at nodes in distribution network fault data, it is essential to acknowledge that changes in network topology significantly influence fault characteristics. Conventional fault localization methods solely rely on fault characteristics for diagnosis. When the distribution network’s topology shifts, these methods necessitate recalculations and adjustments, leading to computational complexity and limited applicability. Hence, it becomes imperative to seamlessly incorporate both distribution network topology and fault characteristics. By effectively integrating these factors and transforming them into inputs for AI algorithms, we enhance our ability to adapt to alterations in distribution network topology. This integration not only simplifies fault localization but also enhances its performance, particularly in scenarios involving distribution network reconfiguration.
Therefore, this paper integrates three-phase current and voltage data with the topological information of the distribution network to create a graphical representation. This combined dataset is then inputted into the model in the form of a fault graph representing the distribution network. The detailed process is elucidated in Figure 3. Specifically, the three-phase currents and voltages of the network nodes are represented as feature matrices of dimensions N*T, where N signifies the number of nodes, and T denotes the feature dimension. The network’s topology is conveyed through an N*N adjacency matrix.

Figure 3. The graph representation of distribution network fault.
A precise topological model serves as the foundation for fault localization, and the number of nodes and branches in the distribution network may change under network reconfiguration. Distribution network reconfiguration is typically a means of altering the topological structure of the grid to enhance system economic and security aspects. Economical reconfigurations maintain the same number of nodes before and after without any faulty lines, whereas fault-driven reconfigurations may involve the removal of certain lines and nodes. Reconfiguration scenarios result in changes to the adjacency matrix, as illustrated in Figure 4 for a simple distribution network reconfiguration.
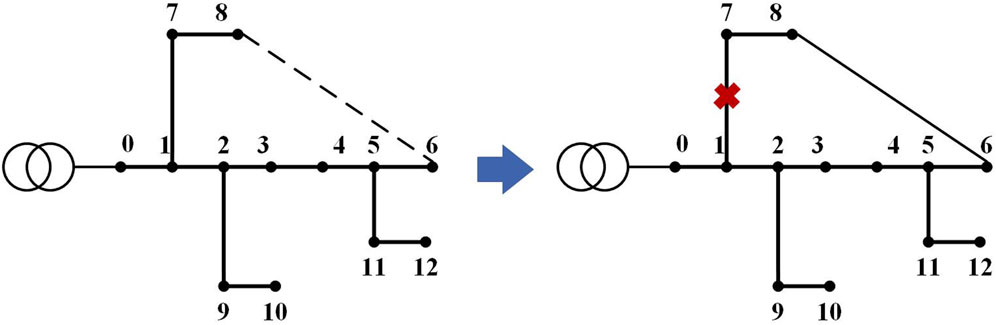
Figure 4. A sample of distribution network reconfiguration.
The distribution network depicted in the figure comprises 13 vertices and 12 edges. In the event of circumstances such as load transfer, the connections between node one and node seven are severed and linked to node six instead, resulting in a transformation of its adjacency matrix from A to A’ as shown on Eq. 1.
Both GCN and GAT can handle topological changes in the aforementioned scenarios, albeit in different manners. Subsequent Sections 3.2, 3.3 will elaborate on this matter.
3.2 The model of GCN
GCN utilizes the convolutional kernel derivation operation from convolutional neural networks, enabling convolutional operations on data incorporating the connectivity of the distribution network. Defining the Laplacian matrix of a graph as L = D-A, where D is the degree matrix and A is the adjacency matrix. Its normalized Laplacian matrix as △, the eigenvalue decomposition is performed on it as shown in the following Eqs 2, 3.
Where I is the identity matrix.
Using U as the basis for the Fourier transform on the graph, the Fourier transform on the spectral domain graph and its matrix form can be obtained as shown on Eq. 4.
Where f(i) is the signal at the ith vertex of the graph.
Where g is the convolutional kernel function. f represents the signal vector on the graph.
By utilizing this, GCN achieves convolutional operations on graphs. And it can enable feature extraction from data incorporating the topological structure of the distribution network. However, due to parameter sharing of GCN convolutional kernels within the same layer, each update requires access to the original connectivity information of the distribution network. Consequently, GCN is relatively limited in the scenarios of topology changing.
3.3 The model of GAT
GAT is a concept that leverages the attention mechanism within GNN. It operates by dynamically adjusting the weights associated with neighboring nodes based on their relative importance through the connections in the graph. This adaptation facilitates the aggregation of information from neighboring nodes in a highly effective and context-aware manner. The core component of GAT is the Graph Attention Layer (GAL). It represents the fusion of attention mechanisms with GNN. GAL takes as input the feature vectors of each node and these feature vectors are derived after GAL has performed the aggregation of information from neighboring nodes. The input and output feature vectors of GAL can be mathematically expressed using the following Eq. 6:
Where h and hʹ are the input and output feature vectors of the GAL with different dimensions respectively. n is the number of nodes. F and Fʹ are the input and output node features.
In Figure 5, the aggregated node is assumed to be Vi, which has three first-order neighboring nodes. The correlation degree eij between the nodes can be obtained through the calculation. In order to better assign weights, the correlation degrees calculated for all neighboring nodes are softmax normalized. The attention coefficient aij is obtained as shown in the following Eq. 7:
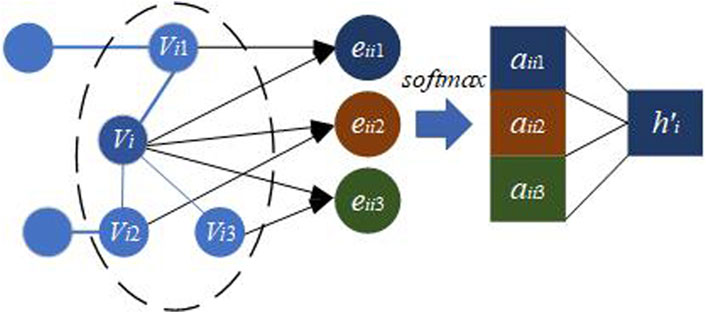
Figure 5. Graph attention layer.
Where L denotes the activation function LeakyReLU. α denotes the function that calculates the correlation between two nodes and W corresponds to the weight parameter matrix used for the transformation of node features from the input feature dimension to the output feature dimension.
Following the formula (5) for obtaining the attention coefficients and adhering to the weighted summation concept of the attention mechanism, the output feature can be computed, denoted as hi’, for the node Vi which is shown on Eq. 8:
Where σ represents the activation function which is typically implemented using the eLU function.
To enhance the expressive capabilities of the GAL, it is common practice to use the multi-head attention mechanism. This mechanism involves the independent computation of attention coefficients by M distinct groups. For example, with M = 2, the multi-head attention mechanism is illustrated in Figure 6.
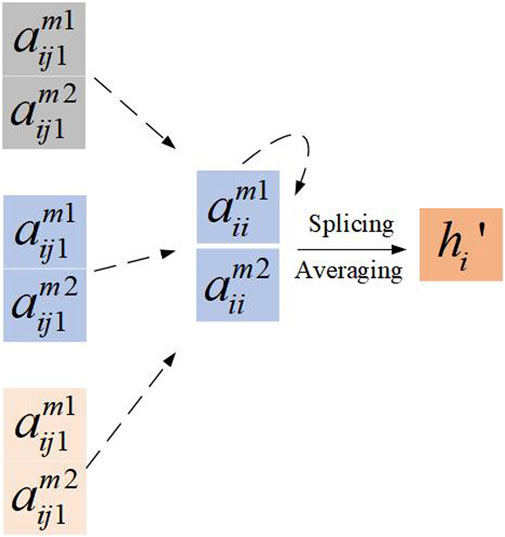
Figure 6. Multi-head attention mechanism, M = 2.
The aim is to amalgamate these independently computed attention coefficients to capture a more comprehensive set of features. In practical implementations, either a concatenation (splicing) operation or an averaging operation is typically employed to combine the outputs of multiple attention heads, as illustrated by the following Eq. 9:
where || denotes the splicing operation. aijm and Wm denote the weight coefficients and learning parameters, which are associated with the mth ensemble of attention mechanisms.
4 Case study
4.1 The construction of environment
The fault localization task is built based on nodes for GAT, with all downstream nodes of the faulty line considered as fault nodes. While GCN is built based on graphs, requiring the entire graph to be updated for each calculation. Consequently, the GAT model faces issues of data sample imbalance, whereas GCN does not encounter such issues. The imbalance between fault and non-fault data may lead the model to learn an excessive amount of non-fault sample data. The accuracy of the model is more focused on the discrimination results of fault data. This can result in the model’s final performance not accurately representing its actual application performance. To address this, random under sampling is employed, where a subset of data is randomly selected from the class with a larger volume and combined with the class with a smaller volume. Thus, this paper randomly removes a portion of non-fault data to form a new dataset together with the fault data.
Additionally, to mitigate the adverse effects of outlier data, the data is scaled proportionally using the method of min-max normalization as shown in the following equation, constraining the input features within the range of [0, 1] as shown on Eq. 10.
Where x represents the feature vector in the input samples. x′ represents the standardized feature vector. max(x) is the maximum value in the samples. min(x) is the minimum value in the samples.
In order to verify the feasibility of the proposed method, this paper applies the method in 125 nodes of the distribution network, the specific topology is shown in Figure 7.
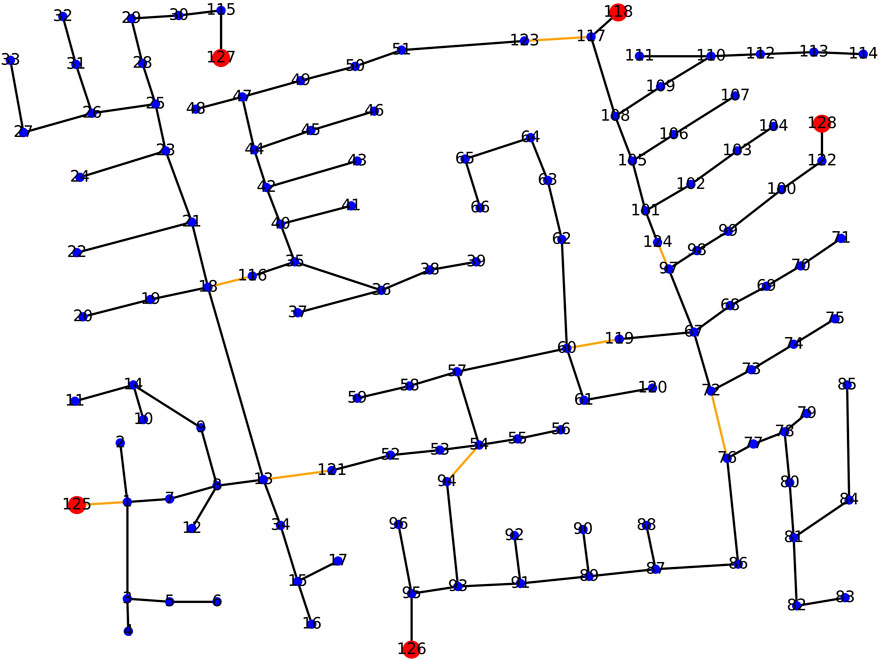
Figure 7. The topology of 125 node Distribution network.
Among them, three-phase short circuits, inter-phase short circuits and single-phase short circuits are set up to verify the effectiveness of the method in this paper. In the above fault samples, considering the reality that there are more normal samples and fewer fault samples, as well as the fact that the faults are dominated by single-phase ground faults, the ratio of normal samples to fault samples is 1:1, where the fault samples are single-phase faults: inter-phase faults: three-phase faults = 3:1:1. In this paper, a total of 3,000 samples of three types of faults are simulated.
For the above samples were input to the graph attention network for training respectively. The graph convolutional neural network (GCN) [ (ABU-EL-HAIJA et al., 2022; Shervashidze et al., 2009)] and multilayer perceptron (MLP) were used for comparison. The specific network structure is shown in Table 1 and Figure 8.
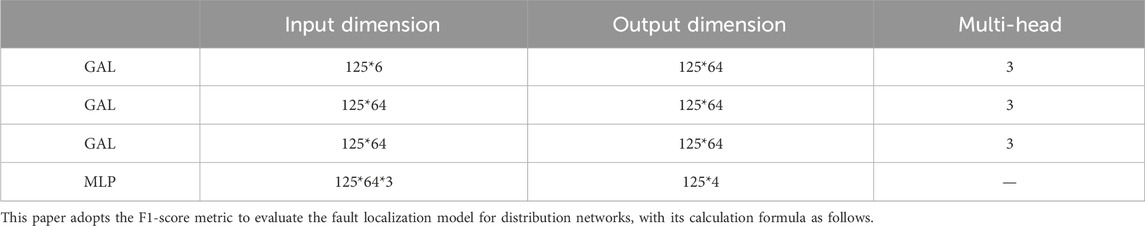
Table 1. The specific network structure of Multi-head GAT.

Figure 8. The specific network structure of Multi-head GAT.
T1 represents true positives, where actual positive samples are correctly predicted as positive. T2 represents false positives, where actual negative samples are wrongly predicted as positive. T3 represents false negatives, where actual positive samples are incorrectly predicted as negative. The F1-score metric which is shown on Eq. 11 is the harmonic mean of precision p and recall r. A higher F1-score indicates better fault discrimination accuracy and better model performance.
4.2 Case analysis
Utilizing the constructed fault feature graph, the GAT model undergoes training. The dataset is partitioned into training and test sets with a ratio of 8:2. Training proceeds through 200 rounds, with a test conducted every 10 rounds. The specific training and testing results are illustrated in the following figure.
From Figures 9, 10, it is evident that the fault localization accuracy and classification accuracy of both GAT and GCN improve with the increase of training rounds. Specifically, the fault localization accuracy of GCN stabilizes at around 60%, while MLP achieves approximately 45%. In contrast, GAT maintains a stable fault localization accuracy of over 80%. Additionally, the fault classification accuracy of GAT surpasses that of GCN. These observations highlight GAT’s superior capability in extracting key information from feature maps, resulting in more accurate fault localization and precise sample classification. This trend underscores GAT’s effectiveness as a graph neural network model, particularly in extracting features from complex graph data such as fault feature graphs.

Figure 9. Accuracy of fault localization and classification for different models in training process.
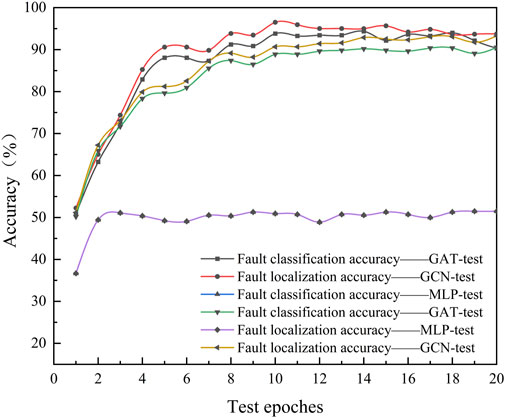
Figure 10. Accuracy of fault localization and classification for different models in testing process.
During the testing process, the range of fault resistance is set from 0.01 to 1,000 to examine its impact on fault localization accuracy and fault classification accuracy, as illustrated in Figure 11.
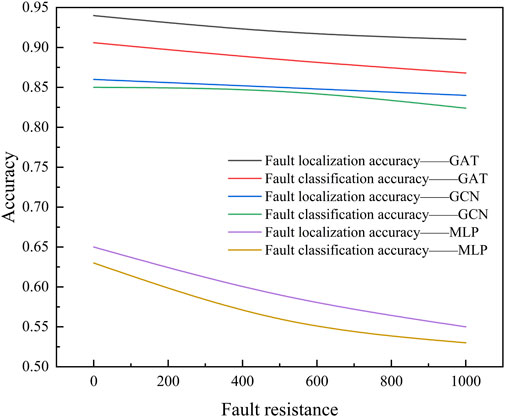
Figure 11. Accuracy of fault localization and classification for different fault resistance.
Analysis of Figure 11 reveals that the localization and classification accuracy of the method outlined in this paper consistently exceeds 90%, indicating minimal impact from variations in fault resistance. Simultaneously, to investigate the effect of fault initial phase angle on the proposed method, the initial phase angles are set at 0, 90, and 180°, as detailed in the table below.
Examination of Table 2 reveals that variations in the fault initial phase angle lead to a slight decrease in fault localization accuracy, albeit with minimal overall change. This is because GAT is able to effectively capture characteristic changes in the fault initial phase angle and maintain stable learning. Due to the diverse and complex topology patterns of distribution networks, it is challenging to directly apply fault localization algorithms from one distribution network to another. To explore the impact of topology changes on fault localization accuracy and classification accuracy, we conducted experiments and present the specific results in Table 3.

Table 2. Impact of fault resistance on fault localization models.
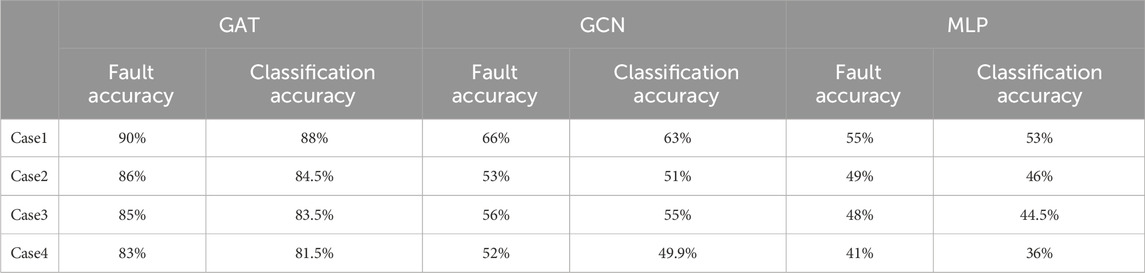
Table 3. Impact of topology changes on fault localization models.
Where case1 represents a scenario with no change in topology, case2 represents the reduction of a line (125, 122), case3 represents the addition of a line (117, 118), and case4 represents the reduction of a line (125, 122) with the addition of a line (117, 118).
Based on the data provided in the table, it is evident that fault localization accuracy and classification accuracy decrease when there is a change in the topology of the distribution network, regardless of whether it is GCN, MLP, or GAT. However, it is noteworthy that GAT demonstrates better adaptability to topology changes, showing a relatively minor decrease in accuracy compared to GCN and MLP. Both GCN and MLP exhibit a decreasing trend in fault localization accuracy and classification accuracy when topology changes occur, with MLP experiencing a particularly pronounced decrease in accuracy. This suggests that GAT possesses stronger robustness and adaptability in handling topology changes, allowing it to better maintain its model performance. In contrast, GCN displays some sensitivity to topology changes and may require more tuning and adaptation to maintain stable performance levels. Overall, this underscores the superior performance of GAT in addressing complex topology change scenarios.
5 Conclusion
The paper proposes a fault localization method based on GAT to address the limitations of traditional distribution network fault localization methods, particularly in scenarios involving fault reconfiguration of the distribution network. Firstly, the proposed method models the distribution network as a graph. And then GATs have been employed to learn the underlying relationships between topological structure and electrical characteristics of the distribution network. The GAT learning process enables the accurate extraction of potential fault features which facilitating precise fault localization. The results demonstrate that the proposed method achieves higher fault localization accuracy and classification accuracy compared to traditional artificial intelligence methods. Furthermore, even when the network topology changes, the proposed method maintains a higher accuracy rate, enabling more precise fault localization. This evidence underscores the greater potential of our proposed method in the domain of fault localization and it offer robust support for ensuring the reliable operation and maintenance of power systems. We will involve integrating fault recovery mechanisms and exploring the potential of accurate fault localization techniques based on GAT in facilitating fault recovery processes in future research.
Data availability statement
The raw data supporting the conclusion of this article will be made available by the authors, without undue reservation.
Author contributions
LL: Writing–original draft. HZ: Writing–original draft. SC: Writing–review and editing. XZ: Writing–review and editing. HL: Writing–review and editing. ZC: Methodology, Writing–review and editing.
Funding
The author(s) declare that financial support was received for the research, authorship, and/or publication of this article. The authors declare that this study received funding from the science and technology project of China Southern Power Grid (Project number: 210000KK52222001). The funder was not involved in the study design, collection, analysis, interpretation of data, the writing of this article, or the decision to submit it for publication.
Conflict of interest
Authors LL, HZ, SC, XZ, and HL were employed by China Southern Power Grid Artificial Intelligence Technology Co., Ltd.
The remaining author declares that the research was conducted in the absence of any commercial or financial relationships that could be construed as a potential conflict of interest.
Publisher’s note
All claims expressed in this article are solely those of the authors and do not necessarily represent those of their affiliated organizations, or those of the publisher, the editors and the reviewers. Any product that may be evaluated in this article, or claim that may be made by its manufacturer, is not guaranteed or endorsed by the publisher.
References
Abu-EL-Haija, S., Perozzi, B., Kapoor, A., et al. (2022). MixHop: higher-order graph convolutional architectures via sparsified neighborhood mixing. Available at: https://arxiv.org/abs/1905.00067.
Chen, K., Jun, H. U., Zhang, Yu, Yu, Z., and He, J. (2020). Fault location in power distribution systems via deep graph convolutional networks. IEEE J. Sel. Areas Commun. 38 (1), 119–131. doi:10.1109/jsac.2019.2951964
Choi, E., Bahadori, M. T., Song, L., et al. (2017). “GRAM: graph-based attention model for healthcare representation learning,” in Proceedings of the 23rd ACM SIGKDD International Conference on Knowledge Discovery and Data Mining, New York,, 14 August 2021 (ACM Press), 787–795.
Dai, Z., and Xu, WANG (2017). Impedance method based fault location algorithm for active distribution system. Power Syst. Technol. 41 (6), 2027–2034.
Dashtdar, M., Hussain, A., HassanAl, Z. G., Mas’ud, A. A., Haider, W., AboRas, K. M., et al. (2023). Fault location in distribution network by solving the optimization problem based on power system status estimation using the PMU. Machines 11 (1), 109. doi:10.3390/machines11010109
Ishnathevar, R., and Ngue, E. (2011). Generalized impedance-based fault location for distribution systems. IEEE Trans. Power Deliv. 27 (1), 449–451.
Kipf, T. N., and Welling, M. (2016) Semi-supervised classification with graph convolutional networks. arXiv preprint arXiv:1609.02907v4.
Lee, J. B., Rossi, R., and Kong, X. (2018). “Graph classification using structural attention,” in Proceedings of ACM SIGKDD International Conference on Knowledge Discovery and Data Mining, New York, USA, 14 August 2021 (ACM Press), 1666–1674.
Majidi, M., and Etezadi-Amoli, M. (2018). A new fault location technique in smart distribution networks using synchronized/nonsynchronized measurements. IEEE Trans. Power Deliv. 33 (3), 1358–1368. doi:10.1109/tpwrd.2017.2787131
Phadke, A. G., Thorp, J. S., and Adamiak, M. G. (1983). A new measurement technique for tracking voltage phasors, local system frequency and rate of change of frequency. IEEE Trans. Power Apparatus Syst. 102 (5), 1026–1038.
Sapountzoglou, N., Lago, J., and Raison, B. (2020). Fault diagnosis in low voltage smart distribution grids using gradient boosting trees. Electr. Power Syst. Res. 182, 106254. doi:10.1016/j.epsr.2020.106254
Shervashidze, N., Vishwanathan, S. V. N., Petri, T. H., Mehlhorn, K., and Borgwardt, K. M. (2009). “Efficient graphlet kernels for large graph comparison,” in Proc. Of the 12th int’l conf. On artificial intelligence and statistics (Clearwater: MIT Press), 488–495.
Swetapadma, A., Agarwal, S., Abdelaziz, A. Y., Kotb, H., AboRas, K. M., Flah, A., et al. (2022). A novel primary and backup relaying scheme considering internal and external faults in HVDC transmission lines. Front. Energy Res. 10. doi:10.3389/fenrg.2022.1003169
Tang, J., Yin, X., Zhang, Z., et al. (2013). Iterative extraction of detected zero-mode wave velocity and its application in single phase-to-ground fault location in distribution networks. Trans. China Electrotech. Soc. 28 (4), 202–211.
Velickovic, P., Cucurull, G., Casanova, A., et al. (2022). Graph attention networks. Available at: https://arxiv.org/abs/1710.10903v3.
Wu, L., Huang, C., Qi, Y., et al. (2011). “A new adaptive matrix algorithm for fault location in distribution network with distributed generation,” in International Conference on Electrical and Control Engineering, Yichang, September 28th, 2022 (IEEE), 499–504.
Xing, X., Fang, S., Zhang, H., et al. (2017). Adaptive section location method for active distribution network based on synchronized phasor measurement. Power Syst. Technol. 41 (6), 2027–2034.
Zhu, J. (2006). Improved-single-ended traveling-wave fault-location algorithm based on experience with conventional substation transducers. IEEE Trans. Power Deliv. 21 (3), 171–172.
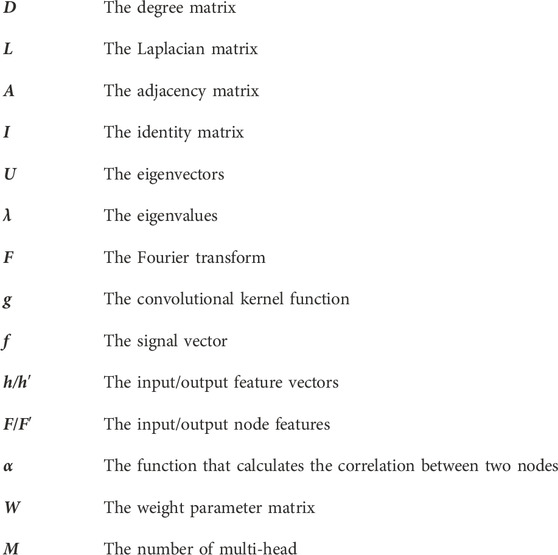
Nomenclature
Keywords: fault location, distribution networks, graph attention networks, graph convolutional networks, smart grids
Citation: Liang L, Zhang H, Cao S, Zhao X, Li H and Chen Z (2024) Fault location method for distribution networks based on multi-head graph attention networks. Front. Energy Res. 12:1395737. doi: 10.3389/fenrg.2024.1395737
Received: 04 March 2024; Accepted: 10 May 2024;
Published: 27 May 2024.
Edited by:
Shiwei Xie, Fuzhou University, ChinaReviewed by:
Masoud Dashtdar, Islamic Azad University, Bushehr, IranHossam Kotb, Alexandria University, Egypt
Copyright © 2024 Liang, Zhang, Cao, Zhao, Li and Chen. This is an open-access article distributed under the terms of the Creative Commons Attribution License (CC BY). The use, distribution or reproduction in other forums is permitted, provided the original author(s) and the copyright owner(s) are credited and that the original publication in this journal is cited, in accordance with accepted academic practice. No use, distribution or reproduction is permitted which does not comply with these terms.
*Correspondence: Zhiwei Chen, chenzhiwwei@163.com