Evolution of pore structure during fines migration in sand pack: NMR experimental and numerical investigations
 Tang Haoxuan
 Jia Chunsheng
 Wang Ziyi1
  Zhu Baiyu
- 1School of Petroleum Engineering, Southwest Petroleum University, Chengdu, Sichuan, China
- 2School of Earth Science and Technology, Southwest Petroleum University, Chengdu, Sichuan, China
- 3CNOOC (China) Limited Beijing Research Center, Beijing, China
- 4Petroleum Engineering Research Institute, Jianghan Oilfield, Wuhan, Hubei, China
Unconsolidated sand reservoirs containing heavy oil play a significant role in hydrocarbon resources, characterized by high porosity and permeability alongside abundant movable fines. During production, these fines can detach and migrate with the reservoir fluids, causing pore plugging and reduced productivity. Visualizing and quantitatively evaluating the evolution of pore structure caused by fines migration under various influencing factors at the microscale is fundamental for devising effective prevention and mitigation measures. This study employs on-line NMR experiments and CFD-DEM simulations to investigate fines migration processes and their effects on physical properties and pore structure at the pore scale. Results indicate that fines migration initiates the formation of a preferential network of migration pathways. The evolution of pore structure demonstrates zonal characteristics along the flow direction, with fines plugging and residual accumulation primarily occurring in the middle/rear section of the core. As the core’s skeleton porosity decreases, fines plugging intensifies; however, at high injection velocity, new dominant flow channels may emerge, leading to a transition from a single-peak to a double-peak T2 spectrum. Below the critical velocity (0.5–1 mL/min), an increase in flow velocity exacerbates severe fines plugging. Conversely, above the critical velocity, an increase in flow velocity results in a more pronounced enhancement of permeability.
1 Introduction
Heavy oil accounts for a significant portion, approximately 70%, of global hydrocarbon resources, totaling approximately 9–13 trillion barrels, and plays an essential role in oil and gas production (Istchenko and Gates, 2014). Reservoirs containing heavy oil are primarily composed of unconsolidated sand, which facilitate the detachment and migration of fines with the flow of working fluids, ultimately leading to pore throat plugging and a decrease in oil and gas production (Yang et al., 2016b). Reservoir fines are typically defined as mineral particles with a diameter less than 37μm, and these fines often adhere to grain surfaces in a loosely cemented form. The primary source of these removable fines is clay minerals such as kaolinite, montmorillonite, and illite, with some quartz and silica particles also capable of release (Miri et al., 2021). The mechanism of fines migration and plugging is highly dependent on the rock mineral and pore structure, as well as numerous factors such as the type, density, defects, position, and fluid-solid coupling (Wang et al., 2022). These complex mechanisms are often intertwined, with inherent ambiguities and limitations that necessitate comprehensive investigation and thorough clarification.
Regarding theoretical research, fines migration and their accompanying capture process in porous media following fines detachment are also known as deep bed filtration (DBF). The most classic theory on DBF is the model proposed by Herzig et al. (1970), which considers particle mass conservation and particle capture theory. Many scholars have improved upon this model using different modeling methods (Payatakes et al., 1974; Bedrikovetsky et al., 2001; You et al., 2014). As for experimental characterization techniques, most experiments still focus on core testing, particle size-packed (or mineral particle-packed) bed models, and pseudo-2D visualization models (Khilar and Fogler, 1987; Ahfir et al., 2017). A few scholars have employed testing methods such as NMR (Hanafy and Nasr-El-Din, 2016; Kamal et al., 2019; Wu et al., 2019; Hanafy et al., 2022), CT (Wildenschild et al., 2002; Lagasca and Kovscek, 2014; Khan et al., 2017), and SEM (Poesio and Ooms, 2004) to characterize fines migration process. Previous experimental researches mainly focus on the permeability loss or filter coefficient at the macroscopic scale over time. In recent years, numerical simulation has been widely applied in the evaluation of fines migration damage. These numerical simulation methods include the two-fluid model (TFM), discrete phase model (DPM), computational fluid dynamics coupled with discrete element method (CFD-DEM), particle tracking method, and Brownian motion simulation (Koyama et al., 2008; Mondal et al., 2016; Zhang et al., 2017; Jung et al., 2018; Sahan and Kuruneru, 2018; Zhu et al., 2019). The two-fluid method considers particles as a continuous medium and can simulate particle transport without capture (Payman and Timo, 2015). The discrete phase model and particle tracking method (Zhu et al., 2021a) have limited consideration of particle collision and capture processes. Brownian motion simulation is mainly used for the transport of nanoparticles, with sufficient consideration of DLVO forces between particles (Perrot et al., 2007). However, the particles transportation in the reservoir are mainly at the micrometer scale, and its applicability is limited due to computational limitations. The CFD-DEM mehtod considers the interactions between particles-particles, particles-fluid, and particles-pores, and can obtain the microscopic mechanisms of particle transport, deposition, and capture, making it a suitable means for the study of fines migration (Guo et al., 2022; Zheng et al., 2022; Zhu et al., 2022). Generalized CFD-DEM simulations include LES-DEM, LBM-DEM, DNS-IB, etc (Zheng et al., 2022). Currently, the CFD-DEM simulation results for fines migration can be classified into the following categories based on the geometric structure of the porous media: 1) simulation of fines migration in a packed bed model; 2) simulation of fines migration in a relatively realistic porous media (Zhu et al., 2021b; Elrahmani et al., 2022).
Through theoretical, experimental, and numerical simulation analyses, it is believed that the factors influencing fines migration can be categorized into four main domains: 1) pore structure characteristics, 2) fluid properties, 3) temperature (specifically in thermal recovery) and pressure conditions, and 4) operational aspects related to well management (Kudrashou and Nasr-El-Din, 2023). The ratio between fine particle size and pore throat size plays a crucial role in fines migration and retention, particularly in the context of fines plugging (Valdes and Santamarina, 2006). Traditionally, empirical guidelines such as the one-third, one-seventh, and one-fourteenth rules have been proposed to determine fines migration and retention in porous media (Civan, 2016). Experimental results indicate that as effective stress increases, reservoir compaction becomes more pronounced, resulting in less fines detachment (You et al., 2013).
However, fines migration and plugging contribute significantly to permeability reduction. Additionally, the mineral composition influences fines migration, with clay and non-clay minerals exhibiting distinct sensitivity characteristics when interacting with fluids (Russell et al., 2017; Kamal et al., 2019). Minerals like kaolinite and illite are susceptible to pore plugging due to hydration expansion. Factors related to fluid mainly include fluid salinity (Rosenbrand et al., 2015; Song and Kovscek, 2016), pH (You et al., 2019), and fluid composition (Yuan et al., 2018). Lower salinity, higher pH, and the presence of monovalent cations enhance the static electrostatic repulsion between fines and surfaces, rendering fines more prone to detachment. Some studies indicate that higher water content may exacerbate fines migration damage. Moreover, an increase in temperature facilitates fines detachment, resulting in increased permeability damage, though temperature reduction is believed to restore it (Rosenbrand et al., 2015). Regarding drilling operations, flow rate emerges as a critical factor influencing fines detachment and transport, with higher flow rates generating increased drag forces that can lead to greater fines detachment and transport. Moreover, the choice of sand control screens affects the extent of fines migration damage (Wang et al., 2020).
Fines migration manifests in two distinct and opposing outcomes: channeling and plugging (Wang et al., 2005). Upon commencement of reservoir production, loose fines, along with particles and sand grains liberated from rock matrix detachment, ingress into the wellbore alongside the oil and gas stream (Al-Awad, 2001). The liberation of fines from grain surfaces induces a notable augmentation in pore volume and permeability, initiating initial channeling. Consequently, fines may become trapped and aggregate in pore throats and on pore surfaces due to factors like strain/size exclusion and aggregation, precipitating a marked reduction in permeability (Yang et al., 2016b). The magnitude of impairment hinges on the composition and uniformity of the pores and their associated fines.
Literature research indicates that fines migration damage is a critical issue in the production process of unconsolidated sandstone reservoirs. Previous studies have mostly focused on industry-standard core flooding experiments and theoretical model calculations as research methods. Evaluation criteria primarily involve analyzing changes in permeability before and after core flooding. Discussions on influencing factors primarily center around the impact of fluid properties and mineral types on fines detachment and adsorption. However, in the context of reservoir production, quantitatively assessing changes in pore structure and plugging before and after fines migration is essential for developing effective prevention and mitigation strategies. For instance, if fines migration has a positive effect, preventive measures may not be necessary.
Therefore, we selected a sand pack from the Guantao Formation in the Bohai oilfield and used on-line NMR testing combined with CFD-DEM simulation to discuss the impact of different types of reservoirs, fluid velocities on fines migration and pore structure evolution, as well as the mechanisms and development laws of fines migration and plugging from a visualized and quantitative pore-scale perspective.
2 Experimental apparatus and methods
2.1 Materials
Rock samples were chosen from the Guantao Formation in the Bohai oilfield, which is characterized by a decline in porosity as depth increases. The upper section primarily comprises Class I (K > 2000mD) and Class II (1000mD < K < 2000mD) reservoirs, whereas the lower section is predominantly composed of Class III (500mD < K < 1000mD) and Class IV (K < 500mD) reservoirs. Three rock samples meeting the experimental criteria and possessing suitable lengths were selected and grouped by reservoir type (Table 1) for fines migration assessment using NMR. Prior to experimentation, a small portion of each rock sample was sectioned to create cast thin sections, facilitating a comparison of pore structure alterations pre- and post-experimentation (Figure 1). The quartz content of the cores ranged from 50% to 80%, feldspar content ranged from 10% to 30%, rock fragment content ranged from 5% to 25%, and mica content ranged from 2% to 8%. Additionally, clay mineral content varied from 5% to 25%, primarily consisting of illite/smectite mixed layer and kaolinite. The experimental fluid simulated formation water, possessing analogous properties to actual formation fluid, with a viscosity of 1.01 mPa·s. The formation water was of CaCl2 type, exhibiting an average total mineralization of 6071 mg/L and a pH range of 7.5–9.0. Research has shown that divalent salts exert a substantial inhibitory influence on fines migration in the presence of monovalent and divalent salts. Under highly alkaline conditions, divalent salts can retain approximately 97% of fines within treated porous media (Assef et al., 2014; Muneer et al., 2022).
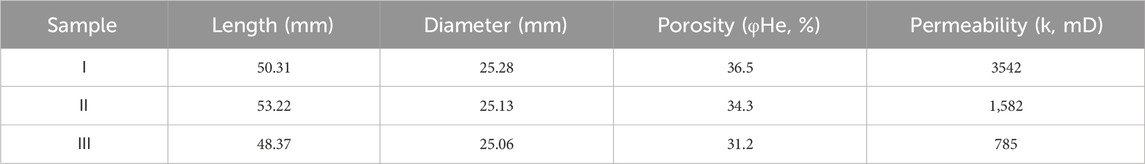
Table 1. Physical properties of the samples.
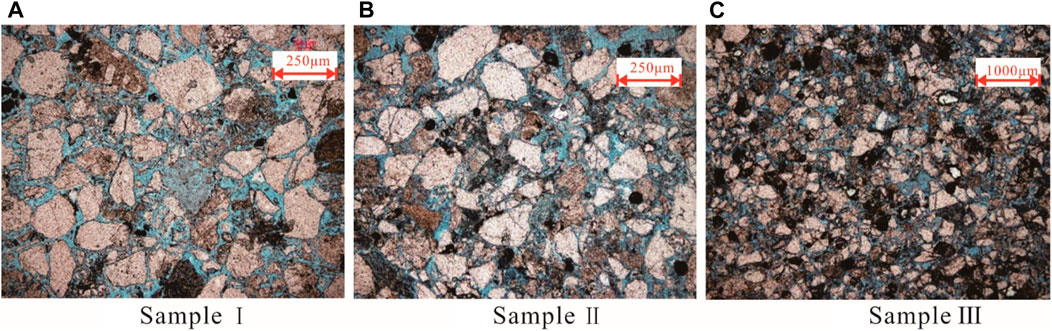
Figure 1. Cast thin sections before experiments.
Rock Sample I has a porosity of 36.5% and a permeability of 3542mD, indicating good overall pore-throat connectivity. Combining the pre-displacement NMR T2 spectrum, it exhibits a bimodal distribution. The first peak with a T2 value around 0.2 ms accounts for 28.9% of the total signal and represents smaller pores or fine throats, while the second peak around 100 ms, representing larger pores and coarse throats, accounts for 71.1% of the signal. Rock Sample II has a porosity of 34.3% and a permeability of 1582mD, also indicating good overall pore-throat connectivity. The NMR T2 spectrum pre-displacement shows a bimodal distribution as well. The first peak, with a T2 value near 0.4 ms, represents 37.0% of the signal and denotes smaller pores or fine throats, while the second peak around 60 ms, accounting for 63.0% of the signal, represents larger pores and coarse throats. Rock Sample III has a porosity of 31.2% and a permeability of 785mD, indicating relatively poorer overall pore-throat connectivity. The pre-displacement NMR T2 spectrum shows a unimodal distribution, with the peak centered around 1 ms (Figure 2).
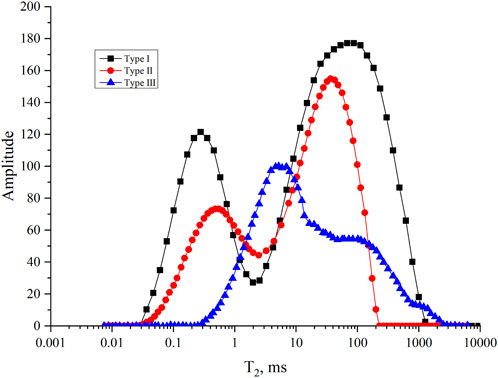
Figure 2. Experimental rock sample NMR T2 spectrum.
2.2 Experimental setup
The experimental setup mainly consists of a low-field NMR imaging analyzer, with a Niumai MacroMR12-150H-I NMR device. The NMR core holder is made of PEEK material, and the confining pressure is provided by fluorinated oil. Both the PEEK material and the fluorinated oil do not produce NMR signals, ensuring that the NMR signals detected in the experiment are only generated by the pore water in the core. Flow rate and pressure were monitored at the inlet and outlet, with a flow rate sensor accuracy of 0.007 mL/min and a pressure sensor accuracy of 0.01 MPa. The equipment can obtain the permeability, NMR T2 relaxation spectrum, and imaging of the core to quantitatively characterize the pore water distribution and pore-throat connectivity of porous sandstone under different injection conditions (Figure 3).
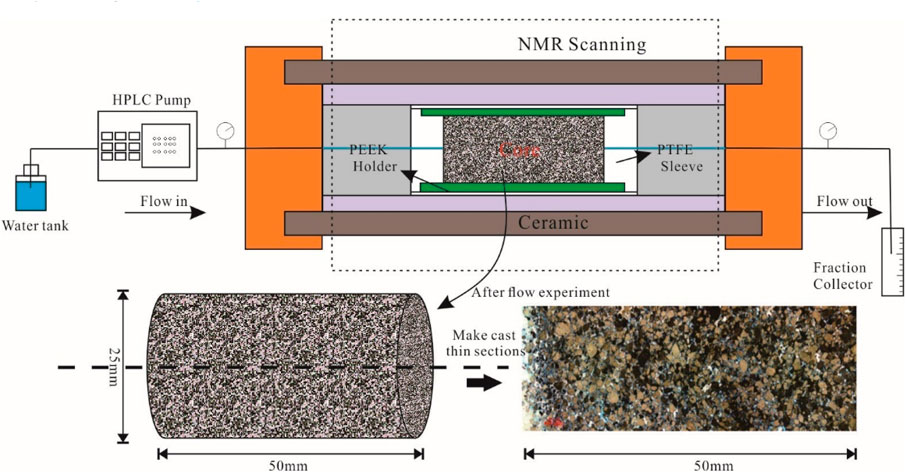
Figure 3. Setup of the flow experiment with NMR (not to scale).
2.3 Experimental procedure
The experimental procedures in this study were primarily conducted following the guidelines outlined in the standard “Indoor Evaluation of Reservoir Sensitivity” (SY/T5358-2010), with some modifications made to adapt to the specific circumstances of the study. The experimental steps include: 1) Clean the experimental core samples, and then dry them and measure the air permeability Kg; 2) Vacuum-saturate the core samples with simulated formation water and immerse them for more than 24 h; 3) Insert the fully saturated natural rock sample into the core holder, ensuring that the direction of liquid flow in the rock sample is consistent with the direction of gas flow when measuring gas permeability, and ensuring that no air is left in the system during the entire experimental process; 4) Slowly adjust the confining pressure to 2.0 MPa (to prevent the core from breaking), and ensure that the confining pressure of the core is greater than the inlet pressure of the core by 1–1.5 MPa; 5) Place the core holder containing the rock sample in the on-line displacement device of the NMR instrument and test the nuclear magnetic T2 spectrum and imaging under the saturated state; 6) Inject formation water into the core at flow rates of 0.5–6.0 mL/min (SY/T5358-2010), record the pressure difference at each flow rate, calculate the changes in permeability according to Darcy’s law, and test the NMR T2 spectrum and imaging after the flow rate stabilizes; 7) After the experiment, take out the core, cut it along the longitudinal section, and make cast thin sections to observe the changes in pore structure caused by fines migration (Figure 3).
Cleaning heavy oil cores in loose sandstone is a challenging task. The cores themselves have poor consolidation, making them prone to particle detachment during the cleaning process, with some cores heavily reliant on the consolidation of heavy oil. To begin with, in the preparation of core samples, a freezing method is employed. The cores are immersed in a sealed container of liquid nitrogen for 0.5 h until they are fully solidified. Then, a liquid nitrogen-cooled drilling tool is used to extract cylindrical cores, which are then sectioned to form end faces. Subsequently, the cylindrical cores are encapsulated using a cotton gauze strip. The encapsulated samples are placed in an oil extractor for cleaning, using a cleaning solution composed of benzene, acetone, and ethanol in a ratio of 70:15:15. The cleaning process avoids flooding to prevent core breakage and particle detachment. After heating and evaporating the cleaning solution, the vapor rises, cools, and condenses, dripping into the core chamber. The cores are then flushed and soaked in the condensed liquid to dissolve and separate the crude oil from the rock samples. Although the cleaning efficiency may be lower compared to flooding cleaning, this method ensures the integrity of the cores.
After cleaning the cores, they are wrapped with PTFE tape and then encased in polyethylene heat shrink tubing. A 120-mesh ceramic screen is used as a permeable barrier to protect the end faces of the cores, and PTFE sealing rings are used for fixation. Next, the cores are subjected to vacuum saturation. The vacuum pressure is set at −0.098 MPa, allowing the cores to be saturated with simulated formation water under capillary forces. This process ensures that fines transport within the cores does not occur prematurely.
2.4 Experimental design
As mentioned earlier, the differences in clay mineral types and content, as well as reservoir water properties, in the study area are not significant. The intensity of fines migration is mainly influenced by the petrophysical properties and pore structure of each layer, as well as the extraction rate and reservoir fluid type. Therefore, this study analyzed the fines migration effects on three types of cores with different petrophysical properties and pore structures. Additionally, during the experiments, the evolution of pore structure before and after fines migration was compared at injection velocity of 0.5–6 mL/min (Table 2).

Table 2. Experimental design.
3 CFD-DEM simulation
3.1 CFD-DEM coupling method
In this study, we used a CFD program based on Darcy’s law to simulate fluid flow and DEM based on Newton’s second law to calculate particle (fines and rock grains) motion, considering the interaction forces between fluid and particles as well as among particles. No further experimental or theoretical validation of this method will be conducted, as it has been extensively verified in previous studies on fracturing (Huang et al., 2019), filtration (Sören and Jürgen, 2012), and other areas and has been shown to be reliable.
In the simulation, the enclosed area formed by the mutual contact of particles (Grains and fines) is defined as a “domain”. When the fluid flows between any particles in contact, it can be described by a network of connected domains, forming a “pipe” model, in which the flow rate is proportional to the pressure difference (Figure 4). The study developed a fluid-particle-fines coupling module using Python based on the “fluid pipeline” and “fluid domain” models, The flow between two “domains” follows Darcy’s law (Zhang et al., 2013; Zhang et al., 2017).
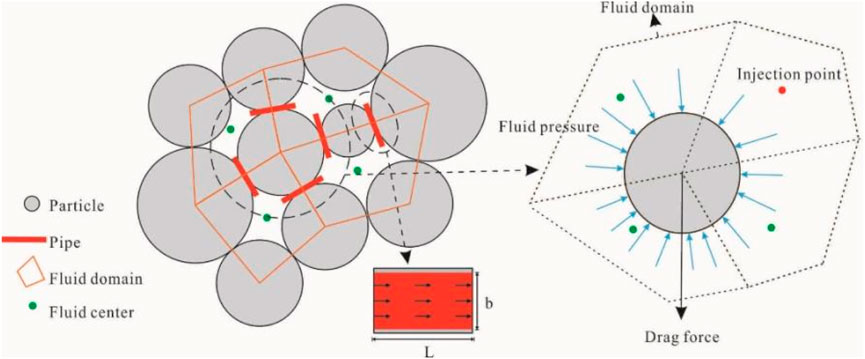
Figure 4. Schematics of the pore network model for fines migration DEM modeling.
Where,
Within a time step
Where,
Where,
Fines migration and mechanical state are solved in the Lagrangian coordinate system, meaning that their trajectories are tracked through explicit calculations. The equilibrium equation is given by Cundall and Strack (1979) as follows:
Where,
3.2 Numerical model setup
We employ Itasca’s PFC3D particle flow simulation code to model the migration and plugging process of fines in a skeletal particle model (Itasca, Inc., 2018). First, the pore structural parameters and composition of the sand pack in the study area are determined, and the skeletal particles and fines are generated in the DEM based on the particle size distribution curve and porosity through initial equilibrium, radius expansion, and servo calculation, and the porous model of the reservoir is constructed (Figure 5). The skeletal particle size in the sand pack ranges from 0.05 mm to 1.2 mm, with 80% of particles between 0.2mm and 0.5 mm and an average particle size of approximately 0.3 mm. In DEM simulations, considering computational efficiency and the requirements of empirical drag force equations, the difference in particle sizes should not exceed an order of magnitude. Therefore, we should not include very fine and very coarse skeleton particles. In this study, the discrete element numerical simulation design model considers skeleton particle sizes ranging from 0.2 mm to 0.4mm, following a Gaussian distribution. While the fines diameter is designed to be 0.03 mm based on previous research results, and the fines volume concentration is set at 2%. The actual porosity of the reservoir in the study area ranges from 25% to 35%, and considering the computational efficiency of the DEM simulation, the porosity in this paper is set to 35%–50% (Table 3).
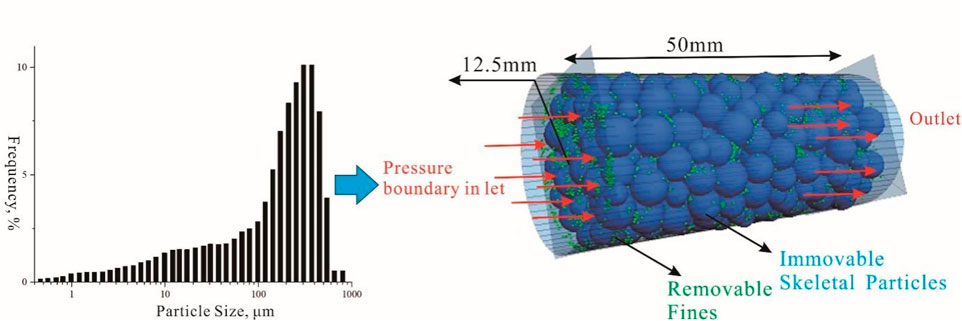
Figure 5. Core model setup for the DEM simulation.
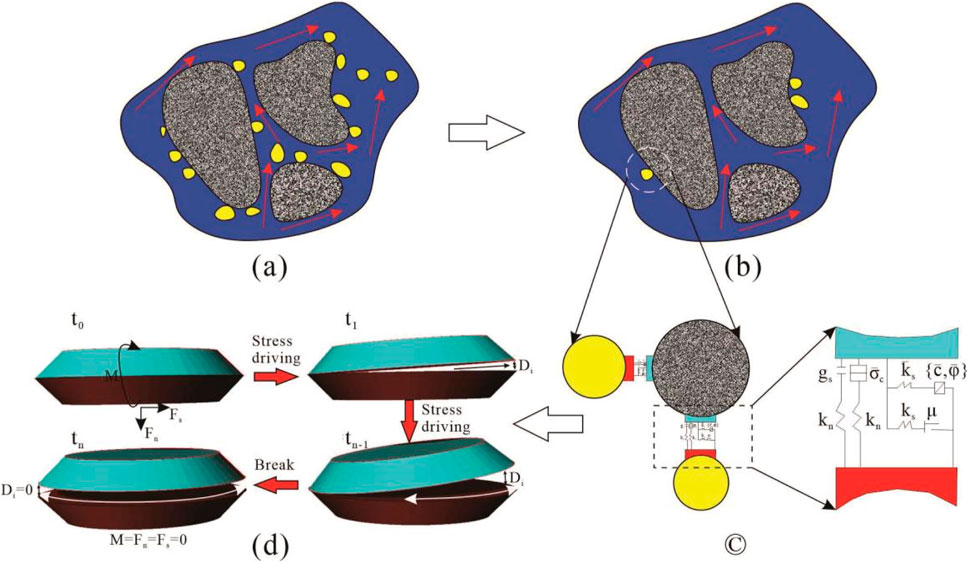
Figure 6. Schematic diagrams of the whole process of the parallel bond diameter attenuation mechanism. (A, B), Schematic diagram of fines migration process. (C), Description of the parallel bond contact between fine-particles, kn, ks, μf denote the normal stiffness, shear stiffness and friction coefficient, respectively, gs is surface gap. (D) Attenuation model of the parallel bond diameter over time.

Table 3. Parameters used in the simulation.
Next, different rock mechanics and bonding parameters are assigned to the grains and fines based on their mineral types and contents in the DEM. The mechanical parameters assigned in this study are not the mechanical parameters of the core plug samples, but rather the mechanical parameters of the rock skeleton particles, such as Poisson’s ratio and Young’s modulus. As mentioned earlier, the predominant mineral in this region is quartz. Therefore, the mechanical parameters of the rock skeleton particles are designed to mimic the rock mechanics parameters of quartz particles.
And the adhesive forces are assigned between the grains and fines, where the adhesive forces are simulated using the linear parallel bonding model (Potyondy and Cundall, 2004; Figure 7C). In this study, the DLVO model was not directly utilized to describe the adsorption behavior of fines. During the generation of the porous media model, the skeleton particles were immobilized, and a cohesive force was introduced between the skeleton particles and fines to simulate the bonding process. The cohesive force was implemented using a parallel bond model, and its strength was controlled by factors such as salinity and pH value. Then, a velocity boundary condition of 0.05–1 m/s is applied to the ends of core, and a steady-state flow condition is achieved through enough time steps. When the fluid-fine shear force exceeds the fines-grain shear strength, the adhesive force chain is broken and the fines detach, causing plugging or penetrations in the physical model (Figure 7A). The simulation ends when there is no obvious detachment or movement of fines in the model.
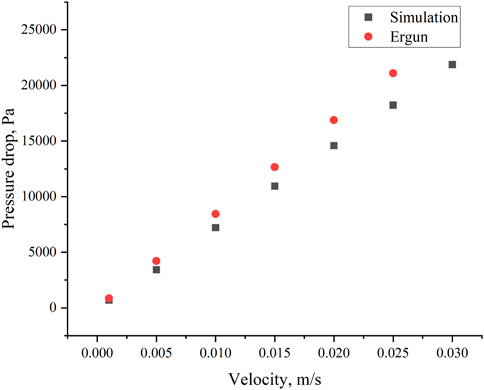
Figure 7. Comparison of the simulated average pressure drop in the sand pack with that calculated by Ergun equation.
As the DEM requires a small enough time step to prevent non-convergence caused by excessive energy, this paper sets the simulation time step at 10–7 s. However, if the interaction forces between CFD and DEM are coupled at each time step, the simulation workload will be very large. Therefore, this paper assumes that the fluid flow velocity remains unchanged within a single CFD grid in a short period of time, i.e., coupling once every 20 DEM time steps. We conduct single-factor analysis on the porosity of the granular grains, fines concentration, pressure, etc.
3.3 Validation
Due to the significant computational load of numerical simulations, a higher injection velocity has been designed to meet the requirement of achieving particle stability within a shorter period (2 s). However, experiments are typically conducted on a minute scale, making direct comparison challenging. Therefore, this study validates the Ergun equation and, concurrently, introduces different grid sizes during the comparison of the Ergun equation to analyze the sensitivity of numerical simulations to grid variations. The fluid resistance loss through the sand pack (without fines) can be explained with the Ergun equation derived by the Turkish chemical engineer Sabri Ergun in 1952. This equation expresses the friction factor in a packed column as a function of the modified Reynolds number. The following extension of Ergun equation proposed by Akgiray and Saatçı (2001) is more suitable for calculating pressure drop in a sand pack.
where:
4 Results and discussion
4.1 Experiment result
From the changes in the NMR T2 spectrum (Figure 8), for sample I, as the injection velocity increased from 1 mL/min to 6 mL/min, there was a noticeable decrease in the area of the left T2 peak, ultimately decreasing by 23%; meanwhile, the area of the right T2 peak showed a significant increase, ultimately increasing by 26%. It is noteworthy that when the injection velocity was between 1 and 2 mL/min, there was a certain degree of increase in the peak area of the small pore throats. This may be attributed to fines migration occurring within the small pore throats at low speeds, leading to increased segmentation. For sample II, as the injection velocity increased to 6 mL/min, there was a noticeable decrease in the area of the peak corresponding to small pore throats on the left side, with the peak area decreasing by 18%, while there was a significant increase in the peak area of the large pore throats on the right side, with the peak area increasing by 7%. This indicates a gradual increase in the number of large pore throats and a corresponding decrease in the proportion of small pore throats, although the magnitude of the increase is much lower than for sample I. Unlike sample I, there was no noticeable rightward shift in the main peak position of the large pore throats, indicating a relatively lower degree of reservoir improvement. For sample III, as the injection velocity increased to 6 mL/min, the NMR T2 spectrum gradually exhibited a bimodal characteristic, with a new peak appearing near a T2 value of 200 ms. This indicates the formation of new pore throats in this type of sample during the displacement process. Meanwhile, there was a certain degree of rightward shift in the peak corresponding to small pore throats, indicating a gradual decrease in the proportion of small pore throats.
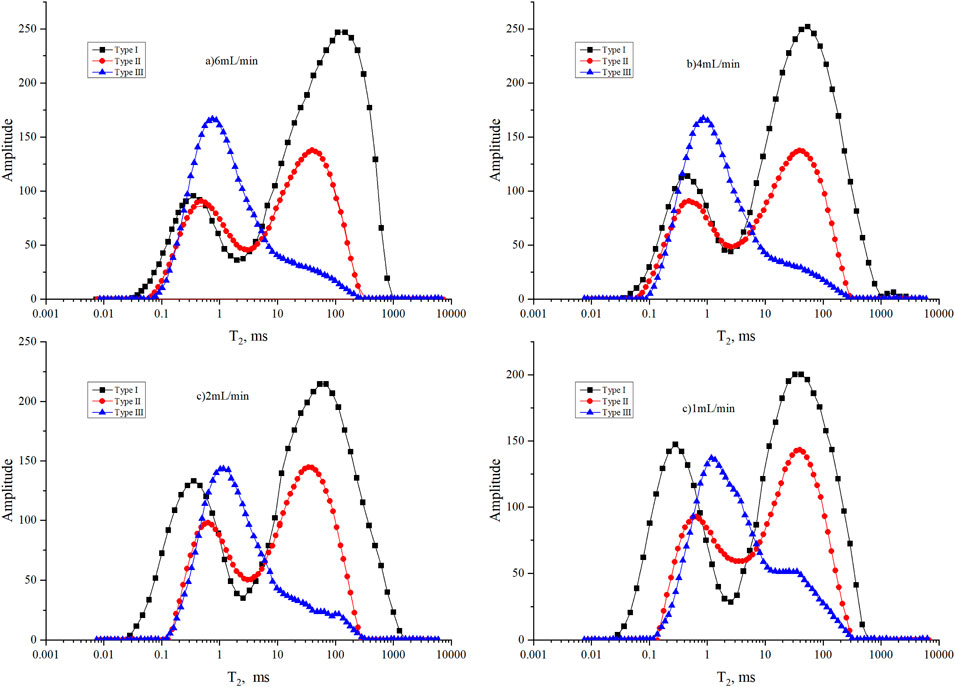
Figure 8. Variations in NMR T2 spectra of the different samples at different injection velocities.
The paper also documents the changes in permeability with injection velocity. According to Darcy’s law, the permeability change rate can be defined as the ratio of pressure difference
Based on the permeability change curves, for Sample I, when the injection velocity is below 2 mL/min, there is a rapid increase in permeability with increasing injection velocity. However, when the injection velocity exceeds 2 mL/min, the permeability gradually stabilizes, ultimately resulting in a 190% increase in permeability (Figure 9).
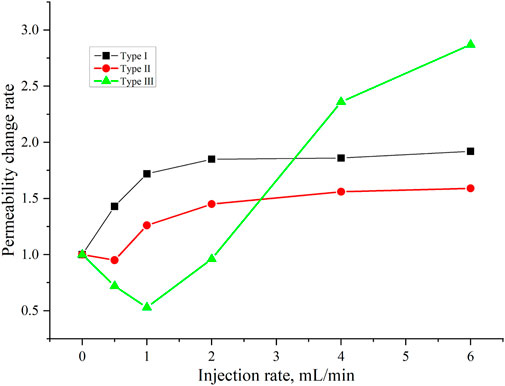
Figure 9. Variations in permeability change of the different samples at different injection velocities.
For Sample II, when the injection velocity is below 0.5 mL/min, there is a slight decrease in permeability, possibly due to particle plugging. In the range of 0.5–2 mL/min, as the fluid shear force gradually increases, a significant amount of fines detach, and plugged fines may also be dislodged, leading to a rapid increase in permeability. When the injection velocity exceeds 2 mL/min, the permeability change stabilizes, resulting in a 159% increase in permeability. Regarding Sample III, when the injection velocity is below 1 mL/min, the permeability gradually decreases to 53%. This reduction is attributed to fines being unable to penetrate the relatively tight rock sample at low velocities, resulting in severe plugging. During this period, no significant changes are observed in the nuclear magnetic resonance curve. However, when the injection velocity exceeds 1 mL/min, the fluid shear force is sufficient to penetrate the fines-plugged region, forming preferential flow channels, leading to a gradual increase in permeability up to 287%.
Figure 10 presents the NMR images at different injection rates in I samples. Overall, there is a noticeable increase in the red high-intensity signal area with increasing injection rate, indicating improved connectivity and larger pore sizes. Additionally, in Figure 10B, it can be observed that at an injection rate of 1 mL/min, there is a distinct network-like pattern in the strong signal, suggesting that during the initial stages of injection, fines migration primarily occurs in dominant pathways, expanding the preferential channels and even forming a network-like wormhole structure as the injection progresses. Furthermore, it is evident that as the injection rate increases, the signal intensity near the inlet of the core becomes more pronounced, while the signal amplitude at the outlet is relatively weaker. This observation indicates that fines detachment is more significant near the inlet, substantial fines detachment and accumulation lead to a certain degree of plugging at the outlet, resulting in a weaker signal intensity.
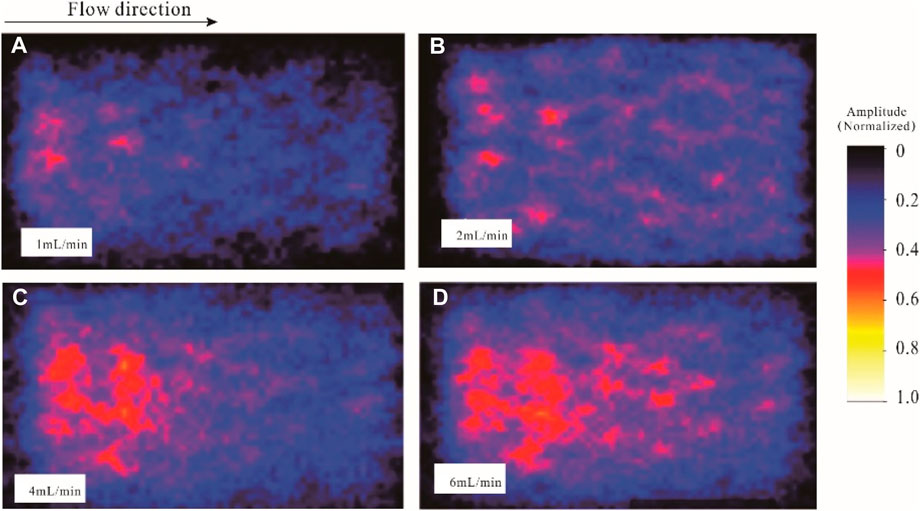
Figure 10. The NMR imaging of I samples at different injection velocitys.
After injection, observations of the longitudinal section of the cast thin section in I samples (Figure 11) revealed the pore structure evolution. Near the inlet, the rock structure appeared porous, with predominant point contacts between grains. Constricted and point-like throats were the dominant throat types, followed by sheet-like throats. The surfaces of grains and pores near inlet appeared clean, as clay minerals and fines had been detached and transported due to the drag forces exerted by the fluid. Some grains had even experienced a certain degree of loosening. In the middle section of the core, there was a noticeable improvement in pore-throat quality, which was significantly stronger than at the outlet but weaker than at the inlet. Furthermore, the pore-throat extraction image (Figure 11B) revealed distinct strip-like distributions of pores and throats in the middle section of the core, indicating an uneven distribution along the injection direction and the formation of dominant flow pathways. It was evident that the surfaces of grains and the internal regions of pores and throats in the middle section of the core exhibited a significant reduction in fines and clay minerals. However, some remnants were still present. The outlet displayed a more compact structure, with residual fines still present on the surfaces of grains.

Figure 11. Characteristics of cast thin sections of I samples after displacement.
Based on the examination of the post-injection cast thin section in Ⅱ samples (Figure 12), a similar trend to Sample I is observed. The inlet of the sample exhibits a more porous structure, characterized by excellent connectivity and a visually uniform distribution of blue-colored cast pores and throats. In contrast, the rear/middle portion of the rock sample shows the presence of distinct connected bands, representing the formation of preferential flow pathways during injection. However, this region demonstrates a relatively highly compacted compared to the inlet, with a significant presence of fines and clay minerals still adhering to the surface of grains. At the inlet, both the surface of grains and the interior of pores appear clean and devoid of fines. This cleanliness suggests the migration of fines towards the middle and rear sections of the sample during the injection process. In the rear portion of the rock sample, certain throats show partial plugging by fines in close proximity, indicating a tendency for short-distance migration and localized plugging effects.
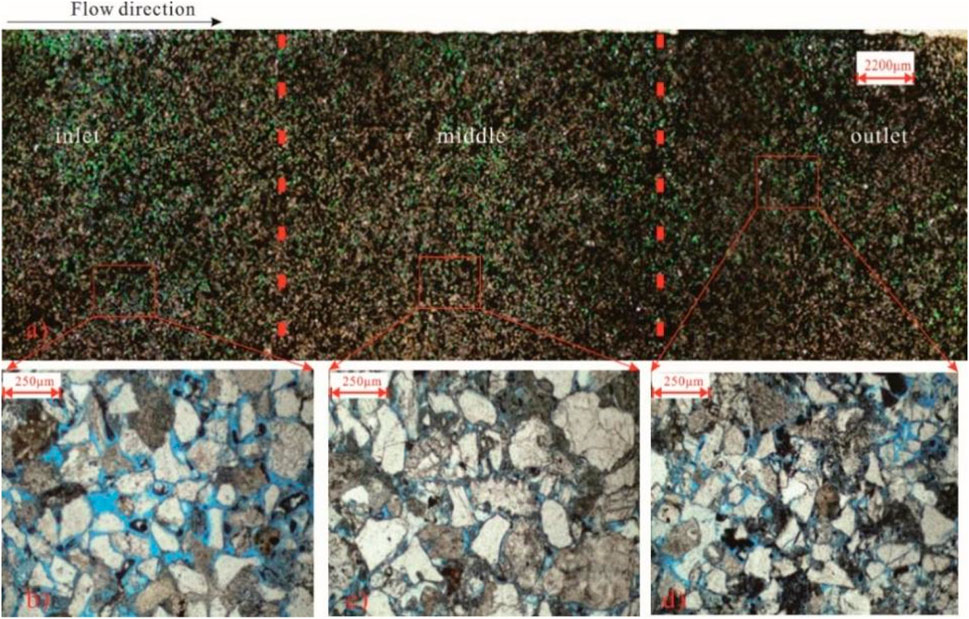
Figure 12. Characteristics of cast thin sections of Ⅱ samples after displacement.
Upon observing the longitudinal section of the Ⅲ sample after injection (Figure 13), it is evident that the improvement in pore throat is more pronounced at the inlet compared to the midsection of the sample. Post-injection, a significant reduction in clay minerals and fines is observed within the pore throats near the inlet, resulting in clean surfaces of the grains. The rapid reduction of blue-colored cast body pore throats along the injection direction indicates the migration of fines, leading to a decrease in pore radius and even complete plugging, thereby diminishing or eliminating pre-existing pore sizes. The thin section analysis reveals substantial variations in pore throat sizes in the midsection of the rock sample, indicating relatively short distances of fines migration and the prevalent plugging of nearby throats. Notably, the pore quality near the outlet of the core is superior to that of the midsection, likely due to the shorter pathway for fines migration at the outlet. Although no distinct dominant flow channels are discernible in the large thin section, certain large pore throats exhibit signs of aggregation, possibly attributed to the limitation of capturing 3D dominant flow channels within the thin section. Furthermore, the limited occurrence of dominant flow channels formed by Sample III is evident, showcasing a constrained spatial distribution in 3D space.
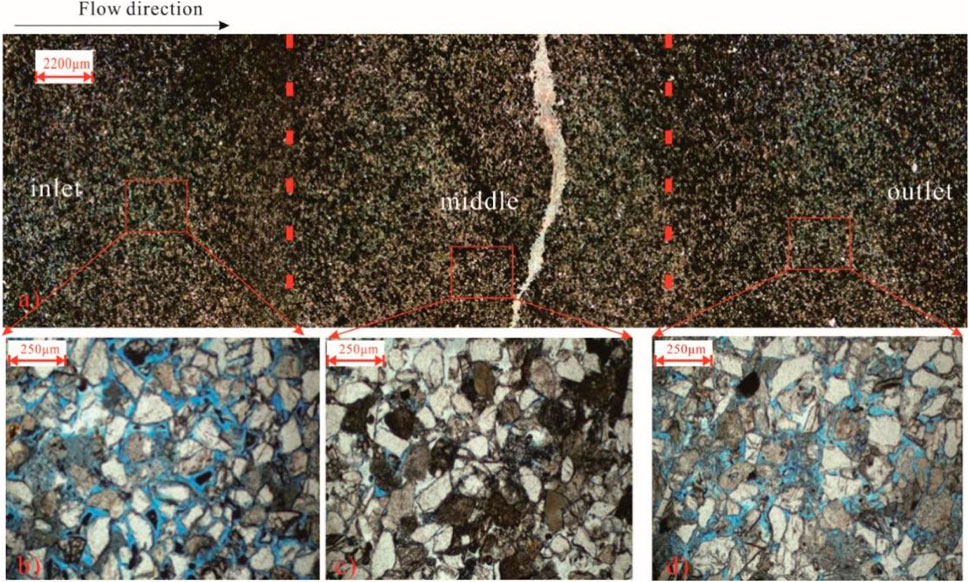
Figure 13. Characteristics of cast thin sections of Ⅲ samples after displacement.
4.2 Numerical results
4.2.1 The process of fines migration and plugging
From the longitudinal profile of the core sample during fines migration in CFD-DEM simulation, three distinct stages can be discerned:
The first stage corresponds to the detachment and migration of fines. At the onset of fluid injection, fines are initially distributed uniformly within the core, without prominent plugging. Consequently, fluid velocities are relatively homogeneous throughout the core, and fines at different locations detach and migrate concurrently.
The second stage is characterized by fines plugging. As fluid injection continues, a significant number of fines start to migrate. However, fines at different locations within the core undergo varying migration distances. Fines near the outlet only need to travel short distances to exit the core, while those near the inlet must traverse the entire core, encountering a higher probability of throat obstructions along their path. Moreover, the accumulation of fines in the midsection of the core exacerbates plugging in that region. Once throats along the migration path become plugged, subsequent fines either accumulate at the plugging site or circumvent the obstructions to continue their migration.
The third stage signifies flow stabilization. At this stage, fines capable of flowing out of the core have already done so. The remaining fines are confined within the core, unable to migrate, resulting in a steady flow rate (Figure 14).
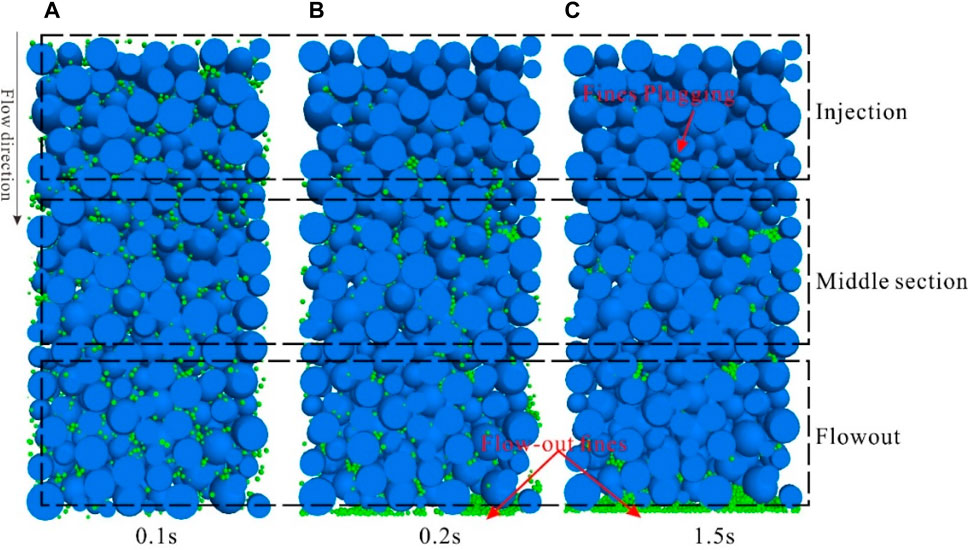
Figure 14. Longitudinal cross-section slices of fines migration at different time steps in CFD-DEM simulation. (Grain size range: 0.1–0.2 mm, migrating fines size: 0.015 mm; Injection velocity: 1 m/s).
It is evident that fines migration and plugging exhibit distinct zones. At the inlet, where the influx of fines is relatively low, the surfaces and interiors of the grains remain relatively clean, with only localized areas showing minor signs of fines plugging. On the other hand, at the core outlet, all migrating fines must pass through this section. It is still significant due to the shorter migration distance for fines near the outlet and the filtering effect of the midsection on larger fines, although the plugging severity is less pronounced than at the middle section. However, it is in the core midsection where the most severe plugging occurs. This is because fines from both the inlet and the midsection have to traverse a longer distance, leading to a higher likelihood of plugging. These findings are consistent with the observations made from the examination of cast thin sections in the previous experiments, further corroborating our understanding of fines behavior during migration and plugging processes.
From the porosity variation curve (Figure 15A), it is evident that the porosity near the inlet undergoes a rapid initial increase with increasing time steps, reaching a gradual stabilization around 0.2 s. At this point, the inlet becomes virtually devoid of migratory fines. In the middle region of the core, the porosity initially experiences a gradual decline, possibly attributable to the accumulation of fines received from the inlet. Subsequently, after approximately 0.1 s, a gradual porosity increase is observed, indicating the absence of new migratory fines from the inlet and the progressive migration of fines from the middle region towards the outlet. However, it is noteworthy that the increase in porosity in the middle region of the core remains significantly lower than that at the inlet, implying the presence of severe plugging phenomena. Prior to 0.1 s at the outlet, no discernible changes in porosity are observed, suggesting a delicate equilibrium between the inflow and outflow of fines at this particular region. However, after 0.1 s, a slight increase in porosity is observed at the outlet, indicating that the fines supply rate is lower than the outflow rate, yet rapidly reaching a new state of equilibrium. These findings underscore the occurrence of plugging phenomena at the outlet, with subsequent fines predominantly bypassing the plugging regions and continuing their migration forward.
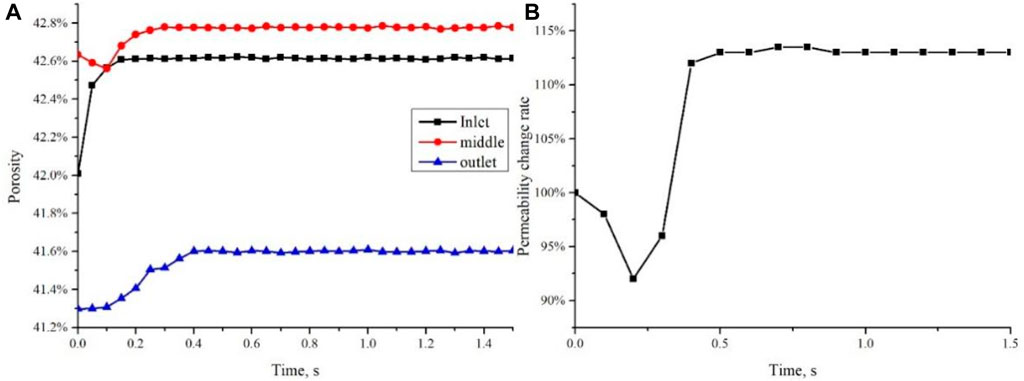
Figure 15. The variation of porosity at different locations with time steps.
From the perspective of the permeability change curve (Figure 15B), it is evident that the processes of fines migration and plugging occur swiftly. Prior to 0.2s, the permeability experiences a rapid decline due to the limited quantity of fines flowing out of the core and the occurrence of plugging at specific locations. Subsequently, the permeability undergoes a rapid increase, indicating a substantial outflow of fines from the core, while the plugging process ceases to escalate. By approximately 0.4s, the permeability stabilizes, denoting the absence of mobile fines. Overall, the permeability exhibits a rising tendency, ultimately reaching a final value of 113%.
4.2.2 The impact of skeletal porosity on fines migration
According to previous research on particle plugging, it has been demonstrated that the probability of critical bridging exponentially increases with the ratio of particle size to throat size. A higher skeletal porosity provides a larger pore volume available for fines transport, allowing for more efficient fines movement through the rock matrix. This results in a reduced likelihood of fines plugging and improved permeability. From Figure 16, it can be observed that at a skeletal porosity of 35%, there is virtually no fines discharge, and a significant number of fines still adhere to the grain surfaces, leading to severe plugging. As the skeletal porosity increases to 39%, a small quantity of fines is discharged at the outlet of the core, but significant plugging persists throughout the core, particularly in the middle and rear sections. When the skeletal porosity reaches 45%, a substantial number of fines is discharged at the outlet, yet some throats in the middle and rear sections of the core remain partially plugging, while no adhering fines are found within the pore throats at the inlet. At a skeletal porosity of 50%, nearly all fines are discharged, with only a few fines plugging in the throats of the rear section.
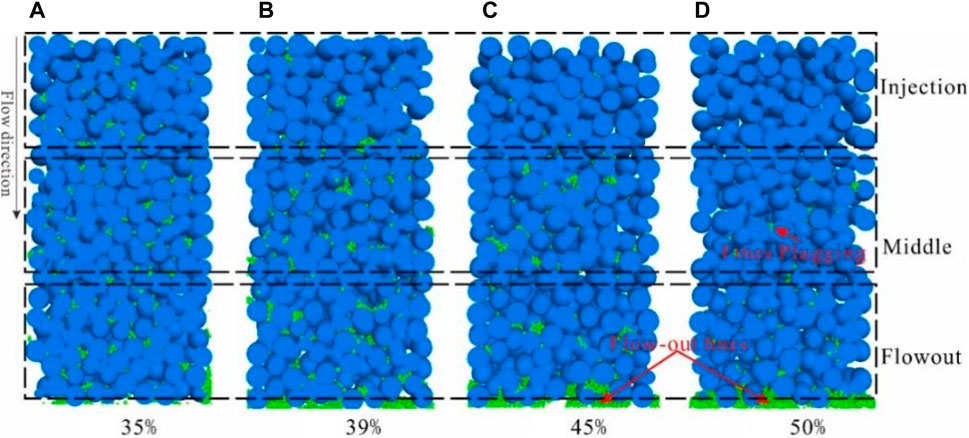
Figure 16. Longitudinal profile slices of fines migration under different skeleton porosities. (Grain size: 0.15mm, fines size: 0.015mm, injection rate: 1 cm/s).
From the porosity change curve (Figure 17A), it is evident that at a skeletal porosity of 35%, the porosity remains relatively stable, indicating a limited migration distance for fines. However, the permeability change curve (Figure 17B) shows a substantial decline to 91%, highlighting the severity of fines plugging. At a skeletal porosity of 39%, there is no significant variation in porosity at the outlet and middle sections of the core, with a slight decline even observed. Nevertheless, there is a slight increase in porosity at the inlet, suggesting the occurrence of fines plugging from the inlet towards the rear section of the core, resulting in a reduced permeability of 95%. As the skeletal porosity reaches 45%, the inlet porosity experiences a moderate increase of 1.2%, whereas the outlet and middle sections only exhibit a marginal rise of 0.2%, accompanied by anmporosity decrease during injection. This indicates that fines plugging initially transpires in the rear section of the core but gradually gets resolved over time. The permeability change curve corroborates these observations, as it demonstrates a minor decline in permeability prior to 0.2s, followed by a subsequent increase and stabilization at 105%. Ultimately, at a skeletal porosity of 50%, the entire core experiences a noticeable increase in porosity, and the post-injection permeability elevates to 112%.

Figure 17. Evolution of porosity and permeability under different skeleton porosity.
4.2.3 The impact of injection rate on fines migration
In sand pack, the majority of fines are primarily attached to the surfaces of grains through weak cementation, while a small fraction remains suspended within the pores. As the fluid flows, the shear forces between the fluid and fines can overcome the weak bonding, leading to fines detachment and subsequent migration. The drag force exerted on fines by the fluid is directly proportional to the flow velocity. Consequently, higher flow velocities facilitate greater fines detachment and faster migration. Figure 18 presents longitudinal cross-sectional slices illustrating the migration of fines under different injection rate. At an injection rate of 0.05 m/s, minimal fines discharge is observed at the outlet, with the majority of fines loosely retained in their original positions, indicating limited fines detachment. However, at displacement pressures ranging from 0.1 m/s to 0.5 m/s, fines migration occurs, with only a small number of residual fines found at the inlet, while a substantial accumulation and plugging of fines occur in the rear section of the core. The increased severity of plugging at lower injection rate may be attributed to two factors: 1) Insufficient shear forces within certain pores due to the lower velocity, thereby impeding fines detachment; 2) Lower velocity result in smaller pressure differentials across the plugging layer, rendering it more resistant to disruption and enhancing its stability. Finally, at an injection rate of 1 m/s, localized plugging occurs with a significant discharge of fines from the core.
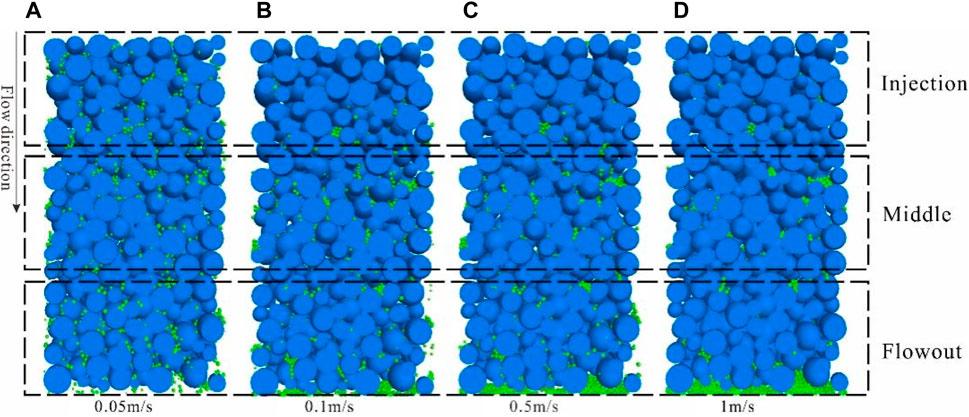
Figure 18. Longitudinal profile slices of fines migration under different injection rate. (Grain size: 0.1–0.2mm, fines size: 0.015mm, skeleton porosity: 40%).
From the incremental porosity curve (Figure 19A), it can be observed that at an injection rate of 0.05 m/s, the porosity increment remains around 0%, indicating limited detachment and migration of fines. At an injection rate of 0.1 m/s, the porosity near the inlet shows a gradual increase of approximately 0.4%, while a slight decrease in porosity is observed in the rear section of the core, suggesting that fines plugging predominantly occurs in the rear section. When the injection rate is increased to 0.5 m/s, the porosity near the inlet exhibits a rapid increase, reaching approximately 0.5% within 0.2 s, while the porosity in the rear section of the core experiences a slight decrease. At an injection rate of 1 m/s, the overall porosity of the core increases rapidly, with the inlet showing an increment of approximately 0.6%, and the rear section exhibiting an increase of around 0.2%.
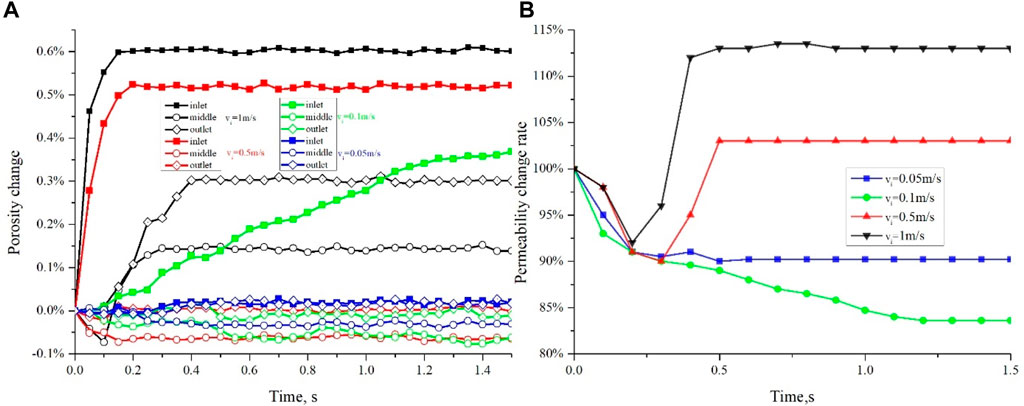
Figure 19. Evolution of porosity and permeability under different injection rate.
From the permeability change curve (Figure 19B), it can be observed that when the injection rate is below 0.1 m/s (critical velocity), the permeability exhibits a downward trend. Moreover, in this range, as the injection rate increases, the decrease in permeability becomes more pronounced due to the higher number of detached fines. However, when the injection rate surpasses 0.1 m/s, the permeability demonstrates an initial decline followed by an upward trend. Around 0.2 s, there is a rapid decrease in permeability followed by a swift recovery, ultimately surpassing the initial permeability. This suggests that maintaining an optimal production rate is crucial in mitigating the detrimental effects of fines migration, preventing excessive sand production, and effectively enhancing permeability in unconsolidated sandstone reservoirs.
To accurately calculate the inflection point, it is necessary to consider the bridging and blockage probability of fines under different pressure differentials, as well as the blockage layer shear failure caused by pressure accumulation. However, there is currently no definitive publicly available literature discussing the diagram for particle blockage layer failure. When the pressure differential is large, the blockage and shear failure of particles are relatively rapid processes. Therefore, the inflection point
4.2.4 The impact of viscosity on fines migration
In traditional studies of fines migration, the fluid is primarily regarded as single-phase formation water, thereby quantitatively considering factors such as pH value, electrochemical properties, and ion content on the initiation, detachment, and expansion properties of clay minerals. However, in actual reservoirs, fines migration and plugging occur alongside oil or water production. Due to the difficulty in preparing cores, conducting a large number of crude oil displacement experiments is relatively challenging. Therefore, this study investigates fines migration under conditions of single-phase water (1 mPa·s), oil-water mixture (5–10 mPa·s), and heavy oil phase (100 mPa·s) by varying fluid viscosity. It can be observed that at a velocity of 0.1 m/s, when viscosity increases from 1 mPa·s to 100 mPa·s, most fines are transported out of the core and accumulate at the outlet (Figure 20). There are fewer remaining fines at the inlet and middle of the core, with some fines remaining and accumulating at the outlet end of the core. The change in viscosity has little impact.
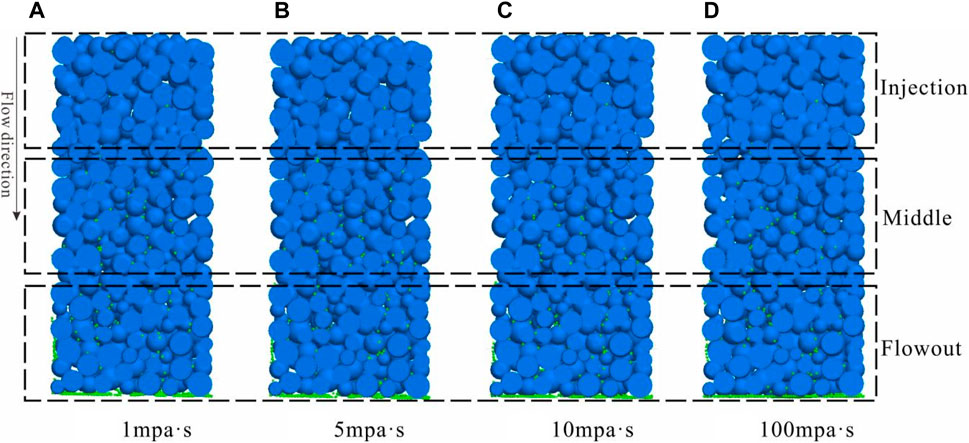
Figure 20. Longitudinal profile slices of fines migration under different fluid viscosity. (Grain size: 0.1–0.2mm, fines size: 0.015mm, skeleton porosity: 50%).
From the incremental porosity curve (Figure 21A), when the viscosity increases from 1 mPa·s to 100 mPa·s, the overall shape of the curve remains similar. It shows that the porosity at the injection end of the core increases significantly, the porosity in the middle of the core slightly increases, and the porosity at the outlet end of the core initially decreases and then increases, maintaining a stable characteristic, with the rate of change in porosity at the outlet end eventually stabilizing at around 0%. This indicates that fines migration from the injection end to the rear of the core results in blockage. A similar trend is reflected in the permeability curve, with the curve shape remaining largely unchanged with variations in viscosity, and the final permeability increasing to around 116%.
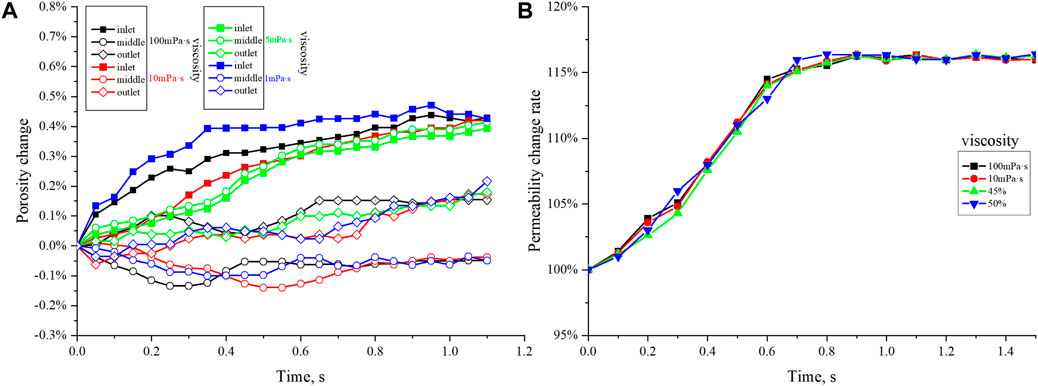
Figure 21. Evolution of porosity and permeability under different viscosity.
5 Conclusion
In this research, the combination of on-line NMR testing and CFD-DEM simulation was employed to investigate the fines migration behavior in different porous sand pack. The study focused on visually and quantitatively evaluating the evolution of pore structure and permeability during fines migration at the pore scale. The following research conclusions were obtained:
During fines migration, a network of preferential flow channels is initially formed, and the evolution of pore structure exhibits a zonal characteristic. Overall, there is a decreasing trend in the proportion of large pores and coarse throats along the direction of water flooding, with fines plugging and residue predominantly observed in the rear section of the core.
As the skeletal porosity increases, there is an increase in the proportion of medium to large pores and throats (T2 peak), indicating an improvement in the pore structure and permeability. However, as the core becomes denser, fines plugging gradually intensifies. Under high injection rate, the formation of new dominant flow channels may cause a transition from a single-peak to a double-peak T2 spectrum.
Fines migration requires the fluid-induced drag force to overcome the adhesive force between fines and grains, leading to fines detachment and subsequent migration. At low velocities, fines migration distances are short, and local retention and plugging are more likely to occur, primarily resulting in particle migration damage. Below the critical velocity, an increase in flow velocity actually leads to more severe plugging. However, as the flow velocity increases, the fines migration distance becomes longer, resulting in more significant improvements in pore-throat and permeability. Above the critical velocity, an increase in flow velocity leads to a more pronounced enhancement in permeability. The change in viscosity has little impact.
The above conclusions have implications for production processes, where they may manifest as enhanced permeability in the far-field and plugging near the wellbore. Therefore, effective mitigation of plugging near the wellbore is crucial in preventing and controlling fines migration damage during production. Additionally, maintaining an appropriate production rate is a key factor in preventing fines migration-induced damage, excessive sand production, and effectively enhancing permeability.
Data availability statement
The raw data supporting the conclusion of this article will be made available by the authors, without undue reservation.
Author contributions
THa: Writing–original draft, Writing–review and editing. JC: Conceptualization, Investigation, Writing–original draft. WZ: Writing–review and editing. LH: Writing–review and editing. WZ: Writing–original draft. THo: Writing–original draft. ZB: Writing–original draft.
Funding
The author(s) declare that financial support was received for the research, authorship, and/or publication of this article. This work is supported by the National Natural Science Foundation of China (No. 51674211; No. 41502126); Major Program of National Natural Science Foundation of China (51534006). Supported By Open Fund (2022-19) of State Key Laboratory of Oil and Gas Reservoir Geology and Exploitation Southwest Petroleum University.
Conflict of interest
Author WZ was employed by CNOOC (China) Limited Beijing Research Center. Author ZB was employed by Jianghan Oilfield.
The remaining authors declare that the research was conducted in the absence of any commercial or financial relationships that could be construed as a potential conflict of interest.
Publisher’s note
All claims expressed in this article are solely those of the authors and do not necessarily represent those of their affiliated organizations, or those of the publisher, the editors and the reviewers. Any product that may be evaluated in this article, or claim that may be made by its manufacturer, is not guaranteed or endorsed by the publisher.
References
Ahfir, N. D., Hammadi, A., Alem, A., Wang, H., Le Bras, G., and Ouahbi, T. (2017). Porous media grain size distribution and hydrodynamic forces effects on transport and deposition of suspended particles. J. Environ. Sci. 53 (3), 161–172. doi:10.1016/j.jes.2016.01.032
Ai-Awad, M. N. (2001). The mechanism of sand production caused by pore pressure fluctuations. Oil Gas Sci. Technol. 56 (4), 339–345. doi:10.2516/ogst:2001029
Akgiray, Ö., and Saatç, A. M. (2001). A new look at filter backwash hydraulics. Water Science and Technology: Water Supply 1 (2), 65–72.
Assef, Y., Arab, D., and Pourafshary, P. (2014). Application of nanofluid to control fines migration to improve the performance of low salinity water flooding and alkaline flooding. J. Petroleum Sci. Eng. 124, 331–340. doi:10.1016/j.petrol.2014.09.023
Bedrikovetsky, P., Marchesin, D., Shecaira, F., Souza, A., Milanez, P., and Rezende, E. (2001). Characterisation of deep bed filtration system from laboratory pressure drop measurements. J. Petroleum Sci. Eng. 32 (2), 167–177. doi:10.1016/s0920-4105(01)00159-0
Civan, F. (2016). Modified formulations of particle deposition and removal kinetics in saturated porous media. Transp. Porous Media 111 (1), 381–410. doi:10.1007/s11242-015-0600-z
Cundall, P. A., and Strack, O. D. L. (1979). A discrete numerical model for granular assemblies. Geotechnique 29 (1), 47–65. doi:10.1680/geot.1979.29.1.47
Elrahmani, A., Al-Raoush, R. I., Abugazia, H., and Seers, T. (2022). Pore-scale simulation of fine particles migration in porous media using coupled CFD-DEM. Powder Technol. 398, 117130. doi:10.1016/j.powtec.2022.117130
Guo, T. K., Luo, Z. L., Zhou, J., et al. (2022). Numerical simulation on proppant migration and placement within the rough and complex fractures. Petroleum Sci. 201, 117756. doi:10.1016/j.petsci.2022.04.010
Hanafy, A., Nasr-El-Din, H. A., and Heidari, Z. (2022). A novel method to assess stimulation of sandstone cores damaged by fines migration. SPE J. 27 (01), 682–704. doi:10.2118/206734-pa
Hanafy, A. M., and Nasr-El-Din, H. A. (2016). “NMR study to assess fines migration damage and its removal using regular mud acid in different sandstone cores,” in Abu Dhabi International Petroleum Exhibition and Conference, Abu Dhabi, 4-7 November 2024 (SPE).
Herzig, J. P., Leclerc, D. M., and Le Goff, P. (1970). Flow of suspensions through porous media—application to deep filtration. Industrial Eng. Chem. 62 (5), 8–35. doi:10.1021/ie50725a003
Huang, L., Liu, J., Zhang, F., Dontsov, E., and Damjanac, B. (2019). Exploring the influence of rock inherent heterogeneity and grain size on hydraulic fracturing using discrete element modeling. Int. J. Solids Struct. 176 (2), 207–220. doi:10.1016/j.ijsolstr.2019.06.018
Istchenko, C. M., and Gates, I. D. (2014). Well/wormhole model of cold heavy-oil production with sand. SPE J. 19 (2), 260–269. doi:10.2118/150633-pa
Itasca Consulting Group, Inc (2018). Particle flow code in 3 dimensions. Ver. 5.0 User manuals. Minneapolis, USA: Itasca.
Jung, J. W., Cao, S. C., Shin, Y. H., Al-Raoush, R. I., Alshibli, K., and Choi, J. W. (2018). A microfluidic pore model to study the migration of fine particles in single phase and multi-phase flows in porous media. Microsyst. Technol. 24 (2), 1071–1080. doi:10.1007/s00542-017-3462-1
Kamal, M. S., Mahmoud, M., Hanfi, M., Elkatatny, S., and Hussein, I. (2019). Clay minerals damage quantification in sandstone rocks using core flooding and NMR. J. Petroleum Explor. Prod. Technol. 9, 593–603. doi:10.1007/s13202-018-0507-7
Khan, H., Mirabolghasemi, M., Yang, H., Prodanović, M., DiCarlo, D. A., and Balhoff, M. T. (2017). Study of formation damage caused by retention of bi-dispersed particles using combined pore-scale simulations and particle flooding experiments. J. Petroleum Sci. Eng. 158 (2), 293–308. doi:10.1016/j.petrol.2017.08.061
Khilar, K., and Fogler, H. (1987). Colloidally induced fines migration in porous media. Rev. Chem. Eng. 4 (1-2), 41–108. doi:10.1515/revce.1987.4.1-2.41
Koyama, T., Li, B., Jiang, Y., and Jing, L. (2008). Numerical simulations for the effects of normal loading on particle transport in rock fractures during shear. Int. J. Rock Mech. Min. Sci. 45 (8), 1403–1419. doi:10.1016/j.ijrmms.2008.01.018
Kudrashou, V. Y., and Nasr-El-Din, H. A. (2023). Thermal oil recovery factors from sandpacks of variable mineralogy. Petroleum Res. 8, 481–489. doi:10.1016/j.ptlrs.2023.06.002
Lagasca, J., and Kovscek, A. (2014). Fines migration and compaction in diatomaceous rocks. J. Petroleum Sci. Eng. 122 (1), 108–118. doi:10.1016/j.petrol.2014.06.024
Miri, R., Haftani, M., and Nouri, A. (2021). A review of fines migration around Steam Assisted Gravity Drainage wellbores. J. Petroleum Sci. Eng. 108 (2), 198–205. doi:10.1016/j.petrol.2021.108868
Mondal, S., Wu, C., and Sharma, M. (2016). Coupled CFD-DEM simulation of hydrodynamic bridging at constrictions. Int. J. Multiph. Flow 84 (2), 245–263. doi:10.1016/j.ijmultiphaseflow.2016.05.001
Muneer, R., Hashmet, M. R., and Pourafshary, P. (2022). Predicting the critical salt concentrations of monovalent and divalent brines to initiate fines migration using DLVO modeling. J. Mol. Liq. 352, 118690. doi:10.1016/j.molliq.2022.118690
Payatakes, A., Tien, C., and Turian, R. (1974). Trajectory calculation of particle deposition in deep bed filtration: Part I. Model formulation. Aiche J. 20 (5), 889–900. doi:10.1002/aic.690200509
Payman, J., and Timo, H. (2015). Momentum transport between two granular phases of spherical particles with large size ratio: two-fluid model versus discrete element method. Powder Technol. 273 (2), 1–18. doi:10.1016/j.powtec.2014.12.026
Perrot, C., Panneton, R., and Olny, X. (2007). Computation of the dynamic thermal dissipation properties of porous media by Brownian motion simulation: application to an open-cell aluminum foam. J. Appl. Phys. 102 (7), 1–8. doi:10.1063/1.2786899
Poesio, P., and Ooms, G. (2004). Formation and ultrasonic removal of fouling particle structures in a natural porous material. J. Petroleum Sci. Eng. 45 (4), 159–178. doi:10.1016/j.petrol.2004.07.008
Potyondy, D., and Cundall, P. (2004). A bonded-particle model for rock. Int. J. Rock Mech. Min. Sci. 41 (1), 1329–1364. doi:10.1016/j.ijrmms.2004.09.011
Rosenbrand, E., Kjøller, C., Riis, J., Kets, F., and Fabricius, I. L. (2015). Different effects of temperature and salinity on permeability reduction by fines migration in Berea sandstone. Geothermics 53 (1), 225–235. doi:10.1016/j.geothermics.2014.06.004
Russell, T., Pham, D., Neishaboor, M., Badalyan, A., Behr, A., Genolet, L., et al. (2017). Effects of kaolinite in rocks on fines migration. J. Nat. Gas Sci. Eng. 45 (1), 243–255. doi:10.1016/j.jngse.2017.05.020
Sahan, T., Kuruneru, E. S., et al. (2018). Coupled CFD-DEM simulation of oscillatory particle-laden fluid flow through a porous metal foam heat exchanger: mitigation of particulate fouling. Chem. Eng. Sci. 179 (1), 1–12. doi:10.1016/j.ces.2018.01.0060
Song, W., and Kovscek, A. (2016). Direct visualization of pore-scale fines migration and formation damage during low-salinity waterflooding. J. Nat. Gas Sci. Eng. 34 (2), 1276–1283. doi:10.1016/j.jngse.2016.07.055
Sören, S., and Jürgen, T. (2012). Simulation of a filtration process by DEM and CFD. Int. J. Mech. Eng. Mechatronics 1 (2), 28–35. doi:10.11159/ijmem.2012.004
Valdes, J., and Santamarina, C. (2006). Particle clogging in radial flow: microscale mechanisms. SPE J. 11 (2), 193–198. doi:10.2118/88819-pa
Wang, C., Pallares, J., Haftani, M., et al. (2020). Developing a methodology to characterize formation damage (pore plugging) due to fines migration in sand control tests. J. Petroleum Sci. Eng. 186 (1), 106–112. doi:10.1016/j.petrol.2019.106793
Wang, X. G., Li, G. C., Nie, C. M., et al. (2005). “Integrated well completion strategies with CHOPS to enhance heavy oil production: a case study in Fula oil field,” in International thermal operations and heavy oil symposium (Calgary, Alberta: SPE).
Wang, Y., Almutairi, A., Bedrikovetsky, P., Timms, W. A., Privat, K. L., Bhattacharyya, S. K., et al. (2022). In-situ fines migration and grains redistribution induced by mineral reactions – implications for clogging during water injection in carbonate aquifers. J. Hydrology 614 (PA), 128533–128612. doi:10.1016/j.jhydrol.2022.128533
Wildenschild, D., Vaz, C., Rivers, M., Rikard, D., and Christensen, B. (2002). Using X-ray computed tomography in hydrology: systems, resolutions, and limitations. J. Hydrology 267 (3), 285–297. doi:10.1016/s0022-1694(02)00157-9
Wu, J. C., Fan, Y. R., Wu, F., and Lie, C. L. (2019). Combining large-sized model flow experiment and NMR measurement to investigate drilling induced formation damage in sandstone reservoir. J. Petroleum Sci. Eng. 176 (2), 85–96. doi:10.1016/j.petrol.2019.01.005
Yang, Y. L., FernandoAlexandre, D. S., Vaz, A. S., You, Z., and Bedrikovetsky, P. (2016b). Slow migration of detached fine particles over rock surface in porous media. J. Nat. Gas Sci. Eng. 34 (8), 1159–1173. doi:10.1016/j.jngse.2016.07.056
You, Z., Badalyan, A., and Bedrikovetsky, P. (2013). Size-exclusion colloidal transport in porous media-Stochastic modeling and experimental study. SPE J. 18 (2), 620–633. doi:10.2118/162941-pa
You, Z., Badalyan, A., Yang, Y., Bedrikovetsky, P., and Hand, M. (2019). Fines migration in geothermal reservoirs: laboratory and mathematical modelling. Geothermics 77 (1), 344–367. doi:10.1016/j.geothermics.2018.10.006
You, Z., Osipov, Y., Bedrikovetsky, P., and Kuzmina, L. (2014). Asymptotic model for deep bed filtration. Chem. Eng. J. 258 (1), 374–385. doi:10.1016/j.cej.2014.07.051
Yuan, B., Moghanloo, R., and Wang, W. (2018). Using nanofluids to control fines migration for oil recovery: nanofluids co-injection or nanofluids pre-flush? A comprehensive answer. Fuel 215 (2), 474–483. doi:10.1016/j.fuel.2017.11.088
Zhang, F., Damjanac, B., and Huang, H. (2013). Coupled discrete element modeling of fluid injection into dense granular media. J. Geophys. Res. Solid Earth 118 (6), 2703–2722. doi:10.1002/jgrb.50204
Zhang, F., Dontsov, E., and Mack, M. (2017). Fully coupled simulation of a hydraulic fracture interacting with natural fractures with a hybrid discrete-continuum method. Int. J. Numer. Anal. Methods Geomechanics 41 (13), 1430–1452. doi:10.1002/nag.2682
Zhang, F., Wang, T., Liu, F., Peng, M., Bate, B., and Wang, P. (2022). Hydro-mechanical coupled analysis of near-wellbore fines migration from unconsolidated reservoirs. Acta Geotech. 17 (8), 3535–3551. doi:10.1007/s11440-021-01396-2
Zhang, G., Gutierrez, M., and Li, M. (2017). A coupled CFD-DEM approach to model particle-fluid mixture transport between two parallel plates to improve understanding of proppant micromechanics in hydraulic fractures. Powder Technol. 308, 235–248. doi:10.1016/j.powtec.2016.11.055
Zheng, Y., Wang, H. Z., Li, Y. J., Tian, G. H., Yang, B., Zhao, C. M., et al. (2022). Effect of proppant pumping schedule on the proppant placement for supercritical CO2 fracturing. Petroleum Sci. 19 (2), 629–638. doi:10.1016/j.petsci.2021.11.002
Zhu, B., Tang, H., Wang, X., Zhao, F., and Yuan, X. (2019). Coupled CFD-DEM simulation of granular LCM bridging in a fracture. Part. Sci. Technol. 38, 371–380. doi:10.1080/02726351.2018.1547341
Zhu, B., Tang, H., Yin, Se, et al. (2021a). Experimental an d numerical investigations of particle plugging in fracture-vuggy reservoir: a case study. J. Petroleum Sci. Eng. 2021, 109610. doi:10.1016/j.petrol.2021.1096101
Zhu, G., Zhao, Y., Wang, Z., Khalid, M. S. U., and Liu, M. (2022). Semi-resolved CFD-DEM simulation of fine particle migration with heat transfer in heterogeneous porous media. Int. J. Heat Mass Transf. 197, 123349. doi:10.1016/j.ijheatmasstransfer.2022.123349
Keywords: fines migration, NMR, CFD-DEM, pore structure, fines plugging
Citation: Haoxuan T, Chunsheng J, Ziyi W, Hao L, Zhao W, Hongming T and Baiyu Z (2024) Evolution of pore structure during fines migration in sand pack: NMR experimental and numerical investigations. Front. Energy Res. 12:1399477. doi: 10.3389/fenrg.2024.1399477
Received: 12 March 2024; Accepted: 10 May 2024;
Published: 30 May 2024.
Edited by:
Yan Peng, China University of Petroleum, Beijing, ChinaReviewed by:
Yishan Liu, Research Institute of Petroleum Exploration and Development (RIPED), ChinaWeibing Tian, Tsinghua University, China
Copyright © 2024 Haoxuan, Chunsheng, Ziyi, Hao, Zhao, Hongming and Baiyu. This is an open-access article distributed under the terms of the Creative Commons Attribution License (CC BY). The use, distribution or reproduction in other forums is permitted, provided the original author(s) and the copyright owner(s) are credited and that the original publication in this journal is cited, in accordance with accepted academic practice. No use, distribution or reproduction is permitted which does not comply with these terms.
*Correspondence: Tang Haoxuan, 1044091131@qq.com; Jia Chunsheng, chshjia@263.net