UHVDC transmission line diagnosis method for integrated community energy system based on wavelet analysis
 Tianlong Yuan
 Jinguang Liang1,2*
 - 1Liaoning Provincial Key Laboratory of Energy Storage and Utilization, Yingkou Institute of Technology, Yingkou, China
- 2Mechanical and Power Engineering College, Yingkou Institute of Technology, Yingkou, China
- 3State Grid Yingkou Electric Power Supply Company, Yingkou, China
With the large-scale development of renewable energy power, China has faced with the challenges of the reverse regional distribution of wind and solar resources and power load, as well as the intermittency and randomness of renewable energy power. Therefore, China is vigorously developing ultra-high voltage direct current (UHVDC) transmission technology to solve the problem of insufficient flexibility caused by the uncertainty of renewable energy and the fluctuation of multi-energy loads in integrated community energy systems. UHVDC plays an increasingly pivotal role in the west-east transmission system in China’s power system due to its high transmission capacity and long transmission distance. Once the fault occurs in the ultra-high voltage direct (UHVD) transmission line, quick and accurate fault location identification is of great significance. Hence, this paper proposes a UHVDC transmission line diagnosis method based on wavelet analysis for integrated community energy systems. Wavelet transform (WT) is used to decompose the transient signal on a multi-scale, and then power systems computer-aided design (PSCAD) software is utilized for simulation calculation to obtain the singular spectrum entropy of each layer and facilitate wavelet transformations for signal denoising with advanced tools such as MATLAB. The prediction results can distinguish outside the rectification side fault, within the rectification side fault, and outside the inverter fault with an accuracy of 100%. A large number of simulations demonstrate that combining singular spectrum entropy with support vector machines (SVM) has emerged as a robust technique for integrated community energy systems, suggesting its potential as a standard method in UHVDC transmission line diagnosis. This study is of significant reference for realizing the complementarity of multiple types of power supply and ensuring a reliable power supply.
1 Introduction
As global energy demand rises and the public’s awareness of environmental protection increases, there is a growing demand for clean energy sources. China’s energy resource centers and load centers are distributed in the reverse direction, and the energy flow is in the pattern of “sending coal from the west to the east and from the north to the south” as well as “sending electricity from the west to the east and electricity from the north to the south.” China’s wind and solar energy resources have great potential for development, with the most abundant distribution in the northwest, Xinjiang, and Inner Mongolia regions. Although these regions have abundant wind and solar resources, the load power is low due to factors such as productivity and population, which is exactly the opposite of the central and eastern regions, leading to serious wind and solar abandonment in the northwest region (Zhou, 2019). In the future, China’s energy production centers are expected to move west and north, while the gravity center of demand may remain in the central and eastern regions for a long time, and the scale and distance of energy flow will further increase. For future large-scale access to new energy under the conditions of a large-capacity “west to east” scenario, there is a need to plan ahead with the appropriate transmission mode (Pan et al., 2016; Ding et al., 2021), posing higher requirements for electric energy transmission technology. Among various energy transmission methods, UHVDC technology has played an increasingly important role in power transmission and has well solved the problem of unbalanced distribution between energy centers and load centers due to its advantages of large transmission power, low line cost, and good control performance (Wang et al., 2007; Muzzammel, 2020). From an economic point of view, UHVDC is more suitable for long-distance power supply; the longer the distance, the higher the economy. From the existing UHV lines in our country, UHVDC transmission is generally chosen for ultra long-distance power transmission. The main way to fully implement the new national energy development plan is to transmit wind and photovoltaic power from large energy bases in the “Three Northern Regions” to the eastern and central load centers through the UHVDC transmission system.
Numerous studies have been dedicated to efficiently accommodating excess renewable generation, reducing renewable curtailment, and improving overall energy efficiency. According to the development research of the State Grid, clean energy, such as wind power located in the energy base of North China (including western Inner Mongolia), can be transmitted through UHVDC systems. Similarly, clean energy from energy bases in the northeast and northwest (including Xinjiang) regions can only be transported through UHVDC systems (Zhen et al., 2008; Shu et al., 2012). Ma et al. (2018) and Wang L. et al. (2018) established an planning model to minimize investment, construction, and operating costs. Zeng et al. (2018) studied methods for handling multiple uncertainties in the programming models. Zhou et al. (2020) studied the planning method based on maximum utilization hours and established to minimize construction and operating costs throughout the entire cycle. However, the above studies have overlooked the complex geographical environment along the UHVDC transmission line. The fault rate of the transmission line is high in the event of extreme events, making it difficult to ensure continuous energy supply to important users and rapid recovery from faults, which compromises the safety and reliability of the direct current transmission systems (Meghwani et al., 2017). Therefore, the protection of UHV transmission lines becomes paramount, highlighting the importance of fast and accurate fault diagnosis for the safe and stable operation of the UHVDC transmission systems. Based on this phenomenon, Niazy and Sadeh (2013), Singh Brains et al. (2017), Wang Y. et al. (2018), and Shu et al. (2020) conducted certain research. At present, transient protection utilizing the boundary to the attenuation characteristics of high-frequency quantities is the development direction of UHVDC transmission line protection. Studies by Yong et al. (2009), Yan et al. (2017), Sheng et al. (2019), and Muzzammel, (2020) have made significant progress in this realm. However, these studies overlook the complex regional environment along UHVDC transmission lines. In the case of extreme events, it is difficult to ensure the continuous energy supply to important users and the rapid recovery of faults due to the high transmission line failure rate seriously affecting the safety and reliability of the HVDC transmission system.
Support Vector Machines (SVM) is a machine learning method based on statistical learning developed in the 1990s (Bauer et al., 2011), aimed at classifying samples by finding an optimal classification hyperplane between them (Xue et al., 2015). Given that SVM is a superior statistical learning method known for recognizing patterns in small sample data, the objective of distinguishing fault types is achieved through training and testing the sample sets (Shu et al., 2010; Liu and Chen, 2017; Wang C. et al., 2018; Zhen et al., 2019). Zhu et al. (2011) introduced a new identification method combining SVM and multi-resolution singular spectral entropy to address the problem of classifying islanding and grid interference. Considering the practical difficulty in obtaining a large number of typical samples of UHVDC line boundary and fault transient signals, the combination of multi-resolution singular spectrum entropy and support vector machine is applied to the problem of fault identification inside and outside the UHVDC line transient protection. This approach demonstrates the effectiveness in classifying fault categories with minimal sample data, yielding the desired outcomes (Adly et al., 2020; Chen et al., 2020). Hence, this study mainly proposes a transient protection method for UHVDC lines based on SVM and multi-resolution singular spectrum entropy. Section 2 provides a brief overview of the methodology designed in the study. Section 3 discusses the modeling of verification. Section 4 elaborates on the analysis of frequency domain waveform and singular spectral entropy to classify signals in three different positions. Finally, Section 5 concludes key insights derived from this study.
2 Methodology
2.1 Singular spectral entropy
Singular spectrum analysis represents an effective time-domain analysis method that transforms the embedding space into an equivalent orthogonal coordinate system. This transformation facilitates obtaining signal trajectories in the subspace with the minimum embedding dimension, thereby eliminating linear dependencies and artificial symmetry between delay coordinates. As a result, this process enhances the signal-to-noise ratio and sharpens signal singularity. However, as a time-domain analysis method, traditional singular spectrum analysis is not conducive to multi-scale monitoring of signal singularity and fault localization. Thus, the multi-resolution singular spectrum entropy combines the idea of multi-resolution analysis and information entropy to characterize the singular state of signal energy distribution and the probability of geometric feature distribution at different scales (Wu et al., 2012).
2.1.1 Wavelet singular spectral entropy extraction
1) A discrete sampling sequence
where
In addition,
2) Perform wavelet reconstruction on each decomposed layer of the signal. Suppose only the wavelet coefficients of a certain frequency band are retained and the wavelet coefficients of other frequency bands are set to 0. In that case, a singular spectrum analysis of the reconstructed time-domain signal is performed. The reconstruction formula is in Eq. 2.
where
3) Set on layer
Among them, the element of
4) Perform singular value decomposition on each layer of matrix
where
2.1.2 Wavelet singular spectrum entropy eigenvector extraction
Specific steps of feature vector extraction:
1) Perform WT on the selected voltage signal for analysis, use phase space reconstruction, equivalently exchange the embedding space into an orthogonal coordinate system, and construct a
2) Perform singular value decomposition of matrix
3) Perform singular spectral entropy operation on the singular values of each layer, combine the singular spectral entropy values of each layer, and obtain the eigenvector
where
2.2 Support vector machines (SVM)
The singular spectral entropy value of the transient signal at the initial moment of a fault in a DC transmission line can reflect the information regarding the fault in the UHVDC transmission line. However, the values are all less than 1. Therefore, due to the presence of abnormal data and a limited number of faults, along with a small number of training samples, it is proposed to use the singular spectral entropy as the input for the SVM classification model to determine the type of fault.
The learning strategy of SVM is to find the optimal hyperplane, maximizing the interval between hyperplanes and transforming it into a convex quadratic problem. Nonlinear mapping is used to map the sample space to a high-dimensional feature space, and linear learning machines are applied in the feature space to solve nonlinear classification and regression problems in the sample space (Zhang et al., 2020). Figure 1 shows the network structure of the SVM, with the detailed definitions of variables and functions provided in the following text.
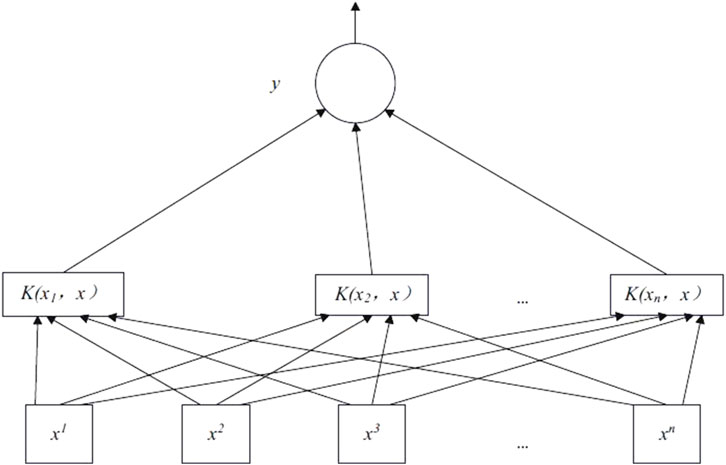
Figure 1. Network structure of SVM.
2.2.1 Principles of SVM
For a non-linear separable sample set, introducing the relaxation variable (
where
where indicates that
2.2.2 Selection of kernel function and parameter optimization methods
This paper uses the Gauss kernel function, whose formula is in Eq. 10:
where
The bilinear search method and grid search method are methods used to determine the SVM classifier. Unlike the bilinear search method, the grid search method offers the advantage of parallel SVM training for
2.3 Failure diagnosis method
Tang et al. (2013), Wang et al. (2015), and Abdullah (2017) analyzed the attenuation characteristics of UHVDC transmission lines and their boundaries for high-frequency quantities of fault transient signals. According to the attenuation characteristics of the fault transient signal caused by the lines and their boundaries, wavelet decomposition applied to the fault signals in three different positions, including outside the rectification side, within the rectification side, and outside the inverter side to obtain different reconstructed high-frequency coefficient amplitudes (Verrax et al., 2020; Mohammadi et al., 2021). Subsequently, phase space reconstruction is performed on the high-frequency coefficients of each layer, followed by singular value decomposition on the phase space of each layer to obtain singular values of different sizes (Song et al., 2011; Metidji et al., 2013; Xiang et al., 2018).
Since the magnitude of singular values reflects the differences between various fault states, singular spectral entropy can quantitatively describe the degree of change (Li C. et al., 2018; Li Y. et al., 2018; Li and Chen, 2019). Singular spectral entropy serves as a reflection of the uncertainty of signal energy. The simpler the signal component, the smaller the singular spectral entropy value, indicating more concentrated signal energy. Conversely, the more complex the signal components, the larger the singular spectral entropy value, indicating that the energy is more dispersed, and the signal is more evenly distributed throughout the entire frequency component (Moreno et al., 2014; Wang and Zheng, 2014).
Therefore, the singular spectral entropy of the fault signal at different decomposition levels is calculated, and then the fault signal is diagnosed through the singular spectral entropy (Xing et al., 2016). Singular spectral entropy can be used to reflect the different changes in fault signals at three different locations, including outside the rectification side, within the rectification side, and outside the inverter side after boundary and line attenuation.
3 Simulation verification
The simulation model is established based on the actual parameters of the Yunguang ±800 kV UHVDC transmission system. For training, 3 external grounding faults are considered on the rectifier side, 3 external grounding faults on the inverter side, and 9 internal grounding faults. The training set is shown in Table 1. For testing, 3 external grounding faults on the rectifier side, 3 external grounding faults on the inverter side, and 9 internal grounding faults are used. The testing set is shown in Table 2, and the identification results of the grounding fault are shown in Table 3.
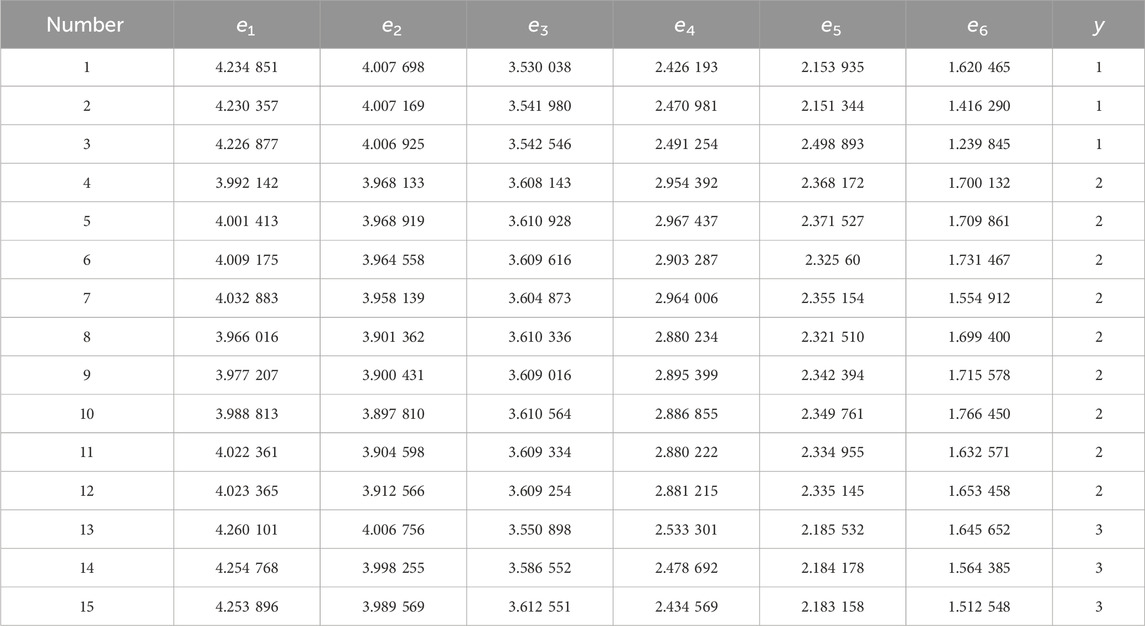
Table 1. Training set of line short circuit.
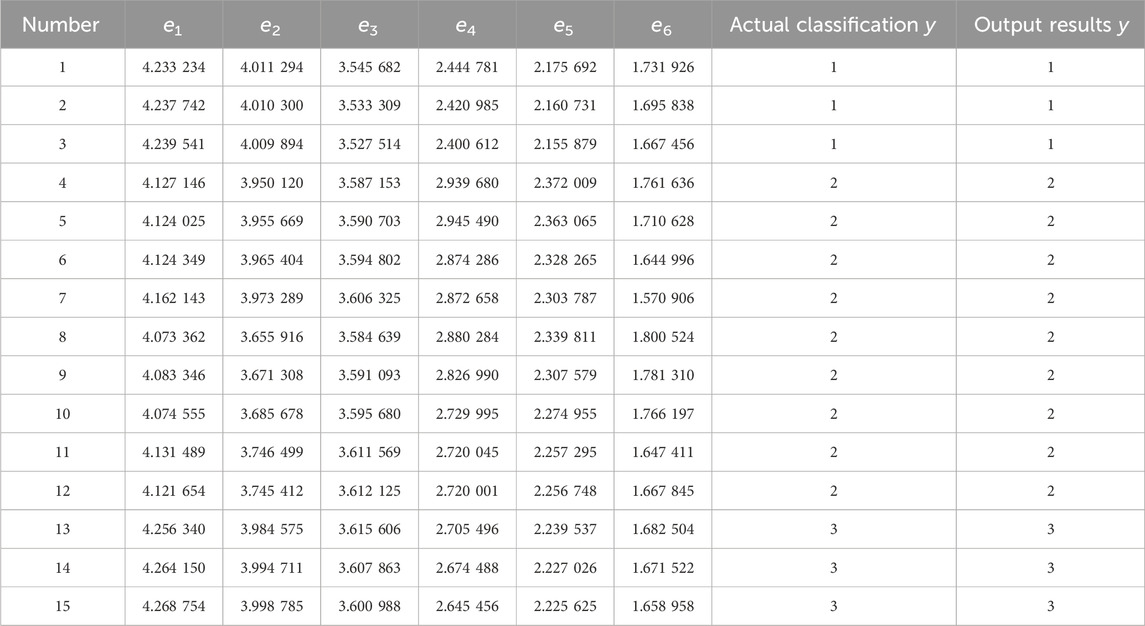
Table 2. Testing set of line short circuit.
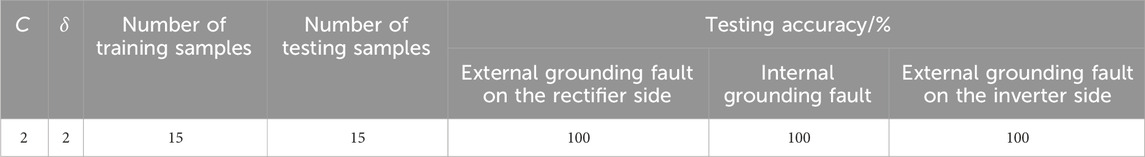
Table 3. Identification results.
As can be seen in Table 6, electing appropriate C and
When
4 Results and discussions
4.1 Frequency domain waveform analysis
This paper uses PSCAD to establish a model, with a sampling frequency of 40 kHz, a sampling time of 0.05 s, and a total of 2000 sampling points. The WT uses the db4 wavelet with a decomposition level of 6.
The reconstructed waveform of the high-frequency coefficients obtained from the WT reflecting ground faults at three different locations, outside the rectification side, within the rectification side, and outside the inverter side, is shown in Figures 2–4.
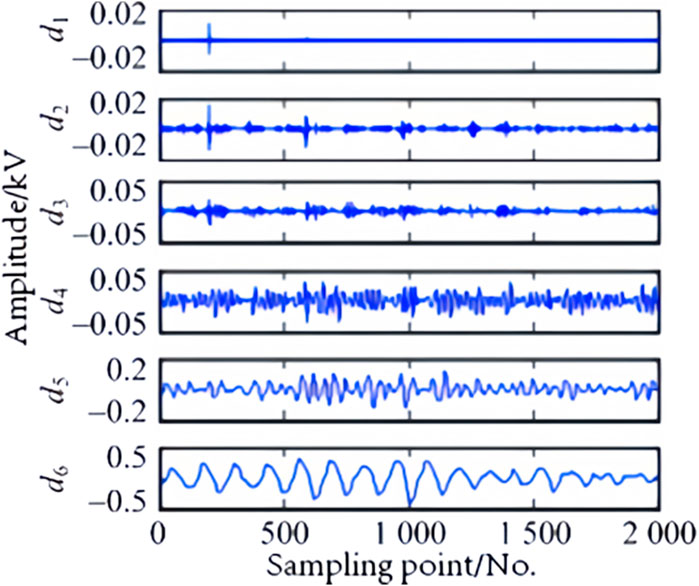
Figure 2. The external grounding fault and line short circuit on the rectifier side in the frequency domain.
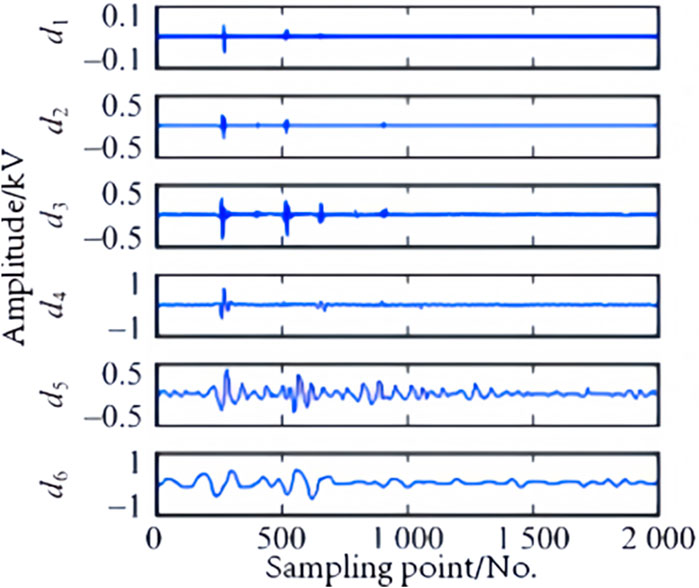
Figure 3. The internal grounding fault and line short circuit in the frequency domain.
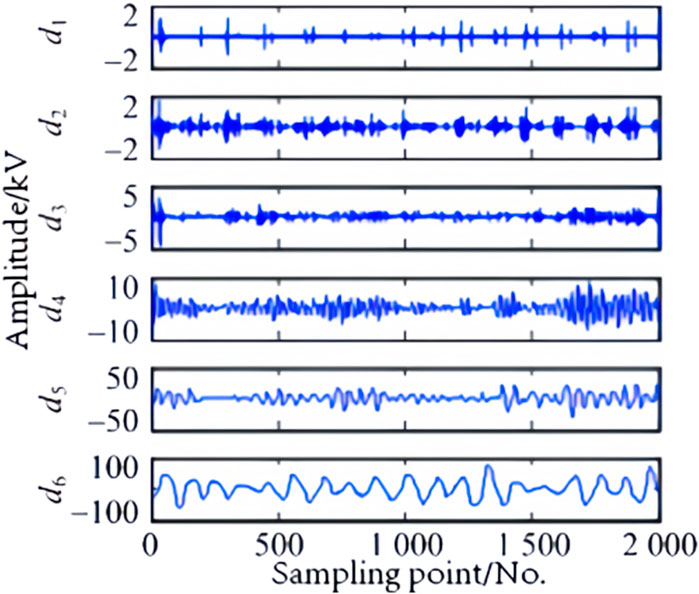
Figure 4. The external grounding fault and line short circuit on the inverter side in the frequency domain.
It can be seen from the waveform that the waveform changes of fault information at different positions are noticeable in the frequency domain, and the amplitude in the high-frequency range also varies.
4.2 Singular spectral entropy analysis
Three different fault signals, namely, external ground fault on the rectification side, internal ground fault, and external ground fault on the inverter side, are decomposed at three scales, and the wavelet singular spectral entropy is computed for each layer to form a feature vector. Three sets of characteristic vectors are taken for the external ground fault signals on the rectifier side, internal ground fault signals, and external ground fault signals on the inverter side, as listed in Table 4.
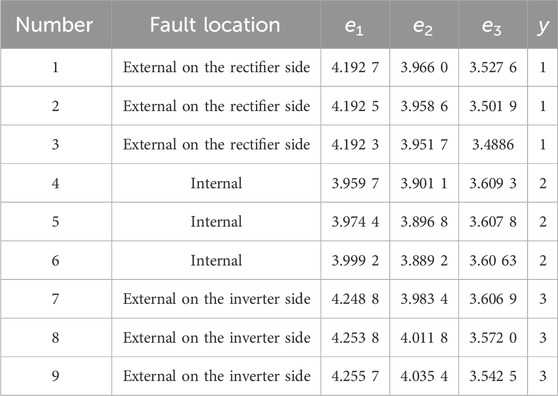
Table 4. Feature vectors of three different locations.
The
According to the presented data in Table 4, in the low frequency band
In addition, Table 4 demonstrates the relative stability of wavelet singular spectral entropy for fault information at the same location. Therefore, this study uses the singular spectral entropy of faults outside the rectification side, within the rectification side, and outside the inverter side as input variables for SVM to classify faults.
4.3 SVM fault recognition algorithm
SVM algorithm process:
1) Perform wavelet multi-resolution decomposition on the fault signals at three different positions to obtain the corresponding reconstructed high-frequency coefficients;
2) Calculate the singular spectral entropy of the wavelet reconstruction coefficients of the fault signals at three different positions to obtain the feature vectors;
3) Utilize a portion of the feature vectors as the training set and apply the grid search method to determine the SVM classifier parameter
4) Input the remaining part of the feature vector as the test set into the SVM classifier for testing and obtaining the classification results.
The SVM algorithm process is shown in Figure 5.
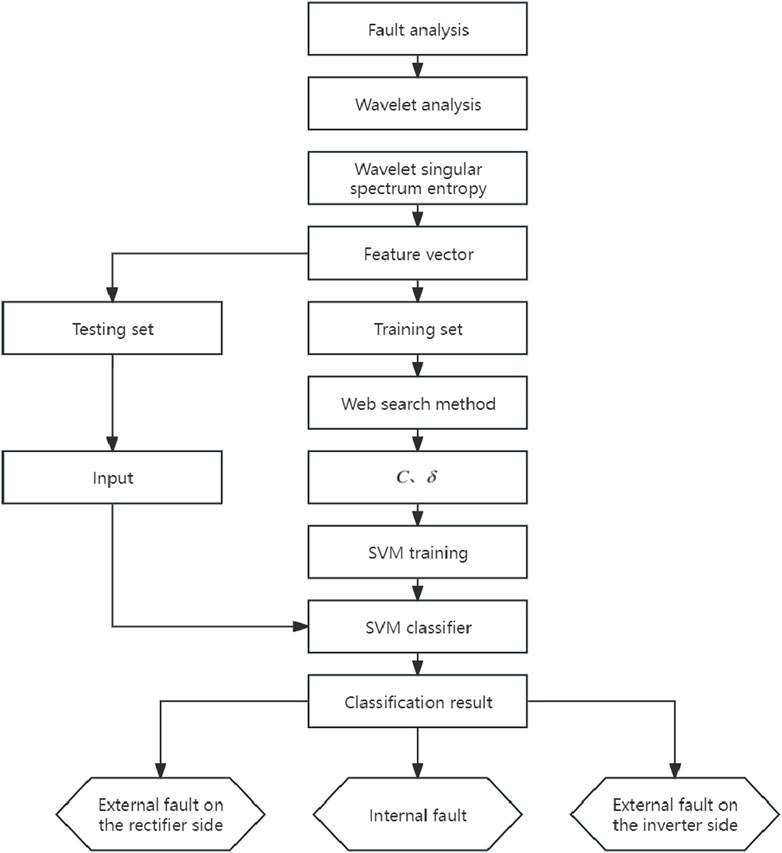
Figure 5. Flow chart of SVM algorithm.
The nine samples in Table 4 are employed as a training set, and the parameters
Then, three groups of feature vectors are selected to form a testing set and input to the SVM for testing. The test set samples are shown in Table 5.
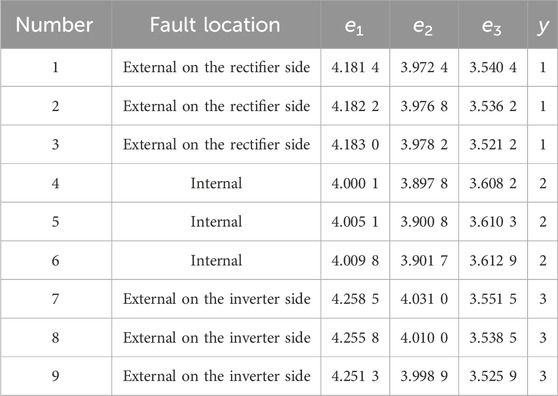
Table 5. Testing set of three different locations.
The testing set is tested in Table 5, and the following results are obtained:
1) When
2) When
3) When
4) When
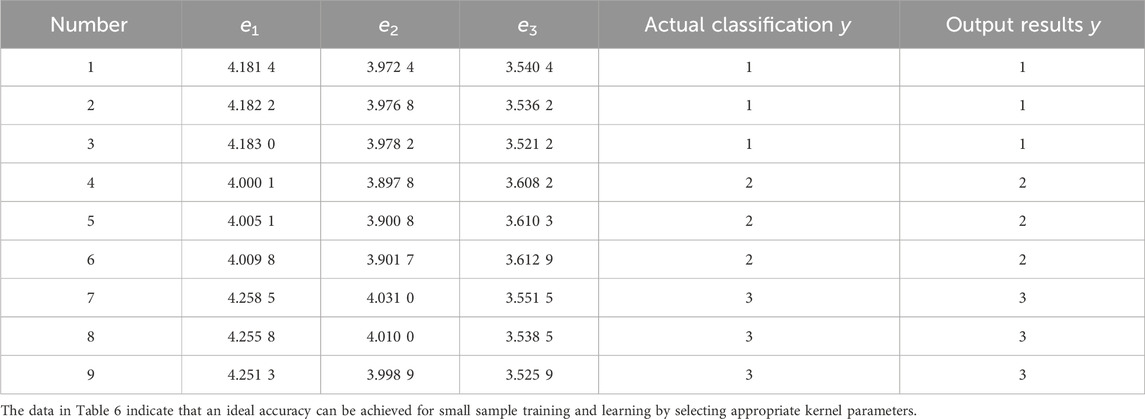
Table 6. SVM diagnosis of three different locations.
When
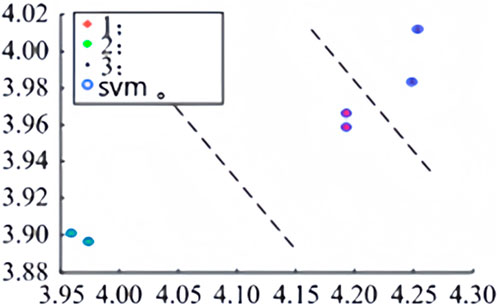
Figure 6. SVM classification diagram. +1━The external fault on the rectifier side; *2━The internal grounding faults;·3━The external grounding faults on the inverter side; 4━SVM.
As can be seen from the SVM diagnosis results in Table 6 and the SVM classification diagram in Figure 6, the trained SVM classifier parameters can correctly classify the grounding fault signals in three different positions.
5 Conclusion
This study presented a fault diagnosis method for UHVDC transmission lines in a regional integrated energy system, establishing an accurate mathematical model and making a multi-scale analysis of fault signals using wavelet analysis. Then, the method for fault identification inside and outside the UHVDC line area using a multi-resolution singular spectrum entropy and SVM was proposed by analyzing the UHVDC transmission line boundary and the attenuation effect of lines on the high-frequency of fault transient signals. For this purpose, MATLAB software was utilized to facilitate wavelet transformations for signal denoising and various machine learning techniques for predictive modeling. Compared with the traditional artificial neural network, the revealed mathematical model offers the advantages of fewer training samples, shorter training time, less overfitting, and higher recognition accuracy.
This study revealed the fault diagnosis method for UHVDC transmission lines within a regional integrated energy system. The fault identification problem of transient protection for UHVDC transmission lines inside and outside the region was transformed into a pattern classification problem. As a result, the sample identification accuracy improved from 13.3% to 100% by establishing a mathematical model and selecting a suitable SVM classifier parameter. Thus, the external fault on the rectifier side, the internal fault, and the external fault on the inverter side could be distinguished at the same time, and automation in the whole classification process could be realized. Given the challenges of acquiring a large number of typical samples of UHVDC line boundary and fault transient signals of the line, the combination of multi-resolution singular spectrum entropy and SVM was applied to the problem of fault identification inside and outside the UHVDC line transient protection. With only small sample data, the fault categories could be effectively classified, and the expected results could be achieved. The accuracy reached 100%, indicating the correctness and effectiveness of the method. This study not only makes a great contribution to the fault diagnosis of UHVDC transmission lines in regional integrated energy systems but also lays a new theoretical foundation for the fault diagnosis of other regional integrated energy systems in the process of energy signal transmission.
Data availability statement
The original contributions presented in the study are included in the article/supplementary material, further inquiries can be directed to the corresponding authors.
Author contributions
TY: Conceptualization, Investigation, Methodology, Resources, Software, Validation, Writing–original draft, Writing–review and editing. JL: Conceptualization, Data curation, Methodology, Writing–original draft, Writing–review and editing. XZ: Investigation, Methodology, Writing–original draft, Writing–review and editing. KL: Investigation, Writing–original draft, Writing–review and editing. LF: Software, Writing–original draft, Writing–review and editing. ZD: Validation, Writing–original draft, Writing–review and editing.
Funding
The author(s) declare that financial support was received for the research, authorship, and/or publication of this article. The author(s) declare that financial support was received for the research, authorship, and/or publication of this article. The authors gratefully acknowledge funding from the Foundation of Liaoning Provincial Key Laboratory of Energy Storage and Utilization (Grant No.CNNK202318) and the Natural Science Foundation of Liaoning Province of China (Grant No. 2023-MSLH-314).
Acknowledgments
The authors would like to acknowledge State Grid Yingkou Electric Power Supply Company for providing experimental data.
Conflict of interest
Author XZ was employed by the company State Grid Yingkou Electric Power Supply Company.
The remaining authors declare that the research was conducted in the absence of any commercial or financial relationships that could be construed as a potential conflict of interest.
Publisher’s note
All claims expressed in this article are solely those of the authors and do not necessarily represent those of their affiliated organizations, or those of the publisher, the editors and the reviewers. Any product that may be evaluated in this article, or claim that may be made by its manufacturer, is not guaranteed or endorsed by the publisher.
References
Abdullah, A. (2017). Ultrafast transmission line fault detection using a dwt based ann. IEEE Trans. Industry Appl. 54 (99), 1182–1193. doi:10.1109/TIA.2017.2774202
Adly, A. R., Aleem, S. H. E. A., Algabalawy, M. A., Jurado, F., and Ali, Z. M. (2020). A novel protection scheme for multi-terminal transmission lines based on wavelet transform. Electr. Power Syst. Res. 183, 106286. doi:10.1016/j.epsr.2020.106286
Bauer, S., Nolte, L. P., and Reyes, M. (2011). Fully automatic segmentation of brain tumor images using support vector machine classification in combination with hierarchical conditional random field regularization. Springer Berlin Heidelberg. doi:10.1007/978-3-642-23626-6_44
Chen, X., Li, H., Liang, Y., and Wang, G. (2020). A protection scheme for hybrid multi-terminal hvdc networks utilizing a time-domain transient voltage based on fault-blocking converters. Int. J. Electr. Power and Energy Syst. 118, 105825. doi:10.1016/j.ijepes.2020.105825
Ding, J., Fang, X. S., Song, Y. T., Zheng, C., Tang, X. J., and Yao, W. (2021). Conception of electricity and hydrogen integrated energy network for renewableenergy transmission in western China under background of carbon neutralization. Automation Electr. Power Syst. 45 (24), 1–9. doi:10.7500/AEPS20210211002
Li, C., Gole, A. M., and Zhao, C. (2018a). A fast dc fault detection method using dc reactor voltages in hvdc grids. IEEE Trans. Power Deliv. 33, 2254–2264. doi:10.1109/TPWRD.2018.2825779
Li, S. L., Chen, W., Yin, X., Chen, D., and Teng, Y. (2019). A novel integrated protection for VSC-HVDC transmission line based on current limiting reactor power. IEEE Trans. Power Deliv. 35 (1), 226–233. doi:10.1109/TPWRD.2019.2945412
Li, Y., Wu, L., Li, J., Xiong, L., Zhang, X., Song, G., et al. (2018b). Dc fault detection in meshed mtdc systems based on transient average value of current. IEEE Trans. Power Deliv. 67, 1932–1943. doi:10.1109/TIE.2019.2907499
Liu, F., and Chen, H. (2017). Fault diagnosis of commutation failure based on wavelet packet decomposition and generalized regression neural network. Automation Instrum. 6, 22–25. doi:10.14016/j.cnki.1001-9227.2017.06.022
Ma, X. Y., Guo, X. B., and Lei, J. Y. (2018). Capacity planning method of distributed PV and P2G in muti-energy coupled system. Automation Electr. Power Syst. 42, 55–63. doi:10.7500/AEPS20170602002
Meghwani, A., Srivastava, S. C., and Chakrabarti, S. (2017). A non-unit protection scheme for dc microgrid based on local measurements. IEEE Trans. Power Deliv. 32 (1), 172–181. doi:10.1109/TPWRD.2016.2555844
Metidji, B., Taib, N., Baghli, L., Rekioua, T., and Bacha, S. (2013). Phase current reconstruction using a single current sensor of three-phase AC motors fed by SVM-controlled direct matrix converters. IEEE Trans. Industrial Electron. 60 (12), 5497–5505. doi:10.1109/TIE.2012.2232252
Mohammadi, F., Rouzbehi, K., Hajian, M., Niayesh, K., Gharehpetian, G. B., Saad, H., et al. (2021). Hvdc circuit breakers: a comprehensive review. IEEE Trans. Power Electron. 36 (36-12), 13726–13739. doi:10.1109/TPEL.2021.3073895
Moreno, R., Visairo, N., Nunez, C., and Rodriguez, E. (2014). A novel algorithm for voltage transient detection and isolation for power quality monitoring. Electr. Power Syst. Res. 114 (SEP), 110–117. doi:10.1016/j.epsr.2014.04.009
Muzzammel, R. (2020). Restricted Boltzmann machines based fault estimation in multi terminal HVDC transmission system, 772, 790. doi:10.1007/978-981-15-5232-8_66
Niazy, I., and Sadeh, J. (2013). A new single ended fault location algorithm for combined transmission line considering fault clearing transients without using line parameters. Int. J. Electr. Power and Energy Syst. 44 (1), 816–823. doi:10.1016/j.ijepes.2012.08.007
Pan, Y., Yin, X. G., Hu, J. B., He, J. J., et al. (2016). Centralized exploitation and large-scale delivery of wind and solar energies in west China based on flexible DC grid. Power Syst. Technol. 40 (12), 3621–3629. doi:10.13335/j.1000-3673.pst.2016.12.001
Sheng, L., Chen, M., and Chen, D. (2019). A novel hvdc double-terminal non-synchronous fault location method based on convolutional neural network. IEEE Trans. Power Deliv. 34 (3), 848–857. doi:10.1109/TPWRD.2019.2901594
Shu, H., Han, Y., Huang, R., and Zhang, Y. (2020). Fault model and travelling wave matching based single terminal fault location algorithm for t-connection transmission line: a yunnan power grid study. Energies, 13 (6). doi:10.3390/en13061506
Shu, H., Tian, X., and Dai, Y. (2010). The identification of internal and external faults for and#x00B1;800kV UHVDC transmission line based on S-transform of the polarity wave. Image and Signal Process. Int. Congr.7, 3060–3063. doi:10.1109/CISP.2010.5646181
Shu, H. C., Zhang, B., Zhang, G. B., and Duan, R. M. (2012). Identification of lightning disturbance in uhvdc transmission lines using correlation degree based on short time window data. Adv. Mater. Res. 433-440, 3787–3791. doi:10.4028/www.scientific.net/AMR.433-440.3787
Singh Bains, T. P., Sidhu, T. S., Xu, Z., Voloh, I., and Dadash Zadeh, M. R. (2017). Impedance-based fault location algorithm for ground faults in series capacitor compensated transmission lines. IEEE Trans. Power Deliv. 33, 189–199. doi:10.1109/TPWRD.2017.2711358
Song, G. B., Cai, X. L., Gao, S. P., Suo, N. J. L., and Yang, Z. L. (2011). New pilot protection for vsc-hvdc transmission lines using natural frequency characteristic of current. Gaodianya Jishu/High Volt. Eng. 37 (8), 1989–1996. doi:10.1016/B978-0-444-53599-3.10005-8
Tang, G., Luo, X., and Wei, X. (2013). Multi-terminal hvdc and dc-grid technology. Proceedings of the CSEE 33 (10), 8–17.
Verrax, P., Bertinato, A., Kieffer, M., and Raison, B. (2020). Transient-based fault identification algorithm using parametric models for meshed hvdc grids. Electr. Power Syst. Res. 185, 106387. doi:10.1016/j.epsr.2020.106387
Wang, C., Wang, Z., Wang, J., and Zhao, D. (2018). Svm-based parameter identification for composite zip and electronic load modeling. IEEE Trans. Power Syst. 34 (1), 182–193. doi:10.1109/TPWRS.2018.2865966
Wang, G., Li, Z. K., and Li, H. F. (2007). Transient based protection for ±800kV UHVDC transmission lines. Automation Electr. Power Syst. 31 (21), 40–43. doi:10.1002/jrs.1570
Wang, L., Li, X., Li, K., Hu, Y., and Huang, R. (2015). Research of pseudo bipolar lcc-vsc hybrid hvdc system supplying passive network. Power Syst. Prot. Control.
Wang, L., Liu, H., Dai, L. V., and Liu, Y. W. (2018). Novel method for identifying fault location of mixed lines. Energies 11 (6), 1529–1547. doi:10.3390/en11061529
Wang, X., and Zheng, Y. (2014). Vibration fault diagnosis for wind turbine based on enhanced supervised locally linear embedding. Adv. Mater. Res. 1008-1009, 983–987. doi:10.4028/www.scientific.net/AMR.1008-1009.983
Wang, Y., Zhang, N., Zhuo, Z. Y., Kang, C., and Kirschen, D. (2018). Mixed-integer linear programming-based optimal configuration planning for energy hub: starting from scratch. Appl. Energy 210, 1141–1150. doi:10.1016/j.apenergy.2017.08.114
Wu, S. D., Wu, P. H., Wu, C. W., Ding, J. J., and Wang, C. C. (2012). Bearing fault diagnosis based on multiscale permutation entropy and support vector machine. Entropy 14 (8), 1343–1356. doi:10.3390/e14081343
Xiang, W., Yang, S., Xu, L., Zhang, J., Lin, W., and Wen, J. (2018). A transient voltage based dc fault line protection scheme for mmc based dc grid embedding dc breakers. IEEE Trans. Power Deliv. 34, 334–345. doi:10.1109/tpwrd.2018.2874817
Xing, L., Yang, D., Zhang, D., Li, W., and Chen, Q. (2016). Fault transient simulation analysis for hvdc transmission lines. IEEE. doi:10.1109/DRPT.2015.7432248
Xue, H., Zhang, K., Li, B., and Peng, C. (2015). Fault diagnosis of transformer based on the cuckoo search and support vector machine. Dianli Xit. Baohu yu Kongzhi/Power Syst. Prot. Control 43 (8), 8–13.
Yan, Y., Sheng, G., Qiu, R. C., and Jiang, X. (2017). Big data modeling and analysis for power transmission equipment: a novel random matrix theoretical approach. IEEE Access 6, 7148–7156. doi:10.1109/ACCESS.2017.2784841
Yong, J., Zheng-You, H. E., and Jing, Z. (2009). A method to identify voltage sag sources in distribution network based on wavelet entropy and probability neural network. Power Syst. Technol. 33 (16), 63–69. doi:10.1016/j.apm.2007.10.019
Zeng, X. Q., Zhang, J. W., and Wang, X. L. (2023). Optimal configuration of regional integrated energy system taking into account multiple uncertainties and the participation of concentrating solar power stations. High. Volt. Eng. 49 (1), 353–363. doi:10.13336/j.1003-6520.hve.20211326
Zhang, X., Han, P., Xu, L., Zhang, F., and Gao, L. (2020). Research on bearing fault diagnosis of wind turbine gearbox based on 1DCNN-PSO-SVM turbine gearbox based on 1dcnn-pso-svm. IEEE Access 8, 192248–192258. doi:10.1109/ACCESS.2020.3032719
Zhen, Y., Yang, J., and Zhang, B. (2019). Study on numerical sampling stability of traveling wave protection based on wavelet transform. Power Syst. Prot. Control 47 (9), 42–48. doi:10.7667/PSPC180633
Zhen, Y. L., Yin, B. S., Wen, L. Z., and Yun, Z. Z. (2008). Study on voltage class series for hvdc transmission system. Proc. CSEE. doi:10.13334/j.0258-8013.pcsee.2008.10.001
Zhou, C. C., Ma, X. Y., Guo, Z. G., Hu, Y., et al. (2020). User-level integrated energy system planning for engineering applications. Trans. China Electrotech. Soc. 35 (13), 2843–2854. doi:10.19595/j.cnki.1000-6753.tces.191056
Keywords: integrated community energy system, wavelet analysis, UHVDC power transmission, singular spectrum entropy, support vector machines, characteristic vector
Citation: Yuan T, Liang J, Zhang X, Liang K, Feng L and Dong Z (2024) UHVDC transmission line diagnosis method for integrated community energy system based on wavelet analysis. Front. Energy Res. 12:1401285. doi: 10.3389/fenrg.2024.1401285
Received: 15 March 2024; Accepted: 11 April 2024;
Published: 10 May 2024.
Edited by:
Xiaochen Hou, Shandong University of Technology, ChinaReviewed by:
Fubin Yang, Beijing University of Technology, ChinaYonghong Xu, Beijing University of Technology, China
Genyu Xu, Yunnan University, China
Copyright © 2024 Yuan, Liang, Zhang, Liang, Feng and Dong. This is an open-access article distributed under the terms of the Creative Commons Attribution License (CC BY). The use, distribution or reproduction in other forums is permitted, provided the original author(s) and the copyright owner(s) are credited and that the original publication in this journal is cited, in accordance with accepted academic practice. No use, distribution or reproduction is permitted which does not comply with these terms.
*Correspondence: Jinguang Liang, liangjingunag@yku.edu.cn