Enhancing flexibility evaluation in AC/DC distribution systems for sustainable energy integration
- Key Laboratory of Smart Gird of Ministry of Education, Tianjin University, Tianjin, China
With the exacerbation of environmental issues and the ongoing energy crisis, the large-scale integration of renewable energy resources has significantly increased the demand for flexibility in distribution systems. Establishing a comprehensive flexibility evaluation index system is crucial for the development, promotion, and optimization of AC/DC distribution systems. This paper focuses on the flexibility evaluation of AC/DC distribution systems, proposing a detailed flexibility evaluation index system and a comprehensive evaluation method based on the ANP-Entropy weighting model. The proposed flexibility evaluation index system comprises 18 key indexes categorized into four essential dimensions: overall flexibility performance, flexible resources participation, operational performance, and economic performance. The ANP-Entropy weighting model is employed to perform a thorough evaluation of the flexibility of AC/DC distribution systems. To validate the effectiveness of the proposed evaluation method, a case study is conducted. Additionally, the study explores the impacts of controllable distributed generator (CDG) capacity, energy storage system (ESS) capacity, and voltage source converter (VSC) capacity on the flexibility of AC/DC distribution systems. The results provide valuable insights into optimizing the flexibility and performance of AC/DC distribution systems.
1 Introduction
To address the pressing concerns of the energy crisis and environmental degradation, the integration of large-scale renewable energy resources and electric vehicles into the distribution system has become imperative (Wu et al., 2020). However, the inherent volatility and uncertainty associated with these resources have resulted in an increased demand for flexibility in the distribution system (Pourahmadi et al., 2019; Naghdalian et al., 2020). In this regard, the AC/DC hybrid distribution system is recognized as a pivotal development trend for future distribution systems (Gao et al., 2019). To mitigate the negative impact of uncertainty from both the source and the load sides, it is essential for the AC/DC distribution system to enhance system flexibility through the comprehensively deployment of diverse flexible resources, including controllable distributed generator (CDG) (Mohandes et al., 2019), energy storage systems (ESSs) (Shi et al., 2021), demand resource (Wang et al., 2018), electric vehicle (EV) (Pavic et al., 2018), microgrids (Majzoobi and Khodaei, 2017), voltage source converter (VSC) (Huang et al., 2021), and more. Consequently, the evaluation of flexibility in AC/DC distribution systems and the quantitatively analysis of the improvement effects brought about by different dispatching schemes are critical considerations in the operation, planning, and design of such systems (Heydarian-Forushani et al., 2018).
Flexibility plays a crucial role in assessing the operational adaptability of distribution systems. Extensive research, both domestically and internationally, has been conducted to evaluate and quantify system flexibility. In Nosair and Bouffard (2015), the concept of a “flexibility envelope” was introduced to analyze and assess the potential flexibility of power system. Additionally Ulbig and Andersson (2015) presented capacity, power, ramp rate, and duration as key parameters for evaluating power system flexibility. Furthermore Zhao et al. (2016) proposed a comprehensive flexibility evaluation framework, encompassing evaluation time, scheduling measures, uncertainty, and operating costs as key aspects. Moreover Qin et al. (2017) introduced a robust optimization method to quantify the intra-hour flexibility region of a power system, offering valuable insights for evaluating power system flexibility.
In the realm of flexibility evaluation indexes, significant contributions have been made to assess the flexibility of power systems. Notably, the insufficient ramping resource expectation (IRRE) and periods of flexibility deficit (PFD) were proposed in Lannoye et al. (2012), Lannoye et al. (2015), respectively, as metrics to evaluate power system flexibility. In addition Thatte and Xie (2016) defined the lack of ramp probability (LORP) to guide the economic dispatching of the power grid. Furthermore Lu et al. (2018) developed the loss of flexibility probability (LOFP), loss of flexibility duration (LOFD), loss of flexibility expectation (LOFE), and flexibility demand short (FDS) to inform the planning and design of power grids. These indexes mentioned above are capable of reflecting the probability of flexibility shortage. However, they do not provide information regarding power curtailment. Therefore Jiang et al. (2023b) introduced two new measures, namely, Flexibility supply adequacy (FSA) and network transmission margin (NTM), to assess the system’s flexibility.
Based on the analysis above, it is evident that the majority of existing flexibility evaluation indexes adequately reflect the overall flexibility of a power system. However, they do not provide specific important regarding the caused of flexibility shortage, the extent of the contribution and participation of flexible resources, the performance of power system, and the economic benefit of flexible dispatching. To address these limitations, it is essential to establish a comprehensive flexibility evaluation index system. Such a system would assist grid operators in assessing the flexibility of AC/DC distribution systems from multiple perspectives. Moreover, it would guide the allocation of flexible resources and formulation of more effective, dispatching strategies that maximize system flexibility and economic benefits.
To address the aforementioned objectives, this paper focuses on evaluating the flexibility of AC/DC distribution systems and presents the following key contributions:
1. A comprehensive flexibility evaluation index system has been developed specifically for AC/DC distribution systems. This index system is constructed from four perspectives, namely, overall flexibility performance, flexible resource participation, operational performance, and economic performance.
2. A comprehensive evaluation method for assessing the flexibility of AC/DC distribution systems has been implemented, utilizing the ANP-Entropy weighting model. This method ensures that the evaluation results align with both practical experience and objective data.
The subsequent sections of the paper are structured as follows: In Section 2, the flexibility evaluation index system is presented. Section 3 proposes an evaluation method for assessing the flexibility of AC/DC distribution systems. In Section 4, a case study is presented along with the corresponding evaluation results. Finally, Section 5 gives the conclusions of this paper.
2 Flexibility evaluation index system of AC/DC distribution systems
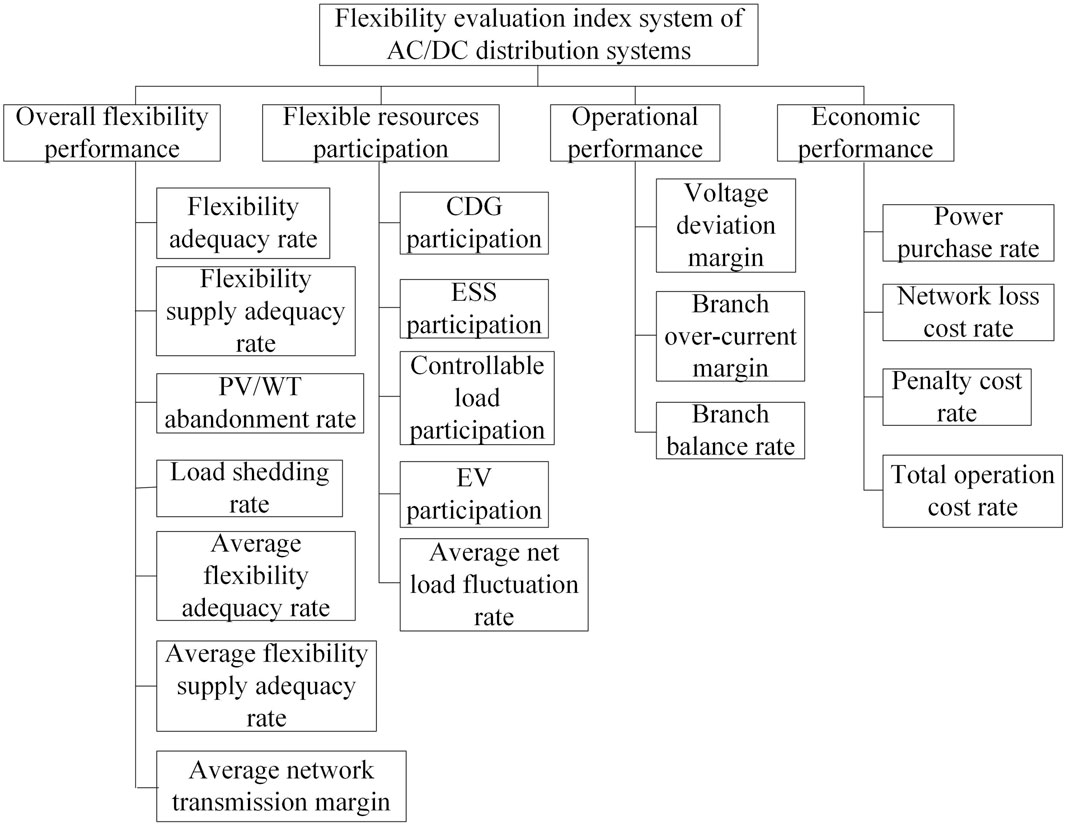
The flexibility evaluation index system should not only reflect the overall flexibility of AC/DC distribution systems but also provide multidimensional information for grid operators. This information includes identifying reasons for flexibility shortage, assessing the participation and contribution of different flexible resources, evaluating system operational performance, and determining the economic benefits of flexible dispatching. Equipped with this information, grid operators can easily select optimal regulation strategies, develop more flexible dispatching schemes, and allocate different flexible resources effectively. Consequently, the flexibility evaluation index system for AC/DC distribution systems is constructed based on four aspects: overall flexibility performance, flexible resource participation, operational performance, and economic performance. The proposed evaluation index system encompasses a total of 18 indexes, as illustrated in Figure 1.
2.1 Overall flexibility performance indexes
The overall flexibility performance provides a comprehensively reflection of the AC/DC distribution systems’ ability to handle fluctuations arising from renewable energy resources and loads. This evaluation is primarily based on six key aspects: flexibility adequacy rate, flexibility supply adequacy rate, PV/WT abandonment rate, load shedding rate, average flexibility supply adequacy, and average network transmission margin.
1) Flexibility adequacy rate: The flexibility adequacy rate
The larger the value
2) Flexibility supply adequacy rate: The flexibility supply adequacy rate
The higher the value
3) PV/WT abandonment rate: The PV/WT abandonment rate
Where,
The higher the value
4) Load shedding rate: The load shedding rate
where
The higher the value
5) Average flexibility supply adequacy: The average flexibility supply adequacy
where
The higher the value
6) Average network transmission margin: The average network transmission margin
where
The higher the value
2.2 Flexible resources participation indexes
The dimension of flexible resource participation showcases the contributions made by various flexible resources in enhancing system flexibility throughout the entire dispatching period. This dimension encompasses five key indexes: CDG participation, ESS participation, controllable load participation, EV participation, and average net load fluctuation rate.
1) CDG participation: The CDG participation
where
The larger the value
2) ESS participation: The ESS participation
where
The larger the value
3) Controllable load participation: The controllable load participation
where
The larger the value
4) EV participation: The EV participation
where
The larger the value
5) Average net load fluctuation rate: The average net load fluctuation rate
The lower the value
2.3 Operational performance indexes
For AC/DC distribution systems, the operational performance is reflected in three indexes: voltage deviation margin, branch over-current margin, and branch balance rate.
1) Voltage deviation margin: The voltage deviation margin
where
The larger the value
2) Branch over-current margin: The branch over-current margin
where
The larger the value
3) Branch balance rate: The branch balance rate
The smaller the value is, the branch current is more balance, indicating that the network transmission flexibility is better.
2.4 Economic performance indexes
Economic performance is an important aspect in the optimal dispatching of AC/DC distribution systems. It is reflected in four indexes, including electricity purchase rate, network loss cost rate, penalty cost rate, and total operation cost rate.
1) Power purchase rate: The power purchase rate
where
The larger the value
2) Network loss cost rate: The network loss cost rate
where
The larger the value
3) Penalty cost rate: The penalty cost rate
where
The larger the value
4) Total operation cost rate: The total operation cost rate
where
The larger the value
3 Evaluation method on the flexibility of AC/DC distribution systems
3.1 ANP-entropy weighting method
3.1.1 ANP method
The analytic network progress (ANP) is a decision-making method that can be utilized for non-independent hierarchical structure (Yang et al., 2018). The ANP method involves the following steps:
Step 1. Describe the decision-making problem and establish a hierarchal network structure.
Step 2. Construct a judgment matrix by comparing criteria. In the ANP, Assume there are m components represented by
Step 3. Construct a supermatrix. Comparing the internal and external relationships between the elements and other sets of elements. By comparing these relationships, we can obtain the weightless supermatrix W which is calculated by Eq. 24:
Step 4. Construct a weighted supermatrix. Compare the relative importance of Pi with Pj to obtain the normalized weight vector
Then the weighted supermatrix
Step 5. Calculate the limit supermatrix to obtain the index weights.
Calculation results determined by (27) are the weights of each index.
3.1.2 Entropy method
The entropy weight method utilizes information entropy to calculate the entropy weight of each index. It is an objective weighting method that solely relies on data itself (Yuan et al., 2019). The steps to obtain index weights with the entropy weighting method are as in Eqs 28–35:
Step 1. Construct the flexibility evaluation index matrix R';
Step 2. Standardize evaluation index matrix to eliminate the influence of different criteria dimensions on the evaluation results. For the benefit attribute data:
For the cost attribute data:
where
After that, a standardized evaluation matrix can be determined by:
Step 3. Normalize the standardized evaluation matrix:
Step 4. Determine the entropy ej for the jth criterion:
where
Step 5. Calculate the divergence coefficient for the jth criterion.
Step 6. Obtain the evaluation weight of the jth criteria according to:
3.1.3 Combination weighting method
The combination weighting method takes into account both subjective weights obtained through the ANP method and the objective weights determined by the entropy method. By combining these weights, it can effectively assess and objectively reflect the actual situation.
Assume that the subjective weights determined by the ANP method and the objective weights calculated by the entropy weight method are shown in Eqs 36, 37:
where
The final combined weights can be obtained by Eq. 38:
where
For the ith evaluation plan, the final evaluation result is determined by Eq. 39:
Evaluation results of each dispatching scheme are ranked according to the zi value. The larger the zi value is, the more flexible the distribution system is.
3.2 Flexibility evaluation process
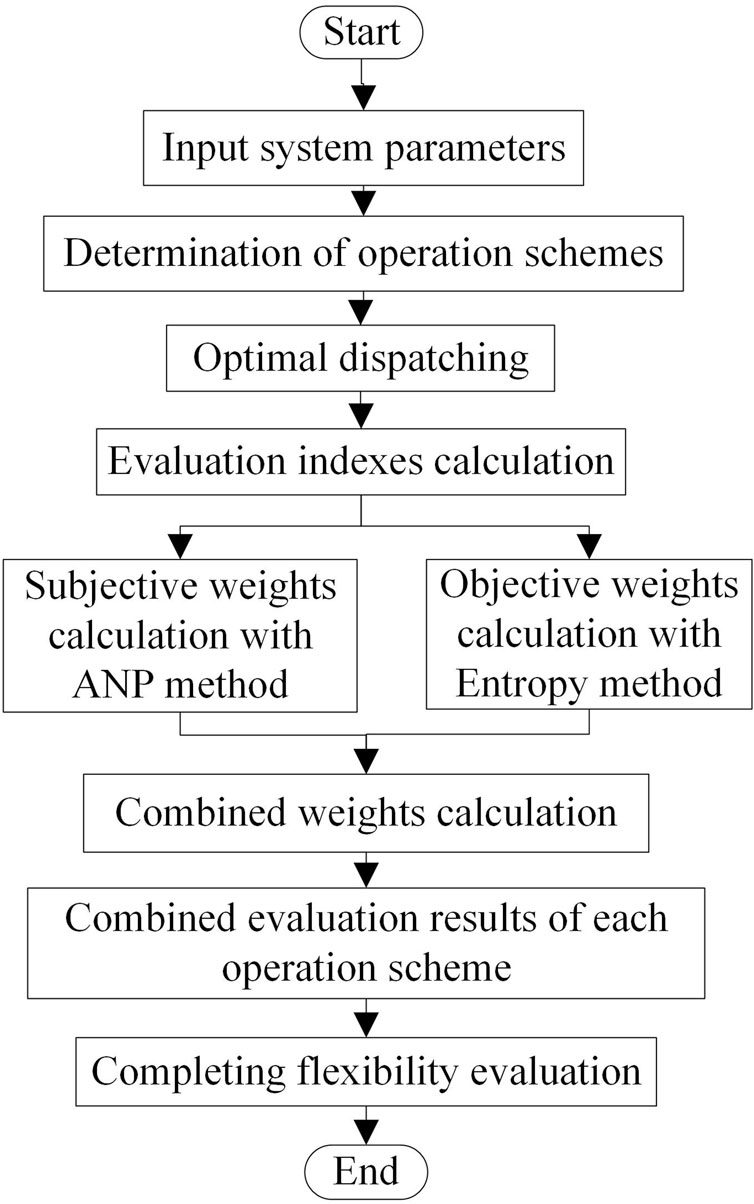
The process of evaluating the flexibility of AC/DC distribution systems mainly incorporates dispatching scheme formulation, economic dispatching, flexibility indexes calculation, normalization of evaluation indexes, subjective weights, and objective weights calculation, et al. The steps to evaluate the flexibility of AC/DC distribution systems are given as follows:
Step 1. Input parameters of AC/DC distribution systems, including network topology, PV and WT power output, load demand forecasting, parameters of CDGs, ESSs, VSCs, et al.;
Step 2. Determine operation schemes of AC/DC distribution systems;
Step 3. Solve the economic dispatching model of the AC/DC distribution systems for each operation scheme. The objective function of optimal dispatching is given by Eq. 40:
Step 4. Calculate flexibility evaluation indexes based on optimal dispatching results for each operation scheme;
Step 5. Obtain the subjective weights with the ANP method and objective weights with the entropy weight method to get the combined weights of each index.
Step 6. Calculate the final evaluation results of each operation scheme and complete the flexibility assessment of the AC/DC distribution systems.
The flexibility evaluation process of the AC/DC distribution systems is shown in Figure 2.
4 Case study
4.1 Basic data
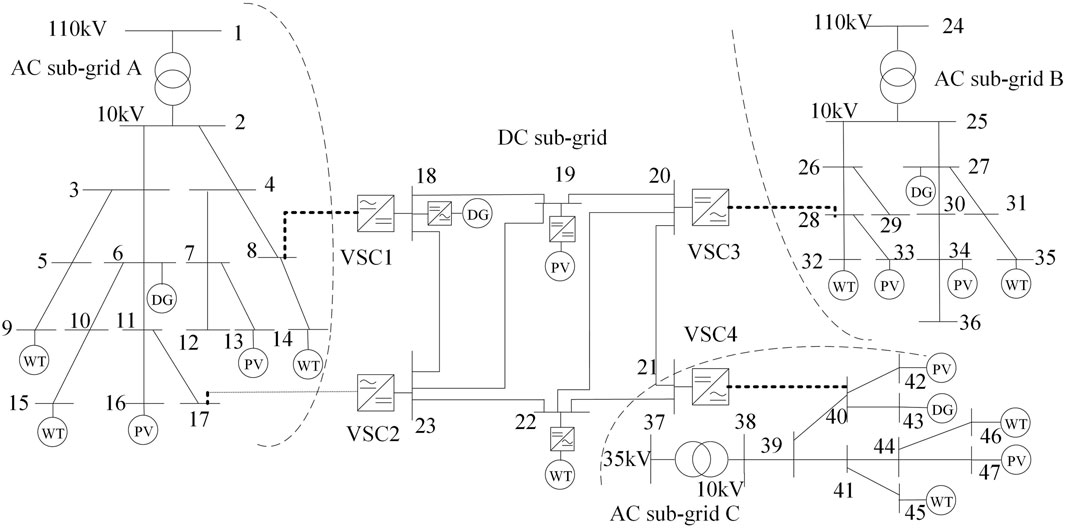
In order to validate the effectiveness of the proposed flexibility evaluation method, a 47-bus AC/DC distribution system as described in Jiang et al. (2023a) is utilized. The topology of this hybrid AC/DC distribution system is illustrated in Figure 3. For detailed information regarding the system parameters, please refer to the source mentioned in Jiang et al. (2023a).
In this system, there are three asynchronous AC sub-grids that are connected to the DC sub-grid via four VSCs. Additionally, the system comprises eight WTs, seven PV units, and five EV parking lots. The specific locations of these components are as follows:
1. Wind Turbines (WTs): The WTs are situated at buses 9, 14, 15, 22, 32, 35, 45, and 46.
2. Photovoltaic (PV) Units: There are seven PV units connected to buses 13, 16, 19, 33, 34, 42, and 47.
3. Electric Vehicle (EV) Parking Lots: The five EV parking lots are connected to buses 5, 12, 20, 30, and 41.
Moreover, each PV unit is equipped with one ESS to enhance the flexibility and stability of the system.
4.2 Flexibility evaluation results of AC/DC distribution systems
In order to assess the effectiveness of the proposed evaluation method and investigate the impact of dispatching strategies on the flexibility of AC/DC distribution systems, the following five cases have been established:
Case 1:. This case considers all flexible resources in the AC/DC distribution systems, including CDGs, ESSs, Controllable loads, EVs, and VSCs.
Case 2:. This case considers flexible resources such as CDGs, ESSs, EVs, and VSCs.
Case 3:. This case considers CDGs, ESSs, and flexible control of VSCs.
Case 4:. This case considers ESS and flexible control of VSC in the AC/DC distribution systems.
Case 5:. This case only considers the flexible control of VSC.
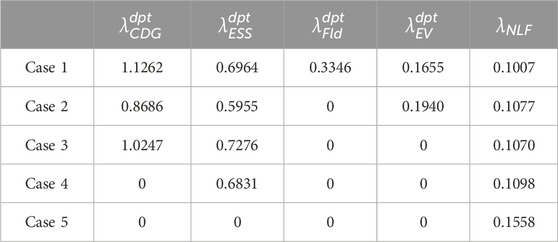
The evaluation indexes of these five cases are calculated and presented in Tables 1–5. These tables provide insights into the overall flexibility performance, flexible resources participation, operational performance, and economic performance, respectively.
From Tables 1–5, we can see that as less flexible resources are participated in dispatching, the flexibility adequacy rate
Calculation results of flexibility evaluation indexes based on the combined weighting method are given in Table 5.
The results presented in Table 5 indicate that the overall flexibility performance, flexible resource participation, operational performance, economic performance, and final score decrease gradually as fewer flexible resources participate in the dispatching process in cases 1–5. Among the five cases, Case 1, which comprehensively utilizes various flexible resources, demonstrates the highest overall flexibility performance, flexible resources participation, operational performance, economic performance, and the final score. This suggests that Case 1 exhibits the highest level of system flexibility.
Conversely, Case 5, which only considers the optimization control of VSCs, shows the lowest overall flexibility performance, flexible resources participation, operational performance, economic performance, and the final score. These results indicate that Case 5 has the lowest system flexibility.
When examining system operational performance, it is observed that the voltage deviation index and branch margin index in Case 2 are slightly higher compared to those in Case 3 and Case 4. Consequently, the system operational performance of Case 2 is lower than that of Case 3 and Case 4.
Regarding economic performance, the network loss cost in Case 2 is relatively high, resulting in a lower score for economic performance compared to Case 3.
The above analysis reveals that the flexibility evaluation results align with the optimal dispatching results, indicating that the proposed flexibility evaluation method accurately reflects the flexibility of AC/DC distribution systems.
4.3 Impact of flexible resource capacity on system flexibility
To analyze the impact of flexible resource capacity on system flexibility, studies are conducted by varying the capacity of CDG, ESS, and VSC on Case 1.
4.3.1 Impact of CDG capacity on system flexibility
By progressively increasing the capacity of CDG from 200 kW to 700 kW, the corresponding calculation results of system flexibility adequacy rate and load shedding rate are illustrated in Figures 4A, B, respectively. The outcomes presented in Figure 4 reveal a notable trend: as the CDG capacity increases, the load shedding rate decreases, indicating an improvement in system flexibility Moreover, the results clearly demonstrate that when the CDG capacity surpasses 500 kW, the system’s flexibility adequacy rate reaches 100%. Additionally, it is noteworthy that no power curtailment is observed for WT, PV units, and loads throughout the entire dispatching period.
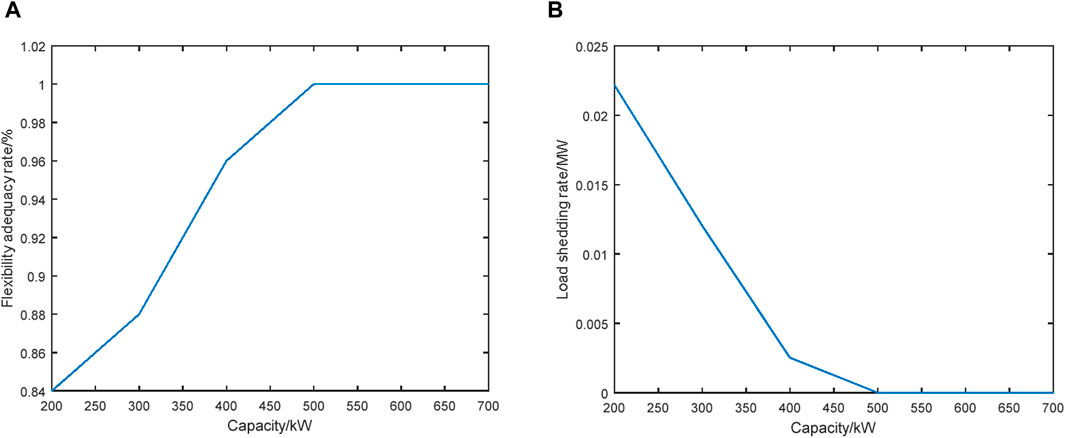
Figure 4. System flexibility adequacy rate and load shedding rate under different CDG capacities. (A) System flexibility adequacy rate. (B) Load shedding rate.
The flexibility evaluation results of the AC/DC distribution systems under different CDG capacities are summarized in Table 6. The calculation results presented in Table 6 reveal a consistent pattern: as the CDG capacity increases, there is notable improvement in system flexibility, resulting in higher final evaluation scores. Notably, when the CDG capacity reaches 600 kW, the system achieves the highest level of flexibility, as evidenced by the highest final flexibility sore.
4.3.2 Impact of ESS capacity on system flexibility
By gradually increasing the ESS capacity from 500 kW to 1,200 kW, the calculation results of the system flexibility adequacy rate and load shedding rate are presented in Figures 5A, B, respectively. The test results depicted in Figure 5 demonstrates that as ESS capacity increases, the load shedding rate decreases and the system flexibility improves. Furthermore, when the ESS capacity exceeds 700 kW, the flexibility adequacy index reaches 100%. There is no power curtailment of WT, PV units, and loads throughout the entire dispatching period.
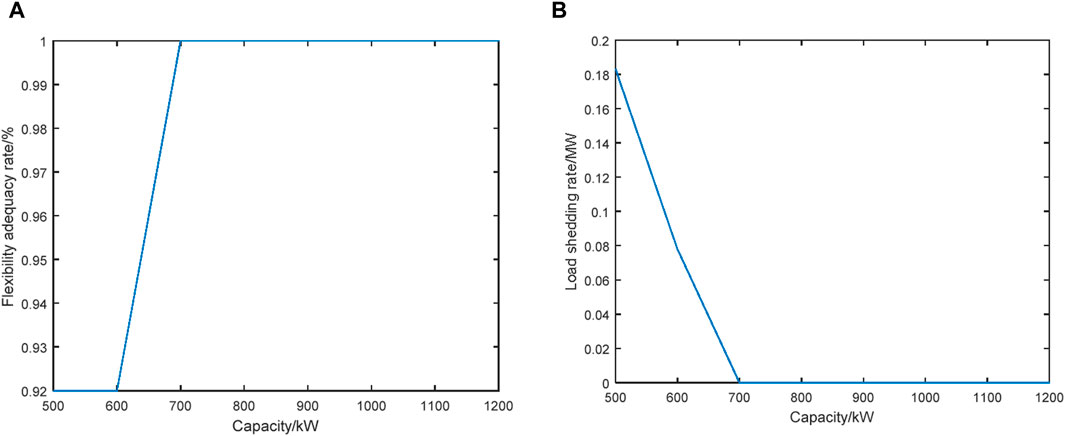
Figure 5. System flexibility adequacy rate and load shedding rate under different ESS capacities. (A) System flexibility adequacy rate. (B) Load shedding rate.
The flexibility evaluation results of the AC/DC distribution systems under different ESS capacities are listed in Table 7. Calculation results in Table 7 show that as the ESS capacity increases, system flexibility improves, and the final flexibility score increases too. When the ESS capacity reaches 1,200 kW, the final flexibility score is the highest.
4.3.3 Impact of VSC capacity on system flexibility
Gradually increasing VSC capacity from 0.8 MW to 2.5 MW, the system flexibility adequacy rate and load shedding rate are illustrated in Figures 6A, B, respectively. The results in Figure 6 show that increasing the VSC capacity can reduce the load shedding rate and improve system flexibility. When the VSC capacity exceeds 1.7WM, the AC/DC distribution system has sufficient flexibility and there is no power curtailment of WT, PV units, and loads throughout the entire dispatching period.
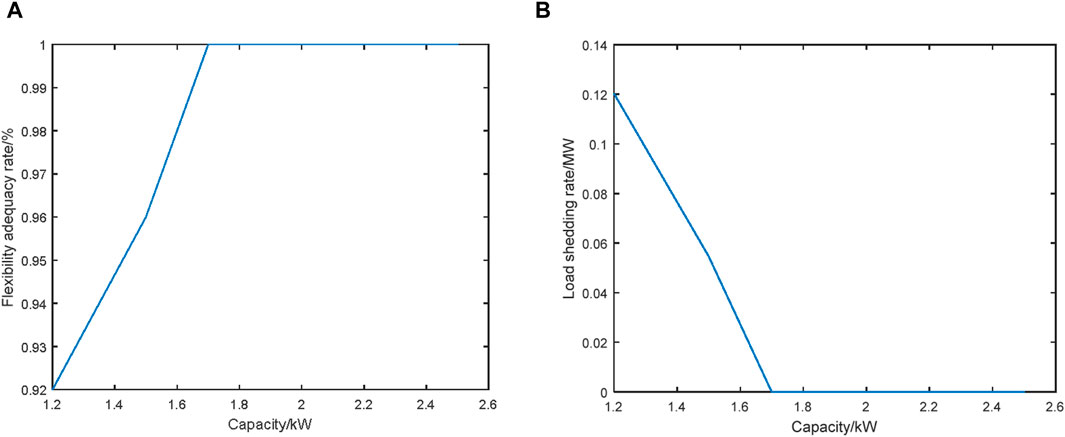
Figure 6. System flexibility adequacy and load shedding rate under different VSC capacities. (A) System flexibility adequacy rate. (B) Load shedding rate.
The flexibility evaluation results of the AC/DC distribution systems under different VSC capacities are listed in Table 8. Results in Table 8 show that as the VSC capacity increases, system flexibility is improved and the final evaluation score increases too. When VSC capacity reaches 1.8 MW, the final flexibility score is the highest.
Based on the above research, it is evident that increasing the capacity of flexible resources enhances system flexibility. However, beyond a certain threshold, this flexibility reaches saturation. Further increases in the capacity of flexible resources lead to resource redundancy and elevated costs.
5 Conclusion
This paper addresses the crucial topic of flexibility evaluation in AC/DC distribution systems. It introduces a comprehensive flexibility evaluation index system that covers key aspects such as overall flexibility performance, flexible resource participation, operational performance, and economic performance. The index system enables grid operators to assess the sufficiency of system flexibility and gain valuable insights into the underlying factors affecting flexibility, including resource participation and contribution, system operation, and economic benefits derived from flexible dispatching.
To determine the weights of the evaluation indexes, the paper adopts the ANP-entropy weight method, which combines subjective judgments and objective simulation results. This approach ensures the reliability and accuracy of the weight coefficients assigned to each index, thereby enhancing the overall evaluation process.
To demonstrate the effectiveness of the proposed evaluation method, a 47-bus AC/DC distribution system is used as a case study. The results obtained from the evaluation method confirm its ability to accurately reflect the flexibility of AC/DC distribution systems. Furthermore, by analyzing the impact of varying flexible resource parameters on system flexibility, the study reveals that increasing the capacities of VSCs, CDGs, and ESSs can significantly improve system flexibility. This paper did not consider the flexibility resources on the distribution network side in the evaluation. The next work is to study how to integrate the comprehensive flexibility evaluation system into the AC/DC distribution network planning.
Data availability statement
The original contributions presented in the study are included in the article/supplementary material, further inquiries can be directed to the corresponding author.
Author contributions
LW: Conceptualization, Methodology, Writing–review and editing. QZ: Conceptualization, Project administration, Supervision, Writing–review and editing. SW: Conceptualization, Formal Analysis, Funding acquisition, Project administration, Resources, Supervision, Writing–review and editing. XJ: Data curation, Methodology, Software, Visualization, Writing–original draft.
Funding
The authors declare that financial support was received for the research, authorship, and/or publication of this article. This work was supported by the State Grid Corporation of China Science and Technology Project (No. 5108-202299256A-1-0-ZB).
Conflict of interest
The authors declare that the research was conducted in the absence of any commercial or financial relationships that could be construed as a potential conflict of interest.
The authors declare that this study received funding from the State Grid Corporation of China. The funder had the following involvement in the study: data collection and article publication.
Publisher’s note
All claims expressed in this article are solely those of the authors and do not necessarily represent those of their affiliated organizations, or those of the publisher, the editors and the reviewers. Any product that may be evaluated in this article, or claim that may be made by its manufacturer, is not guaranteed or endorsed by the publisher.
References
Gao, S., Liu, S., Liu, Y., Zhao, X., and Song, T. E. (2019). Flexible and economic dispatching of AC/DC distribution networks considering uncertainty of wind power. IEEE Access 7, 100051–100065. doi:10.1109/ACCESS.2019.2930248
Heydarian-Forushani, E., Golshan, M. E. H., and Siano, P. (2018). Evaluating the operational flexibility of generation mixture with an innovative techno-economic measure. IEEE Trans. Power Syst. 33, 2205–2218. doi:10.1109/TPWRS.2017.2737521
Huang, H., Zhou, M., Zhang, S., Zhang, L., Li, G., and Sun, Y. (2021). Exploiting the operational flexibility of wind integrated hybrid AC/DC power systems. IEEE Trans. Power Syst. 36, 818–826. doi:10.1109/TPWRS.2020.3014906
Jian, J., Li, P., Ji, H., Bai, L., Yu, H., Xi, W., et al. (2022). DLMP-based quantification and analysis method of operational flexibility in flexible distribution networks. IEEE Trans. Sustain. Energy 13, 2353–2369. doi:10.1109/TSTE.2022.3197175
Jiang, X., Wang, S., Zhao, Q., and Wang, X. (2023a). Exploiting the operational flexibility of AC-MTDC distribution system considering various flexible resources. Int. J. Electr. Power and Energy Syst. 148, 108842. doi:10.1016/j.ijepes.2022.108842
Jiang, X., Wang, S., Zhao, Q., and Wang, X. (2023b). Exploiting the operational flexibility of AC-MTDC distribution system considering various flexible resources. Int. J. Electr. Power and Energy Syst. 148, 108842. doi:10.1016/j.ijepes.2022.108842
Lannoye, E., Flynn, D., and O’Malley, M. (2012). Evaluation of power system flexibility. IEEE Trans. Power Syst. 27, 922–931. doi:10.1109/TPWRS.2011.2177280
Lannoye, E., Flynn, D., and O’Malley, M. (2015). Transmission, variable generation, and power system flexibility. IEEE Trans. Power Syst. 30, 57–66. doi:10.1109/TPWRS.2014.2321793
Lu, Z., Li, H., and Qiao, Y. (2018). Probabilistic flexibility evaluation for power system planning considering its association with renewable power curtailment. IEEE Trans. Power Syst. 33, 3285–3295. doi:10.1109/TPWRS.2018.2810091
Majzoobi, A., and Khodaei, A. (2017). Application of microgrids in supporting distribution grid flexibility. IEEE Trans. Power Syst. 32, 3660–3669. doi:10.1109/TPWRS.2016.2635024
Mohandes, B., Moursi, M. S. E., Hatziargyriou, N., and Khatib, S. E. (2019). A review of power system flexibility with high penetration of renewables. IEEE Trans. Power Syst. 34, 3140–3155. doi:10.1109/TPWRS.2019.2897727
Naghdalian, S., Amraee, T., Kamali, S., and Capitanescu, F. (2020). Stochastic network-constrained unit commitment to determine flexible ramp reserve for handling wind power and demand uncertainties. IEEE Trans. Ind. Inf. 16, 4580–4591. doi:10.1109/TII.2019.2944234
Nosair, H., and Bouffard, F. (2015). Flexibility envelopes for power system operational planning. IEEE Trans. Sustain. Energy 6, 800–809. doi:10.1109/TSTE.2015.2410760
Pavic, I., Capuder, T., and Kuzle, I. (2018). A comprehensive approach for maximizing flexibility benefits of electric vehicles. IEEE Syst. J. 12, 2882–2893. doi:10.1109/JSYST.2017.2730234
Pourahmadi, F., Hosseini, S. H., and Fotuhi-Firuzabad, M. (2019). Economically optimal uncertainty set characterization for power system operational flexibility. IEEE Trans. Ind. Inf. 15, 5456–5465. doi:10.1109/TII.2019.2906058
Qin, Z., Hou, Y., Lei, S., and Liu, F. (2017). Quantification of intra-hour security-constrained flexibility region. IEEE Trans. Sustain. Energy 8, 671–684. doi:10.1109/TSTE.2016.2615055
Shi, Y., Dong, S., Guo, C., Chen, Z., and Wang, L. (2021). Enhancing the flexibility of storage integrated power system by multi-stage robust dispatch. IEEE Trans. Power Syst. 36, 2314–2322. doi:10.1109/TPWRS.2020.3031324
Thatte, A. A., and Xie, L. (2016). A metric and market construct of inter-temporal flexibility in time-coupled economic dispatch. IEEE Trans. Power Syst. 31, 3437–3446. doi:10.1109/TPWRS.2015.2495118
Ulbig, A., and Andersson, G. (2015). Analyzing operational flexibility of electric power systems. Int. J. Electr. Power and Energy Syst. 72, 155–164. doi:10.1016/j.ijepes.2015.02.028
Wang, K., Yin, R., Yao, L., Yao, J., Yong, T., and Deforest, N. (2018). A two-layer framework for quantifying demand response flexibility at bulk supply points. IEEE Trans. Smart Grid 9, 3616–3627. doi:10.1109/TSG.2016.2636873
Wu, Z., Zhou, M., Wang, J., Du, E., Zhang, N., and Li, G. (2020). Profit-sharing mechanism for aggregation of wind farms and concentrating solar power. IEEE Trans. Sustain. Energy 11, 2606–2616. doi:10.1109/TSTE.2020.2967860
Yang, J., Yang, C., Song, Y., and Wang, X. (2018). Exploring promotion effect for FIT policy of solar PV power generation based on integrated ANP: entropy model. Math. Problems Eng. 2018, 1–15. doi:10.1155/2018/7176059
Yuan, J., Li, X., Xu, C., Zhao, C., and Liu, Y. (2019). Investment risk assessment of coal-fired power plants in countries along the Belt and Road initiative based on ANP-Entropy-TODIM method. Energy 176, 623–640. doi:10.1016/j.energy.2019.04.038
Keywords: AC/DC distribution systems, flexibility, evaluation index, ANP-entropy weighting model, sustainable energy
Citation: Wang L, Zhao Q, Wang S and Jiang X (2024) Enhancing flexibility evaluation in AC/DC distribution systems for sustainable energy integration. Front. Energy Res. 12:1423189. doi: 10.3389/fenrg.2024.1423189
Received: 25 April 2024; Accepted: 24 May 2024;
Published: 12 June 2024.
Edited by:
Kaiqi Sun, Shandong University, ChinaReviewed by:
Yang Lei, Anhui University, ChinaLv Chaoxian, China University of Mining and Technology, China
Copyright © 2024 Wang, Zhao, Wang and Jiang. This is an open-access article distributed under the terms of the Creative Commons Attribution License (CC BY). The use, distribution or reproduction in other forums is permitted, provided the original author(s) and the copyright owner(s) are credited and that the original publication in this journal is cited, in accordance with accepted academic practice. No use, distribution or reproduction is permitted which does not comply with these terms.
*Correspondence: Shouxiang Wang, wly1393524105@163.com
 Luyang Wang
 Qianyu Zhao
 Shouxiang Wang*