X-ray chemical imaging for assessing redox microsites within soils and sediments
 Vincent Noël1*
  Kristin Boye1
  Hannah R. Naughton2,3
  Emily M. Lacroix4,5
  Meret Aeppli4,6
  Naresh Kumar7
  Scott Fendorf4
  Samuel M. Webb1
- 1Stanford Synchrotron Radiation Lightsource, SLAC National Accelerator Laboratory, Menlo Park, CA, United States
- 2Climate and Ecosystem Sciences Division at Lawrence Berkeley National Laboratory, Berkeley, CA, United States
- 3Stockbridge School of Agriculture, University of Massachusetts, Amherst, MA, United States
- 4Department of Earth System Science, Stanford University, Stanford, CA, United States
- 5Institut des Dynamiques de La Surface Terrestre (IDYST), Université de Lausanne, Lausanne, Switzerland
- 6Institut D’ingénierie de L’environnement (IIE), École Polytechnique Fédérale de Lausanne, Lausanne, Switzerland
- 7Soil Chemistry, Wageningen University and Research, Wageningen, Netherlands
Redox reactions underlie several biogeochemical processes and are typically spatiotemporally heterogeneous in soils and sediments. However, redox heterogeneity has yet to be incorporated into mainstream conceptualizations and modeling of soil biogeochemistry. Anoxic microsites, a defining feature of soil redox heterogeneity, are non-majority oxygen depleted zones in otherwise oxic environments. Neglecting to account for anoxic microsites can generate major uncertainties in quantitative assessments of greenhouse gas emissions, C sequestration, as well as nutrient and contaminant cycling at the ecosystem to global scales. However, only a few studies have observed/characterized anoxic microsites in undisturbed soils, primarily, because soil is opaque and microsites require µm-cm scale resolution over cm-m scales. Consequently, our current understanding of microsite characteristics does not support model parameterization. To resolve this knowledge gap, we demonstrate through this proof-of-concept study that X-ray fluorescence (XRF) 2D mapping can reliably detect, quantify, and provide basic redox characterization of anoxic microsites using solid phase “forensic” evidence. First, we tested and developed a systematic data processing approach to eliminate false positive redox microsites, i.e., artefacts, detected from synchrotron-based multiple-energy XRF 2D mapping of Fe (as a proxy of redox-sensitive elements) in Fe-“rich” sediment cores with artificially injected microsites. Then, spatial distribution of FeII and FeIII species from full, natural soil core slices (over cm-m lengths/widths) were mapped at 1–100 µm resolution. These investigations revealed direct evidence of anoxic microsites in predominantly oxic soils such as from an oak savanna and toeslope soil of a mountainous watershed, where anaerobicity would typically not be expected. We also revealed preferential spatial distribution of redox microsites inside aggregates from oak savanna soils. We anticipate that this approach will advance our understanding of soil biogeochemistry and help resolve “anomalous” occurrences of reduced products in nominally oxic soils.
1 Introduction
In the terrestrial environment, anoxic processes are conventionally assumed to be hosted within wetlands, rice paddies, poorly drained soils, or deep/compacted soil horizons where oxygen availability is substantially limited. In apparent contradiction to this view, anoxic biogeochemical products, such as methane (CH4), nitrous oxide (N2O), and reduced iron (FeII) are frequently reported in well-aerated upland soils (Arah and Smith, 1989; Rijtema and Kroes, 1991; Arah and Vinten, 1995; Riley and Matson, 2000; Farquharson and Baldock, 2008; O’Connell et al., 2018). Transiently water-impacted soils and subsurface sediments often exhibit visual mottling or greyed colors, indicative of reduced aggregates, lenses, or layers. These features have inspired researchers to ascribe the seemingly anomalous presence of reduced products to biogeochemical activity hosted within anoxic microsites (Sexstone et al., 1985; Van der Lee et al., 1999), which are not readily detected in bulk samples or meter to field-scale surveys of soil/sediment properties or conditions. The central tenets of the anoxic microsite concept are that: i) microsites are non-majority spatially heterogeneous soil volumes possessing conditions differing from the bulk matrix, and ii) internal oxygen consumption exceeds the rate of oxygen supply, at least transiently (Sexstone et al., 1985; Renault and Stengel, 1994). The presence of microsites putatively allows anoxic biogeochemical products to be internally generated and exported (e.g., through diffusion or colloidal transport) to the oxic soil matrix, where, the generation of these products would otherwise be thermodynamically or metabolically unfavorable. For example, O’Connell et al. (2018) reported that the onset of strong emissions of CH4 following a severe drought in tropical forest soils of Puerto Rico could only be explained by reducing conditions hosted within persistently anoxic microsites. The implications of anoxic microsites for soil function and elemental cycling are profound and numerous, including organic carbon storage (Boye et al., 2017; Keiluweit et al., 2017), denitrification (Leffelaar, 1986; Davidson, 1992; Lensi et al., 1995; Phillipot et al., 1996), manganese (Jones et al., 2018), sulfur (Noël et al., 2017a), iron (Noël et al., 2017a) reduction, methanogenesis (Riley et al., 2011; Angle et al., 2017), and mobilization or entrapment of metal micronutrients and contaminants (Schulze et al., 1994; Masue-Slowey et al., 2011; Masue-Slowey et al., 2013; Ying et al., 2013; Noël et al., 2017b; Hausladen and Fendorf, 2017; Yabusaki et al., 2017; Kumar et al., 2020).
Similar to anoxic microsites in soils and sediments, the presence of anaerobic metabolisms in oxygenated waters have been observed inside sinking organic aggregates, which provide ideal microenvironment for the development of anaerobic niches for microorganisms (Bianchi et al., 2018). Anoxic microenvironments have thus been reported within millimetre-scale marine (Alldredge and Cohen, 1987; Ploug and Buchholz, 1997) and lacustric (Capo et al., 2023) aggregates, and appear to support denitrification (Michotey and Bonin, 1997; Wolgast et al., 1998; Ganesh et al., 2015; Klawonn et al., 2015), sulfate reduction (Shanks and Reeder, 1993), and mercury methylators (Gallorini and Loizeau, 2021; 2022) in the predominantly oxic water column. The need to decipher the impact from anoxic activities in predominantly oxic environments thus constitutes an eminent subject for a wider set of ecosystems extending from terrestrial to aquatic systems. However, in this study, we focus exclusively on detecting anoxic activities in terrestrial systems (i.e., soils and sediments).
Implicit to the developing view of microsites is the assumption that anoxic microsites are ubiquitous and abundant in most soil types (Young and Crawford, 2004; Kravchenko et al., 2019). However, despite the considerable evidence to support their existence and importance in biogeochemical cycles (Tiedje et al., 1982; Rijtema and Kroes, 1991; Silver et al., 1999; Ranjard et al., 2000; Hansel et al., 2008; Riley et al., 2011; O’Connell et al., 2018; Kumar et al., 2020), systematic and direct observations of anoxic microsites are lacking in the literature (Lacroix et al., 2023). Consequently, our understanding of microsite prevalence, size, proportional volume, spatial distribution, and defining characteristics (e.g., texture, pore connections, organic matter abundance), as well as how these factors control the biogeochemical functions of microsites is rudimentary. Moreover, the likelihood of anoxic microsites being transient (e.g., following a heavy precipitation event, a snowmelt induced flood, or seasonal cryoturbation and root activities; Ping et al., 2008; Noël et al., 2019), i.e., representing “hot moments”, is significant. Currently, the knowledge of spatial and temporal distribution of microsites is inadequate to support model development and parameterization; hence, anoxic microsites are either neglected in ecosystem scale models or their properties are taken from unvalidated conceptual models (Tang and Riley, 2019). Riley et al. (2011) discussed the impact of various assumptions regarding microsites on model uncertainty and concluded that they are profoundly important but poorly constrained, limiting ecosystems models to accurately project the processes responsible for elemental cycling, including greenhouse gas (GHG) production. For example, anoxic microsite CH4 production in unsaturated (i.e., presumably “oxic”) soils could account for 21% of global CH4 emissions - a potential CH4 source currently not accounted for in ecosystems models (Riley et al., 2011). This underscores the importance of detecting, quantifying, and characterizing anoxic microsites to improve our knowledge of system level biogeochemical functions and ecosystem scale modeling.
The heterogeneous distribution and “transient” nature of anoxic microsites pose substantial challenges for their detection and analysis, rendering them elusive to empirical studies in spite of the substantial but indirect evidences of their ubiquity and importance (Lacroix et al., 2023). To overcome the challenges of spatially detecting, quantifying, and characterizing anoxic microsites from natural samples, we have developed a step-by-step approach to detect solid phase forensic evidence of anaerobicity, present or past (Figure 1). Micro-X-ray fluorescence (µ-XRF) spectroscopy enables 2-D mapping of the spatial distributions of total concentration, oxidation states, and chemical forms, of trace level elements that are indicative of current (e.g., FeS and MnII) or previous (e.g., presence of S0, distinct depletion of solid-phase Fe and/or Mn, or accumulation of S and/or U) anaerobicity in natural soil core slices (up to 100 cm long) at 10–100 µm scale resolutions (and down to 1 µm resolution within cm-sized samples; Noël et al., 2014; Johnson et al., 2016; Farfan et al., 2018). The approach used in this study serves as a proof of concept that X-ray imaging can be used to detect anoxic microsites in complex lab-manipulated systems as well as in natural, undisturbed samples. Throughout the manuscript, the detection of solid-phase biogeochemical products is thus discussed as the fingerprint of the presence of anoxic microsites, understanding the mechanisms generating these products is not the focus of this paper. Our approach offers to the community a unique opportunity to detect and quantify anoxic microsites, thus providing the needed tools to the future research to improve the knowledge of key biogeochemical parameters of anoxic microsites and generate reliable experimental data to be included in numerical models predicting the biogeochemical cycling of GHGs, nutrients, and contaminants at the ecosystem scale.
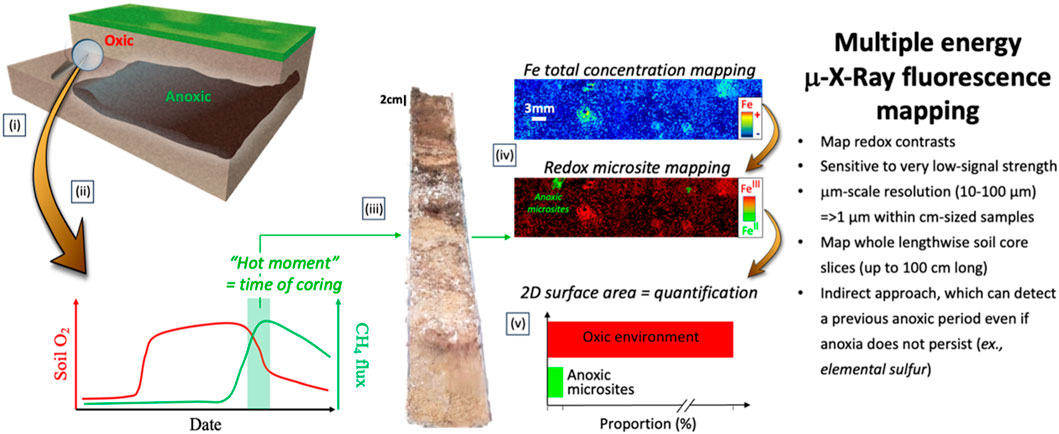
FIGURE 1. Illustration of the step-by-step method for detecting and quantifying anoxic microsite from natural samples. (i) Detecting location(s) where well-aerated or predominantly oxic soils/sediments release anoxic biogeochemical products, such as methane (CH4), = ‘hot spot’; (ii) Detecting time(s) when these anoxic biogeochemical products are released = ‘hot moment’; (iii) Coring natural samples at the ‘hot spot’ and during ‘hot moment’ while preserving anoxic conditions; (iv) Analyzing redox-sensitive element multiple energy μ-XRF 2D mapping to identify spatial distribution of the total concentration and redox species of selected redox-sensitive element(s) (such as Fe) = ‘detecting anoxic microsites’; (v) Quantifying the distribution of the anoxic microsites relative to the surface area of the whole lengthwise soil core slice.
2 Methods and materials
2.1 Dual-domain column experiments
A dual-domain column experiment was designed to test the ability of the detection method to map the differences in redox reactivity between core and interface of anoxic microsite under oxygenated hydrologic flow simulated in the laboratory.
Columns (30 cm long, 7 cm diameter) were filled with natural sediments, collected ∼2 weeks prior from the Wind River-Little Wind River floodplain outside of Riverton, WY (42°59′19.1″N, 108°23′58.6″W). Columns were set up by embedding one fine-grained, organic-rich, reducing lens (∼3 cm diameter, 17–20 g dry weight made from sulfidic sediments collected underneath an oxbow lake on the floodplain) into aquifer sand (1.3–1.4 kg dry sand in the column). Columns were fed artificial groundwater (in upflow mode using a peristaltic pump at a flow rate of 90 mL/day, equivalent to ∼1 pore volume exchange per 48 h; Figure 2) made to have a chemical composition similar in concentrations of the major solutes, except organic C, measured in Riverton floodplain groundwater at the site over the past 2 years (Kumar et al., 2020). The column experiment was run for a total of 70 days. More information of the column design and description of sediment are detailed in Kumar et al. (2020). At the end of column experiment, the core was preserved at −20°C until prepared for X-ray analyses.
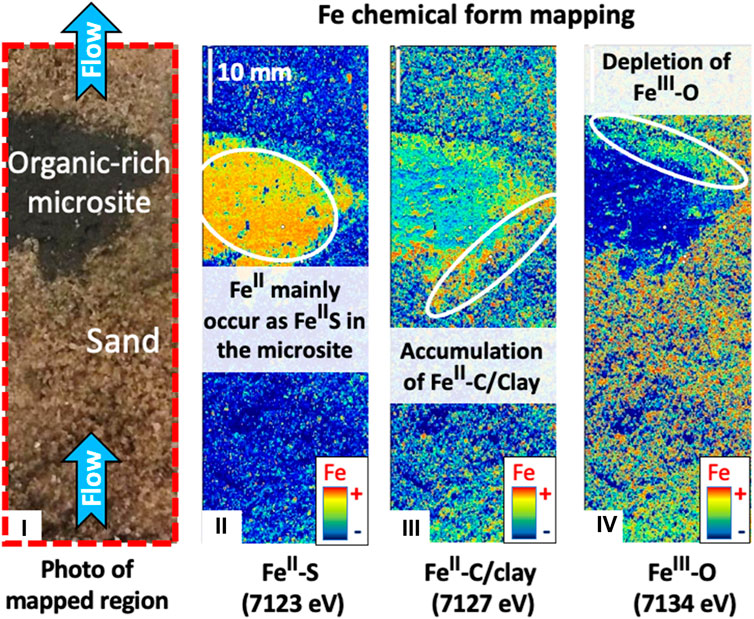
FIGURE 2. Fe K-edge multiple energy μ-XRF mapping of dual-domain synthetic column experiment of aquifer sand containing reducing organic-rich lenses. (i) Photo shows the lateral cut surface of the column; The three maps on the right show the gross μ-XRF map collected along the column length cut surface at: (ii) 7,123 eV, where X-rays are preferentially absorbed by FeII-S species; (iii) 7,127 eV, where X-rays are preferentially absorbed by FeII-C/clay species; and (iv) 7,134 eV, where X-rays are preferentially absorbed by FeIII-O species.
2.2 Preparation of synthetic cores
Cores with FeII and FeIII microsites were artificially created in sandy matrices with and without a natural Fe background to develop and calibrate data processing methods for detecting FeII and FeIII microsites in Fe-“poor” and Fe-“rich” environments.
To prepare synthetic cores with either Fe-“poor” or Fe-“rich” background matrices, a 50 mL falcon tube was cut lengthwise down the middle and the halves were separately capped. One-half was then filled with 350 g dry, FeIII-free sand, to represent an Fe-“poor” background and the other half was filled with a mix of 60 weight-% FeIII-smectite (210 g) and 40 weight-% FeIII-free sand (140 g) to represent a 1.6% Fe-“rich” background. FeIII-free sand consisted of HM-106 Density Test Sand (Sand Cone Test Sand) and FeIII-smectite consisted of SWy-2 (Na-rich Montmorillonite), a source clays repository from the Clay Minerals Society composed of ≈3.35% Fe2O3 and ≈0.35% FeO (Crook County, Wyoming, USA; https://www.clays.org/sourceclays_data/). After filling the half-cores, they were smoothed to ensure a plane surface and then covered in epoxy (EPO-TEK® 301-2FL) to stabilize the sand. Before the epoxy fully hardened (∼12 h), ∼2–10 mm diameter and ∼1–2 mm deep holes were carved along the surface of each synthetic core, using a simple needle. After fully hardening (>72 h), the holes were then filled with solid fraction (dried and powdered) of either FeII-S (i.e., FeII-sulfide), FeIICO3 (i.e., siderite), or FeIII-(hydroxy)oxide mixed with the background material to generate microsites with 5 weight-% Fe of varying redox properties. Thus, FeII-S and FeIICO3 microsites in the FeIII-smectite sand synthetic core would represent a depletion of FeIII compared to the background, whereas FeIII-(hydroxy)oxide microsites would represent a gain of FeIII compared to the background. FeII-S and FeIICO3 consisted of natural FeII-sulfide and siderite, respectively, from the Stanford University mineral collection, while FeIII-(hydroxy)oxides consisted of synthesized goethite (α-FeIIIO(OH)) nanoparticles characterized in Kumar et al. (2018). Phase purity of the natural FeII-sulfide, siderite, and synthetic goethite were confirmed by X-ray diffraction (XRD) analysis (XRD method and diffractograms are provided in Supplementary Material). Additionally, Fe K-edge XANES spectra of natural FeII-sulfide, siderite, and synthetic goethite composing FeII-S, FeIICO3, FeIII-(hydroxy)oxide microsites, respectively (Supplementary Figure S2), compared well with spectra of previously reported references (Supplementary Figure S3).
2.3 Natural soil cores
Soil cores were collected from different field sites to detect and quantify anoxic microsites within natural samples.
2.3.1 Site description
A toeslope (38°55′15"N, 106°56′54"W) and a floodplain (38°55′16"N, 106°56′58"W) meander transect was selected at the Pumphouse Lower Montane site in the East River valley outside of Crested Butte, CO, to represent drier and wetter soil conditions respectively, based on water residence time (Tokunaga et al., 2019). The transect corresponds to mixed meadow and riparian communities comprised of grasses, forbs, and shrubs (Falco et al., 2019), plus Salix, Betula, and Carex species in the floodplain (Fox et al., 2022). The Mancos shale-derived soils are classified as 0.5–1 m deep cryaquolls/histosols in the floodplain and 1 m deep Ustic Haplocryolls at the toeslope (Web Soil Survey, 2019). The site is typically under snow from October to April-May, though, 2021 was a low snowpack year that resulted in an abnormally low water table, dry soils, and early senescence/shift in plant phenology.
2.3.2 Sampling
Samples from field sites were collected in June 2021, during snowmelt period, and at the peak of flowering of the chosen grass and forb to ensure correct identification and high photosynthetic and root activity. Snowmelt period is characterized by high river stage and saturated soils, and consequently exhibits the period with higher release of anoxic biogeochemical products (Engel et al., 2023), i.e., high likelihood of activation of anaerobic microsites (Figure 1). Soil cores (5 cm × 15 cm) were collected in PVC core sleeves with vinyl caps using a slide hammer and corer. Cores were taken directly below the stem of either annual grass, Phleum pratense, or annual forb, Potentilla pulcherrima, to account for differences in root structure effects on soil aeration. Additional cores were taken radiating out from plant stems for laboratory soil analysis. All sample cores were immediately capped, put on ice, and shipped overnight to SLAC (X-ray imaging) or LBNL (other analyses). Upon arrival in the labs, cores were immediately frozen at −20°C, until prepared for analyses.
2.4 Natural soil aggregates
Soil aggregates were also collected to map spatial distribution of Fe reducing zones in natural aggregates to complement other analyses targeting anoxic microsites from soil cores and aggregate samples collected at the same locations (Lacroix et al., 2022).
2.4.1 Site description
Soil aggregates were collected from the toeslope and ridge positions along a continuous hillslope within the Stanford Dish Area (37°24′38.16"N, 122°10′4.8"W) a California oak savanna, with a mean annual temperature of 14.7°C and mean annual precipitation of 419 mm (Arguez et al., 2012). These soils are derived from shale and sandstone, bulk oxic, and classified as Aridic Haploxererts (Web Soil Survey, 2019) with pronounced textural variation. The toeslope position represented a loam texture, and the ridge position, a sandy loam texture.
2.4.2 Sampling
Intact soil aggregates were collected in March 2022 from surface A) horizons using a bucket auger. The depth intervals for the horizon extent were estimated using visible color changes observed in a near-by soil pit at each site. Soil was carefully removed from the bucket auger and placed in a 10-mm sieve to retain stable aggregates. From the sieve mesh, aggregates with diameter >1.5 cm were randomly selected and placed in a 50 mL plastic jar. The aggregates and jar were flash-frozen using liquid nitrogen within 5 minutes of excavation. Aggregates were returned to the laboratory on dry ice and stored in a −80°C freezer until a randomized subset were treated with epoxy in preparation for X-ray imaging.
2.5 Preparation for X-ray mapping
For X-ray chemical imaging, all samples (i.e., the dual domain column, natural soil cores, and natural soil aggregates) were sectioned in half to map Fe oxidation spatial distribution in 2D at the center of each sample. For this purpose, it is crucial to preserve the chemical and physical state of the samples during sectioning (including limited oxidation and physical smearing). Therefore, all samples were transferred (while frozen and sealed) into an anoxic chamber (∼4% H2, 96% N2) equipped with an O2 detector and Pd catalysts (Coy Laboratories) and all sample preparations were conducted inside this chamber. Importantly, the synthetic cores (§ 2.2), having been prepared directly for X-ray analyses, were not treated as described below, but were kept in anoxic containers until X-ray analyses.
The dual domain column and natural soil cores were cut in half (lengthwise) in a two-step process: (i) the PVC “shell” was cut with a rotary cutter and (ii) the frozen column/soil cores were cut with a sharp knife – this two-step process prevents PVC contamination of the core and minimizes smearing of the cut surfaces. For each sample, one half of the cut core was selected for X-ray imaging and a 2-mm section of the surface was removed delicately using a knife (to further remove any smearing or contamination from the cutting process). Thereafter, the soil core halves were left to thaw and dry partially, inside the anoxic chamber at ambient temperature under suction (vacuum) for 24-48 hours, prior to being fixed with epoxy (EPO-TEK® 301-2FL). It is necessary to allow the cores to partially dry to enable penetration of the epoxy while preserving physical structure; applying suction accelerates the drying and, hence, minimizes microbial activity and associated redox changes during thawing/drying. The suction also enhances the penetration of epoxy into the sample, which with 1-2 cm depth penetration from the exposed surface serves to: (i) prevent movement of core sections and/or particles during manipulations and X-ray analyses, and (ii) minimize redox alterations during transfer for X-ray analyses.
Because soil aggregates were too fragile to be cut in their untreated state, they were first epoxied before cutting in following steps; 1) a 50mL capped plastic centrifuge tube was cut longitudinal to the axis of the tube and one-half was filled with epoxy; 2) soil aggregates were partially submerged so that roughly half of each aggregate remained above the surface of the epoxy in the cut centrifuge tube; 3) after allowing the epoxy to harden for 72 hours, the non-fixated half of soil aggregates were cut along the surface of the epoxy to generate a smooth surface for X-ray mapping. Once prepared, all samples were kept separately in anoxic containers until X-ray analyses.
2.6 μ-XRF imaging and μ-X-ray absorption near edge structure (µ-XANES) spectroscopy
The natural and synthetic samples were transferred to the beamline in anoxic containers where they were directly inserted into an He flow-box (completely sealed and continuously saturated with He) to avoid oxidation. The entire surface area of the experimental (dual-domain columns, §2.1), synthetic (§2.2), and prepared natural (cores and aggregates, §2.3 and §2.4) samples were analyzed by synchrotron-based multiple energy μ-XRF mapping across the Fe K-edge to determine the spatial distribution of FeII vs. FeIII species. Multiple-energy Fe maps were collected at Beamline 7-2 at the Stanford Synchrotron Radiation Lightsource (SSRL, SLAC National Accelerator Laboratory, Menlo Park, CA), a 20-pole 2-Telsa wiggler device equipped with a double crystal monochromator (Si [111],φ = 0°). μ-XRF maps were collected at 7,116, 7,123, 7,127, 7,132, 7,138, and 7,145 eV at ambient temperature using a 4-channel Vortex Silicon Drift detector (Hitachi) in fluorescence mode. These energies were selected based on the reference compound spectra of the most likely Fe species to be found in both oxic and anoxic Fe containing soils to give the highest contrast between oxidation/chemical states (see Supplementary Material for detailed explanations, Supplementary Figure S3 and Supplementary Table S1). An alternative to analyzing less maps would be to collect μ-XRF maps at 7,134 eV instead of 7,132 eV and 7,138 eV, which is sensitive to FeIII-O species (Supplementary Figures S3B, C). The map step size was 30–75 μm with a dwell time from 25 to 50 ms. The angle subtended by the incident beam, sample, and detector was 90°, with the sample normally bisecting this arrangement.
The μ-XRF maps were processed at the end of each mapping and several spots (i.e., putative microsites, see § 2.7) were further selected to collect full μ-XANES spectra across the Fe K-edge (6,862–7,512 eV) that were used to reconstitute FeII and FeIII species maps using XANES fitting (see § 2.7). Scans were background subtracted and normalized using ATHENA (Demeter v0.9.24) (Ravel and Newville, 2005).
2.7 Data processing approach
In a fluorescence image map, each pixel registers the respective Fe fluorescence peak intensity at the incident energy. Thus, in the multi-energy X-ray fluorescence maps, each pixel registers a set of Fe intensities for each incident energy, resulting in a shortened spectrum of Fe fluorescence intensity as a function of energy, similar to a XANES spectrum. Because, the μ-XRF maps were collected at six different energies (7,116, 7,123, 7,127, 7,132, 7,138, and 7,145 eV), each pixel registers the equivalent of a six-point XANES spectrum. Thus, data processing of the Fe K-edge multiple energy μ-XRF maps consist of fitting the six-point XANES spectrum of each pixel. Fe K-edge multiple energy μ-XRF maps were analyzed first via Simplex Volume Maximization (SiVM) and second via XANES fitting, using the MicroAnalysis Toolkit (Webb, 2011), to assess spatial relationships of similarities and differences in oxidation states/chemical forms and, thereby, identify spatial heterogeneities composed of contrasted redox with the background, corresponding to putative anoxic microsites. This method provides a reliable estimation of the spatial distribution of Fe redox for each pixel, where measuring the full μ-XANES spectrum of each pixel (i.e., 30–75 μm) across the analyzed sample (up to 100 cm long) is not possible.
2.7.1 Simplex volume maximization fitting
The SiVM method is a non-negative matrix factorization algorithm which, from given collection of data points, geometrically selects the data points that are furthest away from each other in multi-dimensional space, within a user-defined noise threshold (Alfeld et al., 2017). This process effectively selects a set of endmembers, where all of the data points can be calculated as a linear-combination of these endmembers. In this study, data points correspond to the set of Fe fluorescence intensities at each of the incident collection energies (i.e., equivalent of a six-point XANES spectrum). The SiVM fitting then reconstructs endmember maps, that show the spatial distribution of each selected endmember. Each endmember map corresponds to a Fe component of SiVM fitting. This method is a rapid process to identify putative redox anomalies and, thereby, provide a perfect guide for selecting putative microsites for deeper analyses, such as XANES.
2.7.2 XANES fitting
This fitting method compares the set of Fe fluorescence intensity (i.e., equivalent of a six-point XANES spectrum) of each pixel with a set of selected full XANES spectra of reference compounds. This approach is based on Linear Combination-Least Squares fitting to estimate the relative proportion of each selected Fe-species (i.e., full XANES reference compound spectra) contributing to the Fe six-point XANES spectrum within each pixel (Cohen et al., 2020). For example, the selected full XANES reference compound spectra to fit the six-point XANES spectra of each pixel of the Fe mapping of synthetic core corresponds to the full μ-XANES spectra collected from FeIII–(hydroxy)oxide, FeII-S, and FeIICO3 microsites in FeIII-free sand core (Supplementary Figures S2). XANES fitting reconstructs maps exhibiting the spatial distribution of each selected Fe-species, where each selected Fe-species represents a Fe component of XANES fitting. The efficiency of this method is directly dependent on the selected library of full XANES spectra of reference compound, which may include reference compounds and/or full XANES spectra obtained from putative redox anomalies previously highlighted by SiVM or similar fitting methods. We highly recommend to systematically collect multiple full μ-XANES spectra across the analyzed sample from multiple putative redox anomalies for validating the choice of Fe reference compound for the XANES fitting.
2.7.3 Comparing SiVM fitting with XANES fitting
While each Fe component of XANES fitting is clearly defined by the XANES reference compound spectrum selected, Fe components of SiVM are not identified directly. However, each SiVM fitting Fe component should correspond to a XANES fitting Fe component (or constant mixture of components). The contribution (relative to total Fe counts) of each Fe component of SiVM fitting was then compared with the contribution (relative to total Fe counts) of selected components of XANES fitting in each pixel via correlation plots. An example of this correlation plot is provided in Supplementary Material, based on the μ-XRF mapping of FeII-S, FeIICO3, and FeIII–(hydroxy)oxide microsites in the FeIII-free sand (Supplementary Figures S4, S5) and Fe-“rich” smectite sand (Supplementary Figures S6, S7) synthetic cores. The plots showing the correlation curve, concentrating the maximum of correlated points (i.e., pixel), with the slope closest to 1 were retained, identifying the Fe component of SiVM fitting that approaches the most to FeII-S, FeIICO3, and FeIII–(hydroxy)oxide component of XANES fitting (Supplementary Figures S4, S6). Then, to verify the accuracy of a Fe component detected to represent a distinct group of redox microsites, the Fe component map of SiVM fitting was compared to the corresponding selected compound component map of XANES fitting (Supplementary Figures S5, S7). The presence of anoxic microsites is validated only if the spatial distribution of the contribution of the Fe component composing these anoxic microsites is similar using both fitting methods. Then, the 2D surface area occupied by a distinct group of anoxic microsites is normalized to the total area of the core, to quantify their relative proportion in 2D.
3 Results
3.1 Fe K-edge X-ray mapping as solid phase forensic evidence of anoxic microsites
Fe K-edge multiple energy μ-XRF maps of a synthetic column of coarse aquifer sand containing reducing organic-rich lenses (i.e., microsites) from Riverton, WY (Kumar et al., 2020), and under oxygenated hydrologic upflow simulated in the laboratory, are displayed in Figure 2. At 7,123 and 7,127 eV, X-ray energy is preferentially absorbed by FeII species, and possibly FeII−III-clays (Supplementary Figures S3A, B). Thus, the higher intensity at 7,123 eV in the column microsite compared to the microsite-sand interface, and the inverse pattern observed at 7,127 eV, clearly suggests the occurrence of different FeII-species composition in the microsite core vs. the interface. FeII-S species (i.e., FeIIS2, FeIIS (FeIIFeIII2S4) are the only FeII species whose absorption intensity does not increase between 7,123 and 7,127 eV (Supplementary Figure S3A). Other FeII-species (such as FeII-carbonate, FeII-phosphate, FeII-C, FeII-hydroxide, FeII-sulfate) and FeII−III-clay species preferentially absorb X-rays at 7,127 eV rather than 7,123 eV (Supplementary Figure S3A). Thus, although the core of the microsite primarily comprised FeII-S species, another FeII-species was preferentially accumulated at the interface. The accumulation of FeII-species at the interface upstream of the microsite, that was continuously exposed to influent oxygenated water, suggests the presence of FeII-species that are relatively resistant to oxidation, such as FeII-C or FeII−III-clay species. In this context, the spatial distribution of different FeII-species constitutes forensic evidence of the presence of anoxic microsites and the spatial distribution of their internal redox chemistry.
At 7,134 eV, X-ray energy is preferentially absorbed by FeIII-O species (Supplementary Figures S3B, C). Thus, the preferential decrease of X-ray energy absorption intensity at 7,134 eV at the microsite-sand interface downstream (compared to upstream) of the microsite suggests a depletion of FeIII-O species. This is not surprising as oxygen has likely been consumed due to anoxic conditions in and downstream the microsite. Indeed, Babey et al. (2022) demonstrated that the aquifer sediments located downstream the anoxic microsite could develop secondary reducing zones. The depletion of FeIII-O species offers another piece of forensic evidence to help identify and characterize anoxic microsites, and in this case, indicates the direction of flow through the reduced microenvironment.
3.2 Refinement in data processing for detection and quantification of Fe-reducing microsites
Visual contrasting of μ-XRF maps from different Fe K-edge energies is rarely conclusive and requires fitting all multiple energy maps to reconstruct the spatial distribution of Fe to detect microsites containing different FeII and FeIII species. Contrasting the FeII and FeIII microsites is further challenged by the likely presence of Fe in the surrounding matrix (e.g., silicate clays), that may obscure signatures of anoxic microsites. In this part, the Fe K-edge multiple energy μ-XRF mapping of FeII and FeIII microsites in synthetic cores was analyzed to test our methodology and data processing approach to detect redox microsites in Fe-“poor” and Fe-“rich” environments. As previously underlined in §3.1, a shift in absorbed X-ray energy between FeII-S species and other FeII-species (such as siderite, FeIICO3) enables identification of the spatial distribution of microsites containing different FeII-species. Thus, our initial approach compared maps of each Fe component via different fitting methods (XANES and SiVM fitting) with the actual and known locations of FeII-S, FeIICO3, and FeIII–(hydroxy)oxide microsites to validate and improve the data processing approach for detecting different redox microsites.
Eliminating false positive redox microsites based on comparison of the same Fe component obtained from XANES and SiVM fitting. To compare maps of the spatial distribution of FeII-S, FeIICO3, and FeIII–(hydroxy)oxide components of XANES and SiVM fitting without potential interferences from Fe-background, maps collected in the FeIII-free sand synthetic core were compared first (Figure 3 and Supplementary Figure S5). Overall, the XANES and SiVM maps of each Fe component compared well, and the spatial distribution of FeII and FeIII microsites were accurately identified. However, some low-intensity inconsistencies were also observed. The SiVM fitting identified the presence of low-intensity FeII-S microsites, that in fact were FeIICO3 (Supplementary Figure S8), and the presence of low-intensity FeIICO3 (Supplementary Figure S9) and FeIII–(hydroxy)oxide (Supplementary Figure S10) microsites that were in fact FeII-S. Similarly, XANES fitting identified the presence of low-intensity FeIICO3 microsites that were in fact FeIII–(hydroxy)oxide (Supplementary Figure S9). These inconsistencies are referred to as false positive microsites. Theoretically, if the contribution of each Fe component was properly detected from both fitting methods, i.e., SiVM and XANES, the correlation plot between both methods should show y = x, i.e., a slope of 1. To suppress the low-intensity false positives, only the cloud of points (i.e., pixels) near the y = x line was selected for re-mapping. The re-mapping of spatial distribution of the contribution of each Fe component using exclusively the correlated points between XANES and SiVM fitting successively removed the false positive microsites and identified accurately the real locations of FeII-S, FeIICO3, and FeIII–(hydroxy)oxide microsites (Supplementary Figure S8, Supplementary Figure S9, and Supplementary Figure S10, respectively).
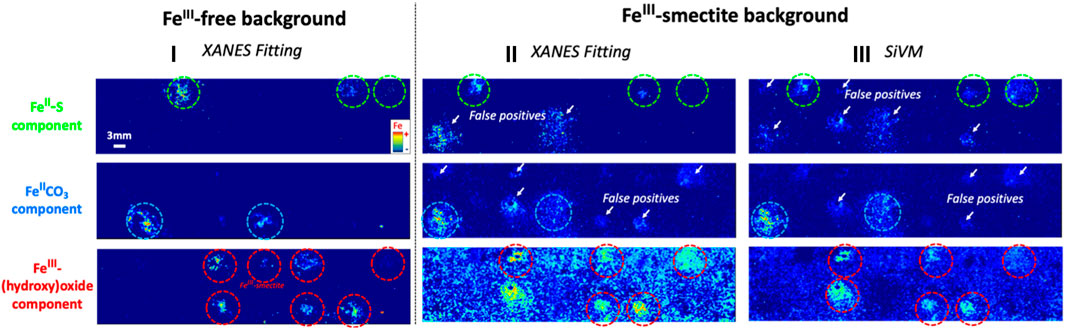
FIGURE 3. Initial (without refinement of data processing) map of the spatial distribution of the contribution of Fe components of XANES and SiVM fitting showing false positive redox microsites in FeIII-rich surrounding environment with classical data processing. (i) FeII-S (top), FeIICO3 (middle), and FeIII-(hydroxy)oxide (bottom) component contribution spatial distribution maps of XANES fitting of Fe K-edge multiple energy μ-XRF mapping of FeII-S, FeIICO3, and FeIII-(hydroxy)oxide microsite in the FeIII-free sand synthetic core; (ii) Fe component maps of XANES fitting in the FeIII-smectite sand synthetic core; (iii) And for comparison, Fe component maps of SiVM fitting in the FeIII-smectite sand synthetic core are also displayed. The real locations of FeII-S, FeIICO3, and FeIII-(hydroxy)oxide microsites are marked with green, blue, and red dashed circle, respectively, while the false positive redox microsite are marked with white arrows. A FeIII-smectite microsite has also been added along the sand core.
Eliminating false positive redox microsites based on comparison of distinct Fe component. Conversely to the FeII-S, FeIICO3, and FeIII–(hydroxy)oxide component maps of XANES fitting in the FeIII-free sand synthetic core (proxy of Fe-“poor” background), the spatial distribution of FeII-S, FeIICO3, and FeIII–(hydroxy)oxide microsites of XANES fitting in the FeIII-smectite sand synthetic core (1.6% Fe background; proxy of higher Fe background) showed significant false positives (Figure 3). These false positives exhibited a similar intensity range compared to the real microsites, which prevents the distinction between real FeII-S, FeIICO3, and FeIII–(hydroxy)oxide microsite and their false positives based on simple thresholding of XRF intensity. SiVM fitting in FeIII-“rich” smectite sand environment also showed significant false positives (Figure 3). However, the nature, spatial distribution, and intensity of the false positives differed between XANES and SiVM fitting. Theoretically, if the contribution of each Fe component was properly distinguished in each pixel, no correlation should be observed while comparing with the contribution of a distinct Fe component, regardless of the fitting method. The map of the spatial distribution of the contribution of a specific Fe component (from both fitting methods, i.e., SiVM and XANES) is thus compared with the map of the spatial distribution of the contribution of each distinct Fe component via correlation plot from both SiVM and XANES fitting (Figure SM-11, SM-12, and SM-13). For example, FeIICO3 component map of XANES fitting is compared separately to FeII-S and FeIII-(hydroxy)oxide component map of XANES and SiVM fitting. Using Fe component maps generated from both fitting methodologies increases the statistical comparison. Comparisons that showed correlation curve(s) were then selected for re-mapping of each Fe component (see detailed explanations in Supplementary Material for further information; Figure SM-12 and SM-13). Then, the spatial distribution of the contribution of the same Fe component re-mapped from different paths of re-mapping was compared and their correlation curve selected for removing the last false positives (Figure SM-14, SM-15, and SM-16 for FeII-S FeIICO3, FeIII–(hydroxy)oxide component). Finally, FeII-S, FeIICO3, and FeIII–(hydroxy)oxide microsite maps were reconstructed following this new refined data processing approach and evidently all false positive redox microsites were successfully removed (Figure 4), validating this refinement in data processing of µXRF maps for detection and quantification of redox microsites using Fe.
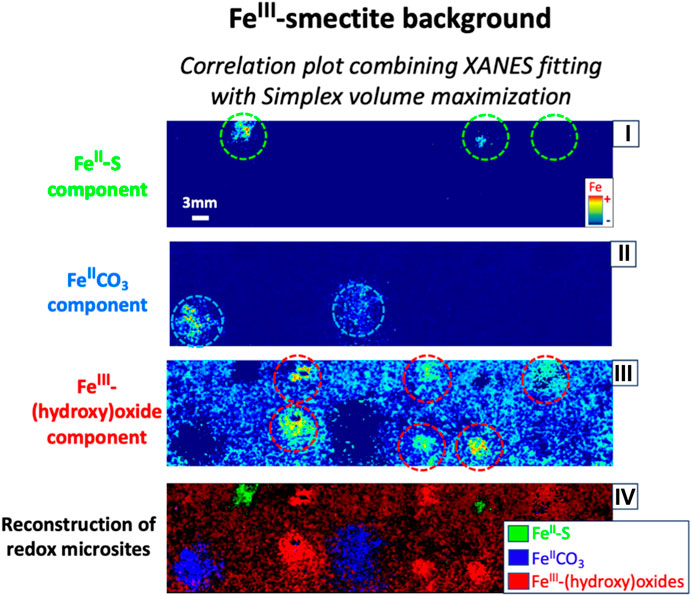
FIGURE 4. Reconstructed maps of the spatial distribution of the Fe component contribution along the new refined data processing, eliminating false positive anoxic microsite. Reconstruction of (i) FeII-S, (ii) FeIICO3, and (iii) FeIII-(hydroxy)oxide component contribution spatial distribution maps based on comparison of distinct Fe component combining either XANES and/or SiVM fitting of Fe K-edge multiple energy μ-XRF map of FeII-S, FeIICO3, and FeIII-(hydroxy)oxide microsite in the FeIII-smectite sand synthetic core; (iv) For comparison, the final reconstructed map of redox microsite spatial distribution is displayed. The real locations of FeII-S, FeIICO3, and FeIII-(hydroxy)oxide microsites are marked with green, blue, and red dashed circle, respectively. This figure shows clearly that the new refined data processing approach eliminates all false positive anoxic microsites.
3.3 Novel visualization of Fe-reducing microsites from natural soil
The new refined data processing approach described above for synthetic cores was systematically applied to successfully detect anoxic microsites from natural cores. The choice of reference compounds of Fe species for the XANES fitting is systematically based on analysis of full μ-XANES spectra across the analyzed sample from multiple putative redox anomalies previously highlighted by SiVM fitting at the end of each mapping. The results below highlight the ability of our X-ray mapping approach to detect and quantify the anoxic microsites in natural systems. Given this approach has been successful, our future investigations will focus on characterizing the internal biogeochemical mechanisms of anoxic microsites spatially localized and the impact of these microsites on the biogeochemical processes at the scale of ecosystems probed below.
Detection and quantification of anoxic microsites from toeslope to floodplain in a Colorado mountain watershed. The spatial distribution of Fe species in cores collected from the toeslope and down-gradient floodplain in a mountainous watershed, East River (CO), were mapped and reconstructed (Figure 5). Fe in these cores mainly occurred as FeIII-(hydroxy)oxides, FeII/III-silicates, and FeII species. The full μ-XANES spectra of FeII microsites shown a mixture of FeII and FeIII, which make the characterization of the nature of FeII species complicated. While the Linear Combination-Least Squares fitting of the full μ-XANES spectra of FeII microsites do not provide clear differentiation on the characterization of FeII-species, the best XANES fitting of Fe K-edge multiple energy μ-XRF mapping was clearly obtained by including FeII-S component. In opposite, including other FeII-species component into XANES fitting of Fe K-edge multiple energy μ-XRF mapping did not reconstruct the putative redox anomalies previously highlighted by SiVM fitting that we confirmed to be FeII-microsites by collecting the full μ-XANES spectra.
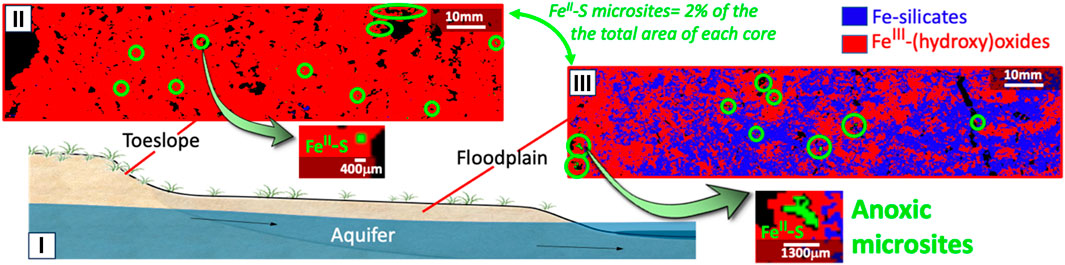
FIGURE 5. Reconstructed map of the spatial distribution of the contribution of each Fe species in cores collected from toeslope to floodplain in Colorado mountain watershed (CO). (i) Schema of the field site for an easy understanding of the location of each core from the field; Reconstructed map of the spatial distribution of the contribution of the Fe species along the core collected from: (ii) Toeslope, and (iii) floodplain cores. The locations of FeS microsites are marked with green circles, and one FeS microsite from each core has been randomly selected for a zoomed-in display.
In the toeslope, FeIII-(hydroxy)oxides dominated, whereas, soil Fe in the floodplain mainly occurred as FeII/III-silicates. Floodplains typically remain saturated in water for certain period of the year, limiting oxygen supply, which could explain the lower abundance of FeIII-(hydroxy)oxides that would be susceptible to reduction under anoxic conditions. In contrast, the drier conditions on the toeslope would not traditionally be associated with soil oxygen limitations. However, FeII-S microsites were detected and accounted for 2% of the surface area in cores from both sites (Figure 5). Although, it is necessary to analyze multiple cores to obtain statistical representative of (in this case) FeII-S microsites, these preliminary results indicate a high frequency of anoxic microsites, even in the drier toeslope soil that typically would be expected to be fully oxic. Also, these investigations suggest a change in the size distribution of FeII-S microsites in soil cores with larger anoxic (i.e., FeII-S) microsites being more frequently distributed in floodplains.
Spatial distribution of reduced Fe in aggregates in well-aerated California oak savanna soils. The reconstruction maps of Fe species distribution inside aggregates from the toeslope and ridge soils of an oak savanna, Stanford (CA) are displayed in Figure 6. Although, oak savanna is not traditionally associated with soil oxygen limitations, soil aggregates show significant proportions of reduced Fe, suggesting current or past development of anoxic microsites inside the soil aggregates.
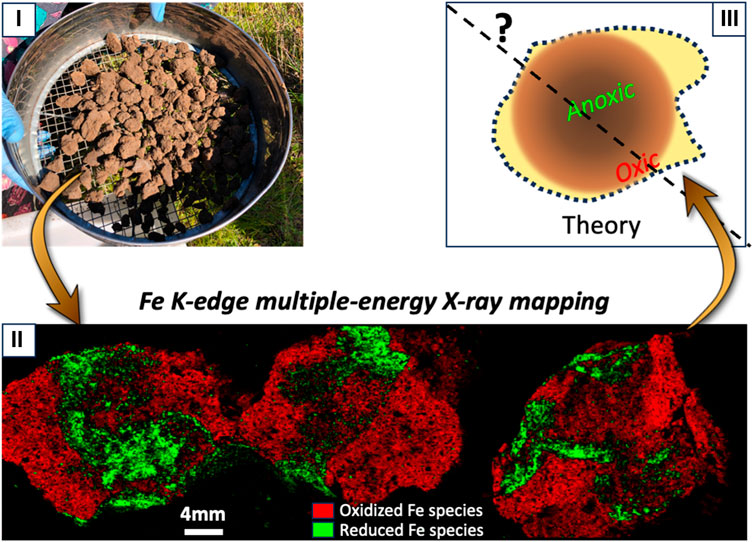
FIGURE 6. Reconstructed map of the spatial distribution of the contribution of oxidized vs reduced Fe species within well-aerated aggregates in California oak savanna. (i) Picture shows soil aggregates collected in the field; (ii) Reconstructed map of the spatial distribution of the contribution of Fe species in aggregates collected from the toeslope position (left and center) and ridge position (right). Green represents reduced Fe species, whereas red represents oxidized Fe species; (iii) Schema of the theoretical structure of the redox distribution typically hypothesized to develop within soil aggregates are displayed to put results in perspective.
4 Discussion
4.1 Making hidden Fe-reducing microsites visible
Chemically specific X-ray imaging can record “forensic” evidence of Fe and S reducing microsites, ranging from μm to cm in size (length/width), from different soils and environments (Figure 5; 6). The location, along with the size, ultimately determines the susceptibility of the anoxic microsites for disturbance and the absolute volume over which anaerobic processes may occur (Lacroix et al., 2023). In our study, for example, the contrast of microsite size between toeslope and floodplain could influence the impact of anoxic microsites might have on biogeochemical cycling for each soil type, and consequently, constitutes a fundamental parameter to include in models. Although, direct evidence of anoxic microsite sizes and distribution is crucially missing to support model parametrization (Lacroix et al., 2023), there are many approaches for including their functional contributions. For example, certain models based on spatially discretizing soil into distinct biogeochemical environments (Currie, 1961; Parkin, 1987) are dependent on aggregate size (Wang et al., 2019). Similarly, the 3-D angular pore network model was expanded to include interactions of aggregates of different sizes and orientations (Ebrahimi and Or, 2016) and upscaled to demonstrate, how aggregate size distributions alters anoxic microsite distribution and, thus, biogeochemical gas fluxes from soil profiles (Ebrahimi and Or, 2018a). Revealing the distribution and size of Fe and S reducing microsites could thus drastically improve the accuracy of biogeochemical models.
Our X-ray mapping revealed also the spatial distribution of Fe-reducing microsites inside aggregates from an oak savanna soil. Aggregates typically predominantly contain clay particles and organic matter adhering together and expanding/contracting through actions of plant roots, soil organisms, and/or hydration and thermal cycles (Brady and Weil, 2008; Totsche et al., 2018). As a result of their composition (i.e., small pores, enhanced water retention), aggregates typically experience limited O2 supply (Currie, 1961; Sexstone et al., 1985; Ebrahimi and Or, 2016; Ebrahimi and Or, 2018b; Keiluweit et al., 2018), and favor the formation of anoxic microsites in the interior of these aggregates (Currie, 1961; Sexstone et al., 1985; Ebrahimi and Or, 2018b). It is commonly postulated that due to diffusion kinetics, anoxic conditions develop preferentially in the core of aggregates (Currie, 1961; Figure 6). Microelectrode measurements confirmed localized anoxia at the interior of both saturated (Greenwood and Goodman, 1967) and unsaturated (Sexstone et al., 1985) aggregates. Our results, however, challenge this classical view of the anaerobicity inside aggregates, suggesting preferential spatial distribution of Fe-reducing conditions that are not specifically concentrated in the center of the aggregate (Figure 6). Instead, we hypothesize that Fe reducing conditions depend on heterogeneous pore structure (preferential water transport paths and/or compaction zones), as well as heterogeneous organic matter and root spatial distribution. Thus, the complementary approaches are necessary to interpret the insights gained from X-ray 2D imaging. For example, we recommend future research to overlap the 2D imaging techniques detecting anoxic microsites with those revealing spatial distribution of physicochemical parameters (such as organic matter and pore structure; Vongsvivut et al., 2019; Noël et al., 2022), in order to identify the key “drivers” that control the spatial distribution of the redox heterogeneity. Similarly, the omic methods such as the meta-transcriptomics and fluorescence methods could identify active microbial communities (Djemiel et al., 2022; Rosado-Porto et al., 2022). Coupling these microbial measurements at the time of soil core collection could help determine if the biogeochemical products composing anoxic microsites are from active anaerobic microbial processes in soils, providing a critical linkage of mapped element species with the timeframe of redox processes.
4.2 Extending solid-phase forensic evidence of a larger variability of anoxic microsites
Lacroix et al. (2023) highlighted three domains of variability in how anoxic microsites are manifested: anoxic microsite distribution, redox gradient magnitude, and temporality. As discussed in §4.1, Fe K-edge X-ray mapping largely covers the detection of anoxic microsite distribution, including the size and location of anoxic microsites. However, Fe reduction represents only one set of anoxic processes among many. Anoxic microsites would be expected to host gradients of redox potentials below the anoxic threshold with multiple chemical transformations at various distances from each other (Lacroix et al., 2023). Driven by electron donor/acceptor concentrations and their ability to move through the soil pore space (i.e., exhibiting diffusion vs. advective transport; Keiluweit et al., 2017), redox gradients (i.e., the magnitude of redox decline over a given distance) influence the products generated inside anoxic microsites and the potential for those products to diffuse to the oxic surrounding environment (Pallud et al., 2010a; Harris et al., 2021; Naughton et al., 2021). For example, a relatively rapid increase in concentration of electron donors within a model aggregate system would promote a sharp redox gradient (i.e., a large redox decline over a relatively small distance), favoring FeIICO3 neoformation, whereas FeIICO3 is unlikely to precipitate in a system with a more gradual transition of redox potentials (Pallud et al., 2010b). Similarly, the interaction of hydrogen sulfide with FeIII-oxides is dependent on gradient magnitude, with sharper gradients (i.e., shorter distances between sulfidic species and Fe(III) species) that are potentially more likely to support coprecipitation of metastable FeII-S (Lacroix et al., 2023). Thus, the occurrence and distribution of biogeochemical products, such as FeIICO3 (Figure 4) and FeII-S (Figure 5), could record indirect “forensic” evidence of redox gradient magnitude. Furthermore, the development of the new capabilities combining the High Energy Resolution Fluorescence Detection (HERFD) XANES with µ-XRF map could improve spectral energy resolution as compared to conventional XANES spectroscopy (Edwards et al., 2022), improving sensitivity to local- and intermediate range structure/composition, and thus the detection of different Fe species (as an example). However, Fe K-edge X-ray mapping alone is not sufficient to capture the large set of different redox potentials and their associated redox gradient. We envision that spatial correlation of multiple energy X-ray maps of multiple redox-sensitive elements with varying redox potentials (e.g., Mn, Fe, S and trace metal (loid)s; Jones et al., 2018; Noël et al., 2017a) would extend our ability to quantify the 2D distribution of anoxic microsites with different redox potentials (Figure 7), redox gradients and, thereby, biogeochemical functions. Additionally, overlapping multiple energy μ-XRF 2D maps of different redox-sensitive elements could rule out false positives and complement the information gained individually by each element. As an example, while Fe multiple energy µ-XRF map cannot distinguish Fe-monosulfide from Fe-disulfide, the µ-XRF map at different S K-edge energies could confirm the presence of Fe-sulfides detected by Fe µ-XRF map and determine their nature (i.e., FeS vs Fe2S; Noël et al., 2017a).
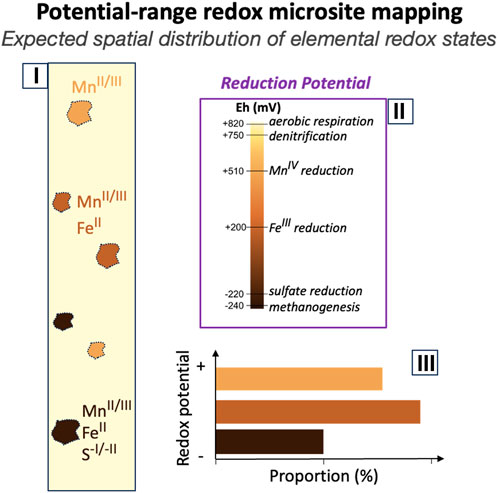
FIGURE 7. Illustration of the expected detection and 2D quantification of anoxic microsites with different redox potential based on spatial correlation of X-ray maps of multiple redox-sensitive elements with varying redox potentials. (i) The core illustrates the detection of spatial distribution of anoxic microsites with varying redox potentials; (ii) Representation of redox gradients of anoxic microsites, hosting a multitude of microbial metabolisms; (iii) And histograms illustrating 2D area surface proportion of each anoxic microsites with varying redox potentials, normalized to the total area of the core.
In our study, we have clearly shown that Fe K-edge X-ray mapping records “forensic” evidence of anoxic microsites ranging from a few hundred μm to cm scales (Figure 4). We cannot exclude that smaller anoxic microsites may also exist and were not captured with this approach. Thus, we cannot assess the potential relevance or distribution of anoxic microsites <100 μm, but given the size of plant root hairs, microbial cells, organic compounds, and mineral particles it is likely that the abundance and biogeochemical relevance of anoxic microsites is potentially even larger than what is currently suspected and indicated by results in this study. Expanding the range of anoxic microsite sizes (especially smaller) detectable using X-ray mapping requires refinement of the coring methodologies and sample preparation approaches. Coring techniques should be designed to limit physical (e.g., compaction) and chemical (e.g., change in oxygen availability) alterations of cores. Preparation approaches for sectioning samples should avoid physical smearing, which will particularly help with preserving smaller microsites. We note that maintaining the sample physical integrity while producing a plane surface is extremely challenging; a difference in surface topography along a sliced core may directly impact the spatial resolution for detecting anoxic microsites, as well quantifying the concentration of elements within these microsites.
5 Conclusion
Decades after the first direct measurement (Sexstone et al., 1985), anoxic microsites are yet to be integrated into mainstream soil biogeochemistry (Lacroix et al., 2023). In this study, we have systematically demonstrated the capability of synchrotron X-ray mapping to quickly detect solid phase “forensic” evidence of μm-to cm-scale Fe-reducing microsites along multi-decimeter long soil core slices. Our results show the presence of Fe reducing microsites in predominantly oxic soils such as from an oak savanna and the toeslope soils of a mountainous watershed (Figure 5; 6), where anaerobicity would typically not be expected. Our first investigation revealed μm2 to cm2 sized reducing Fe microsites comprised up to 2% of the whole soil core surface collected from both the drier toeslope and the wetter floodplain (mountainous watershed, East River valley, CO; Figure 5). And, a transection of aggregates (oak savanna, Stanford Dish Area, CA) exposed to predominantly oxic conditions, revealed a significant proportion of Fe reduced surface (Figure 6). This indicates that anoxic microsites represent a non-negligible part of the total soil volume, even in presumably “oxic” soils and, thus, could have effects on the fate and transport of critical elements and compounds and thus requires further investigation. Empirical data obtained considering various variables would ultimately help in parametrizing models that can include functions and potential impacts of microsites in biogeochemical models.
Data availability statement
The original contributions presented in the study are included in the article/Supplementary Material, further inquiries can be directed to the corresponding author.
Author contributions
VN: Conceptualization, Funding acquisition, Methodology, Supervision, Writing–original draft, Writing–review and editing, Investigation. KB: Funding acquisition, Writing–review and editing. HN: Writing–review and editing, Investigation. EL: Writing–review and editing, Investigation. MA: Writing–review and editing, Investigation. NK: Writing–review and editing, Investigation. SF: Conceptualization, Writing–review and editing. SW: Conceptualization, Methodology, Writing–review and editing.
Funding
The author(s) declare financial support was received for the research, authorship, and/or publication of this article. Funding was provided by the U.S. Department of Energy (DOE) office of Biological and Environmental Research (BER), Environmental System Sciences Division, through its support of the SLAC Floodplain Hydro- Biogeochemistry Science Focus Area (SFA) under Contract No. DE- AC02–76SF00515. The SSRL Structural Molecular Biology Program is supported by the DOE Office of Biological and Environmental Research, and by the National Institutes of Health, National Institute of General Medical Sciences (P30GM133894). The contents of this publication are solely the responsibility of the authors and do not necessarily represent the official views of NIGMS or NIH.
Acknowledgments
We gratefully acknowledge Sharon Bone and Nicholas Edwards, and the technical staff at SSRL for their technical support during the X-ray fluorescence mapping measurements.
Conflict of interest
The authors declare that the research was conducted in the absence of any commercial or financial relationships that could be construed as a potential conflict of interest.
Publisher’s note
All claims expressed in this article are solely those of the authors and do not necessarily represent those of their affiliated organizations, or those of the publisher, the editors and the reviewers. Any product that may be evaluated in this article, or claim that may be made by its manufacturer, is not guaranteed or endorsed by the publisher.
Supplementary material
The Supplementary Material for this article can be found online at: https://www.frontiersin.org/articles/10.3389/fenvc.2024.1329887/full#supplementary-material
References
Alfeld, M., Wahabzada, M., Bauckhage, C., Kersting, K., van der Snickt, G., Noble, P., et al. (2017). Simplex Volume Maximization (SiVM): a matrix factorization algorithm with non-negative constrains and low computing demands for the interpretation of full spectral X-ray fluorescence imaging data. Microchem. J. 132, 179–184. doi:10.1016/j.microc.2017.02.001
Alldredge, A. L., and Cohen, Y. (1987). Can microscale chemical patches persist in the sea? Microelectrode study of marine snow, fecal pellets. Science 235, 689–691. doi:10.1126/science.235.4789.689
Angle, J. C., Morin, T. H., Solden, L. M., Narrowe, A. B., Smith, G. J., Borton, M. A., et al. (2017). Methanogenesis in oxygenated soils is a substantial fraction of wetland methane emissions. Nat. Commun. 8, 1567. doi:10.1038/s41467-017-01753-4
Arah, J. R. M., and Smith, K. A. (1989). Steady-state denitrification in aggregated soils: a mathematical model. J. Soil Sci. 40, 139–149. doi:10.1111/j.1365-2389.1989.tb01262.x
Arah, J. R. M., and Vinten, A. J. A. (1995). Simplified models of anoxia and denitrification in aggregated and simple-structured soils. Eur. J. Soil Sci. 46, 507–517. doi:10.1111/j.1365-2389.1995.tb01347.x
Arguez, A., Durre, I., Applequist, S., Vose, R. S., Squires, M. F., Yin, X., et al. (2012). NOAA’s 1981-2010 U.S. Climate Normals: an overview. Bull. Am. Meteorological Soc. 93 (11), 1687–1697. doi:10.1175/bams-d-11-00197.1
Babey, T., Boye, K., Tolar, B., Engel, M., Noël, V., Perzan, Z., et al. (2022). Simulation of anoxic lenses as exporters of reactivity in alluvial aquifer sediments. Geochimica Cosmochimica Acta 334, 119–134. doi:10.1016/j.gca.2022.07.018
Bianchi, D., Weber, T. S., Kiko, R., and Deutsch, C. (2018). Global niche of marine anaerobic metabolisms expanded by particle microenvironments. Nat. Geosci. 11, 263–268. doi:10.1038/s41561-018-0081-0
Boye, K., Noël, V., Tfaily, M. M., Bone, S. E., Williams, K., Bargar, J. R., et al. (2017). Thermodynamically controlled preservation of organic carbon in floodplains. Nat. Geosci. 10, 415–419. doi:10.1038/ngeo2940
Brady, N. C., and Weil, R. R. (2008). The nature and properties of soil. 14 ed. Upper Saddle River, New Jersey: Prentice-Hall.
Capo, E., Cosio, C., Gascón Díez, E., Loizeau, J.-L., Mendes, E., Adatte, T., et al. (2023). Anaerobic mercury methylators inhabit sinking particles of oxic water columns. Water Res. 229, 119368. doi:10.1016/j.watres.2022.119368
Cohen, S. X., Webb, S. M., Gueriau, P., Curis, E., and Bertrand, L. (2020). Robust framework and software implementation for fast speciation mapping. J. Synchrotron Rad 27, 1049–1058. doi:10.1107/s1600577520005822
Currie, J. A. (1961). Gaseous diffusion in the aeration of aggregated soils. Soil Sci. 92 (1), 40–45. doi:10.1097/00010694-196107000-00006
Davidson, E. A. (1992). “Pulses of nitric oxide and nitrous oxide flux following wetting of dry soil: an assessment of probable sources and importance relative to annual fluxes,” in Ecological Bulletins 42, 149–155. Available at: https://www.jstor.org/stable/20113115
Djemiel, C., Dequiedt, S., Karimi, B., Cottin, A., Horrigue, W., Bailly, A., et al. (2022). Potential of meta-omics to provide modern microbial indicators for monitoring soil quality and securing food production. Front. Microbiol. 13, 889788. doi:10.3389/fmicb.2022.889788
Ebrahimi, A., and Or, D. (2016). Microbial community dynamics in soil aggregates shape biogeochemical gas fluxes from soil profiles - upscaling an aggregate biophysical model. Glob. Change Biol. 22 (9), 3141–3156. doi:10.1111/gcb.13345
Ebrahimi, A., and Or, D. (2018a). Dynamics of soil biogeochemical gas emissions shaped by remolded aggregate sizes and carbon configurations under hydration cycles. Glob. Change Biol. 24 (1), e378–e392. doi:10.1111/gcb.13938
Ebrahimi, A., and Or, D. (2018b). On upscaling of soil microbial processes and biogeochemical fluxes from aggregates to landscapes. J. Geophys. Res. Biogeosciences 123, 1526–1547. doi:10.1029/2017jg004347
Edwards, N. P., Bargar, J. R., van Campen, D., van Veelen, A., Sokaras, D., Bergmann, U., et al. (2022). A new μ -high energy resolution fluorescence detection microprobe imaging spectrometer at the Stanford Synchrotron Radiation Lightsource beamline 6-2. Rev. Sci. Instrum. 93 (8), 083101. doi:10.1063/5.0095229
Engel, M., Noël, V., Pierce, S., Kovarik, L., Kukkadapu, R. K., and Lezama-Pacheco, J. S. (2023). Persistence of natural ferrihydrite nano-colloids in anoxic groundwater: role of Si and organic matter. Water Research 238, 119990. doi:10.1016/j.watres.2023.119990
Falco, N., Wainwright, H., Dafflon, B., Léger, E., Peterson, J., Steltzer, H., et al. (2019). Investigating microtopographic and soil controls on a mountainous meadow plant community using high resolution remote sensing and surface geophysical data. J. Geophys. Res. Biogeosciences 124, 1618–1636. doi:10.1029/2018jg004394
Farfan, G. A., Apprill, A., Webb, S. M., and Hansel, C. M. (2018). Coupled X-ray fluorescence and X-ray absorption spectroscopy for microscale imaging and identification of sulfur species within tissues and skeletons of scleractinian corals. Anal. Chem. 90 (21), 12559–12566. doi:10.1021/acs.analchem.8b02638
Farquharson, R., and Baldock, J. (2008). Concepts in modelling N2O emissions from land use. Plant Soil 309, 147–167. doi:10.1007/s11104-007-9485-0
Fox, P. M., Carrero, S., Anderson, C., Dewey, C., Keiluweit, M., Conrad, M., et al. (2022). Sulfur biogeochemical cycling and redox dynamics in a shale-dominated mountainous watershed. J. Geophys. Res. Biogeosciences 127 (6), e2021JG006769. doi:10.1029/2021jg006769
Gallorini, A., and Loizeau, J.-L. (2021). Mercury methylation in oxic aquatic macroenvironments: a review. J. Limnol. 80, 2007. doi:10.4081/jlimnol.2021.2007
Gallorini, A., and Loizeau, J.-L. (2022). Lake snow as a mercury methylation microenvironment in the oxic water column of a deep peri-alpine lake. Chemosphere 299, 134306. doi:10.1016/j.chemosphere.2022.134306
Ganesh, S., Bristow, L. A., Larsen, M., Sarode, N., Thamdrup, B., and Stewart, F. J. (2015). Size-fraction partitioning of community gene transcription and nitrogen metabolism in a marine oxygen minimum zone. ISME J. 9, 2682–2696. doi:10.1038/ismej.2015.44
Greenwood, D. J., and Goodman, D. (1967). Direct measurements of the distribution of oxygen in soil aggregates and in columns of fine soil crumbs. J. Soil Sci. 18 (1), 182–196. doi:10.1111/j.1365-2389.1967.tb01499.x
Hansel, C. M., Fendorf, S., Jardine, P. M., and Francis, C. A. (2008). Changes in bacterial and archaeal community structure and functional diversity along a geochemically variable soil profile. Appl. Environ. Microbiol. 74, 1620–1633. doi:10.1128/aem.01787-07
Harris, E., Diaz-Pines, E., Stoll, E., Schloter, M., Schulz, S., Duffner, C., et al. (2021). Denitrifying pathways dominate nitrous oxide emissions from managed grassland during drought and rewetting. Sci. Adv. 7 (6), eabb7118. doi:10.1126/sciadv.abb7118
Hausladen, D. M., and Fendorf, S. (2017). Hexavalent chromium generation within naturally structured soils and sediments. Environ. Sci. Technol. 51 (4), 2058–2067. doi:10.1021/acs.est.6b04039
Johnson, J. E., Savalia, P., Davis, R., Kocar, B. D., Webb, S. M., Nealson, K. H., et al. (2016). Real-time manganese phase dynamics during biological and abiotic manganese oxide reduction. Environ. Sci. Technol. 50 (8), 4248–4258. doi:10.1021/acs.est.5b04834
Jones, M. E., Nico, P. S., Ying, S., Regier, T., Thieme, J., and Keiluweit, M. (2018). Manganese-Driven carbon oxidation at oxic-anoxic interfaces. Environ. Sci. Technol. 52 (21), 12349–12357. doi:10.1021/acs.est.8b03791
Keiluweit, M., Gee, K., Denney, A., and Fendorf, S. (2018). Anoxic microsites in upland soils dominantly controlled by clay content. Soil Biol. Biochem. 118, 42–50. doi:10.1016/j.soilbio.2017.12.002
Keiluweit, M., Wanzek, T., Kleber, M., Nico, P., and Fendorf, S. (2017). Anaerobic microsites have an unaccounted role in soil carbon stabilization. Nat. Commun. 8, 1771. doi:10.1038/s41467-017-01406-6
Klawonn, I., Bonaglia, S., Brüchert, V., and Ploug, H. (2015). Aerobic and anaerobic nitrogen transformation processes in N2-fixing cyanobacterial aggregates. ISME J. 9, 1456–1466. doi:10.1038/ismej.2014.232
Kravchenko, A. N., Guber, A. K., Razavi, B. S., Koestel, J., Quigley, M. Y., Robertson, G. P., et al. (2019). Microbial spatial footprint as a driver of soil carbon stabilization. Nat. Commun. 10, 3121. doi:10.1038/s41467-019-11057-4
Kumar, N., Lezama-Pacheco, J. S., Noël, V., Dublet, G., and Brown, G. E. (2018). Sulfidation mechanisms of Fe(III)-(oxyhydr)oxide nanoparticles: a spectroscopic study. Environ. Sci. Nano. 5, 1012–1026. doi:10.1039/c7en01109a
Kumar, N., Noël, V., Planer- Friedrich, B., Besold, J., Bargar, J., Brown, G. E., et al. (2020). Redox heterogeneities promote thioarsenate formation and release into groundwater from low arsenic sediments. Environ. Sci. Technol. 54 (6), 3237–3244. doi:10.1021/acs.est.9b06502
Lacroix, E. M., Aeppli, M., Boye, K., Brodie, E., Fendorf, S., Keiluweit, M., et al. (2023). Consider the anoxic microsite: acknowledging and appreciating spatiotemporal redox heterogeneity in soils and sediments. ACS Earth Space Chem. 7 (9), 1592–1609. doi:10.1021/acsearthspacechem.3c00032
Lacroix, E. M., Mendillo, J., Gomes, A., Dekas, A., and Fendorf, S. (2022). Contributions of anoxic microsites to soil carbon protection across soil textures. Geoderma 425, 116050. doi:10.1016/j.geoderma.2022.116050
Leffelaar, P. A. (1986). Dynamics of partial anaerobiosis, denitrification, and water in a soil aggregate: experimental. Soil Sci. 142, 352–366. doi:10.1097/00010694-198612000-00004
Lensi, R., Clays-Josserand, A., and Monrozier, L. J. (1995). Denitrifiers and denitrifying activity in size fractions of a mollisol under permanent pasture and continuous cultivation. Soil Biol. biochem. 27, 61–69. doi:10.1016/0038-0717(94)00132-k
Masue-Slowey, Y., Kocar, B. D., Jofre, S. A. B., Mayer, K. U., and Fendorf, S. (2011). Transport implications resulting from internal redistribution of arsenic and iron within constructed soil aggregates. Environ. Sci. Technol. 45, 582–588. doi:10.1021/es1027663
Masue-Slowey, Y., Ying, S. C., Kocar, B. D., Pallud, C. E., and Fendorf, S. (2013). Dependence of arsenic fate and transport on biogeochemical heterogeneity arising from the physical structure of soils and sediments. J. Environ. Qual. 42, 1119–1129. doi:10.2134/jeq2012.0253
Michotey, V., and Bonin, P. (1997). Evidence for anaerobic bacterial processes in the water column: denitrification and dissimilatory nitrate ammonification in the northwestern Mediterranean Sea. Mar. Ecol. Prog. Ser. 160, 47–56. doi:10.3354/meps160047
Naughton, H. R., Keiluweit, M., Tfaily, M. M., Dynes, J. J., Regier, T., and Fendorf, S. (2021). Development of energetic and enzymatic limitations on microbial carbon cycling in soils. Biogeochemistry 153 (2), 191–213. doi:10.1007/s10533-021-00781-z
Noël, V., Boye, K., Kukkadapu, R. K., Bone, S., Lezama-Pacheco, J. S., Cardarelli, E., et al. (2017a). Understanding controls on redox processes in floodplain sediments of the Upper Colorado River Basin. Sci. Total Environ. 603-604, 663–675. doi:10.1016/j.scitotenv.2017.01.109
Noël, V., Boye, K., Kukkadapu, R. K., Li, Q., and Bargar, J. R. (2019). Uranium storage mechanisms in wet-dry redox cycled sediments. Water Res. 152, 251–263. doi:10.1016/j.watres.2018.12.040
Noël, V., Boye, K., Lezama-Pacheco, J. S., Bone, S., Janot, N., Cardarelli, E., et al. (2017b). Redox controls over the stability of U(IV) in floodplains of the upper Colorado river basin. Environ. Sci. Technol. 51 (19), 10954–10964. doi:10.1021/acs.est.7b02203
Noël, V., Druhan, J. L., Gundogard, A., Kovscek, A. R., Brown, G. E., and Bargar, J. R. (2022). Dynamic development of geochemical reaction fronts during hydraulic stimulation of shale. Appl. Geochem. 148, 105542. doi:10.1016/j.apgeochem.2022.105542
Noël, V., Marchand, C., Juillot, F., Ona-Nguema, G., Viollier, E., Marakovic, G., et al. (2014). EXAFS analysis of iron cycling in mangrove sediments downstream a lateritized ultramafic watershed (Vavouto Bay, New Caledonia). Geochimica Cosmochimica Acta 136, 211–228. doi:10.1016/j.gca.2014.03.019
O’Connell, C. S., Ruan, L., and Silver, W. L. (2018). Drought drives rapid shifts in tropical rainforest soil biogeochemistry and greenhouse gas emissions. Nat. Commun. 9, 1348. doi:10.1038/s41467-018-03352-3
Pallud, C., Kausch, M., Fendorf, S., and Meile, C. (2010b). Spatial patterns and modeling of reductive ferrihydrite transformation observed in artificial soil aggregates. Environ. Sci. Technol. 44 (1), 74–79. doi:10.1021/es901736t
Pallud, C., Masue-Slowey, Y., and Fendorf, S. (2010a). Aggregate-scale spatial heterogeneity in reductive transformation of ferrihydrite resulting from coupled biogeochemical and physical processes. Geochim. Cosmochim. Acta 74, 2811–2825. doi:10.1016/j.gca.2010.01.032
Parkin, T. B. (1987). Soil microsites as a source of denitrification variability. Soil Sci. Soc. Am. J. 51 (5), 1194–1199. doi:10.2136/sssaj1987.03615995005100050019x
Phillipot, L., Renault, P., Sierra, J., Henault, C., Clays-Josserand, A., Chenu, C., et al. (1996). Dissimilatory nitrite-reductase provides a competitive advantage to Pseudomonas sp. RTC01 to colonise the centre of soil aggregates. FEMS Microbiol. Ecol. 21, 175–185. doi:10.1016/s0168-6496(96)00054-2
Ping, C. L., Michaelson, G. J., Kimb, J. M., Romanovsky, V. E., Shur, Y. L., Swanson, D. K., et al. (2008). Cryogenesis and soil formation along a bioclimate gradient in Arctic North America. J. Geophys. Res. 113, G0S12. doi:10.1029/2008jg000744
Ploug, H., Buchholz, B., Buchholz-Cleven, B., and Jørgensen, B. (1997). Anoxic aggregates an ephemeral phenomenon in the ocean. Aquat. Microb. Ecol. 13, 285–294. doi:10.3354/ame013285
Ranjard, L., Nazaret, S., Gourbiere, F., Thioulouse, J., Linet, P., and Richaume, A. (2000). A soil microscale study to reveal the heterogeneity of Hg(II) impact on indigenous bacteria by quantification of adapted phenotypes and analysis of community DNA fingerprints. FEMS Microbiol. Ecol. 31, 107–115. doi:10.1111/j.1574-6941.2000.tb00676.x
Ravel, B., and Newville, M. (2005). ATHENA, ARTEMIS, HEPHAESTUS: data analysis for X-ray absorption spectroscopy using IFEFFIT. J. Synchrotron Radiat. 12, 537–541. doi:10.1107/s0909049505012719
Renault, P., and Stengel, P. (1994). Modeling oxygen diffusion in aggregated soils. I. Anaerobiosis inside the aggregates. Soil Sci. Soc. Am. J. 58, 1017–1023. doi:10.2136/sssaj1994.03615995005800040004x
Rijtema, P. E., and Kroes, J. G. (1991). Some results of nitrogen simulations with the model ANIMO. Fert. Res. 27, 189–198. doi:10.1007/bf01051127
Riley, W. J., and Matson, P. A. (2000). NLOSS: a mechanistic model of denitrified N2O and N2 evolution from soil. Soil Sci. 165 (3), 237–249. doi:10.1097/00010694-200003000-00006
Riley, W. J., Subin, Z. M., Lawrence, D. M., Swenson, S. C., Torn, M. S., Meng, L., et al. (2011). Barriers to predicting changes in global terrestrial methane fluxes: analyses using CLM4Me, a methane biogeochemistry model integrated in CESM. Biogeosciences 8, 1925–1953. doi:10.5194/bg-8-1925-2011
Rosado-Porto, D., Ratering, S., Moser, G., Deppe, M., Müller, C., and Schnell, S. (2022). Soil metatranscriptome demonstrates a shift in C, N, and S metabolisms of a grassland ecosystem in response to elevated atmospheric CO2. Front. Microbiol. 13, 937021. doi:10.3389/fmicb.2022.937021
Schulze, D. G., Sutton, S. R., and Bajt, S. (1994). Determining manganese oxidation state in soils using X-ray absorption near-edge structure (XANES) spectroscopy. Soil Sci. Soc. Am. J. 59, 1540–1548. doi:10.2136/sssaj1995.03615995005900060005x
Sexstone, A. J., Revsbech, N. P., Parkin, T. B., and Tiedje, J. M. (1985). Direct measurement of oxygen profiles and denitrification rates in soil aggregates. Soil Sci. Soc. Am. J. 49 (3), 645–651. doi:10.2136/sssaj1985.03615995004900030024x
Shanks, A. L., and Reeder, M. L. (1993). Reducing microzones and sulfide production in marine snow. Mar. Ecol. Prog. Ser. 96, 43–47. doi:10.3354/meps096043
Silver, W. L., Lugo, A. E., and Keller, M. (1999). Soil oxygen availability and biogeochemistry along rainfall and topographic gradients in upland wet tropical forest soils. Biogeochemistry 44 (3), 301–328. doi:10.1007/bf00996995
Tang, J. Y., and Riley, W. J. (2019). A theory of effective microbial substrate affinity parameters in variably saturated soils and an example application to aerobic soil heterotrophic respiration. J. Geophys. Res. Biogeosciences 124, 918–940. doi:10.1029/2018jg004779
Tiedje, J. M., Sextone, A. J., Myrold, D. D., and Robinson, J. A. (1982). Denitrification: ecological niches, competition and survival. Antonie Leeuwenhoek 48, 569–583. doi:10.1007/bf00399542
Tokunaga, T. K., Wan, J., Williams, K. H., Brown, W., Henderson, A., Kim, Y., et al. (2019). Depth-and time-resolved distributions of snowmelt-driven hillslope subsurface flow and transport and their contributions to surface waters. Water Resour. Res. 55, 9474–9499. doi:10.1029/2019wr025093
Totsche, K. U., Amelung, W., Gerzabek, M. H., Guggenberger, G., Klumpp, E., Knief, C., et al. (2018). Microaggregates in soils. J. Plant Nutr. Soil Sci. 181 (1), 104–136. doi:10.1002/jpln.201600451
Van der Lee, G. E. M., de Winder, B., Bouten, W., and Tietema, A. (1999). Anoxic microsites in Douglas fir litter. Soil Biol. Biochem. 31, 1295–1301. doi:10.1016/s0038-0717(99)00048-6
Vongsvivut, J., Pérez-Guaita, D., Wood, B. R., Heraud, P., Khambatta, K., Hartnell, D., et al. (2019). Synchrotron macro ATR-FTIR microspectroscopy for high-resolution chemical mapping of single cells. Analyst 144 (10), 3226–3238. doi:10.1039/c8an01543k
Wang, B., Brewer, P. E., Shugart, H. H., Lerdau, M. T., and Allison, S. D. (2019). Soil aggregates as biogeochemical reactors and implications for soil–atmosphere exchange of greenhouse gases—a concept. Glob. Change Biol. 25 (2), 373–385. doi:10.1111/gcb.14515
Web Soil Survey (2019). Natural resources conservation service. United States Department of Agriculture. Available at: http://websoilsurvey.sc.egov.usda.gov/.
Webb, S. M. (2011). The MicroAnalysis Toolkit: X-ray fluorescence image processing software. AIP Conf. Proc. 1365, 196–199. doi:10.1063/1.3625338
Wolgast, D., Carlucci, A., and Bauer, J. (1998). Nitrate respiration associated with detrital aggregates in aerobic bottom waters of the abyssal NE Pacific. Deep Sea Res. Pt II 45, 881–892. doi:10.1016/s0967-0645(98)00006-x
Yabusaki, S., Wilkins, M. J., Fang, Y., Williams, K. H., Arora, B., Bargar, J. R., et al. (2017). Water table dynamics and biogeochemical cycling in a shallow, variably-saturated floodplain. Environ. Sci. Technol. 51 (6), 3307–3317. doi:10.1021/acs.est.6b04873
Ying, S. C., Masue-Slowey, Y., Kocar, B. D., Griffis, S. D., Webb, S. M., Marcus, M., et al. (2013). Distributed microbially- and chemically-mediated redox processes controlling arsenic dynamics within Mn/Fe-oxide constructed aggregates. Geochim. Cosmochim. Acta 104, 29–41. doi:10.1016/j.gca.2012.08.020
Keywords: X-ray imaging, redox, heterogeneities, iron cycling, chemical imaging
Citation: Noël V, Boye K, Naughton HR, Lacroix EM, Aeppli M, Kumar N, Fendorf S and Webb SM (2024) X-ray chemical imaging for assessing redox microsites within soils and sediments. Front. Environ. Chem. 5:1329887. doi: 10.3389/fenvc.2024.1329887
Received: 30 October 2023; Accepted: 01 February 2024;
Published: 15 February 2024.
Edited by:
Jean-François Gaillard, Northwestern University, United StatesReviewed by:
Matthew Reid, Cornell University, United StatesBrett Poulin, University of California, Davis, United States
Copyright © 2024 Noël, Boye, Naughton, Lacroix, Aeppli, Kumar, Fendorf and Webb. This is an open-access article distributed under the terms of the Creative Commons Attribution License (CC BY). The use, distribution or reproduction in other forums is permitted, provided the original author(s) and the copyright owner(s) are credited and that the original publication in this journal is cited, in accordance with accepted academic practice. No use, distribution or reproduction is permitted which does not comply with these terms.
*Correspondence: Vincent Noël, noel@slac.stanford.edu