Major contributing factors to the lower level of connection to the existing sewer network in Addis Ababa: the case of the Kality catchment
 Mohammed Ali
 Sirak Robele
- Ethiopian Institute of Water Resources, Addis Ababa University, Addis Ababa, Ethiopia
Many households in Addis Ababa have not been connected to a sewer network, even when it passes by their homes. This study was designed to investigate major factors that have contributed to the lower level of connection to the existing sewer network in the Kality catchment of Addis Ababa. A household survey was conducted via questionnaire to identify the reasons hindering customers from connecting to sewers. The main factors identified were lack of awareness, connection fee, topography, customers’ preference for onsite sanitation over sewers, customers’ unwillingness to reinstate fences or pavements in their compound, and the unreliability of the water utility service. The survey results were analyzed with a binary logistic regression model using SPSS software. Except for topography (p-value 0.792) and connection fee (p-value 0.446), the other four independent variables had significant p values of less than 0.05, which implied a good model. Customers’ preference for onsite sanitations over sewers, followed by the unreliability of the water utility service and customers’ unwillingness to reinstate fences or pavements in their compounds were found to be the factors that most contribute to the lower level of user interest in sewer connection. However, a lack of awareness and information was also crucial in determining the rate of connection to sewers in the Kality catchment of Addis Ababa. The study also revealed that there was a gap in legislation and its enforcement: there was neither a regulator nor regulations for monitoring wastewater management, including mandatory sewer connection in the city.
1 Introduction
The level of sewerage coverage varies across many of the world’s cities. In northern Europe and North America, for example, it is not unusual for every household to have in-house flush toilets connected to a sewer network. However, in global terms, these are a minority (Christop, 2011). A typical example of the opposite is Freetown, Sierra Leone, where a total of 4 km of sewerage partially serves the business district in the center of a city of more than 1 million inhabitants (Christop, 2011). A number of centralized wastewater systems have been built in urban Indonesia, but they do not work at full capacity - only 47% of the designed capacities are in use (WorldBank, 2013a). The main reason for the under-utilization of treatment plant is that sewer networks including in-house connections are not well developed (WorldBank, 2013a). The focus in the past has mainly been on developing infrastructure: the sewerage network and treatment plants (WorldBank, 2013b). One of the many urban challenges in low- and middle-income countries is how to increase the number of households that connect to sewerage networks (WorldBank, 2020).
Systems for collecting and transporting toilet waste are strongly influenced by the type of toilet in-use because these determine the volume and characteristics of wastewater. For instance, water closets use a lot of water for flushing and require a sewerage connection (Jonathan P., 2014). However, the most common forms of toilets only use a small amount of water for flushing, or no water at all. In these situations, a sewerage system is likely to be inappropriate, and other sludge collection systems needs to be explored (Jonathan P., 2014). The conventional approach to sanitation planning creates an artificial barrier between technical decision making and institutional analysis in its broadest sense. This results in technically ‘appropriate’ systems which do not work or which do not achieve the desired objectives (Andrew Cotton et al., 2006).
Urban Ethiopia currently has an insufficient water supply to support a comprehensive sewerage service and too few in-house water connections in most areas to make sewerage system necessary or feasible (Chris Heymans, 2017). In fact, no city in Ethiopia other than Addis Ababa has a sewer network: sewage is transported to treatment plants using vacuum trucks. According to a study by MCE (2016), only 12.36% of the population of Addis Ababa was connected to the sewer network, while 40% of customers had an in-house water connection. The Kality wastewater treatment plant (WWTP), commissioned in 2018, operates at 57% of its design capacity (100,000 m3/d). The main reason for this low level of operation is that users have not connected to the sewer network in the desired numbers (MCE, 2016). In the Kality catchment of Addis Ababa, where a sewerage network does exist, many households have not connected even when it passes in front of their homes (MCE, 2016).
Therefore, the current study aims to assess the major factors contributing to the low level of sewer connection and establish the degree of their effects on the level of sewer connection based on model output parameters.
2 Materials and methods
2.1 Description of the study area
2.1.1 Location
Addis Ababa, the capital of Ethiopia and its largest city, lies high in the foothills of Mount Entoto in central Ethiopia. It is geographically located at 9oN and 38oE between 2000 and 2,500 m above sea level. Addis Ababa is the country’s commercial, manufacturing, and cultural center (Figure 1).
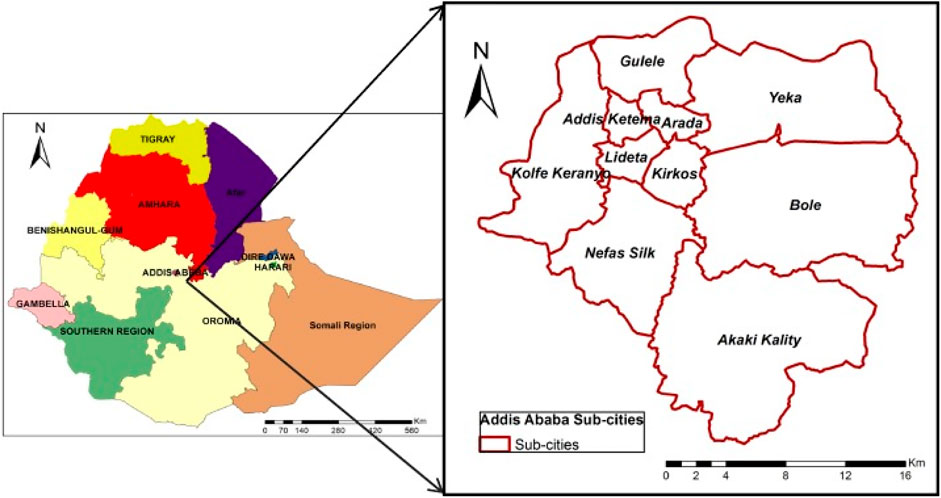
FIGURE 1. Location map of Addis Ababa city (Google, 2020).
2.1.2 Climate
The climate of Addis Ababa is warm and temperate. Over the course of the year, the temperature typically varies from 8.9 to 23.9°C, - rarely reaching below 5.6 C or above 26.7°C. The average annual temperature is 16.3°C and the mean annual precipitation is 1,143 mm (Climate-date, 2021). Average daily sunshine is as high as 9.5 h in November/December and falls to 3 h in July/August (Engida Z., 2001).
2.1.3 Demography
The total population of the city of Addis Ababa in 2020 was 3.689 Million (CSA, 2013). Immigration to Addis Ababa from all corners of Ethiopia in search of employment and services is very high, posing critical challenges that include a high rate of unemployment, limited housing, and environmental degradation (UN-Habitat, 2008). According to the Central Statistics Authority, the city’s population growth could double from 2007 to 2037. As per the 2007 census, the city’s population was 2.739 Million and it is set to grow to 5.132 Million by 2037.
2.1.4 Wastewater flow catchment
Addis Ababa is divided into three wastewater flow catchments: Kality, Eastern, and Akaki (Figure 2). This study focuses on the Kality catchment. As shown in Figure 1, Addis Ababa is divided into 10 administrative sub-cities; the Kality wastewater catchment covers the central and northwest of the city, comprising seven sub-cities (Gulele, Kolfe-Keraniyo, Nifas-Silk-Lafto, Arada, Addis Ketema, Lideta, and Kirkos). The sub-city Yeka and Bole lie in the Eastern catchment, and the sub-city Akaki is in the Akaki catchment. According to SWS (2013), the Kality sewerage catchment discharges approximately 80% of the city’s wastewater.
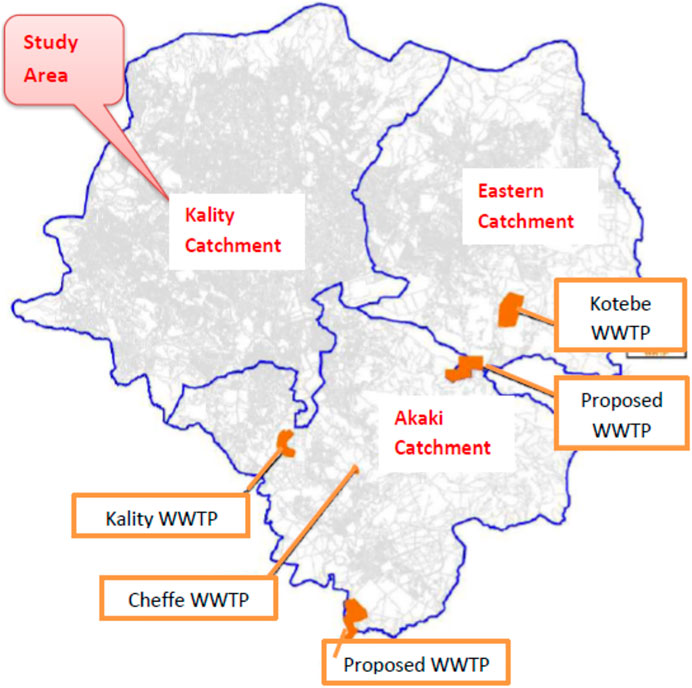
FIGURE 2. Location of study area—Kality Catchment (SWS, 2013).
2.1.5 Existing sewerage system
The Kality catchment has only one centralized WWTP with an installed capacity of 100,000 m3/d. Commissioned in 2018, the Kality treatment plant is fitted with state-of-the-art technology, including an up flow anaerobic sludge blanket (UASB) and trickling filter units. This plant has been operating at only 57% capacity due to the lower rate of connection to the sewer network. In addition, there were 14 decentralized treatment plants (seven Anaerobic Baffled Reactors, five Membrane Bioreactors and two Waste Stabilization Ponds) constructed at different condominium housing sites with a total installed capacity of 60,240 m3/d. A total of 1207 km of sewer line (trunk main, secondary line and tertiary line) has been constructed in the Kality catchment. Of the 1207 km sewer line, the trunk main (diameter 350–1500 mm) covers 85 km, the secondary sewer line (diameter 160–300 mm) covers 927 km, and the tertiary sewer network (diameter less than 160 mm) covers 195 km. More than 65% of sewer lines are installed in selected sub-cities such as Bole, Kolfe-Keraniyo and Nifas-Silk-Lafto. There is great variation between the quantity of wastewater produced and daily waste treatment capacity in the Kality catchment.
2.2 Research and sampling design
2.2.1 Research method
A quantitative research method with an inductive approach was adopted for the study, and a structured questionnaire was used to capture customer’s interest to sewer connection.
2.2.2 Sample size and sampling technique
Structured questionnaires were developed in the English language and translated into the local Amharic language. Four trained data collectors—two male and two women—participated in the household survey. The sample size was computed using the following formula by Daniel WW (2013):
Where n is the desired sample size; N is the population or household size; p is the estimated target population proportion; q is 1-p; Z stands for standard score at 95% confidence level, which is 1.96; and e is the margin of error (in this case 0.05). Since the proportion of the population connected to the sewer network was unknown, we used 50% as the value of p and q.
Our frame from which samples were drawn was households living inside the tertiary pipe network that had access to sewer connection. The water utility branch offices collaborated in quantifying the number of households with access to tertiary sewers. Thus, the size of the population or households (N) from which samples were drawn was 25,228.
The sample size calculated using the aforementioned formula was 387 households. This was compared with the result obtained from an online sample size calculation tool (www.select-statistics.co.uk); both methods gave a similar result.
Pre-test sample sizes are estimated to be from 5 to 15 households (Thomas V. Perneger et al., 2015); however, we carried out the pre-test on 15 households in order to validate the questionnaire. A simple random sample was used to select observations from a population until the desired sample size was achieved.
2.2.3 Data source and collection instrument
Both primary and secondary data sources were used for the research. Data collection using the questionnaire was carried out with the full consent of the respondent. Household heads - either men or women - were interviewed for the survey. In order to meet them, the data were collected on Sundays. Additional information was also collected from key informants (experts working with stakeholders), focus group discussions, and observations. Observations were also employed to assess the suitability of the topography for gravity sewer connection. This study was conducted from 2019 to 2021. Regarding policy issues and regulation enforcement, focus group discussions were conducted with experts from the water utility, environment protection authority, ministry of water, and city administration. Moreover, a range of literature was reviewed, but our study found that very little research had been done in areas similar to our research topic.
2.3 Data analysis
Binary logistic regression is used to predict the effects of independent variables on the dependent variable (Gujarati D., 2004). Predictor or independent variables include lack of awareness, connection fee, topography, reliability of sewerage service, and customers’ preference for onsite sanitation (septic tank, pit latrine). In our study, the dependent variable was whether a household was interested in connecting to a sewer network. As the dependent variable had a binary or dichotomous outcome (yes or no), a binary logistic regression model was the most appropriate tool for analysis. SPSS software was therefore used for analysis.
The predictor variables were selected based on previous empirical studies and discussions with the water utility sewerage technicians. Variables such as availability of water and in-house sanitary facilities were also considered. However, water availability was found to correlate with reliability of the service provided by the water utility. Moreover, availability of water and in-house sanitary facilities were highly correlated. Taking these points into consideration, availability of water and in-house sanitary facilities were dropped from the model.
2.3.1 Method specification
The dependent variable (customer interest in connecting to the sewer network) is binary or dichotomous with two outcomes: 1 if a customer was interested in sewer connection and 0 otherwise. Based on Gujarati (2004), the model is specified as follows;
In the logistic distribution equation, Pi is the probability of a customer’s interest in connecting to the sewer network, Xi is a set of explanatory/independent variables of the ith user; and βo and β1 are parameters to be estimated.
When βo+β1Xi in Eq. 1 is replaced by Zi, Eq. 2 (the probability of a customer’s interest in the sewer network) is obtained:
The possibility of a customer’s lack of interest in sewer connection (1-P) can be presented in Eq. (3) as follows:
From the aforementioned two equations, the odds ratio in favor of a customer being interested in sewer connection is:
The logit model uses logarithmic transformation to assume the linearity of the outcome variable on the explanatory variable. The logit model can, thus, be expressed as:
If the disturbance term ui is considered in the general logit model with a set of variables, the equation becomes:
Where X1, X2, … , Xn are independent (explanatory) variables affecting customer interest in the sewer network. The explanatory variables are listed in Table 1.
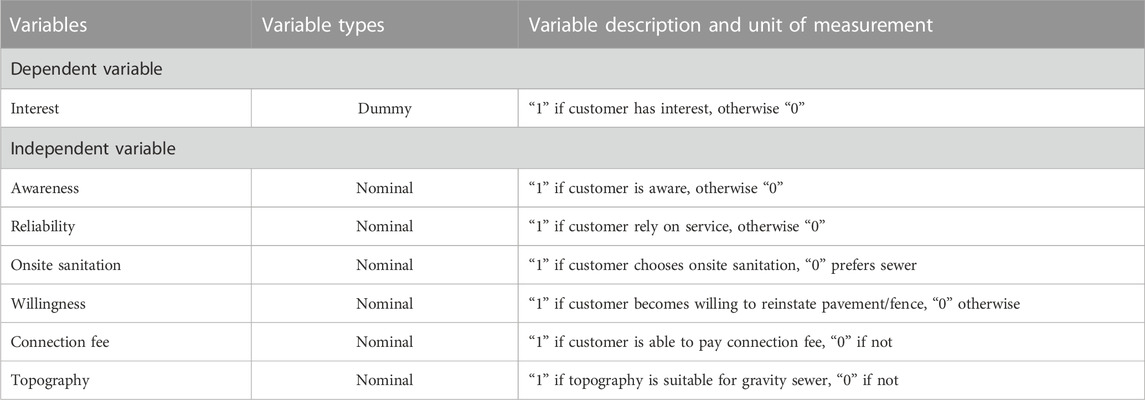
TABLE 1. Independent variables affecting customer interest in sewer connection.
3 Results and discussion
3.1 Major factors for the lower rate of connection to the existing sewer network
3.1.1 General
Of the survey respondents, 32% were women and 68% were men. Among the surveyed households, 93% owned the house in which they lived, whereas only 7% of houses were rented. Some 78% of the households relied on a septic tank to contain their liquid waste. More than 74% employed private de-sludging services to empty sludge and 26% used the water utility’s de-sludging service. More than 50% of respondents replied that it took more than 5 years for their septic tank to fill.
3.1.2 Customers’ interest in sewer connection
The household survey result revealed that only 23% of customers were interested in connecting to the sewer network, while 77% showed no interest Taking the level of customer interest in sewer connection as a dependent variable, various major factors (independent variables) that could contribute to the lower level of customer motivation for sewer connection were assessed. Accordingly, lack of awareness, customers’ preference to use onsite sanitation facilities, customers’ unwillingness to reinstate pavement or fence, and the unreliability of the sewerage service of the water utility were some of the major factors. In the study area, however, the connection fee and topography were found not to be major factors determining customer interest in sewer connection. The existing sewer network was constructed in areas where relatively high-income customers were concentrated, so the connection fee was not considered a major factor.
3.1.3 Lack of awareness
The household survey showed that 78% of customers were not aware of the availability of the sewer network in the area where they lived. Only 22% of customers were aware that the tertiary sewer network passed in front of their homes. With such a low level of customer awareness, it is difficult to expect a high number of customers to have sewer connections. Customers’ knowledge about the importance of using a sewer connection over onsite sanitation (septic tank/pit latrine) was evaluated, and only 7% gave correct answers. The importance of a sewer connection over onsite sanitation includes the reduction of frequent de-sludging of the septic tank or pit latrine, avoiding bad smells during de-sludging, saving cost/time/labour, pollution prevention within compounds due to sludge leftovers while dismantling the suction pipes, etc. Therefore, 93% of customers did not give correct responses. These findings coincide with World Bank (2015) and CDSWC (2020) findings a lack of awareness and information are one of the many factors that could hinder customers from connecting to sewers.
3.1.4 Customer preference for onsite sanitation
We found that 81% of customers preferred onsite sanitation facilities (septic tank and pit latrine) over sewer connections. When asked about the main reasons for choosing onsite sanitation facilities (mainly septic tanks), 78% replied that they were comfortable using an existing septic tank and 22% gave different reasons (unreliable service provided by the water utility, septic tank lasts longer and de-sludging septic tank by vacuum truck not costly). This finding agrees with a World Bank study (2013b), which found that home owners do not connect to sewer networks because septic tanks are cheaper. However, the sewer connection fee in Addis Ababa was found to be much cheaper than the cost of constructing a septic tank, so there must be other reasons (enforcement of regulation and legislative issues) for customer preference for onsite sanitation. It is not always true that connecting to sewers is the only viable improved sanitation option (Rebecca Root, 2020). As further discussed in this report, planners must understand factors such as density, topography, cultural preferences, and initial investment finances before choosing citywide sanitation options. Water utilities must heavily invest in the construction of a WWTP and the expansion of the sewer network. Therefore, connecting to the sewer network should be unavoidable option if the topography is suitable for a gravity sewer and there is a sewer network in the area.
3.1.5 Customers’ willingness to reinstate pavements or fences
Of the surveyed households, 80% were not willing to reinstate pavements or fences for the purpose of sewer connection; only 20% were willing to do so. This finding coincides with a CDSWC (2020) study, which also found customers unwilling to reinstate pavements or fences for sewer connections. Many cities worldwide require customers to have a sewer connection if there is one in their vicinity.
3.1.6 Reliability of service
Some 75% of customers did not trust the reliability of the water utility’s sewer service since the city’s water supply provided by the water utility was intermittent. This finding is in line with a study by Victoria A. Beard (2021), which found that intermittent water supply contributes to sewer blockages, resulting in the whole sewer system not functioning as intended. There is, thus, a strong linkage between reliable water supply and sewerage service. According to Chris Heymans (2017), a sufficient supply of water and in-house sanitary connections are vital for a feasible sewerage system. According to MCE (2016), water borne sewerage system can only be provided where the water supply is at least 50 L per person per day: flushed human excreta travels further to reach a sewer manhole than a septic tank as the former is outside of customer’s compound. In order to flush a certain mass of human excreta into a sewer manhole, a greater volume of water is required than for a septic tank. Connection to a sewer is more water intensive than onsite sanitation. Therefore, customer suspicion of the reliability of the sewerage service in Addis Ababa has a tangible basis, as the problem of water supplies had become more severe in many parts of the city.
3.1.7 Connection fee
The connection fee for a sewer line is calculated based on its length to a connection manhole, the depth of the trench, and the type of soil. On average, the minimum connection fee was 3,018 Birr (equivalent to USD 63.35). The survey revealed that 89% of the households had the ability to cover the connection fee, with only 11% unable to cover the fee in one installment. This figure does not reflect the situation in the whole Kality catchment as the existing sewer network was constructed in areas where high-income customer lived. In order to understand the effect of a connection fee on sewer connection in other parts of the city, a separate socio-economic survey is needed prior to constructing a sewer network. Therefore, the connection fee would have little effect on reduced customer interest in sewer connection in the survey area.
3.1.8 Topography
Regarding the suitability of topography for sewer connection, 82% of surveyed households’ homes were found to be suitable for the gravitational flow of sewage into the sewer network. Topography is important for a gravity sewer connection and its effect is site-specific. For undulating topography like Addis Ababa, its effect on gravity sewer flow is significantly high. However, topography had a minor effect in the surveyed area on hindering customers from sewer connection because the existing sewer networks in the survey area were constructed at sites considered to have suitable topography for gravity connection.
3.2 Model output and its interpretation
The number of cases included in the analysis was 387 (sample size) and there were no missing cases. The Chi-square as illustrated in Table 2 was 226.076 for degree of freedom 6, and the significance level or probability was 0.000. Here, a probability value less than 0.05 implied a good model.
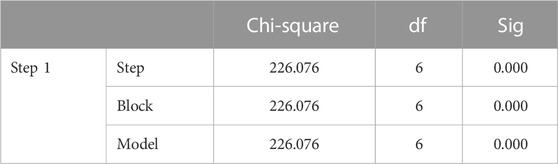
TABLE 2. Omnibus tests of model coefficients.
As shown in Table 3, Cox and Snell’s R2 was 0.442, whereas Negelkerke’s R2 was 0.670—between 44.2% and 67.0% of the variance in the dependent variable was explained by our model, which implied that it was very good.

TABLE 3. Model summary.
The Hosmer and Lemeshow’s Test (Table 4) supported our model; p-value was 0.770, which was greater than 0.05 and insignificant (implied a very good model). In this test, we wanted an insignificant value supporting our model.

TABLE 4. Hosmer and lemeshow test.
In Table 5, the value at the lower right-hand side of table (93.0) is the percentage accuracy classification (PAC). A PAC value of 93% shows that if we ask a customer the six independent variables (awareness, topography, onsite sanitation, connection fee, and reliability of service), we can predict whether a customer is interested in sewer connection by the “Yes” or “No” category using our model with 93% accuracy. This shows that our model has very good predictive capabilities.
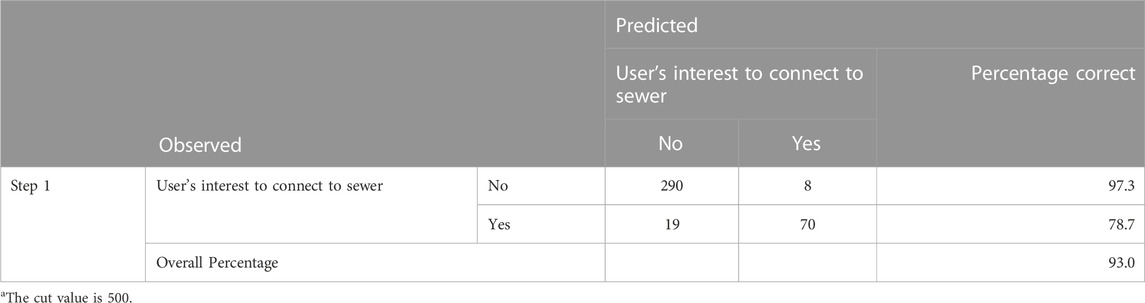
TABLE 5. Percentage accuracy classification (PAC) tablea.
In Table 6 under the Significance (Sig.) column, values less than 0.05 are significant. Four out of six independent variables had p values less than 0.05, implying a good model. Only two variables, topography and connection fee, had values out of the required range. This implies that, in terms of predictive capabilities or relationship between dependent variable and independent variables, certain categories provide better information for our model prediction. Therefore, topography and connection fee had lesser predictive capabilities for customer interest in sewer connection than the other four variables.
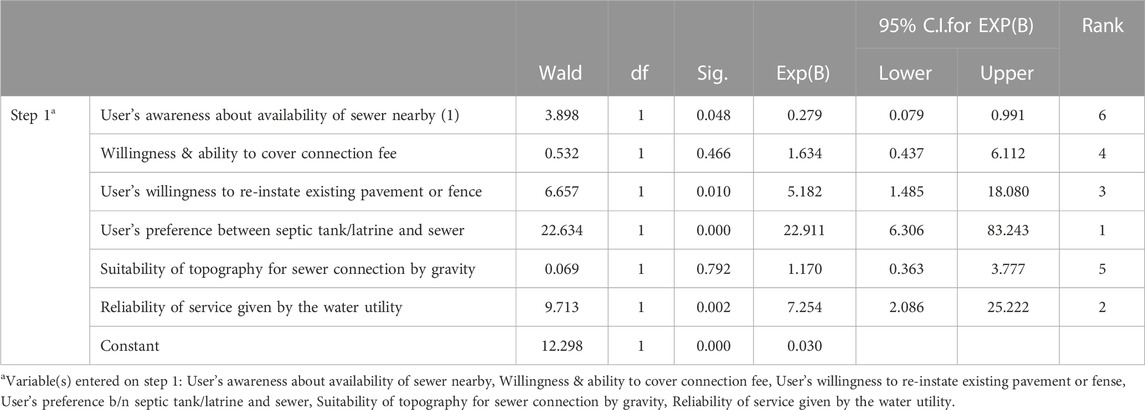
TABLE 6. Equation variables.
In Table 6 odds ratio column (ExpB), for reliability of service given by the water utility, the odds ratio of 7.254 tells us that the odds of no interest in connecting to a sewer if the customer did not thrust the reliability of the water utility’s service were 7.254 times higher than if customers did trust its service. Thus, the odds of no interest to connection were 625.4% higher if customers did not thrust the reliability of the water utility service than if the customers trusted it.
The odds ratio results show where the focus of intervention should be in order to increase the number of connections to sewers. As shown in Table 6, more emphasis should be placed on the enforcement of regulations and thereby addressing customers’ unwillingness to reinstate fences or pavements as well as their preference for onsite sanitation over sewers. Therefore, planners should focus on high-ranked parameters and follow the ranked order when implementing improvement measures.
3.3 Policy issue and enforcement of regulation
As stated in the urban wastewater management strategy by MoWIE (2017), the issue of wastewater management in Ethiopia was left to individual cities and towns. Regarding municipal wastewater management and control, no regulatory bodies were established, and no regulations have so far been issued by city municipality. In the absence of these, the water utility could not implement enforcement measures throughout sanitation service chains, including mandatory sewer connection. There was also an overlap of responsibilities among regulators as well as between regulators and implementers.
4 Conclusion
Lack of awareness and information as well as knowledge gaps among customers played a crucial role in reducing the rate of connection to the existing sewer network. Many customers were unaware of the availability of sewers in their vicinity and did not understand the importance of sewer connection over onsite sanitation facilities.
There were significant gaps in regulation and its enforcement. The majority of customers did not want to reinstate existing fences or pavements with in their compounds for the purpose of sewer connection. Many of the customers preferred onsite sanitation facilities (septic tank and pit latrine) even though a sewer line passed in front of their homes. Here, enforcement of mandating connection to a sewer where there is one nearby could play an important role in enhancing the rate of connection.
Increasing the reliability of the water supply service would significantly boost customer confidence in the water utility’s sewerage service because many of the customers surveyed were suspicious about the reliability of its service. Moreover, water supply and sewerage service (connection to a sewer) are highly interconnected.
Suitable topography has a significant effect in planning a gravity sewer system. Although the topography of Addis Ababa is suitable for a gravity sewerage system, some customer homes in the surveyed area were found to be unsuitable for such connection.
Connection fees and wastewater discharge tariffs play an important role in planning a sewerage system. So far, no tariff had been applied for discharging wastewater into the sewerage system except for a one-time connection fee. Some surveyed customers were unwilling to pay the one-time connection fee. Different payment modalities (monthly or quarterly) need to be designed in order to ease the burden of a connection fee on customers.
Our study revealed a gap in legislation and its enforcement: there was neither a regulatory body nor regulations for monitoring wastewater management, including mandatory sewer connection.
Data availability statement
The original contributions presented in the study are included in the article/Supplementary Material, further inquiries can be directed to the corresponding author.
Author contributions
All authors listed have made a substantial, direct, and intellectual contribution to the work and approved it for publication.
Acknowledgments
I would like to acknowledge the respondents, data collectors, and all who were instrumental in the research process. And i am indebted to my supervisor SR for his continuous support and guidance throughout the study.
Conflict of interest
The author declares that the research was conducted in the absence of any commercial or financial relationships that could be construed as a potential conflict of interest.
The author SRG declared that they were an editorial board member of Frontiers, at the time of submission. This had no impact on the peer review process and the final decision.
Publisher’s note
All claims expressed in this article are solely those of the authors and do not necessarily represent those of their affiliated organizations, or those of the publisher, the editors and the reviewers. Any product that may be evaluated in this article, or claim that may be made by its manufacturer, is not guaranteed or endorsed by the publisher.
References
Beard, Victoria A. (2021). Out of sight, out of mind: Understanding the sanitation crisis in global south cities. J. Environ. Manag. 306 (2021), 7&11. doi:10.1016/j.jenvman.2021.114285
Cdswc, (2020). Inception Report: Consultancy service for the study, detail design, construction supervision for Kality catchment sewer line project Phase 11. Addis Ababa, Ethiopia: CDSWC.
Chris Heymans, G. B. (2017). Improving urban and small towns sanitation services delivery in Ethiopia: Message and lessons from cities, towns and the national policy dialogue. Washington DC, USA: World Bank.
Christop, A. T. (2011). Sustainable sanitation in cities: A framework for action. Sustainable sanitation alliance. The Netherlands: Papiroz Puplishing House.
Climate-date, (2021). climate-date. Retrieved January 15, 2021, from en.climate-date.org: http://www.en.climate-data.org.
Cotton, Andrew (2006). Sanitation 21: Simple approach to complex sanitation. London, United Kingdom: IWA.
Daniel, W. (2013). Biostatistics: A foundation for analysis in the health science. Hoboken, NJ, USA: WILEY.
Google, (2020). map-of-addis-ababa-city. Retrieved December 15, 2020, from Maps app: http://www.google.com.
Gujarati, D. (2004). “15. Qualitative model regression model,” in G. D. Basic econometrics. 4th ed. (New York, NY, USA: McGraw-Hill), 595.
Jonathan, P., C. L. (2014). Sanitation 21: A planning framework for improving citywide sanitation services. London, United Kingdom: IWA.
Mce, (2016). Utility water distribution and sewerage coverage percentage for the city of Addis Ababa. Addis Ababa, Ethiopia: MCE.
Perneger, Thomas V., Courvoisier, D. S., Hudelson, P. M., and Gayet-Ageron, A. (2015). Sample size for pre-test of questionnaires. Qual. life Res. 24, 147–151. doi:10.1007/s11136-014-0752-2
Root, Rebecca (2020). When are sewers the best option for improved sanitation. Washington, D.C., USA: devex.
Scott, R. (2019). Integrating basic urban services for better sanitation outcomes. Sustainability 11 (6706), 2. doi:10.3390/su11236706
Sws, (2013). Addis Ababa, Ethiopia: SWS.Design report: Design of sewer lines for the selected for the selected areas of Kality catchment.
WorldBank, (2013b). Urban sanitation review: A call for action. East asia and the pacific region. Washington DC: the world bank.
WorldBank, (2015). Improving on-site sanitation & connections to sewers in south east Asia: Insights from Inddonesia & Vietnam. Washingon DC, USA: WorldBank.
Keywords: connection to sewer, sewer network, sewerage system, Kality catchment, Addis Ababa
Citation: Ali M and Robele S (2023) Major contributing factors to the lower level of connection to the existing sewer network in Addis Ababa: the case of the Kality catchment. Front. Environ. Eng. 2:1158656. doi: 10.3389/fenve.2023.1158656
Received: 04 February 2023; Accepted: 09 May 2023;
Published: 07 June 2023.
Edited by:
Wendong Tao, SUNY College of Environmental Science and Forestry, United StatesReviewed by:
Mohammad Abu Hashnat Badsha, California Polytechnic State University, United StatesAlsayed Mostafa, Inha University, Republic of Korea
Copyright © 2023 Ali and Robele. This is an open-access article distributed under the terms of the Creative Commons Attribution License (CC BY). The use, distribution or reproduction in other forums is permitted, provided the original author(s) and the copyright owner(s) are credited and that the original publication in this journal is cited, in accordance with accepted academic practice. No use, distribution or reproduction is permitted which does not comply with these terms.
*Correspondence: Mohammed Ali, hebamohd4@gmail.com