Experimental investigation of the interconnections between turbulent structure and scouring topographic characteristics
 Jian Li1
  Hao Wang
- 1College of Civil Engineering, Fuzhou University, Fuzhou, China
- 2Fuzhou Planning & Design Research Institute Co., Ltd., Fuzhou, China
Complex interactions between turbulence and sediment movement around bridge piers result in bridge damage. However, the scouring mechanism remains ambiguous owing to insufficient quantitative experimental analysis pertaining to scouring topographic characteristics and their relationships with turbulent flow. Hence, an experiment is performed in this study to clarify the relationships between turbulent vortex structures and scour topography. First, we measure the two-dimensional flow fields around a bridge pier using particle image velocimetry systems and then establish a three-dimensional scour topography using the structure-from-motion technique. Subsequently, according to the unified coordinate system, we perform an innovative quantitative analysis of the scouring topography and the distributions of the shear force and horseshoe vortex around the pier. The results show the maximum depth of the scour hole increases linearly with the flow intensity. For a single scouring hole, both the cross-sectional area and volume of the scour hole vary parabolically with the height from the pit bottom. The coupling of the flow and bed topography forms the maximum scour hole via shear stress, and the large streamwise vortices on both sides of the bridge pier result in the formation of long shallow grooves on both sides of the sand dune downstream.
1 Introduction
Bridge piers, which change the structure of flows, have been an important topic in studies pertaining to rivers and lakes. Owing to an increase in the pressure gradient of water flow caused by bridge piers, the down flow upstream of the pier impinges on the bed and forms a rotating structure known as a horseshoe vortex upstream of the pier (Dargahi, 1989; Dey et al., 1995; Dey and Raikar, 2007; Apsilidis et al., 2015; Link et al., 2018). When the riverbed structure changes significantly, the pier foundation becomes unstable or destroyed. Therefore, local scour is one of the leading causes of bridge failure (Coleman and Melville, 2001; Link et al., 2012; Jia et al., 2017; Guan et al., 2019). Investigations into scour-hole geometries, flow structures, and coupling relationships will enable the mechanism of local scour to be understood.
The geometrical form of the riverbed topography in local scour has been extensively analyzed to improve the understanding of the scouring mechanism (Yao et al., 2018; Zanke et al., 2011; Zarrati et al., 2010; Zhao et al., 2010; Zhao et al., 2012; Zhou et al., 2020). Das et al. (2018) measured the scour depth at different locations and discovered the maximum and minimum scour depths around the middle eccentricity of the cylinder and downstream of the rear inline cylinder, respectively. To examine the form of a scour hole, Yagci et al. (2016; Yagci et al., 2017) used a laser scanner to reconstruct the scouring topography around hexagonal arrays of emergent circular cylinders. Bouratsis et al. (2013) reconstructed a three-dimensional (3D) underwater topography of a pier area based on binocular vision measurement technology and analyzed the evolution process of the riverbed structure. Zhou et al. (2020) conducted an experimental and theoretical study pertaining to the local bed scour distribution. The results showed that the pier diameter, sediment entrainment, and flow characteristics must be considered when predicting the maximum scour depth. However, accurate analysis of scour pit structure is still lacking.
Turbulent structures are the primary driving force of sediments (Ataie-Ashtiani and Beheshti, 2006; Ataie-Ashtiani et al., 2010). Unger and Hager, (2006) applied particle image velocimetry (PIV) to investigate the flow characteristics around a pier. The results showed that the horseshoe vortex continued to expand the size of the scour hole, and the vertical jet upstream of the pier was the dominant scouring factor. Melville and Raudkivi, (1977) analyzed flow fields and discovered that the vortex convection speed decreased toward the bed in a local scour. Graf and Istiarto, (2002) discovered that horseshoe vortices were distributed around the bottom of a pier and extended downstream, whereas the intensity decayed in the flow direction. Meanwhile, Silva et al. (2020) investigated the conical angular vortex at the junction of a square column and discovered that it bent both upward and outward. Roy et al. (2019) analyzed the thin shear layer between the recirculation zone downstream of a pier and external flows to understand the bank undercut mechanism. Zhang et al. (2017) concluded that the horseshoe vortex accelerated flows, and that high bed shear stresses contributed significantly to local scour around single piers. Generally, the vortex was composed of a vortex core with a high vorticity in the center, surround by a spiral flow field. The horseshoe vortex is a key factor that contributed to the local scour around the pier (Sumer et al., 2003; Chakraborty et al., 2005; Roulund et al., 2005). However, the structure and formation mechanism of scouring pit are not clear (Kim et al., 2014; Kim et al., 2015).
Previous studies have primarily focused on turbulent flow and scouring topography characteristics. Experimental coupling analysis remains a significant challenge and is key to clarifying the scour mechanism. Quantitative details regarding the scouring topography and turbulent structure must be obtained to understand the scour mechanism. The objective of the present experimental study is to achieve the relationships between the characteristics of the turbulent structure obtained via PIV and the reconstructed scoured topography with the structure from motion (SFM) method.
The remainder of this paper is organized as follows: In Section 2, the experimental setup details of the scour experiments and the method of reconstructing the bed topography are presented. In Section 3, the results of the 3D scour topography are presented based on experimental data. Additionally, the variations in the flow intensity and scour depth with the area and volume are provided. The turbulent structure around a vertical cylinder is coupled with the reconstructed bed topography to analyze the mechanism of pier scour. Finally, in Section 4, we provide a brief discussion and conclusion to summarize the significant findings.
2 Materials and methods
2.1 Experimental setup
Experiments were conducted in a recirculating open-channel flume (15 m long, 0.4 m wide, and 0.5 m high) with a slope of 0.002 at the Hydraulic Laboratory of the College of Civil Engineering in Fuzhou University, China (Figure 1A). The flume bed and sidewalls were constructed using transparent and smooth glass to facilitate image capture using a PIV system. Three honeycombs were installed at the flume entrance to create a fully developed flow. Six ultrasonic level sensors with an accuracy of ±0.5 mm were equidistantly installed above the flume. A schematic illustration of the experimental setup for the flume system is shown in Figure 1A. The streamwise, wall-normal, and spanwise directions are denoted as x, y, and z, respectively.
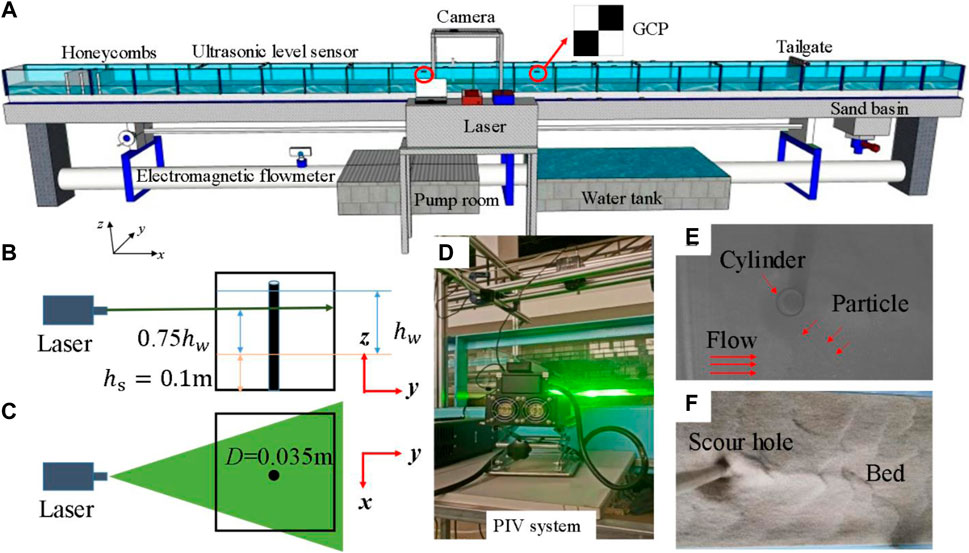
FIGURE 1. Schematic illustration of experimental setup. (A) Flume system, (B,C) laser system, (D) PIV system, laser and camera, (E) PIV image, and (F) scour bed.
In the present experiment, the sediment particle featured a median diameter d50 of 0.5 mm and a density ρs of 2,650 kg/m3. The sediment thickness is the vertical height from the bottom of the tank to the sediment surface, and the sediment thickness was 10 cm. A plastic pipe with a diameter D of 35 mm was used for pier modeling, and its interaction with the sidewalls was negligible. The pier model was placed 7 m away from the entrance to ensure that a fully developed flow was formed in the streamwise direction before the water reached the pier model. Five steady and uniform flow cases were considered in this study. The detailed experimental conditions are listed in Table 1.
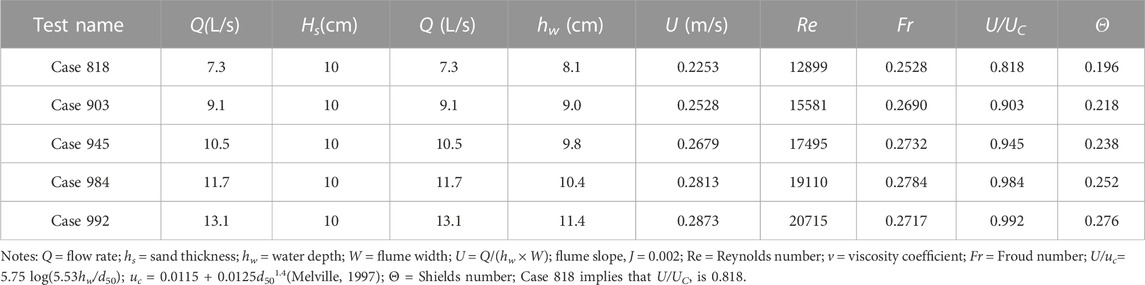
TABLE 1. Experimental conditions.
A Nikon D7200 camera (6000 × 4000 pixels) was used to acquire scour bed images. Four ground control points (GCPs) comprising 6 cm × 6 cm square checkerboards were placed at different positions in the flume, and the coordinates are listed in Table 2. After the scour experiment, the scoured region was photographed approximately 200 times. The overlap rate of every pair of adjacent photos should be maintained at approximately 80%. In each case, 70–120 images containing GCPs were calibrated more than five times to improve the accuracy of the 3D reconstruction. Because the laser beams could not penetrate the pier, the tracer particles behind the pier back could not be captured. Instantaneous velocity fields around the pier model were measured in x–z planes using a high-resolution PIV system (ILA Company, Germany). An industrial camera with 1280 × 1024 pixels was installed above the centerline of the pier. A continuous-wave laser (10 W, MGL-W-532) produced by equipped with a Powell lens was used to generate a 1-mm-thick light sheet for illumination. It can be seen in Figures 1B–D, the laser height was adjusted to 0.75 times the water depth hw, and the field of view encompassed an area measuring 3.2 cm × 2.6 cm (the average magnification was approximately 40 pixels/mm). The flow was sealed with polyamide sphere tracer particles (density = 1.03 × 10³ kg/m3; mean diameter = 5 μm; refractive index, n = 1.5). To maintain independence among the obtained samples, velocity capture was performed at a frequency of 1 Hz. A multigrid iterative image deformation algorithm was used to calculate the PIV velocity (Astarita and Cardone, 2004), and the sub-pixel accuracy was determined via Gaussian fitting. The interrogation window featured 32 × 32 pixels with a 50% overlap, and the flow field was a matrix comprising 68 × 79 vectors for each target region. A total of 5000 instantaneous velocity fields were obtained for all the cases. Finally, the specific bridge pier arrangement and bed erosion structure are as shown in Figures 1E, F.
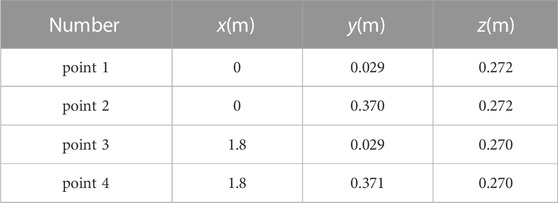
TABLE 2. Coordinates of each point.
2.2 Analysis methods
The instantaneous flow fields were calculated using Eqs 1, 2 to obtain the time-averaged velocity fields to analyze the flow characteristics around the bridge pier. Here, u and v are the instantaneous and spanwise flow velocities in the measurement region, respectively, and U and V are the average flow velocities of u and v, respectively. The shear stress τ is calculated using Eq. 3, where μ denotes the viscosity coefficient. The rotation strength is calculated using the delta criterion.
In this paper, scale invariant feature transform (SIFT) was used to identify and extract terrain feature points and match them (see Figures 2A–C). The patch-based multiview stereopsis algorithm (Furukawa and Ponce, 2010) was used to optimize the sparse 3D point clouds and then generate dense 3D point clouds of the scoured bed. Subsequently, GCPs were used to calibrate the 3D point clouds. It can be seen that Figures 3A, B show the original images and the reconstruction process, respectively. The textured 3D structures and 3D point cloud coordinates of the bed topography are shown in Figures 3C, D, respectively.
FIGURE 2. Scoured bed and feature point matching. (A) First image, (B) Second image, and (C) Matched points.
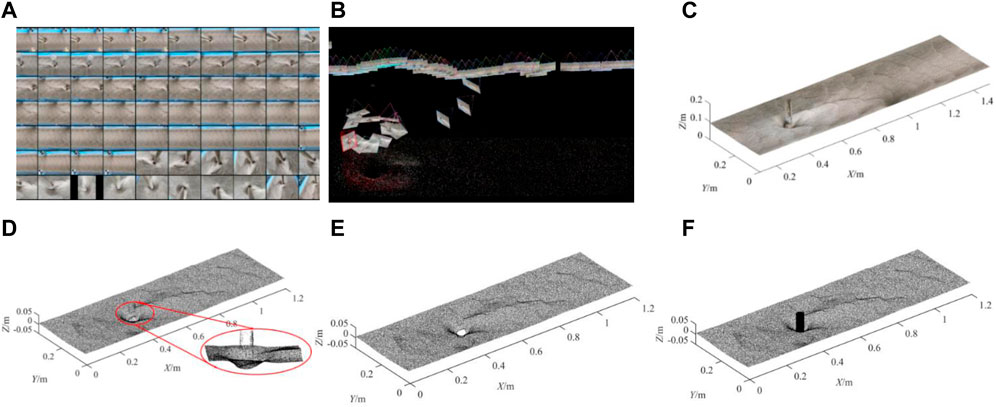
FIGURE 3. Reconstruction process of SFM method. (A) Image groups, (B) Projection of feature points, (C) Reconstructed topography, (D) Point clouds, (E) Bed topography without pier, and (F) Bed topography with added pier.
To perform subsequent quantitative calculations, the point cloud coordinates inside the cylinder were eliminated (see Figure 3E). Here, in order to better quantitatively analyze the scouring pit structure, this paper takes the elevation at the riverbed plane as z=0. Subsequently, a generated regular point cloud was added to the current structure, as shown in Figure 3F. To quantitatively investigate the geometry of the scouring topography, the selected region was meshed with a 1 mm × 1 mm square grid using the nearest neighbor element interpolation method. Accordingly, 1200 × 400 grids were formed in the region measuring 1.2 m long and 0.4 m wide. Finally, the 3D elevation of the bed surface was obtained after interpolation.
3 Results
3.1 Scour hole morphology
Investigations into pier-scoured bed topographies are important, and gridded 3D point clouds provide a basis for the quantitative analysis of scour hole structures. Figure 4 shows a contour map of the scoured bed for Case 992, where the topography of the bed surface around the cylinder can be segmented into three main regions: 1) A relatively flat sand ripple region upstream and downstream of the pier; 2) a scour hole region around the pier, where the scour depths in the front and on both sides of the model are relatively deeper than that at the downstream, and a convex ridge structure is formed behind the model; 3) a sand dune region in the wake area of the pier model. Meanwhile, two shallow grooves were distributed on the top and bottom of the sand ridge and dune, forming angles of approximately ±20° along the x-axis. A bed elevation contour map is shown in Figure 4B.
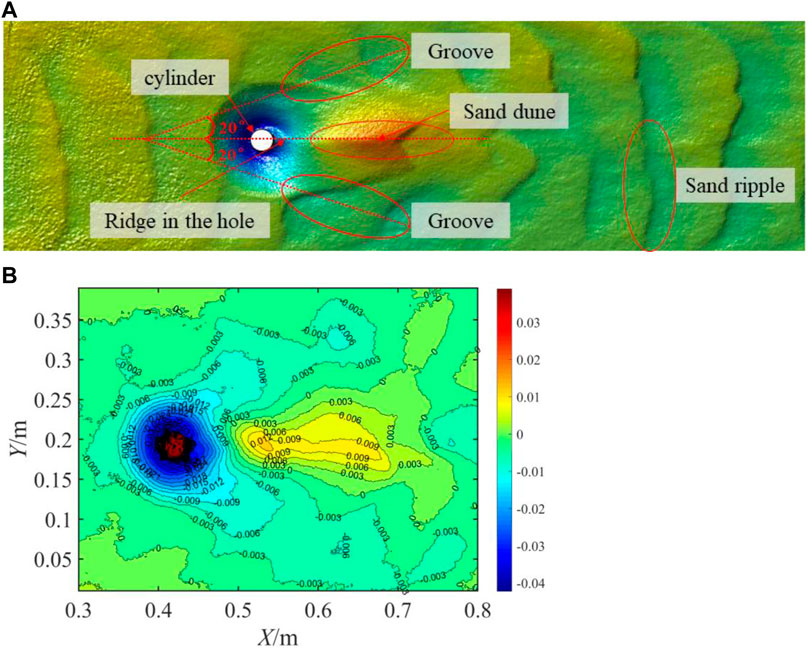
FIGURE 4. Bed structures of scour topography in Case 818. (A) 3D structure of bed surface, and (B) Contours of scour topography.
According to sediment incipient theory, sediment is deposited when the flow intensity is lower than the critical Shields number Θc. Therefore, the convex structure inside the scour hole, particularly the “fin-like” sand dune structure behind the model, is suspected to have contributed to the reduction in the flow intensity behind the model. The 3D structures of the bed topography under different flow conditions are presented in Figure 5 to allow a comparison and analysis of the variations in the scouring patterns. The scoured bed scale was normalized by the model diameter D. Figure 5 shows the scour holes, sand dunes, and sand ripples on the bed. In this study, as U/Uc increased the volumes of scour holes and deposited sand dunes behind the pier increased. For instance, the height and volume of the sand dune in Case 818 were relatively small, whereas a larger, more prominent structure was observed in Case 945. Furthermore, as the flow intensity increased, the sand ripples become neater and tighter gradually.
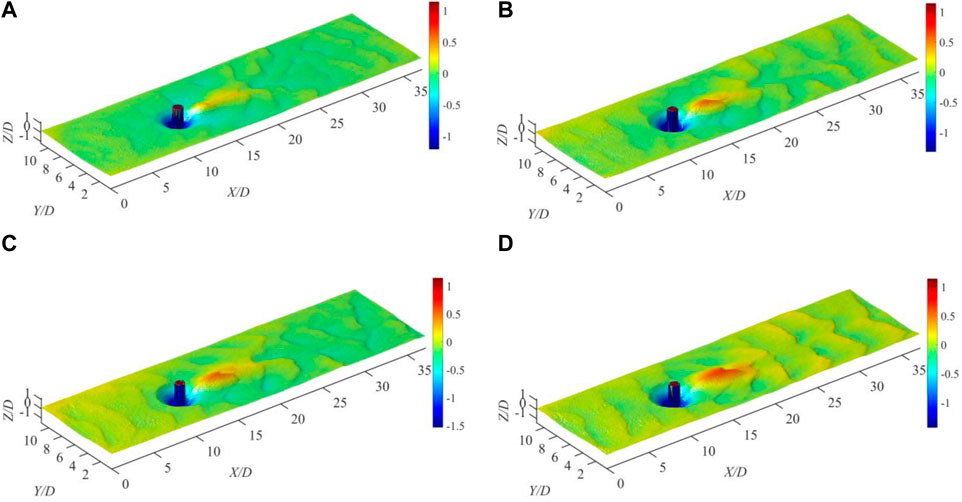
FIGURE 5. 3D topographies in various flow conditions after scour: (A) Q=7.3 L/s, U/Uc=0.818, (B) Q= 9.1 L/s, U/Uc=0.903, (C) Q=10.5 L/s, U/Uc=0.945, and (D) Q=11.7 L/s, U/Uc=0.984.
The cross-sectional structures of the scour holes along the y–z and x–z planes are presented in Figures 6A, B, respectively, which show the forms of the scour hole. The scour holes expanded outward gradually from the smaller scour hole inside as the flow intensity increased. The two-dimensional (2D) bed elevation profiles of the x–z and y–z planes are presented in Figures 6C, D, respectively, to show the detailed scour hole. The angle from the y-axis was approximately αL = αR = 57° in the y–z plane. The left angle (upstream) and right angle (downstream) from the x-axis were αU = 59° and αD = 53°, respectively, in the x–z plane. As the flow intensity increased, all the angles decreased, and the distances between the peak positions of the sand dune and pier increased. This is because the increase in the Shields parameter enhances the horseshoe vortex structure around the model, resulting in the volume expansion of the scour hole (Zhao et al., 2010). Meanwhile, the sand ridge was washed downstream and aligned in the flow direction by a strong coherent vortex structure.
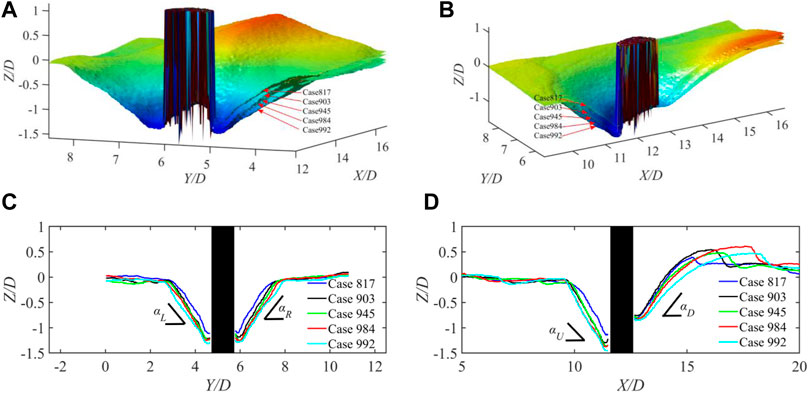
FIGURE 6. Bed profiles in y–z and x–z planes of all five flow conditions. (A) 3D profiles of y–z plane, (B) 3D profiles of x–z plane, (C) 2D profiles of y–z plane, and (D) 2D profiles of x–z plane.
Few studies have been conducted regarding the internal structure of scour hole owing to deficient accurate measurements of the scouring form. The gridded 3D scour hole structure provides sufficient data for extracting the slice of the scour hole. As shown in Figure 7, the slices in the x–y planes are those for h/H = 0.4, 0.5, 0.6, 0.7, and 0.9 under different cases. For the same flow condition, when h/H = 0.4, the slice of the scour hole was arc shaped and surrounded the yellow pier in the middle. As the depth of h/H increased gradually, the slice regions corresponding to 0.4 h/H and 0.5 h/H increased symmetrically, and the slice regions corresponding to 0.7 h/H and 0.8 h/H evolved gradually from a symmetrical arc shape to an irregular round shape. Additionally, at a fixed h/H, the slice region of the scour hole under different flow conditions increased with U/Uc.
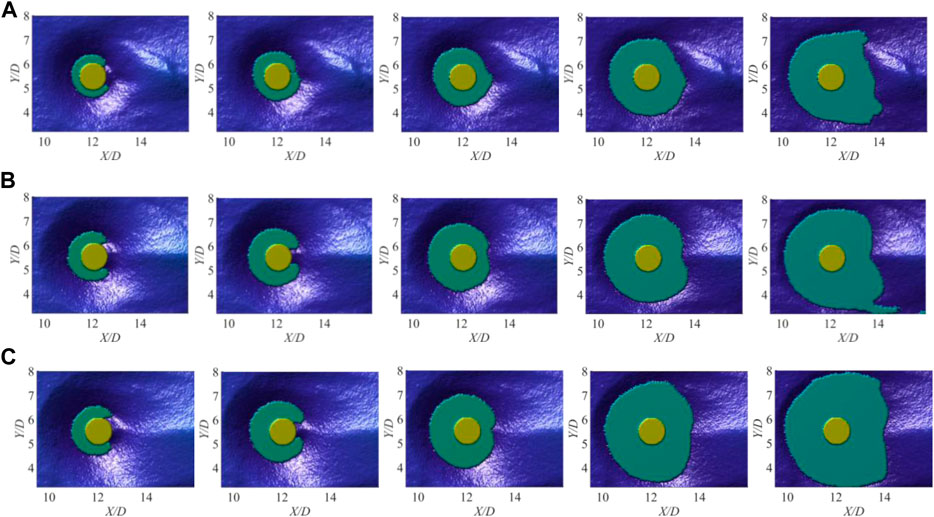
FIGURE 7. Slice areas of scour hole at different scour depths: (A) Q=7.3 L/s, U/Uc=0.818, (B) Q=10.5 L/s, U/Uc=0.945, and (C) Q=13.1 L/s, U/Uc=0.992.
The 3D structures of the scour holes at different depths (h/H) are shown in Figure 8 without the pier structure. As h/H increased, the 3D scour hole gradually expanded to a symmetrical inverted cone. Additionally, the back of the pier wrapped inward gradually and formed a symmetrical sand ridge. Similarly, Figure 8 shows that at the same slice position, as the flow intensity increase, the volume of the scour hole also increased. The volume change of the scour hole is consistent with the change trend of that area at various slices of the x–y plane.
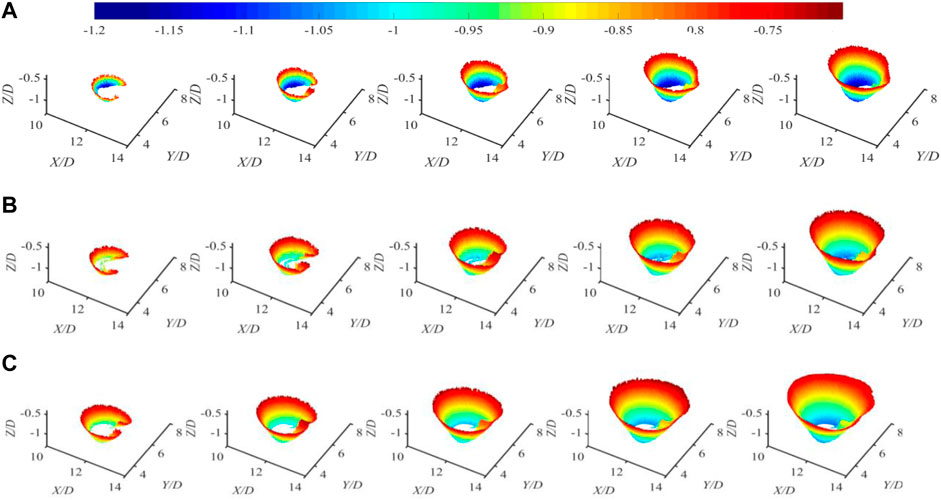
FIGURE 8. Volume vs. scour hole depth for different flow conditions: (A) Q=7.3 L/s, U/Uc=0.818, (B) Q=10.5 L/s, U/Uc=0.945, and (C) Q=13.1 L/s, U/Uc=0.992.
Subsequently, to quantitatively analyze the area and volume of the sour hole, Eqs 1, 2 derived by Yang et al. (2020) were adopted for different h/H values. Here, H (x, y) is the scour depth corresponding to the spatial position (x, y). As described in Section 2.2, the scour region is meshed with a regular square grid; therefore, both x and y are equal to the fixed mesh length net. Eqs 1, 2 can be rewritten as follows:
Where i the ith height between 1 and h/net, Numi is the number of grids in the slice at height h, net2 the area of the gridding area, Ah the area of the scour hole at height h. (in Eq. 3), h/net the number of grids within height h, net3 the single gridding volume, Vh the accumulated volume from the first layer to a specific layer of h/net.
In the present study, 20 sets of area and volume data at different h were obtained and are shown in Figure 10. The area and volume of the scour structure began to increase gradually from the bottom of the scour hole to the top, particularly at h/H < 0.5. The variation trends of the scour hole area and volume under different flow conditions were similar. Nevertheless, as h approached the bed surface height H, the curves indicated a higher rate of increase. When the flow was intense, the physical scale of the scour hole was larger and its growth rate was low. In general, the area and volume of the scour holes at different heights increased parabolically with h. By fitting the acquired experimental data, two empirical equations were established to predict the scour hole slice area (Ah) and volume (Vh) at (h/H) (see Figure 9). Turbulent Flow and Scour Hole.
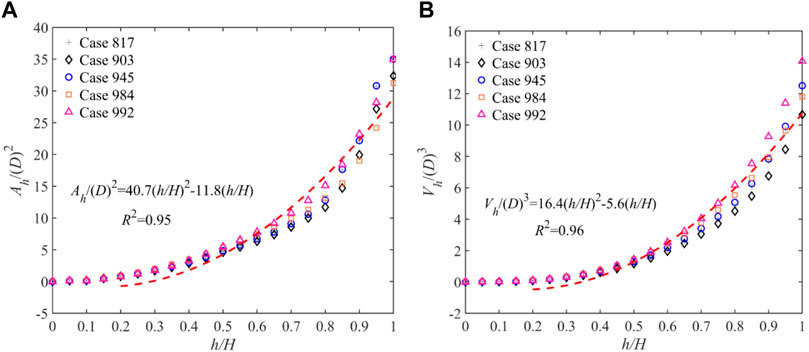
FIGURE 9. Area and volume vs. scour depth. (A) Area, and (B) Volume.
The strong horseshoe vortex upstream of the pier is a significant factor contributing to the local scour. The maximum scour depth occurred near the stagnation point around the pier. Owing to the shadowing effect of the pier, the horseshoe vortex weakened downstream of the pier, resulting in a relatively small local scour depth therein. Figure 10 shows the equilibrium maximum scour depth H/D plotted against the flow intensity U/Uc. As expected, an increase in U/UC resulted in a linear increase in the depth, which is consistent with the findings of Ettema et al. (2006).
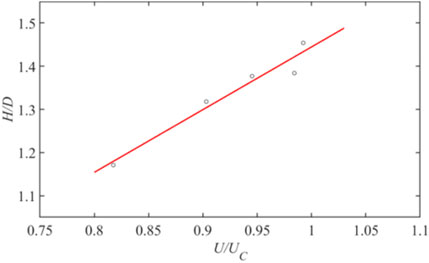
FIGURE 10. Non-dimensional scour depth (H/D) vs. U/Uc.
For further in-depth analysis, from a time-averaged perspective, the mean 2D streamwise velocity u, and spanwise velocity v near the pier in the x–y plane are shown in Figure 11 for Cases 818, 945, and 992. Figure 11 shows that the reverse pressure gradient exerted by the pier, and the maximum negative or positive v values were symmetrically distributed on both shoulders of the cylinder, thus confirming flow separation. In general, the velocity distributions under the different operating conditions were consistent. As the flow intensity increased, the influence range of the cylinder affected the flow field, and the spanwise velocity decreased. The enhancement in the flow intensity inhibited the flow turbulence region created by the cylinder.
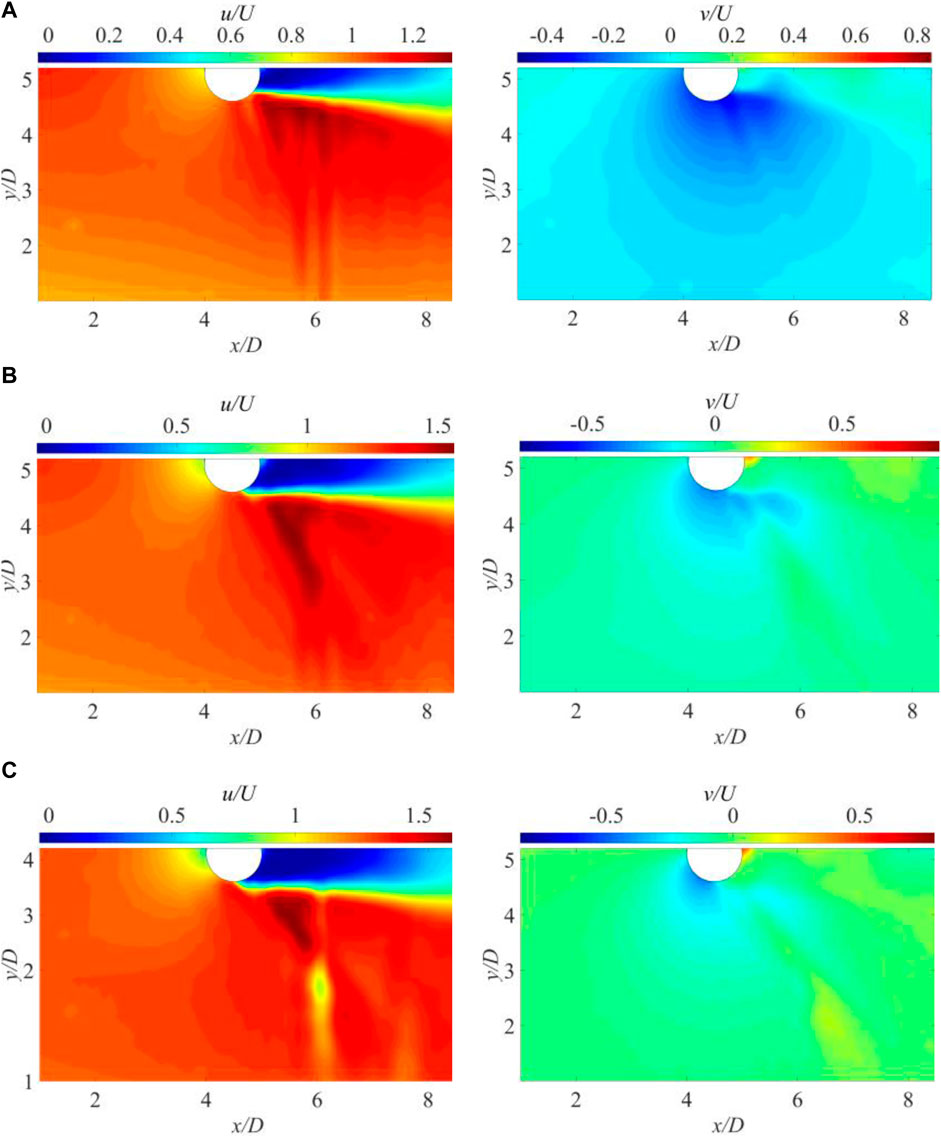
FIGURE 11. Velocity vectors and contours of u and v for various conditions. (A) Case 818, (B) Case 945, and (C) Case 992.
Meanwhile, the sediment around the pier was washed downstream by the current. For further research, the scouring topography was coupled with the flow structure reflecting the mean shear stress and vorticity. As shown in Figures 12–14, the high values of vorticity were primarily distributed around the cylinder and continued to stretch backward in a long and narrow streaky structure. Previous studies (Dubief and Delcayre, 2000; Zhao et al., 2010) showed that the vortex around a pier is a horseshoe vortex. Furthermore, we also observed that the streaks of the vortices detached from the horseshoe vortex (Ettema et al., 2017). This streak region of the vorticity behind the pier was approximately parallel to the deformed bed and coincided with the scouring groove behind the cylinder, indicating that the large streamwise vortices contributed primarily to the formation of the rear shallow long groove. The horseshoe vortex induced a high bed shear stress, which resulted in sediment suspension at the front of the cylinder. A shear stress analysis similar to that of vortices was performed, and the results are also shown in Figures 12–14. As expected, the maximum bed shear stress was primarily located around the cylinder, and the value was relatively small at the rear of the cylinder. Consequently, an unclosed arc zone of shear stress was formed, which encompassed the front and two sides of the cylinder. The 3D bed scouring structure and shear stress contours were plotted. The region with a high shear stress was approximately coincident with the deeper area of the scour hole, indicating that the shear down-shearing effect is an essential dynamic factor in promoting sediment entrainment and the formation of deep scour holes.
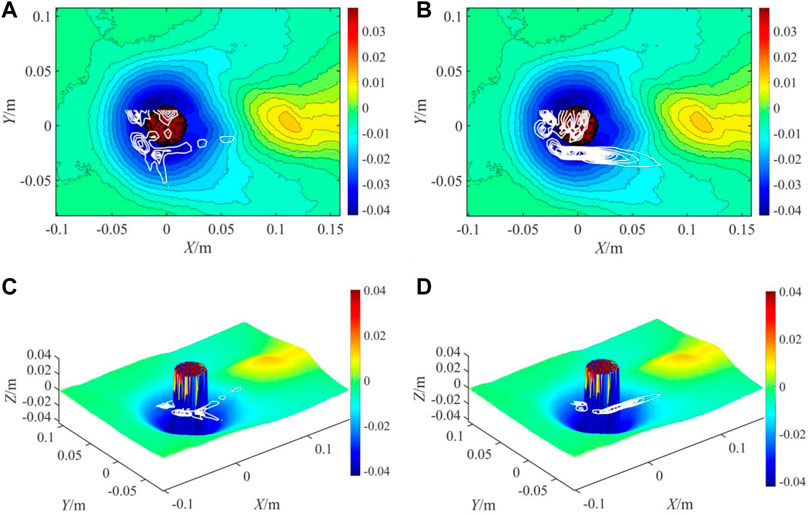
FIGURE 12. Shear force and vorticity coupling with 3D bed surface in Case 818. (A) Shear force and topography contour, (B) Vorticity and topography contour, (C) Shear force and 3D topography, and (D) Vorticity and 3D topography.
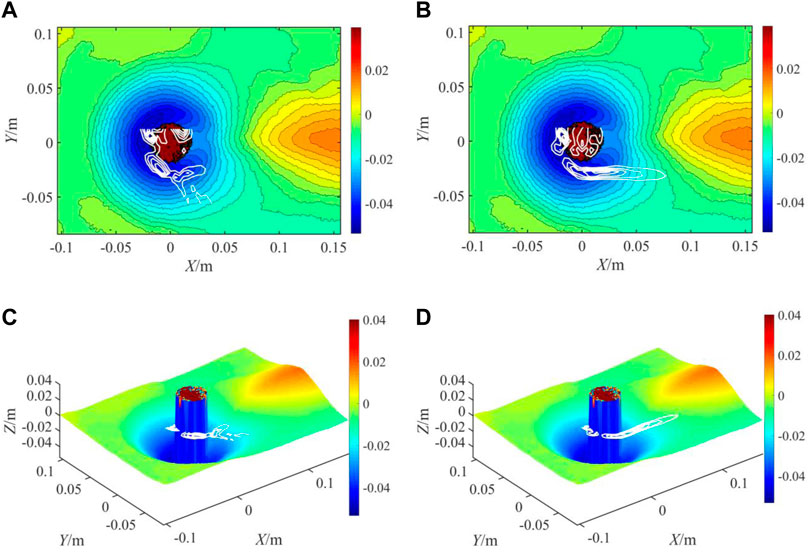
FIGURE 13. Shear force and vorticity coupling with 3D bed surface in Case 945. (A) Shear force and topographic contour, (B) Vorticity and topographic contour, (C) Shear force and 3D topography, and (D) Vorticity and 3D topography.
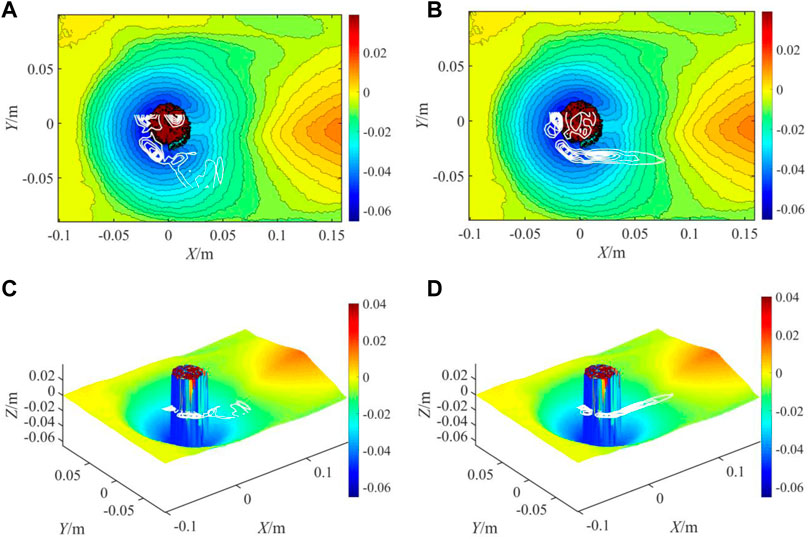
FIGURE 14. Shear force and vorticity coupling with 3D bed surface in Case 992. (A) Shear force and topographic contour, (B) Vorticity and topographic contour, (C) Shear force and 3D topography, and (D) Vorticity and 3D topography.
So it can be seen that the two-dimensional flow structure and 3D bed surface coupling based on our experiment can be a good quantitative study of pier scouring mechanism. According to the quantitative analysis of this paper, strong shear stress and horseshoe vortices appeared upstream and on both sides of the pier, and the scour hole in the corresponding area was the deepest. This is because the shear force representing the downward cutting of turbulent flow governed the maximum depth, and the sediment near the upstream surface of the cylinder was swept into suspension by the horseshoe vortex and washed downstream by large streamwise vortices. The primary assumption pertained to the turbulent flow structure, as shown in Figure 15. Here, the undercut-ring structures show the shear stress, and the streaky red form shows the large streamwise vortices. Owing to the synergistic effect by the above mentioned turbulent structures around the pier, the deepest scouring hole was formed. Additionally, the results show that a long and narrow large vortex structure was formed behind the pier model, and its extreme region corresponded to a relatively shallow scouring groove. Thus, we can conclude that the streaky vortex behind the pier scours the sediment, produces shallow scouring holes, and expands downstream at a symmetrical angle to the x-axis. Notably, this assumption in Figure 15 can be used to explain the measured flow field and 3D topographic structure in this study.
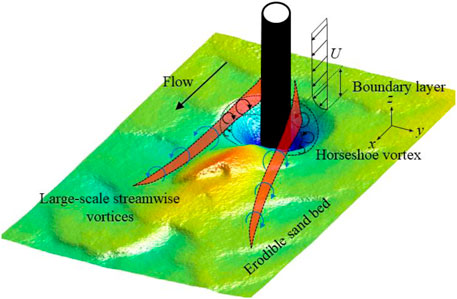
FIGURE 15. Model of flow structures around cylinder pier.
4 Conclusion
The coupling relationships between the turbulent structure and scour topography were investigated to determine the mechanism of the local scour. The following conclusions were obtained.
(1) A 3D structure of the scour topography can be reconstructed accurately using the SFM method. When the scour reached equilibrium, the scour holes exhibited irregular inverted cones and the maximum scour depth and scour hole area increased with the flow strength.
(2) As the flow intensity increased, the distances between the peak positions of the sand dune and the pier increased, both the length and height of the dune increased, and the “tail fin” angle of the dune decreased. Significantly, the area and volume of the scour hole increased with the dimensionless depth h/H in an upward parabolic trend.
(3) When the scour reached equilibrium, the rotational strength and shear stress increased with the flow intensity. The shear stress induced by the horse vortex was concentrated upstream and on both sides of the pier, and the downcutting erosion resulted in a deeper scour. The rotational strength patterns were primarily distributed on both sides of the cylinder and extended downstream, forming large streamwise vortices that extended downstream of the cylinder. Finally, the structure resulted in the formation of long shallow grooves on both sides of the sand dune downstream by pushing the sediment aside.
The scoured topography structures and flow fields observed in the present study can be applied to other conditions. Their relationships can reveal the mechanism of local scour for a vertical cylinder. To render the scoured topography structures and flow fields applicable to more general flow conditions, the flow shear force, streamwise vortex, reconstructed scoured bed, and quantitatively analyzed data should be further investigated.
Data availability statement
The original contributions presented in the study are included in the article/Supplementary material, further inquiries can be directed to the corresponding authors.
Ethics statement
The manuscript presents research on animals that do not require ethical approval for their study. Written informed consent was obtained from the individual(s) for the publication of any potentially identifiable images or data included in this article.
Author contributions
JL: Formal Analysis, Investigation, Writing–original draft. NX: Methodology, Supervision, Writing–original draft. HW: Conceptualization, Data curation, Writing–review and editing. DF: Data curation, Supervision, Writing–review and editing. XL: Investigation, Writing–review and editing. WW: Data curation, Investigation, Writing–original draft.
Funding
The author(s) declare financial support was received for the research, authorship, and/or publication of this article. This work was funded by the CRSRI Open Research Program (Program SN: CKWV2018461/KY); the Open Fund of the Zhejiang River and Port Institute, Grant NO. ZIHE21003, and the Open Research Fund of Key Laboratory of Sediment Science and Northern River Training, the Ministry of Water Resources, China Institute of Water Resources and Hydropower Research, Grant NO. IWHR-SEDI-2022-09.
Acknowledgments
We would like to express our sincere appreciation to the reviewers and the editor for their valuable comments and constructive suggestions.
Conflict of interest
Authors NX, DF, and XL were employed by the company Fuzhou Planning & Design Research Institute Co., Ltd.
The remaining authors declare that the research was conducted in the absence of any commercial or financial relationships that could be construed as a potential conflict of interest.
Publisher’s note
All claims expressed in this article are solely those of the authors and do not necessarily represent those of their affiliated organizations, or those of the publisher, the editors and the reviewers. Any product that may be evaluated in this article, or claim that may be made by its manufacturer, is not guaranteed or endorsed by the publisher.
References
Apsilidis, N., Diplas, P., Dancey, C. L., and Bouratsis, P. (2015). Time-resolved flow dynamics and Reynolds number effects at a wall–cylinder junction. J. Fluid Mech. 776, 475–511. doi:10.1017/jfm.2015.341
Astarita, T., and Cardone, G. (2004). Analysis of interpolation schemes for image deformation methods in PIV. Exp. Fluids. 38 (2), 233–243. doi:10.1007/s00348-004-0902-3
Ataie-Ashtiani, B., and Beheshti, A. A. (2006). Experimental Investigation of Clear-Water Local Scour at Pile Groups. J. Hydraulic Eng. 132 (10), 1100–1104. doi:10.1061/(asce)0733-9429(2006132:10(1100)
Ataie-Ashtiani, B., Baratian-Ghorghi, Z., and Beheshti, A. A. (2010). Experimental Investigation of Clear-Water Local Scour of Compound Piers. J. Hydraulic Eng. 136 (6), 343–351. doi:10.1061/(asce)0733-9429(2010136:6(343)
Bouratsis, P. P., Diplas, P., Dancey, C. L., and Apsilidis, N. (2013). High-resolution 3-D monitoring of evolving sediment beds. Water Resour. Res. 49 (2), 977–992. doi:10.1002/wrcr.20110
Chakraborty, P., Balachandar, S., and Adrian, R. J. (2005). On the relationships between local vortex identification schemes. J. Fluid Mech. 535, 189–214. doi:10.1017/s0022112005004726
Coleman, S. E., and Melville, B. W. (2001). Transfund New Zealand research report. Bridge-scour screening methodology for New Zealand bridges
da Silva, B. L., Chakravarty, R., Sumner, D., and Bergstrom, D. J. (2020). Aerodynamic forces and three-dimensional flow structures in the mean wake of a surface-mounted finite-height square prism. Int. J. Heat Fluid Flow 83, 108569. doi:10.1016/j.ijheatfluidflow.2020.108569
Dargahi, B. (1989). The turbulent flow field around a circular cylinder. Exp. Fluids 8 (1-2), 1–12. doi:10.1007/bf00203058
Das, R., Das, S., Jaman, H., and Mazumdar, A. (2018). Impact of Upstream Bridge Pier on the Scouring Around Adjacent Downstream Bridge Pier. Arab. J. Sci. Eng. 44 (5), 4359–4372. doi:10.1007/s13369-018-3418-5
Dey, S., Bose, S. K., and Sastry, G. L. N. (1995). Clear Water Scour at Circular Piers: a Model. J. Hydraulic Eng. 121 (12), 869–876. doi:10.1061/(asce)0733-9429(1995121:12(869)
Dey, S., and Raikar, R. V. (2007). Characteristics of Horseshoe Vortex in Developing Scour Holes at Piers. J. Hydraulic Eng. 133 (4), 399–413. doi:10.1061/(asce)0733-9429(2007133:4(399)
Dubief †, Y., and Delcayre ‡, F. (2000). On coherent-vortex identification in turbulence. J. Turbul. 1, N11. doi:10.1088/1468-5248/1/1/011
Ettema, R., Constantinescu, G., and Melville, B. W. (2017). Flow-Field Complexity and Design Estimation of Pier-Scour Depth: sixty Years since Laursen and Toch. J. Hydraulic Eng. 143 (9). doi:10.1061/(asce)hy.1943-7900.0001330
Ettema, R., Kirkil, G., and Muste, M. (2006). Similitude of Large-Scale Turbulence in Experiments on Local Scour at Cylinders. J. Hydraulic Eng. 132 (1), 33–40. doi:10.1061/(asce)0733-9429(2006132:1(33)
Furukawa, Y., and Ponce, J. (2010). Accurate, dense, and robust multiview stereopsis. IEEE Trans. Pattern Anal. Mach. Intell. 32 (8), 1362–1376. doi:10.1109/TPAMI.2009.161
Graf, W. H., and Istiarto, I. (2010). Flow pattern in the scour hole around a cylinder. J. Hydraulic Res. 40 (1), 13–20. doi:10.1080/00221680209499869
Guan, D., Chiew, Y.-M., Wei, M., and Hsieh, S.-C. (2019). Characterization of horseshoe vortex in a developing scour hole at a cylindrical bridge pier. Int. J. Sediment Res. 34 (2), 118–124. doi:10.1016/j.ijsrc.2018.07.001
Jia, Y., Altinakar, M., and Guney, M. S. (2017). Three-dimensional numerical simulations of local scouring around bridge piers. J. Hydraulic Res. 56 (3), 351–366. doi:10.1080/00221686.2017.1356389
Kim, H. S., Nabi, M., Kimura, I., and Shimizu, Y. (2015). Computational modeling of flow and morphodynamics through rigid-emergent vegetation. Adv. Water Resour. 84, 64–86. doi:10.1016/j.advwatres.2015.07.020
Kim, H. S., Nabi, M., Kimura, I., and Shimizu, Y. (2014). Numerical investigation of local scour at two adjacent cylinders. Adv. Water Resour. 70, 131–147. doi:10.1016/j.advwatres.2014.04.018
Link, O., González, C., Maldonado, M., and Escauriaza, C. (2012). Coherent structure dynamics and sediment particle motion around a cylindrical pier in developing scour holes. Acta geophys 60 (6), 1689–1719. doi:10.2478/s11600-012-0068-y
Link, O., Henríquez, S., and Ettmer, B. (2018). Physical scale modelling of scour around bridge piers. J. Hydraulic Res. 57 (2), 227–237. doi:10.1080/00221686.2018.1475428
Melville, B. W. (1997). Pier and Abutment Scour: integrated Approach. J. Hydraulic Eng. 123 (2), 125–136. doi:10.1061/(asce)0733-9429(1997123:2(125)
Melville, B. W., and Raudkivi, A. J. (1977). Flow Characteristic in local Scour at Bridge Piers. J. Hydraulic Res. 15 (4), 373–380. doi:10.1080/00221687709499641
Roulund, A., Sumer, B. M., FredsØe, J., and Michelsen, J. (2005). Numerical and experimental investigation of flow and scour around a circular pile. J. Fluid Mech. 534, 351–401. doi:10.1017/s0022112005004507
Roy, S., Barman, K., and Debnath, K. (2019). Statistical Analysis of Flow Structures around a Circular Cylinder. Environ. Process. 6 (3), 773–787. doi:10.1007/s40710-019-00376-9
Sumer, B. M., Chua, L. H. C., Cheng, N. S., and Fredsøe, J. (2003). Influence of Turbulence on Bed Load Sediment Transport. J. Hydraulic Eng. 129 (8), 585–596. doi:10.1061/(asce)0733-9429(2003129:8(585)
Unger, J., and Hager, W. H. (2006). Down-flow and horseshoe vortex characteristics of sediment embedded bridge piers. Exp. Fluids. 42 (1), 1–19. doi:10.1007/s00348-006-0209-7
Yagci, O., Celik, M. F., Kitsikoudis, V., Ozgur Kirca, V. S., Hodoglu, C., Valyrakis, M., et al. (2016). Scour patterns around isolated vegetation elements. Adv. Water Resour. 97, 251–265. doi:10.1016/j.advwatres.2016.10.002
Yagci, O., Yildirim, I., Celik, M. F., Kitsikoudis, V., Duran, Z., and Kirca, V. O. (2017). Clear water scour around a finite array of cylinders. Appl. Ocean Res. 68, 114–129. doi:10.1016/j.apor.2017.08.014
Yang, Y., Melville, B. W., Macky, G. H., and Shamseldin, A. Y. (2020). Temporal Evolution of Clear-Water Local Scour at Aligned and Skewed Complex Bridge Piers. J. Hydraulic Eng. 146 (4). doi:10.1061/(asce)hy.1943-7900.0001732
Yao, W., An, H., Draper, S., Cheng, L., and Harris, J. M. (2018). Experimental investigation of local scour around submerged piles in steady current. Coast. Eng. 142, 27–41. doi:10.1016/j.coastaleng.2018.08.015
Zanke, U. C. E., Hsu, T.-W., Roland, A., Link, O., and Diab, R. (2011). Equilibrium scour depths around piles in noncohesive sediments under currents and waves. Coast. Eng. 58 (10), 986–991. doi:10.1016/j.coastaleng.2011.05.011
Zarrati, A. R., Chamani, M. R., Shafaie, A., and Latifi, M. (2010). Scour countermeasures for cylindrical piers using riprap and combination of collar and riprap. Int. J. Sediment Res. 25 (3), 313–322. doi:10.1016/s1001-6279(10)60048-0
Zhang, Q., Zhou, X.-L., and Wang, J.-H. (2017). Numerical investigation of local scour around three adjacent piles with different arrangements under current. Ocean. Eng. 142, 625–638. doi:10.1016/j.oceaneng.2017.07.045
Zhao, M., Cheng, L., and Zang, Z. (2010). Experimental and numerical investigation of local scour around a submerged vertical circular cylinder in steady currents. Coast. Eng. 57 (8), 709–721. doi:10.1016/j.coastaleng.2010.03.002
Zhao, M., Zhu, X., Cheng, L., and Teng, B. (2012). Experimental study of local scour around subsea caissons in steady currents. Coast. Eng. 60, 30–40. doi:10.1016/j.coastaleng.2011.08.004
Keywords: local scour, particle image velocimetry (PIV), structure from motion (SFM), horse vortex, scour-hole topography
Citation: Li J, Xu N, Wang H, Fu D, Liu X and Wu W (2023) Experimental investigation of the interconnections between turbulent structure and scouring topographic characteristics. Front. Environ. Eng. 2:1269708. doi: 10.3389/fenve.2023.1269708
Received: 30 July 2023; Accepted: 28 September 2023;
Published: 11 October 2023.
Edited by:
Ciro Fernando Bustillo LeCompte, Toronto Metropolitan University, CanadaReviewed by:
Carlo Gualtieri, University of Naples Federico II, ItalyBimlesh Kumar, Indian Institute of Technology Guwahati, India
Copyright © 2023 Li, Xu, Wang, Fu, Liu and Wu. This is an open-access article distributed under the terms of the Creative Commons Attribution License (CC BY). The use, distribution or reproduction in other forums is permitted, provided the original author(s) and the copyright owner(s) are credited and that the original publication in this journal is cited, in accordance with accepted academic practice. No use, distribution or reproduction is permitted which does not comply with these terms.
*Correspondence: Hao Wang, wanghao_0512@163.com; Dabao Fu, fzufdb@163.com