Anaerobic biodegradation of brown grease and its potential as a source of renewable energy
 Amy Heindel1
  Metin Duran
- 1Civil and Environmental Engineering Department, Villanova University, Villanova, PA, United States
- 2Somax Bioenergy, Limited Liability Company, Spring City, PA, United States
The purpose of the study was twofold. The first was to study the anaerobic digestibility and the biochemical methane potential (BMP) of brown grease (BG)–fats and oils collected from restaurants and similar food production facilities. The second objective was to investigate the effects of adding dry, food waste derived hydrochar to enhance the digestion process, specifically as a possible in situ agent to improve biogas quality. The BMP tests involved various BG loadings between 3 and 30 g BG/L. The results indicate that BG is highly digestible under anaerobic conditions with 354 mL CH4/g COD equivalent of BG at 1 atm and 35°C testing conditions, which translates into 28 million gasoline gallon equivalent (GGE) potential energy that could be recovered by anaerobically digesting or co-digesting BG. The particular hydrochar investigated in this study did not show any potential to increase biogas CH4 content.
1 Introduction
Anaerobic digestion is a well-established technology commonly used to stabilize municipal wastewater sludge while reducing mass of biosolids for disposal. It is also a proven and effective process for pretreatment of high strength industrial wastewaters. The process provides the additional benefit of creating an opportunity to utilize methane (CH4), the main product of anaerobic digestion, as a renewable energy source (McCarty et al., 2011; Totzke, 2017).
Fats, oils and greases (FOG) require special disposal and constitute a burden on sewage networks if disposed of improperly. FOG deposits weighing as much as 140 tons have been found in London sewers and removal of such FOG deposits costs millions of dollars each year (Adam, 2018). Due to its high organic matter content, FOG also represent a potential source of renewable energy which could be captured through anaerobic digestion. FOG has been shown to be amenable to co-digestion processes as the addition of wastewater treatment scum, which is made up of FOG, was shown to increase biogas production from anaerobic digestion process without any negative effects on the digestion process (Alanya et al., 2013). The authors demonstrated that scum at the highest loading rate studied (7 g COD/L.d) led to generation of 250L CH4/kg COD fed (1 atm and 35°C). Other researchers also demonstrated the anaerobic digestion and co-digestion of FOG along with other biomass including wastewater sludge and animal manure. An excellent review by Long et al. (2012) details the previous findings on anaerobic digestion/co-digestion of FOG. The authors noted that long-term anaerobic digestion of FOG at high loading rates may potentially lead to accumulation of long chain fatty acids and digester failures.
According to the National Renewable Energy Laboratory’s (NREL) designation, FOG include yellow grease (spent cooking oil), brown grease (BG), and animal fats (US Department of Energy, 2017). BG, also referred to as trap grease, is collected from grease traps at restaurants and similar food processing facilities. Traps separate grease from water and thus concentrate grease for special disposal. Approximately 1.7 million tons of brown grease is produced each year in the United States, corresponding to 501 million gasoline gallon equivalent (GGE) potential energy, which is largely untapped (Milbrandt and Skaggs, 2016, cited in the US Department of Energy, 2017).
Although there have been numerous studies looking at the anaerobic digestion and co-digestion of FOG, which in some cases included BG (Long et al., 2012), literature on anaerobic digestion of BG alone is scarce. To the best of authors’ knowledge, only one previous research evaluated anaerobic digestion of BG at a pilot-scale study. It was shown that BG as a feedstock to a pilot-scale high-rate anaerobic digester produced a greater volume of CH4 per kg of volatile solids (VS) removed (0.40–0.77 m3/kg VSremoved) than other feedstocks which are commonly used, such as municipal sludge (0.309 m3/kg VSremoved) or corn stover (0.239 m3/kg VSremoved) (Zhang et al., 2014) The authors reported consistently high CH4, 75%, in the biogas from anaerobic digestion of BG.
The biogas produced through anaerobic digestion of organic matter can be utilized in a number of ways. One method is combustion to generate electricity. However, a significant portion of the potential energy is lost as heat, with only 30 to 40 percent becoming electricity. Energy recovery may be increased by using a combined heat and power (CHP) approach, utilizing the excess heat to reduce energy costs of the wastewater treatment plant itself (McCarty et al., 2011). Another way to utilize biogas is in compressed natural gas (CNG), using biomethane as fuel for vehicles. However, this method requires that biogas be upgraded to have at least an 88% CH4 content, necessitating additional infrastructure. The approach also requires specialized vehicles which are designed for CNG (or in many cases both CNG and diesel) as well as additional monitoring to prevent oxygen contents which could lead to explosions (Ong et al., 2014).
Injecting CH4 directly into the natural gas pipeline is a desirable alternative because it allows the gas to be converted to electricity in larger energy generation facilities, which have a greater efficiency than small-scale systems (Ong et al., 2014). The final product must be refined to at least 96 percent CH4 in order to meet standards for pipeline usage (Shen et al., 2015). This presents an issue since anaerobic digestion normally produces a biogas made up of 50–70 percent CH4 (Shen et al., 2015). The remaining unwanted gases include carbon dioxide, water vapor, hydrogen sulfide, nitrogen, hydrogen, and trace amounts of other gases (Tchobanoglous et al., 2013). A variety of methods may be applied to purify biogas, of which pressure swing adsorption (PSA) is the most common. In-situ removal of unwanted gases would provide considerable energy savings, not to mention the benefit of avoiding construction of PSA or other gas purification facilities. This would both improve production and cost efficiency of biomethane, increasing viability of the application of anaerobic digestion.
Previous studies have shown the potential for in situ sequestering of unwanted gases with corn stover biochar (Shen et al., 2015). Likewise, hydrochar, a type of biochar produced through hydrothermal carbonization (HTC), has also shown promise in increasing the CH4 yield during anaerobic digestion (Mumme et al., 2014). However, this is possibly due to the digestible contents of the hydrochar. In another case hydrochar was found to be inhibitive to the anaerobic digestion process (Mumme et al., 2014; Wang et al., 2017).
The purpose of this study was twofold. The first objective was to study the anaerobic digestibility and hence biomethane potential of BG. The second objective was to investigate the effect of adding dry hydrochar product to increase CH4 content of the biogas.
2 Materials and methods
2.1 Experimental design
The first phase of the experiment was to assess anaerobic digestibility and biochemical methane potential (BMP) of BG. The test was conducted according to a modified version of the standard testing protocol originally developed by Owen and collaborators (Owen et al., 1979). Bench-scale tests were conducted using serum bottles of 165 mL capacity and 50 mL of working volume containing seed biomass and with four treatments of increasing concentrations of BG from 3 g/L to 30.1 g/L (see Table 1). The concentrations translate to a typical loading range, 0.5–5 g COD/L, for anaerobic digesters. No supplemental nutrient or alkalinity was added to BMP bottles. Each BG dose was tested in triplicate under mesophilic conditions (35°C) in a warm water bath and continually agitated at approximately 100 rpm by a shaking water bath (American Scientific Products Model YB-531).
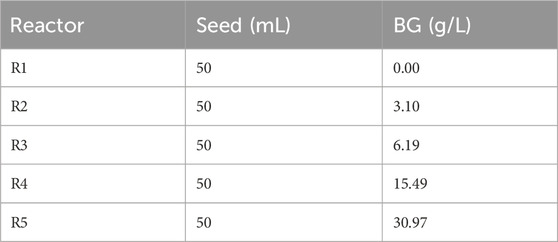
Table 1. First phase BMP matrix.
The second phase of the experiment was conducted using the same method, but with constant levels of seed biomass and BG, and increasing concentrations of dry hydrochar per g of TS in digester contents (see Table 2).
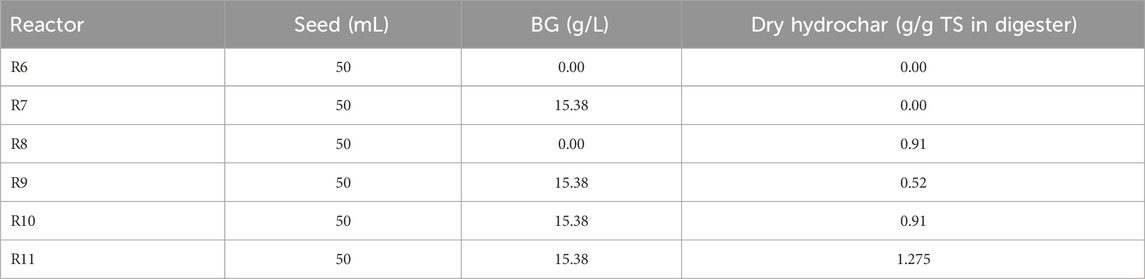
Table 2. Second phase BMP matrix.
After each serum bottle was prepared according to the experimental design explained in Table 1 and Table 2, it was deoxygenated by purging it with 20% CO2 and 80% N2 gas mixture for 30 s before being sealed.
2.2 Biogas analysis
The volume of biogas produced in the serum bottles was measured periodically using the liquid displacement method. A 21G 1 precision glide needle was connected to a 100 mL burette and an aspirator bottle filled with diluted HCl solution (pH 2) and Rhodamine B dye was added for improved visibility. The amount of the gas produced in each bottle was measured by determining the volume of the liquid displaced by the gas after each bottle was vented into the system. Each time the biogas volume was measured, a sample of the biogas was analyzed for its CH4 content using a Hewlett Packard™ Model 6,890 gas chromatograph with thermal conductivity detector and an 80-m HayeSep Q 80/100 packed column. Helium was the carrier gas with a flow rate of 25 mL/min. Samples of 200 μL were collected with gas-tight, pressure lock syringes and were tested for 3.3 min at 75°C constant oven temperature. Injector and detector temperatures were 250°C.
Pure CH4 gas (MicromatTM—14 Cylinder from Matheson Tri- Gas®, Alltech Associates, Inc. Deerfield, IL, United States) was used to establish a calibration curve. Pure CH4 gas samples were also tested prior to sample testing in order to confirm continued calibration.
2.3 Other analytical methods
Total chemical oxygen demand (COD) tests were carried out according to the closed reflux colorimetric method as described in Standard Methods (Eaton et al., Section 5220D, 1995). High range (0–1,500 mg/L) COD digestion vials and a spectrophotometer (Model DR 4000 U, Hach Company, Loveland, CO, United States) at 600 nm were used. Depending on the expected total COD, several dilutions (10 through 100 fold) of samples were prepared with Milli-Q®-Plus water (Milli Pore, Billerica, MA, United States) to ensure that the resulting COD in the diluted sample was below approximately 1,200 mg/L.
Standard methods Section 2540 B-E were followed for total solids (TS) and VS analyses TS and VS analyses (Eaton et al., 1995).
The pH of samples was determined using an Oakton™ pHtestr 30 pH meter (Oakton Instruments, Vernon Hills, IL, United States) calibrated prior to each use.
Total alkalinity was measured by the titration method in order to determine the buffering capacity of the digester. According to Standard Methods Section 2320B, 50 mL of continually stirred samples is titrated down to a pH of 4.3 using 0.1 N sulfuric acid (Eaton et al., 1995).
2.4 Characteristics of seed, BG, and hydrochar
Anaerobic seed culture was procured from a full-scale mesophilic anaerobic digester at the Phoenixville Wastewater Treatment Plant, Phoenixville, Pennsylvania, United States, and refrigerated until used. The TS content of the seed culture was 2.82% while the VS content was 1.86% or 66% of TS. The seed culture was found to have an alkalinity of 2,890 mg as CaCO3/L and a pH of 7.11.
COD analysis of concentrated and highly heterogenous samples, such as BG, is difficult due to not only the heterogenous nature of the samples but also to large errors introduced by the high dilution rates required. COD analysis on nine different samples with different dilution rates showed that the average COD of BG is 261 mg COD/g BG (±168). Interestingly, only two samples out of the nine analyzed were very high. Considering those two samples as outliers, COD measurements were much more consistent with an average of 178 mg COD/g BG (±25). Thus, 178 mg COD/g BG was used for data analysis.
The BG was obtained from a commercial BG collection company and it was a composite sample from their collection truck. The wet density of the BG was 0.9345 kg/L. The TS content was 16.26%, almost all in VS form, over 99% VS. The pH of the BG was 4.23. BG was prepared for use in BMP testing by heating it to liquify the solids.
The hydrochar was produced through hydrocarbonization of mixed food waste which consisted of, by wet weight: banana (15%), yogurt (10%), chicken (30%), bread (30%), and potato (15%). The mixed food waste was processed at 180°C with a retention time of 2 h. The TS content of the wet hydrochar was 22.8%. Dry hydrochar was prepared by straining and drying the wet hydrochar at 105°C.
3 Results and discussion
The BMP tests were conducted to determine the anaerobic digestibility and CH4 potential of BG under different initial BG concentrations. These experiments lasted 30 days in order to ensure that the ultimate BMP of BG is reached. The cumulative CH4 productions for various BG loadings are shown in Figure 1.
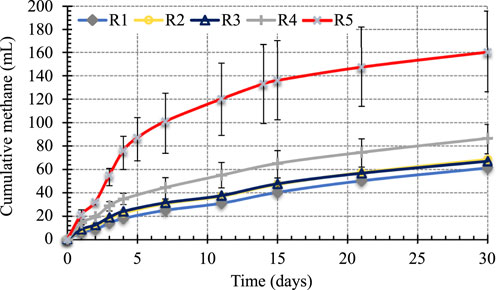
Figure 1. Cumulative methane produced as a function BG loading.
The results presented in Figure 1 show that as BG concentration increases, the cumulative CH4 produced also increased, indicating that BG is anaerobically digestible even at the highest concentration tested, 30.97 g BG/L, or 5.51 g COD/L. It is important to note that the highly heterogenous nature of BG sample is reflected by greater deviation from the average cumulative CH4 (error bars represent low and high measurements) as BG concentration increased.
The rate of CH4 production for each BG loading is the slope of the linear portion of the cumulative CH4 curve in Figure 1. The highest CH4 production occurred within the first 4 days of BMP tests and the CH4 was linear during this time. The net cumulative CH4 production, CH4 produced under each BG loading minus the CH4 produced in seed control, are presented in Figure 2 along with the trendlines. The slopes of these trend lines are net CH4 production rates under different BG loading.
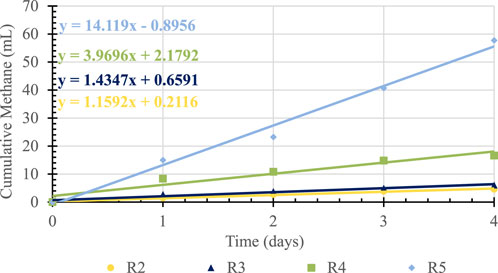
Figure 2. Methane production rates at different BG loadings.
Clearly, the heterogenous nature of the BG also impacted the specific BMP of BG, which ranged from a low of 18.5 to a high of 63.8 L CH4/kg BGfed (at 1 atm and 35°C). Using the average 178 mg COD/g BG, these translate to specific BMP ranging from 104 to 358 L CH4/kg CODfed (at 1 atm and 35°C). These values are comparable to 250 L CH4/kg COD fed (1 atm and 35°C) reported for anaerobic co-digestion of scum from wastewater treatment plants reported by Alanya et al. (2013). Unfortunately, no direct comparison can be made to the results reported by Zhang et al. (2014) due to different units of BMP used by the authors. Regardless, 358L CH4/kg CODfed at the highest BG loading translate into 32 trillion BTUs potential energy annually. This 28 million GGE potential energy could easily be recovered by anaerobically digesting or co-digesting BG without any investment in infrastructure.
When the CH4 production rate is divided by the mass of seed biomass expressed in g VS, it results in specific CH4 production rates. When the specific CH4 production rate is expressed in units of COD equivalents of CH4–395 mL CH4 produced per gram of COD removed at 1 atm and 35°C (Speece 1996)–it is equal to the specific substrate utilization rate. Figure 3 shows the specific CH4 production rates, in COD equivalent, for different BG loadings expressed in g COD/L.
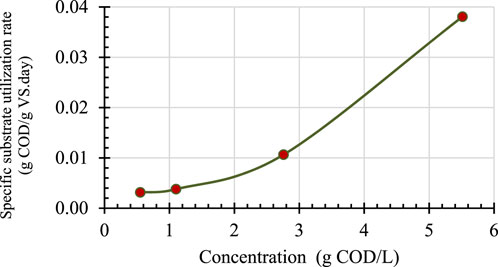
Figure 3. Specific substrate utilization rate as a function of initial BG concentration.
The data presented in Figure 3 show that the specific substrate utilization rate is linearly increasing even at the highest substrate concentrations tested, indicating that maximum specific substrate utilization has not been reached at 5 g COD/L loading. Regardless, 0.04 g COD/g VS. day substrate utilization rate at the highest BG loading translates into 0.8 kg COD/m3 day volumetric loading rate for typical low rate anaerobic processes, which are operated at 2% VS content. Considering the fact that typical low rate anaerobic processes with complete mixing are designed for 1–2 kg COD/m3 day loading rates for easily biodegradable soluble COD containing wastes (Totzke, 2017), 0.8 kg COD/m3. day for BG is very encouraging. In addition, FOG is typically co-digested with sludge and there is evidence in literature that co-digestion of FOG and sludge may have synergistic effects and thus higher loading rates might be possible (Long, et al., 2012).
The next iteration of BMP tests was conducted to determine the impact of increasing hydrochar concentrations on total CH4 production, CH4 production rate, and biogas quality. These BMP were carried out over a 14-day period as determining CH4 potential of hydrochar was not an objective. The experimental design was explained earlier in Table 2. Cumulative CH4 from two controls–R6 (seed only) and R7 (BG only)–along with those from four reactors with increasing concentrations of hydrochar are presented in Figure 4.
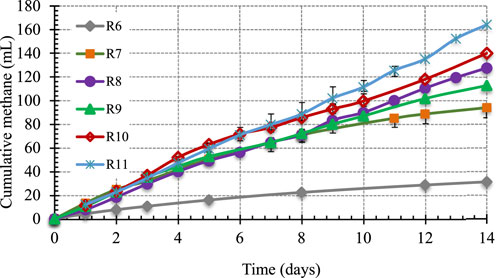
Figure 4. Effects of hydrochar on cumulative methane production.
The results presented in Figure 4 show that increasing concentrations of hydrochar resulted in higher cumulative CH4 produced. Reactor 9, 10, and 11 containing constant BG at 15.96 g/L and hydrochar concentrations of 0.52, 0.91 and 1.275 g/g TS generated 113, 140, and 164 mL of CH4 (1 atm and 35°C), respectively. Since BG concentration was constant at 15.36 g/L in these reactors, the increase in cumulative CH4 with increasing hydrochar concentrations can only be attributed to the presence of anaerobically biodegradable material in hydrochar.
The rate of CH4 production for each treatment was again calculated as done with the BG trials and using the first 5 days of testing where CH4 production increased linearly. Figure 5 shows the cumulative CH4 production during the first 5 days of testing and the corresponding trendlines. It should be noted that the cumulative CH4 for each hydrochar concentration reported in Figure 5 are net CH4 produced, i.e., CH4 from controls are subtracted.
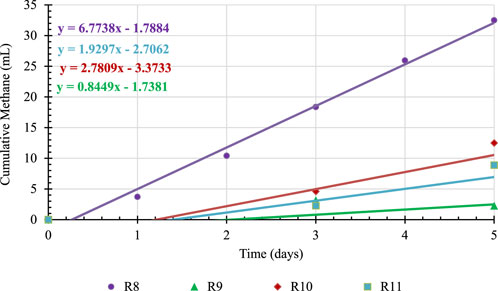
Figure 5. Methane production rates in the presence of hydrochar.
When the rates of CH4 production in Figure 5 are analyzed, it is noted that the reactor containing hydrochar only (R8) has the highest CH4 production rate. When BG is introduced in the reactor (R9, R10 and R11), the rate decreases indicating that anaerobic microorganism are inhibited due to an antagonistic effect between hydrochar and BG. The cumulative CH4 production data presented in Figure 4 indicate that this antagonistic effect lasted throughout the 14 days of incubation as reactors with both BG and hydrochar (R9, R10 and R11) produced less CH4 than that of sum of net CH4 from BG only (R7), 63 mL, and hydrochar only (R8), 97 mL.
One of the objectives of this study to assess if hydrochar would act as an in situ CO2 sequestering agent leading to higher CH4 content in the gas phase. Figure 6 shows the gas phase CH4 content in Reactor 6 through 11 (see Table 2 for reactor contents).
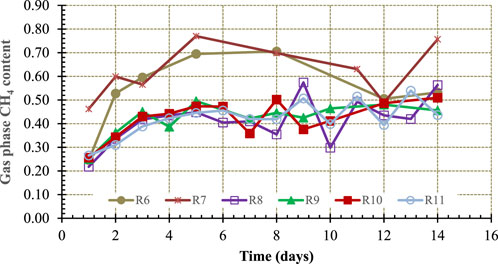
Figure 6. Impact of hydrochar on gas phase methane content.
One-way, single factor Anova analyses with 95% confidence level and eight degrees of freedom between the control reactors and the reactors containing increasing concentrations of hydrochar–0.52–1.275 g HC/g TS (Reactor 8 through 11 in Figure 6)–was carried out to determine if CH4 content of biogas in these reactors was statistically different. The results showed that there was no statistically significant difference in gas phase CH4 content of controls and hydrochar containing reactors suggesting that the food waste derived hydrochar studied is not a suitable in situ CO2 sequestering agent.
4 Conclusion
In summary, the results presented herein indicate that BG is highly digestible under anaerobic conditions with 354 mL CH4/g COD equivalent of BG (1 atm and 35°C) biomethane potential. The maximum substrate utilization was not reached even at the highest initial concentration of BG (30.97 g BG/L or 5.5 g COD/L) suggesting that BG can be utilized by anaerobic microbial consortia at a rate of 0.04 g COD/gVS.day or higher. At a typical 2% VS content of anaerobic digesters, this translates into 0.8 kg COD/m3 day or higher volumetric loading rate. The particular food waste derived hydrochar tested in this study did not show any capacity to sequester CO2 in the biogas.
Data availability statement
The raw data supporting the conclusion of this article will be made available by the authors, without undue reservation.
Author contributions
AH: Investigation, Writing–review and editing. RL: Funding acquisition, Writing–review and editing. DS: Project administration, Writing–review and editing. MD: Conceptualization, Funding acquisition, Investigation, Project administration, Writing–review and editing.
Funding
The author(s) declare financial support was received for the research, authorship, and/or publication of this article. This study received partial funding from Somax Environmental, Inc. The hydrochar was prepared by Jeremy Taylor.
Conflict of interest
DS was employed by Somax Bioenergy.
The remaining authors declare that the research was conducted in the absence of any commercial or financial relationships that could be construed as a potential conflict of interest.
The authors declare that this study received funding from Somax Bioenergy, LCC. The funder had the following involvement in the study: Review manuscript for intellectual property protection.
Publisher’s note
All claims expressed in this article are solely those of the authors and do not necessarily represent those of their affiliated organizations, or those of the publisher, the editors and the reviewers. Any product that may be evaluated in this article, or claim that may be made by its manufacturer, is not guaranteed or endorsed by the publisher.
References
Adam, K. (2018). A Nasty ‘Fatberg,’ a lump of grease, wet wipes and condoms, is now being displayed at the Museum of London. Washington Post.
Alanya, S., Yilmazel, Y. D., Park, C., Willis, J. L., Keaney, J., Kohl, P. M., et al. (2013). Anaerobic co-digestion of sewage sludge and primary clarifier skimmings for increased biogas production. Water Sci. Technol. 67 (1), 174–179. doi:10.2166/wst.2012.550
Long, J. H., Aziz, T. N., Reyes, F. L. d. l, and Ducoste, J. J. (2012). Anaerobic co-digestion of fat, oil, and grease (FOG): a review of gas production and process limitations. Process Saf. Environ. Prot. 90, 231–245. doi:10.1016/j.psep.2011.10.001
McCarty, P. L., Bae, J., and Kim, J. (2011). Domestic wastewater treatment as a net energy producer - can this be achieved? Environ. Sci. Technol. 45 (17), 7100–7106. doi:10.1021/es2014264
Milbrandt, A., and Skaggs, R. (2016). Waste-to-energy: feedstock evaluation and biofuel production potential. Internal NREL/PNNL quarterly progress report. Agreement #: 29526, 29527; FY16.
Mumme, J., Srocke, F., Heeg, K., and Werner, M. (2014). Use of biochars in anaerobic digestion. Bioresour. Technol. 164, 189–197. doi:10.1016/j.biortech.2014.05.008
Ong, M. D., Williams, R. B., and Kaffka, S. R. (2014). Draft comparative assessment of technology options for biogas clean-up. California: California Biomass Collaborative, 27–28.
Owen, W. F., Stuckey, D. C., Healy, J. B., Young, L. Y., and McCarty, P. L. (1979). Bioassay for monitoring biochemical methane potential and anaerobic toxicity. Water Res. 13 (6), 485–492. doi:10.1016/0043-1354(79)90043-5
Shen, Y., Linville, J. L., Urgun-Demirtas, M., Schoene, R. P., and Snyder, S. W. (2015). Producing pipeline-quality biomethane via anaerobic digestion of sludge amended with corn stover biochar with in-situ CO2 removal. Appl. Energy 158, 300–309. doi:10.1016/j.apenergy.2015.08.016
Speece, R. E. (1996). Anaerobic biotechnology for industrial wastewaters. Nashville, TN: Archae Press, 27.
Tchobanoglous, G., Stensel, H. D., Tsuchihashi, R., and Burton, F. (2013). Wastewater engineering: treatment and resource recovery. 5. Boston, MA: McGraw-Hill Higher Education, 1083.
Totzke, D. (2017). “Industrial anaerobic treatment technologies and design,” in Workshop lecture presented at Anaerobic Treatment of High-Strength Industrial Wastes: A Practical Course Focusing on Design and Applications, Milwaukee, Wisconsin, September 12-13, 2017.
US Department of Energy (2017). Biofuels and bioproducts from wet and gaseous waste streams: challenges and opportunities. An updated report available at: https://www.energy.gov/sites/prod/files/2017/02/f34/biofuelsandbioproductsfromwetandgaseouswastestreamsfullreport.pdf.
Wang, X., Zhao, J., Yang, Q., Sun, J., Peng, C., Chen, F., et al. (2017). Evaluating the potential impact of hydrochar on the production of short-chain fatty acid from sludge anaerobic digestion. Bioresour. Technol. 246, 234–241. doi:10.1016/j.biortech.2017.07.051
Keywords: anaerobic digestion, co-digestion, brown grease, biochemical methane potential, renewable energy
Citation: Heindel A, Lee R, Spracklin D and Duran M (2024) Anaerobic biodegradation of brown grease and its potential as a source of renewable energy. Front. Environ. Eng. 3:1354582. doi: 10.3389/fenve.2024.1354582
Received: 12 December 2023; Accepted: 03 January 2024;
Published: 19 March 2024.
Edited by:
Christos S. Akratos, Democritus University of Thrace, GreeceReviewed by:
Rajat Kumar, Hong Kong Baptist University, Hong Kong SAR, ChinaShunli Wang, Chinese Academy of Agricultural Sciences, China
Copyright © 2024 Heindel, Lee, Spracklin and Duran. This is an open-access article distributed under the terms of the Creative Commons Attribution License (CC BY). The use, distribution or reproduction in other forums is permitted, provided the original author(s) and the copyright owner(s) are credited and that the original publication in this journal is cited, in accordance with accepted academic practice. No use, distribution or reproduction is permitted which does not comply with these terms.
*Correspondence: Metin Duran, metin.duran@villanova.edu