A Multi-sensor View of the 2012 Central Plains Drought from Space
 Jun Wang1*
  Amy L. Kessner1
  Clint Aegerter1 Ambrish Sharma1 Laura Judd1 Brian Wardlow2
  Jinsheng You3 Martha Shulski3 Suat Irmak4 Ayse Kilic2,5 Jing Zeng1,2
- 1Department of Earth and Atmospheric Sciences, University of Nebraska – Lincoln, Lincoln, NE, USA
- 2Center of Advanced Land Management Information Technologies and National Drought Mitigation Center, School of Natural Resources, University of Nebraska – Lincoln, Lincoln, NE, USA
- 3High Plains Regional Climate Center, School of Natural Resources, University of Nebraska – Lincoln, Lincoln, NE, USA
- 4Department of Biological Systems Engineering, University of Nebraska – Lincoln, Lincoln, NE, USA
- 5Department of Civil Engineering, University of Nebraska – Lincoln, Lincoln, NE, USA
In summer of 2012, the Central Plains of the United States experienced its most severe drought since the ground-based data record began in the late 1900s. By using comprehensive satellite data from MODIS (Moderate Resolution Imaging Spectroradiometer) and TRMM (Tropical Rainfall Measuring Mission), along with in-situ observations, this study documents the geophysical parameters associated with this drought, and thereby providing, for the first time, a large-scale observation-based view of the extent to which the land surface temperature and vegetation can likely be affected by both the severe drought and the agricultural response (irrigation) to the drought. Over non-irrigated area, 2012 summer daytime land surface temperature (LST), and Normalized Difference Vegetation Index (NDVI) monthly anomalies (with respect to climate in 2002–2011) are often respectively greater than 5 K and negative, with some extreme values of 10 K and –0.2 (i.e., no green vegetation). In contrast, much smaller anomalies (< 2 K) of LST and nearly the same NDVI are found over irrigated areas. Precipitation received was an average of 5.2 cm less, while both fire counts and fire radiative power were doubled, thus contributing in part to a nearly 100% increase of aerosol optical depth in many forested areas (close to intermountain west). Water vapor amount, while decreased over the southern part, indeed slightly increased in the northern part of Central Plains. As expected, cloud fraction anomaly is negative in the entire Central Plains; however, the greatest reduction of cloud fraction is found over the irrigated areas, which is in contrast to past modeling studies showing that more irrigation, because of its impact on LST, may lead to increase of cloud fraction.
Introduction
Droughts are known to cause both physical and economic impacts, and unlike most natural hazards (tornadoes, earthquakes, etc.), droughts approach slowly and the duration, severity, and spatial extent are difficult to forecast (Wilhite, 2005). As global warming continues from the last century to the first decade of this century, more frequent and severe droughts were observed in many areas (Dai, 2012). During the summer of 2012, the Central Plains of the United States received far less rainfall as compared to the previous 10 years (Blunden and Arndt, 2013), and saw a record drought since the ground-based data record began in late 1900s (Hoerling et al., 2014). The drought is ranked in the extreme drought category (in terms of Palmer Hydrological drought index) by National Climate Data Center (Blunden and Arndt, 2013).
Satellite remote sensing can provide crucial information for characterizing droughts on account of high spatial and temporal resolution of modern satellite sensors, which provide insights on how land and atmospheric processes and human activities respond to drought on different spatial and temporal scales (Svoboda et al., 2002; Mu et al., 2012). Lewis et al. (2011) analyzed the spatial extent and the severity of the 2010 Amazon drought with precipitation data estimated from Tropical Rainfall Measuring Mission (TRMM) and the consequences of this drought to the water stress of forest trees and carbon storage in Amazon forests. With data from the Moderate Resolution Imaging Spectroradiometer (MODIS) sensor aboard the Terra satellite, Zhao and Running (2010) showed that the droughts overall have led to the decrease of global terrestrial net primary production in 2000–2009 albeit the continuous increase of global surface temperature during this time period. Brown et al. (2008) developed a vegetation index map that integrated the traditional climate-based drought indicators and MODIS-based vegetation indices with other biophysical information and showed a case study for monitoring the 2002 drought over the U.S. Great Plains. Indeed, a recent book titled “Remote Sensing of Drought” edited by Wardlow et al. (2012) presented various techniques that are now used either in research or operational mode for developing different drought indices for charactering drought from space. The calculation of these indices not only uses traditional vegetation index and Palmer index but also other environmental variables derived from space-borne sensors, such as precipitation and evapotranspiration (Mu et al., 2012), soil moisture (Nghiem et al., 2012), temperature (Anderson et al., 2012), ground water (Rodell, 2012), etc. (see references in Wardlow et al., 2012). However, accompanying the progress of developing various indices for drought monitoring is the recognition that, in the majority of cases, no single index can describe the diversity, and complexity of drought conditions, let alone move toward a full understanding of the cause and impact of drought (Hayes et al., 2012). Operationally, the National Drought Mitigation Center uses a hybrid approach that synthesizes many indicators to produce a daily map of drought (http://drought.unl.edu).
This paper describes the methods and outcomes of characterizing the 2012 drought in the Central Plains (U.S.) with observational data, in particular, from multiple satellite sensors in space and ground observations of air temperature and soil moisture. This paper differs from past studies in the following aspects. First, as documented each year by the annual report of The State of the Climate (http://www.ncdc.noaa.gov/sotc/), many past studies have focused on the droughts in over the Southern Plains (Texas and Oklahoma) and mountain west states that, since the Twenty-first century, have experienced more frequent severe drought (such as in 2001, 2003, 2006, and 2008–2009) than the Central Plains (only once in 2012). Second, a combination of satellite-based land and atmospheric products for a wide range of geophysical parameters (including those related to cloud, aerosol, fire, and water vapor) is used to characterize the severity and impact of the 2012 drought. Since drought can both be affected by and affect atmospheric processes, our approach of combining satellite-based land and atmospheric products can enable a more complete description of drought (than with one satellite dataset or land surface parameters alone), and is valuable for future process studies related to drought. Third, our analysis also integrates the air temperature and soil moisture from ground-based observations to provide a consistent check of the results from satellite data that often can have relatively larger uncertainties. Last but not least, our analysis is also targeted over the irrigated areas, allowing us to quantify, for the first time from space, how the land surface and local atmospheric parameters are influenced by agricultural practice responding to the record drought over the Central Plains.
As documented by numerous studies (Adegoke et al., 2003; Mahmood et al., 2004; Bonfils and Lobell, 2007; Kueppers et al., 2007; Raddatz, 2007; Lobell et al., 2008), irrigation not only has a cooling effect during crop growing season in irrigated areas through its modulation of sensible and latent heat flux at the surface, but also can affect the regional and seasonal temperature through adding water vapor in the atmosphere and soil. However, these past studies of the effect of irrigation on regional climate have relied on the numerical models with limited support of ground-based observations (Cook et al., 2010 and references therein). Specific to our study region, Nebraska has the largest irrigation area and is ranked as 7th in terms of the amount of water pumped for irrigation among all the states in U.S., but only a few studies such as Adegoke et al. (2003, 2007) have studied the irrigation effect on the land-atmosphere interaction with a regional atmospheric model and observation data from a few weather stations. Hence, more observation-based studies, especially by combining satellite and ground-based observations to study regional climate impact of irrigation, are needed.
Using the data derived from the Moderate Resolution Imaging Spectroradiometer (MODIS) sensor aboard EOS-Terra and the precipitation radar (PR) aboard the Tropical Rainfall Measuring Mission (TRMM) satellite, this study analyzes the seasonal averages of land surface and atmospheric properties for summer (June–August) 2012 and compare them to their counterparts of ten-year averages (2002–2011). Uncertainty in satellite data is analyzed with the ground-based observation data of temperature and soil moisture from various locations, primarily in Nebraska. The consequences of the drought are also analyzed in the context of the changes of Normalized Difference Vegetation Index (NDVI), fire counts, Fire Radiative Power (FRP), and Aerosol Optical Depth (AOD). By using the satellite data, the impacts of agriculture (such as irrigation) and its response during the drought are revealed, including its regional impact on LST and cloud fraction, from which interesting hypotheses are articulated for future studies. We present the Data and Method, Results and Discussion, and Conclusions in the below Sections.
Data and Method
Satellite datasets for land surface temperature (LST), accumulated rainfall, NDVI, fire counts, FRP, fire density, atmospheric water vapor (AWV), cloud fraction, and AOD are analyzed to study the characteristics of the 2012 Central Plains drought that are assigned as the most extreme drought category by the U.S. Drought Monitor (http://droughtmonitor.unl.edu). The references and spatial resolution for these datasets can be found in Table 1. In brief, LST data are obtained from MODIS level-3 product (MOD11C3), which is a monthly composited average, derived from the MODIS daily global product of LST (MOD11C1), and stored as clear-sky LST values during a month's period in a 0.05° × 0.05° climate modeling grid (CMG). LSTs are retrieved using MODIS's seven thermal infrared bands (centered at wavelengths of 3.79, 3.96, 4.06, 8.52, 11.02, and 12.03 μm, respectively), and have an uncertainty within 1 K (Wan et al., 2004). Similarly, NDVI data are obtained from MOD13C2 that is a monthly composited average of 16-day 1-km MODIS NDVI product (MOD13A2), and stored in 0.05° × 0.05° CMG. NDVI is retrieved using MODIS red and near infrared bands (centered at 0.65 and 0.86 um respectively) after correction of atmospheric (gas and aerosol) effect (Huete et al., 2002; Solano et al., 2010). Monthly averages of cloud fraction, atmospheric water vapor (AWV) in columnar amount, and AOD are all obtained from MODIS level-3 Atmosphere Monthly Global Product (MOD08_M3) that in turn is derived from the MODIS level-3 Atmosphere Daily Global Product and is stored at the resolution of 1° × 1° globally (King et al., 2003). Cloud fraction is retrieved from the MODIS cloud mask algorithm in which cloud pixels are detected using a combination of 19 spectral bands in 0.55–19.93 μm (Ackerman et al., 2008; Frey et al., 2008). Water vapor is retrieved from five MODIS bands: the water vapor absorption band (0.94 μm) and four other bands centered around 0.86 0.91, 0.93, and 1.24 μm, respectively (Gao and Kaufman, 2003). AOD over land is retrieved from three MODIS bands (0.47, 0.67, and 2.1 μm) with an algorithm by Levy et al. (2007).
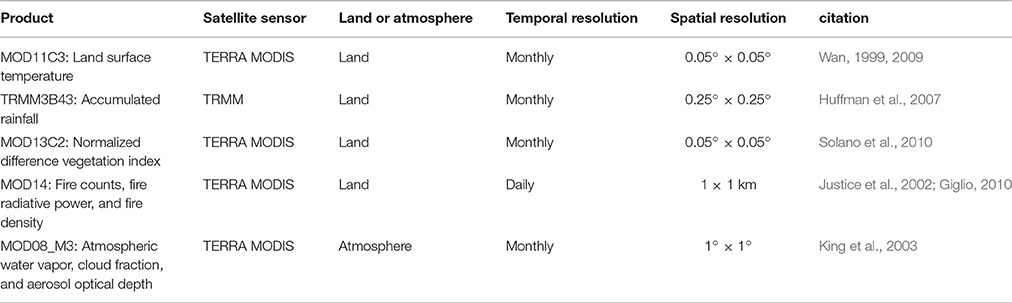
Table 1. Data products used in this study.
Since drought is normally a slow process with longer duration than a week, the monthly averages of variables such as NDVI, LST, AOD, CVW, and cloud fraction are physically meaningful to reveal drought impact on land and atmospheric characteristics. However, for variables such as fire counts, fire radiative power, and precipitation, it is their correspondingly accumulated quantities (or total amount) that are more valuable for characterizing drought impacts and characteristics. Fires are detected by using the brightness temperatures from MODIS thermal bands (in particular 4 μm) and are detected at 1 km resolution through a series of threshold tests comparing the two brightness temperatures of the suspect pixel to the background (Justice et al., 2002). FRP represents the radiative energy emitted from a fire (in megawatts) and is calculated with a predetermined best-fit equation that uses brightness temperatures of the suspect pixel and the background (Justice et al., 2002; Giglio, 2010). For this study, the fire counts (e.g., number of MODIS pixels containing fires) and fire radiative power were aggregated to 1° × 1° from level 2 1-km resolution granules (MOD14) of EOS-Terra. Subsequently, the number of fire counts per 1° × 1° grid is referred as fire density. The monthly-accumulated precipitation data (in unit of mm) is obtained from TRMM3B43 product that combines (a) the 3-hourly precipitation estimates from the infrared and microwave channels (of Microwave Imager aboard TRMM and Advanced Microwave Scanning Radiometer or AMSR aboard Aqua) with (b) the monthly-accumulated Global Precipitation Climatology Centre (GPCC) rain gauge analysis. The TRMM3B43 precipitation data is stored at 0.25° × 0.25° for 50°N−50°S region (Huffman et al., 2007).
All the aforementioned satellite-based products are extracted for the domain for this study that ranges from 35°N to 45°N and from 105°W to 90°W, and encompasses all of Nebraska, Iowa, Kansas, Missouri, and parts of the surrounding states. For each variable, the 2012 summer-averaged data were compared to the 2002–2011 10-summer averages (i.e., decadal climatology) in order to study the anomalies present during the 2012 Central Plains drought. Interactive Data Language (IDL) codes were developed to read and subset the satellite products and to conduct the subsequent analyses and visualization. For all variables, maps of their averages and anomalies were created at their corresponding native resolution of these products. All anomalies were computed by subtracting the ten-year summer average from the 2012 summer average. For all products except fire, the histograms of the anomalies were created. For the fire product, summer fire counts and FRP were plotted in addition to the averages of fire-counts density and their anomaly maps.
While satellite data have the advantage in large spatial coverage, their uncertainties can be affected by factors such as sensor calibration and assumptions in the retrieval algorithm. It is worth noting that all the satellite data used in our analysis are in scientific quality with well-documented uncertainty in the literature (Table 1). Nevertheless, the following ground-based data at various locations in Nebraska are used to evaluate the uncertainty in our analysis of satellite data: (a) quality-assured air temperature data (measured at 2 m above the surface, hereafter 2 m temperature) in 2002–2012 and all the soil moisture data (measured at 10 cm below the surface since 1999) collected by Automated Weather Data Network (AWDN) of High Plains Regional Climate Center (http://www.hprcc.unl.edu), and (b) quality-assured 2 m air temperature measured by the Nebraska Water and Energy Flux Measurement, Modeling, and Research Network, NEBFLUX surface water vapor and energy flux towers (Irmak, 2010). Air temperature data (from 2008 through 2013) from two carefully-selected NEBFLUX grassland sites are used here, as these two sites are geographically close to each other (within 1 km) and respectively located in rainfed and irrigated settings. In rainfed settings, water needed for plant growth is solely from precipitation (e.g., no irrigation). The reason the grassland is irrigated is to produce enough green biomass for grazing cattle. Hence, the temperature contrast between these two sites therefore provides a baseline estimate of the effect of irrigation on LST. Finally, in the analysis, all these ground-based data are considered as point data, and are overlaid on the map of satellite-based LST. No interpolation, however, is made, to estimate the LST from these 2 m air temperature data.
Results and Discussions
Change of Geophysical Properties Over Land Surface
Climatology (averages in 2002–2011) of higher LSTs toward the west and lower LSTs to the east over the Central Plains can be seen in Figure 1A. During the summer of 2012, this pattern is pronounced and the higher LSTs spread farther east than the previous 10-year summer average (Figure 1B). The anomaly map (Figure 1C) demonstrates that almost the entire study domain is warmer than the 10-year average during 2012. Daytime LST anomalies greater than 5 K are found to be common in a large portion of the domain with maximum anomalies around 10 K (Figure 1D). Western Nebraska, eastern Kansas, southwestern Missouri, and northeastern Oklahoma show the greatest temperature anomalies. In Nebraska, the MODIS-based LST distribution and anomaly in 2012 are consistent overall with the counterpart analysis using AWDN 2 m air temperature datasets (Figures 2C,D), except that MODIS LST appears to be slightly larger than AWDN 2 m air temperature (by ~2–3 K) over western Nebraska. Factors affecting the difference between MODIS LST and ground-based measurements of 2 m air temperature include the sampling time differences, and the assumption of surface emissivity, the atmospheric lapse rate and water vapor profile that is used in the LST retrieval algorithm for the radiative transfer calculations (Wan, 2009). Regardless, both MODIS LST and AWDN data reveals an interesting feature that from south central to southeastern Nebraska (the area denoted by a black circle), the anomaly appears to be minimal (Figures 1C, 2D). This local feature is right above the core of upstream Ogallala Aquifer and likely reflects the effect of irrigation as this region has the highest density of wells in Nebraska (NE) and nearby states (Figure 2B, hereafter this region is called NE irrigation region). The location of this irrigated area is also consistent with that in Pervez and Brown (2010). The Ogallala Aquifer supplies the water for irrigation in South Dakota, Nebraska, Wyoming, Colorado, Kansas, Oklahoma, New Mexico, and Texas.
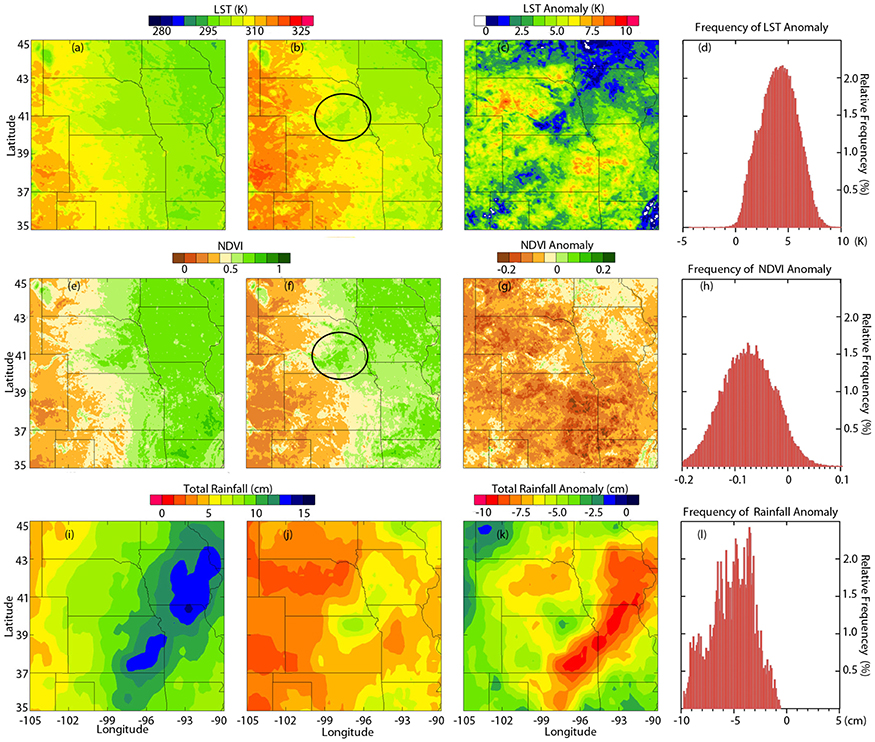
Figure 1. Maps of land surface temperature (A–D), accumulated rainfall (E–H), and NDVI (I–L) for the 10-year summer (JJA) average (left column), 2012 summer average (second from the left column), and summer anomaly (third from the left column). The right column shows the normalized histogram of the anomaly for the variable in the corresponding row. The black circles in (B) and (H) denote the irrigated area in Nebraska (see Figure 2 for details).
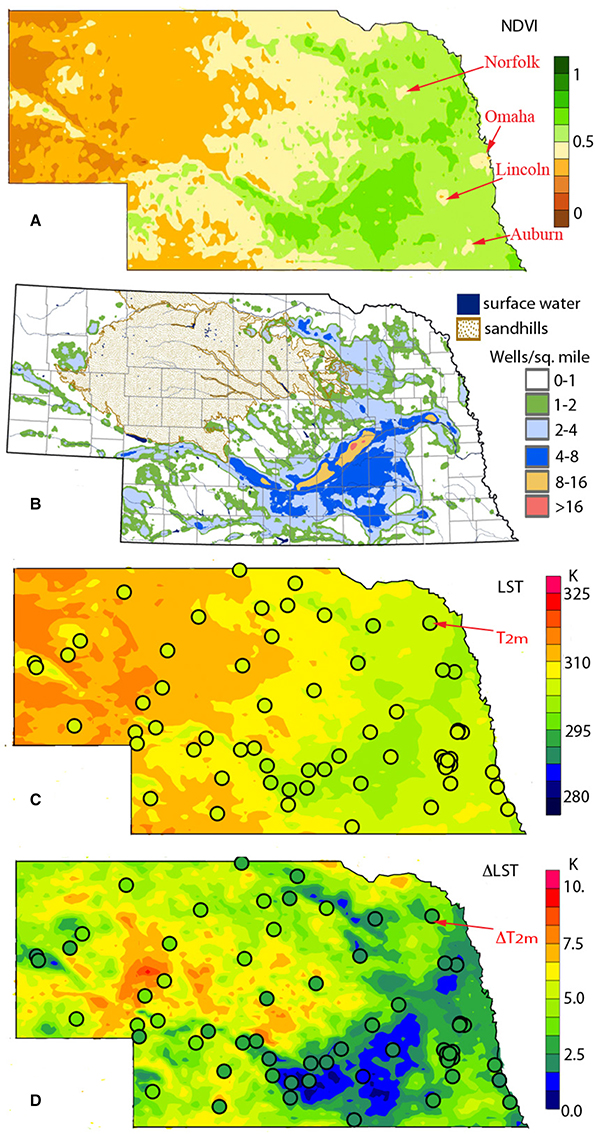
Figure 2. Maps of (A) NDVI, (B) density of wells, (C) land surface temperature, (LST), and (D) anomaly if land surface temperature (ΔLST), all for Nebraska averaged in summer 2012. Also shown in (A) is the location of major cities in east Nebraska (with their names denoted in red). The density of registered wells data in (B) is for January 2009, and can be found at http://watercenter.unl.edu/watermap/regirrwells.asp. Circles in (C,D) denote location of ground-based observation station and are color filled respectively according to 2 m air temperature (T2m) in summer 2012 measured at each station and the corresponding anomaly (ΔT2m) in 2012 (with respect to the mean of 2 m air temperature in 2002–2011).
The 2–3 K cooling due to the irrigation as revealed by MODIS LST data is also supported by temperature data from two neighboring NEBFLUX sites respectively located in (rainfed) dryland and irrigated settings. Figure 3 shows the daily 2 m air temperature difference between the two NEBFLUX sites at 1800 UTC (1300 CDT) for summer (JJA) of 2008 through 2013. The rainfed site was generally warmer than the irrigated site in each year except June and July of 2011 where the temperature difference between these two sites overall appears marginal (within 0.03C). However, there is a notable increase in temperature difference during the summer of 2012, with the rainfed site becoming relatively warmer. In years prior to 2012, the rain-fed site was an average of 0.19 K warmer than the irrigated site. In 2012, this average temperature difference increased to 0.87 K. Although both sites showed a positive temperature anomaly in the summer of 2012, with the temperature anomaly of the rainfed site being greater (inset map in Figure 3).
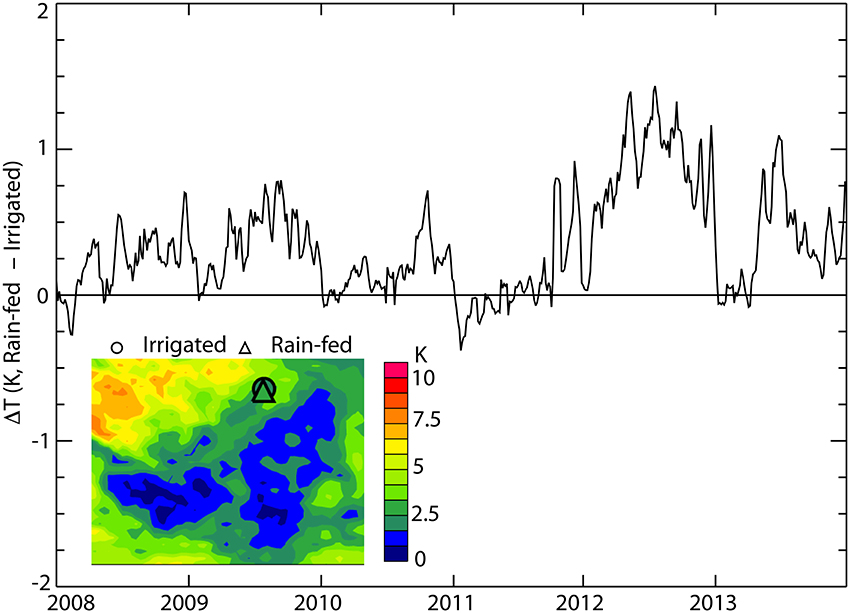
Figure 3. Time series of 2 m air temperature difference of two NEBFLUX sites (rain-fed minus irrigated) in June–August from 2008 to 2013. The inset shows the location of NEBFLUX sites overlaid on 2012 MODIS LST anomaly. Note, the irrigated and rain-fed sites is only 1 km apart, and so they appear to overlap on the map.
NDVI follows a similar pattern compared to LST of decreasing from east to west (Figure 1E) because the eastern part of the domain is also more dominated by croplands. While most of these croplands are rainfed, some them are equipped with well-maintained irrigation systems (such as in Nebraska, Pervez and Brown, 2010). Consequently, the strong gradient between urban and rural regions in areas of high NDVI (Figure 1F) is interesting in particular in the locations of Des Moines, Kansas City, and cities in Nebraska (such as Omaha, Lincoln, and Norfolk shown in Figure 2A). Some of these gradients decreased in 2012—most notably in Oklahoma, Kansas, and Missouri, exhibiting the effect of drought on agriculture during the hot/dry summer months. Overall, most of the region experienced less photosynthetically-active vegetation than normal in 2012 (Figure 1G), and on average, the NDVI decreased by 0.1 (Figure 1H). Interestingly, NDVI in the heavily-irrigated region of south-central NE shows little decrease and indeed a small increase during the 2012 drought (Figure 1G). This same region also corresponds to the lower LST. Both minimal anomalies in the NE irrigation region can likely be attributable to an increase in irrigation from groundwater of the High Plains Ogallala aquifer—less water-stressed plants and a higher specific heat of land leading to higher NDVI and less warming. Brown et al. (2008) showed that the NE irrigated area often has the spatially continuous coverage of green vegetation in summer and is resilient to the effect of drought. Indeed, reanalysis from land surface model with assimilation of data from GRACE (Gravity Recovery and Climate Experiment, Rodell, 2012) shows that the ground water storage in Ogallala Aquifer in September 2012 is significantly lower than (or is below 5% in terms of wetness of) its long-term (1948-2009) average (http://earthobservatory.nasa.gov/IOTD/view.php?id=79228). This decline can be a result of both decrease of precipitation and increase in use of ground water for irrigation in 2012; the latter mechanism was shown in the analysis of GRACE data during 2003–2006 over northern Great Plains (Strassberg et al., 2009).
The decrease in NDVI often can be explained by the shortage of precipitation. As shown by the accumulated rainfall (the bottom row of Figure 1), there was less water available during the 2012 summer, and plants became water-stressed. Water-stressed plants have a decreased leaf area (wilted plants droop parallel to sunlight) and internal wilting of leaves modifying the internal leaf structure, which decreases near-infrared (NIR) reflectance. Furthermore, water-stressed plants are less photosynthetically-active, which decreases chlorophyll and leads to decreased absorption in the red and blue portions of the electromagnetic spectrum. As a result, both decreased NIR reflectance and red and blue absorption will lead to decreased values of NDVI during periods of drought. Geographically, the 10-year average of accumulated rainfall reveals a pattern of higher rainfall amounts over the Kansas, Missouri, and Iowa regions (Figure 1I). Correspondingly, these regions were hit hardest during the 2012 drought with negative rainfall anomalies as low as −10 cm or equivalent to a decrease of 50% (Figure 1K). Furthermore, there is not a single region within the domain that received greater rainfall amounts than normal. These results are consistent with the modeling results presented in Hoerling et al. (2014).
Ground-based multi-year soil moisture data in Nebraska (Figure 4A) overall shows a consistent climatology in spatial pattern as that of precipitation, with more soil moisture (water content) in the southeast (>20%) and much less in northwest (< 15%). The soil characteristics may also have an effect on soil moisture in Nebraska, which deserves further study; the loamy silt rich soil over the south central to southeastern Nebraska may help to retain higher soil moisture while the sandy soils in the north part of the South Platte River may favor low soil moisture. Nevertheless, in 2012 soil moisture declined to less than 20% in southeast Nebraska and to less than 10% for many stations over the northwest Nebraska (Figure 4B). The decline is found to be largest over the southern part of Nebraska with several stations showing a large decrease of 10% (Figure 4C). Except two stations (one in north central and one closest to the west border in Nebraska) that showed slight increase of soil moisture, all other (36) stations consistently showed a decrease of soil moisture in 2012 by 10−50% (Figure 4D). The average of soil moisture in all stations is ~20% for all years of available data (except 2012); it decreased to 15% in 2012, indicating a 25% relative decline. Statistically, the inter-annual variation of soil moisture in each summer (in terms of their standard deviation) is < 5% in most (except 4) stations (e.g., yellow-to-red color in Figure 4E). In contrast, the decline of 2012 summer soil moisture for most stations in south part of Nebraska is more than 6% (red color in Figure 4F). This contrast supports that the probability for the drought in southern Nebraska in 2012 (in terms of its soil moisture) is statistically rare. It should also be noted that the soil moisture measurements are usually not located in the farmland (in particular, irrigated land) because their existence is inconvenient for the operation of automatic farming machines. In addition, maintenance of soil moisture measurements also takes a great deal of efforts. Hence it is understood that the soil moisture data record does not have the same starting years for all stations, although for the study here the stations we selected have at least 5 years of data after excluding 2012 (Figure 4F).
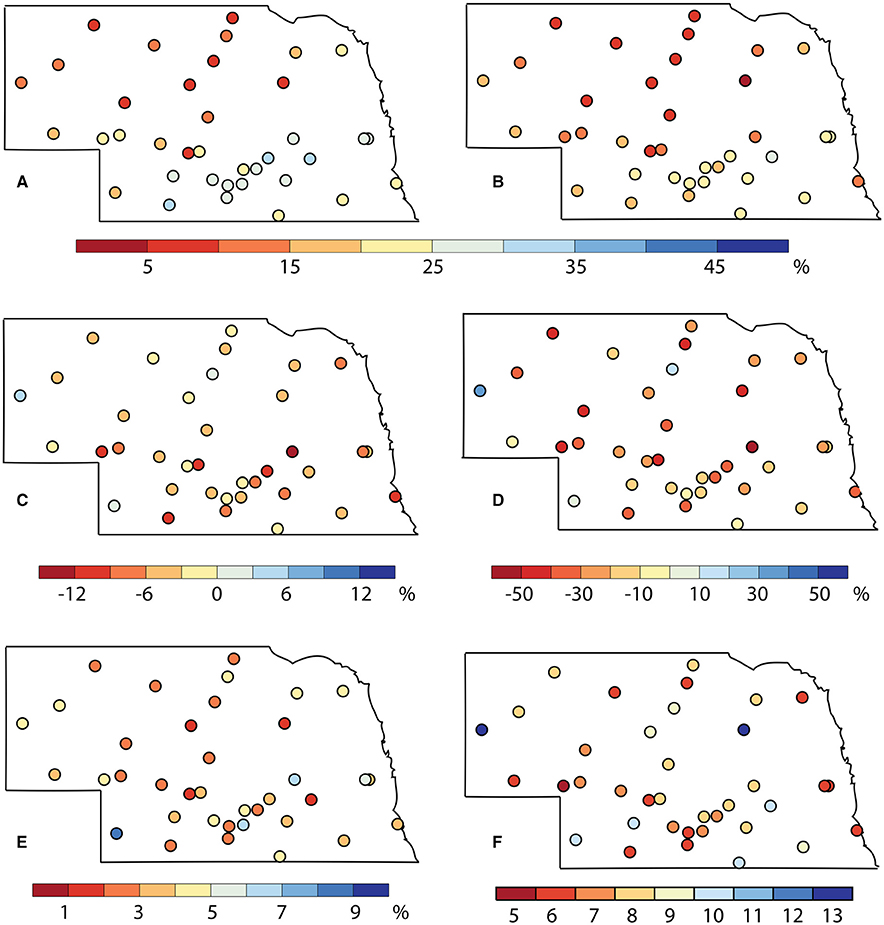
Figure 4. Maps of (A) multi-year JJA average of soil moisture excluding 2012; (B) JJA average of soil moisture in 2012; (C) change of soil moisture from (A) to (B); (D) is the relative difference between (A) and (B) in percentage, or (C) with respect to (A) multiplying 100%.; (E) similar as (A) show the standard deviation of JJA averages of soil moisture in multi-years; (F) number of years of soil moisture data used in the (A,E) for each station. Note, shown here are the soil moisture measured at 10 cm below the surface in unit of mass mixing ratio.
Another repercussion of less precipitation, water-stressed plants, and higher LSTs during periods of drought, is an increase in fire counts, which is a great threat for both safety and health. During the summer of 2012, nearly 2000 fire counts were recorded by MODIS aboard EOS-Terra, almost twice the number of fire counts compared to the previous 10 years (Figure 5A). Additionally, the summer fires of 2012 were more powerful with an average fire radiative power (FRP) of nearly 100 MW. This is the highest average FRP value when compared to the previous 10 summers (Figure 5B).
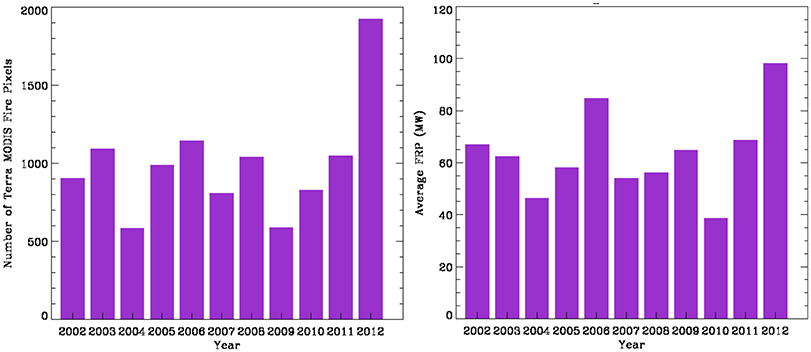
Figure 5. Bar charts for fire pixel count (left) and average fire radiative power (right) for the summers (JJA) of 2002–2012.
Fire density maps for the domain were analyzed to determine if the spatial distribution of fires changed during the summer of the 2012 drought. We found that the fires in Kansas dominate within the test domain with a maximum fire density occurring in east-central portions of the state, likely due to prescribed agricultural fires (Figure 6). However, during the summer of 2012 a decrease in fire density anomaly can be seen over northern Kansas and southeastern Colorado. One possibility for a decrease in these areas is prescribed fire burning bans (Kansas Prescribed Fire Emissions, available at http://www.kdheks.gov/bar/reghaze/Appendix_10_4.pdf). Other than these two regions, a large portion of the region saw higher fire densities than the previous ten-year average. Oklahoma and southwestern South Dakota saw more than double (even over four times) the normal acreage burned. We note that the fires in high plains are normally small fires (within one km MODIS pixel) and do not last long (Peterson et al., 2013). As result of that, the anomaly of fire counts aggregated at 1° × 1° is not necessarily consistent with spatial features and contrast in the counterparts of NDVI anomaly aggregated at 0.05° × 0.05°. Furthermore, the anomaly of fires can be attributed to both the ban of agriculture fires as well as the natural cases.
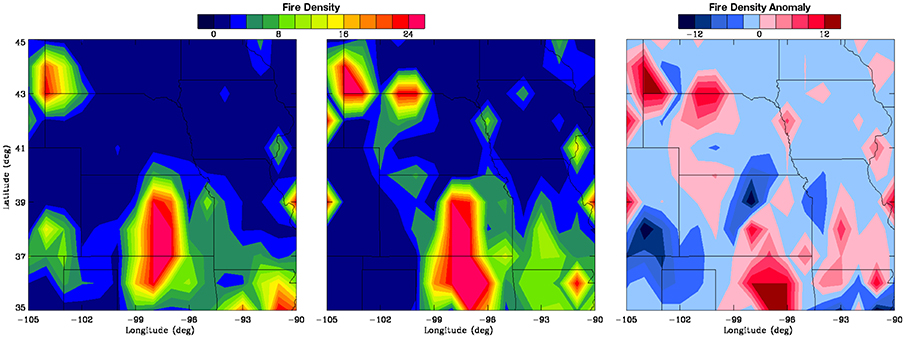
Figure 6. Maps of fire density (number of fire counts per 1° × 1° grid box) for the 10-year summer (JJA) average (left), 2012 summer average (middle), and summer anomaly (right).
Change of Geophysical Properties in the Atmosphere
Climatologically, the water vapor over the Central Plains primarily comes from the Gulf of Mexico (Benton and Estoque, 1954; Wang et al., 2009), and so precipitable water amount gradually decreases from the southeast to the northwest of the domain (Figure 7A). During the summer of 2012, portions of eastern Kansas and eastern Oklahoma saw atmospheric water vapor anomalies as low as –0.4 cm (Figures 7B,C). Less water vapor in the atmosphere leads to less absorption of radiation, while less water in soil decreases the heat capacity of the soil; both factors favor the increase of surface temperature. However, in contrast to accumulated rainfall amounts, not the entire domain sees less atmospheric water vapor when compared to the previous 10 summers (Figure 7D). The northern portion of the domain actually saw slightly more atmospheric water vapor than normal (Figure 7C). This increase of water vapor in the north may be due to the anomaly of mid-tropospheric (500 mb) geopotential height that is shown by Hoerling et al. (2014) as positive in summer 2012 (in comparison with 1981–2010 climatology), and thereby suppressing the transport of water vapor to the eastern part of U.S. While this conjecture should be further tested with modeling studies, it is consistent with Dirmeyer and Brubaker (2007) who showed stronger water vapor recycling over the Great Plains in the drought years in comparison to the stronger transport of water vapor by the low level jet from the Gulf of Mexico in the wet years. In contrast to the change of water vapor, cloud fraction in the summer of 2012 decreased over the whole study area domain when compared to the previous 10 years (Figures 7E–H), even in areas that saw greater amounts of atmospheric water vapor.
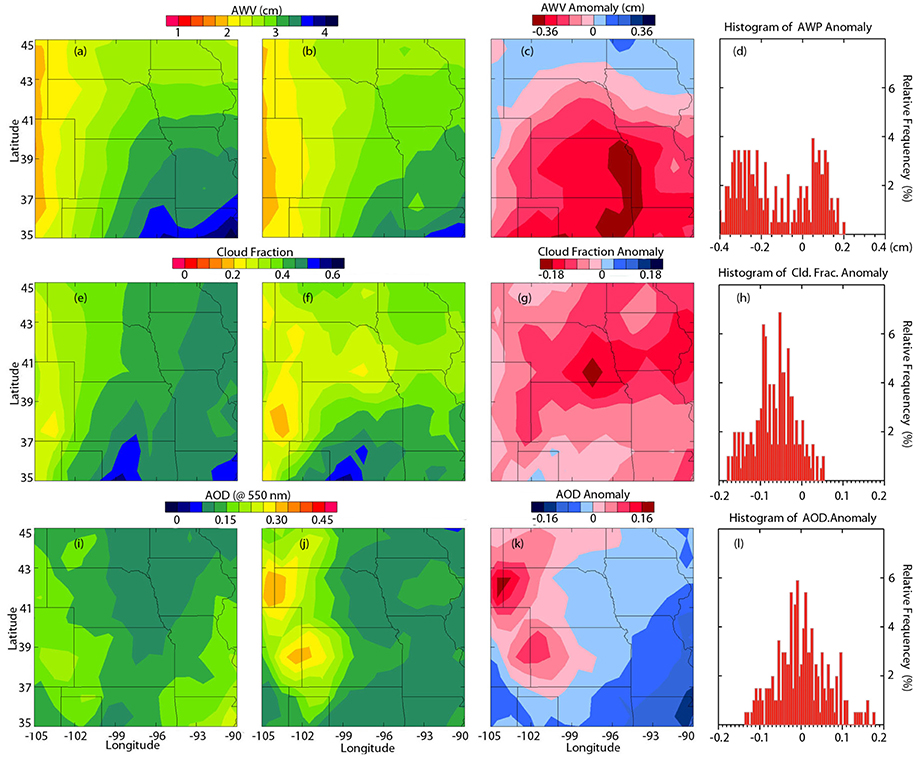
Figure 7. Similar to Figure 1, but for different variables including atmospheric water vapor (AWV, A–D), cloud fraction (E–H), and aerosol optical depth (AOD, I–L).
The final parameter analyzed is AOD. Unlike the other parameters, AOD shows equal amounts of positive and negative anomalies (Figures 7I–L). The highest anomalies (up to an increase of 100%) are located over South Dakota, western Nebraska, western Kansas, and eastern Colorado (Figure 7K). Some of the high anomalies correspond to regions of increase in fire density anomaly (South Dakota and western Nebraska) indicating an increased aerosol loading in the region. However, this is not always the case; high anomalies of AOD are located over western Kansas and eastern Colorado, regions showing both positive and negative fire density anomalies. Furthermore, it is important to note that the positive fire density anomaly in Oklahoma does not correspond to an increase in AOD, but rather corresponds to a negative anomaly, presumably due the less transport of aerosols from the Gulf coast in 2012. In addition, satellite-based AOD is a columnar quantity and its representation of surface particulate matter (PM) concentration can be complicated by several factors including aerosol vertical profile (Wang and Christopher, 2003). Not only the amount of smoke from fires, but also likely the amount of dust particles from semi-arid regions, the sulfate particles from coal-burning power plants and other particles associated with transportation and manufacturing are expected to change during the drought season, thereby affecting the AOD distribution. Unfortunately, ground-based PM monitoring sites over the Great Plains are sparse in comparison with its vast area of land and lacks the capability to fully characterize the change of these particles. Nevertheless, Wang et al. (2015) showed a ~30% increase of surface PM2.5 (PM with diameter less than 2.5 μm) in June of 2011 (the drought year) over southern Great Plains and southeastern U.S. as compared to the June of 2010 (a normal year). Further studies are needed to combine both satellite, ground, and chemistry transport models to analyze the drought impact on AOD and surface PM.
Land-Atmosphere Interaction in Irrigated Areas: A Hypothesis
It is interesting to note that the NE irrigation region shows the most negative anomaly (largest decrease) of cloud fraction (Figure 7G) corresponding to a region of least-negative (smallest increase of) LSTs (Figure 1B), virtually no NDVI anomaly (Figure 1F), and minimal decrease of accumulated rainfall amounts (Figure 1K). The mechanisms for this interesting feature, regional in nature, can be further studied, although various plausible explanations can be made. These explanations formulate a hypothesis that entails a chain of the following processes: (1) the irrigated area is about 5 to 8 K cooler than the surrounding non-irrigated area (Figure 7A), (2) lower surface temperature may lead to a more stable boundary layer and thus suppress the formation of boundary layer clouds, (3) the contrast of temperature between irrigated and non-irrigated areas may lead to the generation of local atmospheric circulation in a way similar to the land-sea breeze, and have secondary effects on clouds and precipitation (Pielke et al., 2007); the downdraft in the cooler irrigated area may further suppress the boundary cloud formation, and (4) heavy (convective) short duration rainfalls are likely the cause for the accumulated rainfall amounts in this region, and the reduction of cloud fraction is due to the reduction of boundary layer clouds.
We note that our observed decrease of cloud fraction over the irrigated area is contradictory to several model studies where irrigation, through adding more water vapor, leads to an increase in cloud fraction (Qian et al., 2013). We acknowledge that it is likely that irrigation may have different feedbacks to cloud formation in normal and drought years because the land surface temperature contrast between irrigated and non-irrigated areas can be different depending on the amount of precipitation that can vary significantly year by year. In other words, the mechanisms we hypothesized here on how irrigation affects local cloud formation are at the regional scale in nature and hence, in the first order, are dictated by the large-scale climate dynamics that trigger drought or wetter-than-normal years. It needs to be studied how the feedback of irrigation to the regional weather and climate may manifest in dry and wet years, and may affect the regional distribution of precipitation.
Conclusions
This study shows how land and atmosphere properties changed considerably during the 2012 U.S. Central Plains drought primarily from the viewpoint of space, with some complimentary information from ground-based data. LST increased in all regions of the domain, and accumulated rainfall amounts decreased in all regions. NDVI shows a decrease in healthy vegetation during the 2012 drought, and fire counts and fire radiative power were both nearly twice their respective averages compared to the previous 10 summers.
Atmospheric water vapor showed negative anomalies for most of the Central Plains region, similar to accumulated rainfall, but showed positive anomalies for the northern portion of the domain. Cloud fraction was less than the previous ten-year average for most of the domain. However, the region of most negative cloud fraction anomaly corresponds with less negative surface temperature anomalies, less-negative accumulated rainfall anomalies, and some positive NDVI anomalies, reflecting the effect of irrigation. Finally, AOD showed both positive and negative anomalies throughout the domain. Some positive AOD anomalies corresponded with positive fire density anomalies while others did not.
The summer of 2012 is currently the largest exceptional drought experienced in the Central Plains since MODIS records began in 2000, and is indeed shown by Hoerling et al. (2014) as the most severe drought over the Central Plains since data record began 1895. This drought had a clear effect on the land and atmospheric properties of the region, and hence it is important to understand the effects of drought as the number and intensity of droughts are expected to increase in the future corresponding to the increase of temperatures in the region and globally. Satellites are an excellent resource for studying the effects of drought as they have a global perspective, and can be combined with in situ instrumentation to produce the full picture of what happens to the land and atmosphere during a drought. They clearly show that human activities (such as irrigation) can decrease the drought impact on agriculture on a regional scale and thus affect the regional climate. However, sustainability of using ground water for agricultural irrigation for agriculture can be of a concern. Past analysis using GRACE data has shown that the level of the ground water has been declining over the southern part of the Great Plains and remains somewhat stable over northern part of the Great Plains; this south-north contrast in change of ground water level may reflect the differences in recharge rate of ground water (Scanlon et al., 2012). Hence, both the sustainability and climate impacts of irrigation deserve emergent studies.
Author Contributions
JW coordinated and led all the efforts for this manuscript. AK, CA, AS, and LJ conducted data analysis; BW, JY, MS, SI, AK, and JZ contributed the data for the analysis and participated general discussion for the manuscript.
Conflict of Interest Statement
The authors declare that the research was conducted in the absence of any commercial or financial relationships that could be construed as a potential conflict of interest.
Acknowledgments
This project is partially supported by the NASA Nebraska Space Grant Fellowship (Kessner), NASA Applied Science program (grant #: NNX15AC28A managed by Dr. John A. Haynes), and University of Nebraska – Lincoln.
References
Ackerman, S. A., Holz, R. E., Frey, R., Eloranta, E. W., Maddux, B. C., and McGill, M. (2008). Cloud detection with MODIS. Part II: validation. J. Atmos. Oceanic Technol. 25, 1073–1086. doi: 10.1175/2007JTECHA1053.1
Adegoke, J. O., Pielke, R. A., and Carleton, A. M. (2007). Observational and modeling studies of the impacts of agriculture-related land use change on planetary boundary layer processes in the central US. Agric. Forest Meteorol. 142, 203–215. doi: 10.1016/j.agrformet.2006.07.013
Adegoke, J. O., Pielke, S. R. A., Eastman, J., Mahmood, R., and Hubbard, K. G. (2003). Impact of irrigation on midsummer surface fluxes and temperature under dry synoptic conditions: a regional atmospheric model study of the U.S. High Plains Monthly Weather Rev. 131, 556–564. doi: 10.1175/1520-0493(2003)131<0556:IOIOMS>2.0.CO;2
Anderson, M. C., Hain, C. R., Wardlow, B. D., Pimstein, A., Mecikalski, J. R., and Kustas, W. P. (2012). “Thermal-based evaporative stress index for monitoring surface moisture depletion,” in Microwave Remote Sensing of Soil Moisture: Science and Applications, eds B. D. Wardlow, M. C. Anderson, and J. P. Verdin (Boca Raton, FL: Taylor & Francis Group, LLC), 145–167.
Benton, G. S., and Estoque, M. A. (1954). Water vapor transfer over the North American continent. J. Meteorol. 11, 462–477.
Blunden, J., and Arndt, D. S. (2013). State of the climate in 2012. Bull. Am. Meteorol. Soc. 94, S1–S258. doi: 10.1175/2013BAMSStateoftheClimate.1
Bonfils, C., and Lobell, D. (2007). Empirical evidence for a recent slowdown in irrigation-induced cooling. Proc. Natl. Acad. Sci. U.S.A. 104, 13582–13587. doi: 10.1073/pnas.0700144104
Brown, J. F., Wardlow, B. D., Tadesse, T., Hayes, M. J., and Reed, B. C. (2008). The Vegetation Drought Response Index (VegDRI): a new integrated approach for monitoring drought stress in vegetation. GIScience Remote Sens. 45, 16–46. doi: 10.2747/1548-1603.45.1.16
Cook, B. I., Puma, M. J., and Krakauer, N. Y. (2010). Irrigation induced surface cooling in the context of modern and increased greenhouse gas forcing. Climate Dyn. 37, 1587–1600. doi: 10.1007/s00382-010-0932-x
Dai, A. (2012). Increasing drought under global warming in observations and models. Nat. Clim. Change 3, 52–58. doi: 10.1038/nclimate1633
Dirmeyer, P. A., and Brubaker, K. L. (2007). Global characterization of the hydrologic cycle from a quasi- isentropic back-trajectory analysis of atmospheric water vapor. J. Hydrometeor. 8, 20–37. doi: 10.1175/JHM557.1
Frey, R. A., Ackerman, S. A., Liu, Y., Strabala, K. I., Zhang, H., Wang, X., et al. (2008). Cloud detection with MODIS. Part I: improvements in the MODIS Cloud mask for collection 5. J. Atmos. Oceanic Technol. 25, 1057–1072. doi: 10.1175/2008JTECHA1052.1
Gao, B.-C., and Kaufman, Y. J. (2003). Water vapor retrievals using Moderate Resolution Imaging Spectroradiometer (MODIS) near-infrared channels. J. Geophys. Res. 108, 4389. doi: 10.1029/2002JD003023
Giglio, L. (2010). MODIS Collection 5 Active Fire Product User's Guide Version 2.4. College Park, MD. Available online at: http://www.fao.org/fileadmin/templates/gfims/docs/MODIS_Fire_Users_Guide_2.4.pdf
Hayes, M. J., Svoboda, M. D., Wardlow, B. D., Anderson, M. C., and Kogan, F. (2012). “Drought monitoring,” in Remote Sensing of Drought: Innovative Monitoring Approaches, eds B. D. Wardlow, M. C. Anderson, and J. P. Verdin (Boca Raton, FL: Taylor & Francis Group, LLC), 1–19.
Hoerling, M., Eischeid, J., Kumar, A., Leung, R., Mariotti, A., Mo, K., et al. (2014). Causes and Predictability of the 2012 Great plains drought. Bull. Am. Meteorol. Soc. 95, 269–282. doi: 10.1175/BAMS-D-13-00055.1
Huete, A., Didan, K., Miura, T., Rodriguez, E. P., Gao, X., and Ferreira, L. G. (2002). Overview of the radiometric and biophysical performance of the MODIS vegetation indices. Remote Sens. Environ. 83, 195–213. doi: 10.1016/S0034-4257(02)00096-2
Huffman, G. J., Bolvin, D. T., Nelkin, E. J., Wolff, D. B., Adler, R. F., Gu, G., et al. (2007). The TRMM Multisatellite Precipitation Analysis (TMPA): quasi-global, multiyear, combined-sensor precipitation estimates at fine scales. J. Hydrometeor. 8, 38–55. doi: 10.1175/JHM560.1
Irmak, S. (2010). Nebraska Water and Energy Flux Measurement, Modeling, and Research Network (NEBFLUX). Trans. ASABE 53, 1097–1115. doi: 10.13031/2013.32600
Justice, C. O., Giglio, L., Korontzi, S., Owens, J., Morisette, J. T. Kaufman, et al. (2002). The MODIS fire products. Remote Sens. Environ. 83, 244–262 doi: 10.1016/S0034-4257(02)00076-7
King, M. D., Menzel, W. P., Kaufman, Y. J., Tanre, D., Gao, B.-C., Platnick, S., et al. (2003). Cloud and aerosol properties, precipitable water and profiles of temperature and water vapor from MODIS. IEEE Trans. Geosci. Remote Sens. 41, 442–458. doi: 10.1109/TGRS.2002.808226
Kueppers, L. M., Snyder, M. A., and Sloan, L. C. (2007). Irrigation cooling effect: regional climate forcing by land-use change. Geophys. Res. Lett. 34:L03703. doi: 10.1029/2006GL028679
Levy, R. C., Remer, L. A., Mattoo, S., Vermote, E. F., and Kaufman, Y. J. (2007). Second-generation operational algorithm: retrieval of aerosol properties over land from inversion of moderate resolution imaging spectroradiometer spectral reflectance. J. Geophys. Res. 112:D13211. doi: 10.11029/12006JD007811
Lewis, S. L., Brando, P. M., Phillips, O. L., van der Heijden, G. M. F., and Nepstad, D. (2011). The 2010 Amazon drought. Science 331, 554. doi: 10.1126/science.1200807
Lobell, D. B., Bonfils, C., and Faurès, M. J. (2008). The role of irrigation expansion in past and future temperature trends. Earth Interact. 12, 1–11. doi: 10.1175/2007EI241.1
Mahmood, R., Hubbard, K. G., and Carlson, C. (2004). Modification of growing-season surface temperature records in the northern great plains due to land-use transformation: verification of modelling results and implication for global climate change. Int. J. Climatol. 24, 311–327. doi: 10.1002/joc.992
Mu, Q., Zhao, M., Kimball, J. S., McDowell, N. G., and Running, S. W. (2012). A remotely sensed global terrestrial drought severity index. Bull. Am. Meteorol. Soc. 94, 83–98. doi: 10.1175/BAMS-D-11-00213.1
Nghiem, S. V., Wardlow, B. D., Allured, D., Svoboda, M. D., LeComte, D., Rosencrans, M., et al. (2012). “Microwave remote sensing of soil moisture: science and applications,” in Remote Sensing of Drought: Innovative Monitoring Approaches, eds B. D. Wardlow, M. C. Anderson, and J. P. Verdin (Boca Raton, FL: Taylor & Francis Group, LLC), 197–226.
Pervez, M. D. S., and Brown, J. F. (2010). Mapping irrigated lands at 250-m scale by merging MODIS data and national agricultural statistics. Remote Sens. 2, 2388–2412. doi: 10.3390/rs2102388
Peterson, D., Wang, J., Ichoku, C., Hyer, E., and Ambrosia, V. (2013). A sub-pixel-based calculation of fire radiative power from MODIS observations: 1 Algorithm development and initial assessment. Remote Sens. Environ. 129, 262–279. doi: 10.1016/j.rse.2012.10.036
Pielke, R. A., Adegoke, J. O., Chase, T. N., Marshall, C. H., Matsui, T., and Niyogi, D. (2007). A new paradigm for assessing the role of agriculture in the climate system and in climate change. Agric. Forest Meteorol. 142, 234–254. doi: 10.1016/j.agrformet.2006.06.012
Qian, Y., Huang, M., Yang, B., and Berg, L. K. (2013). A modeling study of irrigation effects on surface fluxes and land–air–cloud interactions in the Southern Great Plains. J. Hydrometeorol. 14, 700–721. doi: 10.1175/JHM-D-12-0134.1
Raddatz, R. L. (2007). Evidence for the influence of agriculture on weather and climate through the transformation and management of vegetation: illustrated by examples from the Canadian Prairies. Agric. Forest Meteorol. 142, 186–202. doi: 10.1016/j.agrformet.2006.08.022
Rodell, M. (2012). “Satellite gravimetry applied to drought monitoring,” in Remote Sensing of Drought: Innovative Monitoring Approaches, eds B. D. Wardlow, M. C. Anderson, and J. P. Verdin (Boca Raton, FL: Taylor & Francis Group, LLC), 261–277.
Scanlon, B. R., Faunt, C. C., Longuevergne, L., Reedy, R. C., Alley, W. M., McMahon, P. B., et al. (2012). Groundwater depletion and sustainability of irrigation in the US High Plains and Central Valley. Proc. Natl. Acad. Sci. U.S.A. 109, 9320–9325. doi: 10.1073/pnas.1200311109
Solano, R., Didan, K., Jacobson, A., and Huete, A. (2010). MODIS Vegetation Index User's Guide (MOD13 Series). Version 2.00. Tucson, AZ. Available online at: http://vip.arizona.edu/MODIS_UsersGuide.php (Accessed May 31, 2012).
Strassberg, G., Scanlon, B. R., and Chambers, D. (2009). Evaluation of groundwater storage monitoring with the GRACE satellite: case study of the High Plains aquifer, central United States. Water Resour. Res. 45, W05410. doi: 10.1029/2008WR006892
Svoboda, M., LeComte, D., Hayes, M., Heim, R., Gleason, K., Angel, J., et al. (2002). The drought monitor. Bull. Am. Meteorol. Soc. 83, 1181–1190. doi: 10.1175/1520-0477(2002)083<1181:TDM>2.3.CO;2
Wan, Z., Zhang, Y., Zhang, Q., and Li, Z. L. (2004). Quality assessment and validation of the MODIS global land surface temperature. Int. J. Remote Sens. 25, 261–274. doi: 10.1080/0143116031000116417
Wan, Z. (1999). MODIS Land-Surface Temperature Algorithm Theoretical Basis Document.Version 3.3. Santa Barbara, CA. Available online at: http://modis.gsfc.nasa.gov/data/atbd/atbd_mod11.pdf
Wan, Z. (2009). Collection-5 MODIS Land Surface Temperature Products Users' Guide. Santa Barbara, CA. Available online at: http://www.icess.ucsb.edu/modis/LstUsrGuide/MODIS_LST_products_Users_guide_C5.pdf
Wang, J., and Christopher, S. A. (2003). Intercomparison between satellite-derived aerosol optical thickness and PM2.5 mass: implication for air quality studies. Geophys. Res. Lett. 30, 2095. doi: 10.1029/2003GL018174
Wang, J., van den Heever, S. C., and Reid, J. (2009). A conceptual model for the link between Central American biomass burning aerosols and severe weather over the south central United States, “Aerosol and Precipitation” special issue. Environ. Res. Lett. 4:015003. doi: 10.1088/1748-9326/4/1/015003
Wang, Y., Cai, L., Dong, W., Zhang, Q., and Zhang, L. (2015). Impact of the 2011 Southern U.S. drought on ground-level fine aerosol concentration in summertime. J. Atmos. Sci. 72, 1075–1093. doi: 10.1175/JAS-D-14-0197.1
Wardlow, B. D., Anderson, M. C., and Verdin, J. P. (2012). Remote Sensing of Drought; Innovative Monitoring Approaches. Boca Raton, FL: CRC Press.
Wilhite, D. A. (2005). Drought and Water Crises: Science, Technology, and Management Issues. Boca Raton, FL: Taylor & Francis Group.
Keywords: drought, irrigation, remote sensing, Nebraska, aerosol, clouds, fires, NDVI
Citation: Wang J, Kessner AL, Aegerter C, Sharma A, Judd L, Wardlow B, You J, Shulski M, Irmak S, Kilic A and Zeng J (2016) A Multi-sensor View of the 2012 Central Plains Drought from Space. Front. Environ. Sci. 4:45. doi: 10.3389/fenvs.2016.00045
Received: 15 March 2016; Accepted: 02 June 2016;
Published: 20 June 2016.
Edited by:
Ralph A. Kahn, NASA Goddard Space Flight Center, USAReviewed by:
Sagnik Dey, Indian Institute of Technology Delhi, IndiaSteven L. Forman, Baylor University, USA
Copyright © 2016 Wang, Kessner, Aegerter, Sharma, Judd, Wardlow, You, Shulski, Irmak, Kilic and Zeng. This is an open-access article distributed under the terms of the Creative Commons Attribution License (CC BY). The use, distribution or reproduction in other forums is permitted, provided the original author(s) or licensor are credited and that the original publication in this journal is cited, in accordance with accepted academic practice. No use, distribution or reproduction is permitted which does not comply with these terms.
*Correspondence: Jun Wang, jwangjun@gmail.com