Can Growing Degree Days and Photoperiod Predict Spring Wheat Phenology?
 Muhammad A. Aslam1,2
  Mukhtar Ahmed1,2*
  Claudio O. Stöckle2
  Stewart S. Higgins2
  Fayyaz ul Hassan1
  Rifat Hayat3
- 1Department of Agronomy, Pir Mehr Ali Shah Arid Agriculture University, Rawalpindi, Pakistan
- 2Biological Systems Engineering, Washington State University, Pullman, WA, United States
- 3Department of Soil Science and SWC, Pir Mehr Ali Shah Arid Agriculture University, Rawalpindi, Pakistan
Wheat (Triticum aestivum) production in the rainfed area of Pothwar Pakistan is extremely vulnerable to high temperature. The expected increase in temperature due to global warming should result in shorter crop life cycles, and thus lower biomass and grain yield. Two major factors control wheat phenological development: temperature and photoperiod. To evaluate wheat development in response to these factors, we conducted experiments that created diverse temperature and daylength conditions by adjusting the crop sowing time. The study was conducted during 2013–14 and 2014–15 using five spring wheat genotypes, four sowing times, at three sites under rainfed management in Pothwar, Pakistan. Wheat crops experienced more cold days with early sowing, but later sowing dates resulted in higher temperatures, especially from anthesis to maturity. These treatments produced large differences in phenology, biomass production, and yield. To investigate whether growing degree days (GDD) and photoperiod algorithms could predict wheat phenology under these changing conditions, GDD was calculated based on the method proposed by Wang and Engel while photoperiod followed the approach introduced in the APSIM crop growth model. GDD was calculated separately and in combination with photoperiod from germination to anthesis. For the grain filling period, only GDD was calculated. The observed and predicted number of days to anthesis and maturity were in good agreement, showing that the combination of GDD and photoperiod algorithms provided good estimations of spring wheat phenology under variable temperature and daylength conditions.
Introduction
Based on projections of the Intergovernmental Panel on Climate Change (IPCC, 2014) it is expected that the average surface temperature of the world will increase by 1.5–4.5°C by 2100 if the recent greenhouse gas emission rates continue. Hansen et al. (2012) estimated an increase in average universal temperature of 0.18°C per decade. IPCC (2014) reported 2000s as the warmest decade and 2014 as the warmest year. Agricultural productivity is under threat due to climate change all over the globe as predicted by current and future scenarios (van Ogtrop et al., 2014; Ahmad et al., 2017; Dettori et al., 2017). Increased temperature significantly influences crop productivity and can lead to dramatic yield loss. Climate change in the form of increased temperature has reduced cereal yield up to 17% (Lobell et al., 2011). Pakistan is also facing impacts of climate change in different socio-economic sectors (Akram and Hamid, 2015; Ahmad et al., 2017). The warming trend, predicted to be 2–4°C at the end of century, will drastically affect agriculture (Rasul et al., 2012). Dwivedi et al. (2017) reported yield loss associated with high temperatures in Eastern Indo-Gangetic Plains (EIGP). In their experiments the average temperature during anthesis of late and very late sowing conditions were 2.7°C and 5.2°C higher than that of the optimum sowing which resulted in the reduction in grain filling duration by 8.6–12.6 days, and average yield loss of 18 and 34% for late sown and very late sown conditions, respectively.
Global warming is producing a shift in crop phenology over the globe (Root et al., 2003; Parmesan, 2006; Ahmad et al., 2017). A warmer climate accelerates crop phenology and affects crop yield (Madan et al., 2012; Zhang et al., 2013; Ahmed et al., 2016). Craufurd and Wheeler (2009) reported earlier flowering and crop maturity under high temperature conditions. Higher temperature resulted in a shorter growing season, accelerated leaf aging/senescence and reductions in biomass and yield (Tao et al., 2013; Figueiredo et al., 2015). High temperature had a negative effect on biomass, spike length, grain yield and harvest index (Plaut et al., 2004).
Wheat production in the rainfed area of Pothwar Pakistan is highly vulnerable to higher temperature (Ahmed and Hassan, 2015). The wheat-growing season in this area starts with the onset of winter and ends in April-May. Due to low soil moisture, wheat sowing is delayed which results in high temperature at anthesis and during grain filling. This high temperature can reduce final yield, and the probability of high temperature is being exacerbated by global warming (Dias and Lidon, 2009, 2010; Modarresi et al., 2010). Joshi et al. (2007) reported heat stress as a major abiotic stress due to delayed sowing affecting wheat cultivation in South Asia. The optimum temperature range for wheat during anthesis and grain filling is between 12 and 22°C. Wheat exposure to above 30°C at pre- and post-anthesis stages reduces the grain filling rate and thereby decreases grain yield and quality (Barnabas et al., 2008). High temperature (>30°C) during anthesis is deleterious (Langer and Olugbemi, 1970; Tashiro and Wardlaw, 1990), while short exposure to very high temperature (>35°C) during anthesis and grain filling can result in substantial reduction of grain yield in wheat (Randall and Moss, 1990; Stone and Nicolas, 1994). Hussain and Mudasser (2007) conducted an experiment in the rainfed area of Pakistan to investigate the effect of high temperature on growing season length. They reported that a 1.5°C increase in temperature shortened the crop life cycle and lowered grain yield by 7%. However, a temperature increase of 3°C reduced wheat yield by 24%.
A prerequisite for modeling crop growth is good forecasting of plant development, with air temperature recognized as the principle regulator of plant development (Bewick et al., 1988). Growing degree day (GDD) values are utilized for predicting crop development (Yang et al., 1995; McMaster and Wilhelm, 1997), which usually integrate temperature values on a daily basis. With increasing global temperature, faster accumulation of GDDs will take place. In addition to temperature, photoperiod is also a major environmental factor determining time to flower initiation and first flower appearance in plants (Daba et al., 2016), and flowering in wheat is sensitive to photoperiod. Thus, plant development is a function of temperature and daylength (Slafer and Rawson, 1994; Cao and Moss, 1997), and both should be included in predictive algorithms.
To investigate temperature and photoperiod effects on wheat development, we artificially created different temperature and daylength conditions for wheat by varying the sowing times. Early-sown wheat encountered more cold days but late-sown wheat experienced higher temperatures, especially during anthesis to maturity. To support the projection of changes in phenology in responses to future global warming, we used the experimental results to evaluate the ability of GDD and photoperiod algorithms to predict wheat crop phenology.
Materials and Methods
Site Description
The current study was conducted at varying climatic locations of Pothwar, Pakistan, including three sites: Islamabad (33° 40′ N, 73° 10′ E, 508m a.s.l.) with low temperature/high rainfall, URF-Koont (32° 93′ N, 72° 86′E, 506m a.s.l.) with medium temperature/rainfall, and Talagang (32° 55′ N, 72° 25′ E, 458m a.s.l.) with high temperature/low rainfall (Figure 1). The soils at Islamabad, URF-Koont and Talagang were loam, sandy clay loam and sandy loam, respectively. The physiochemical properties of the study sites (Table 1) were recorded by taking a representative soil sample before sowing to a depth of 90 cm using a king tube.
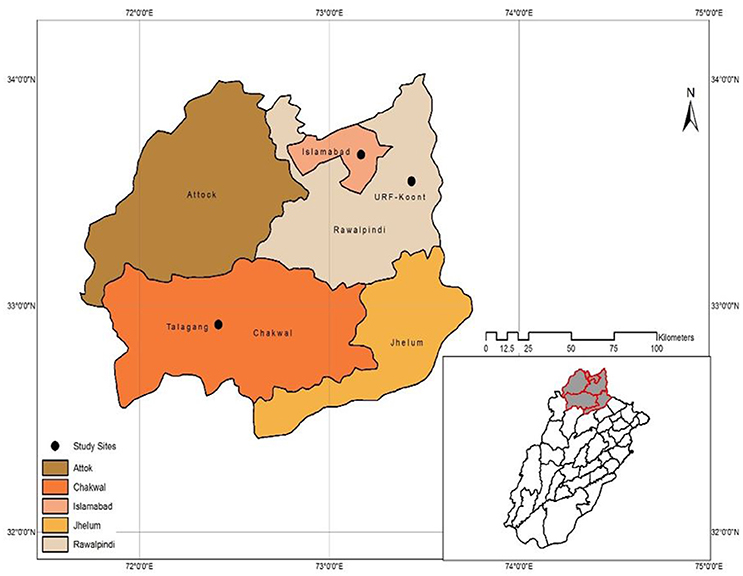
Figure 1. Experimental study sites.
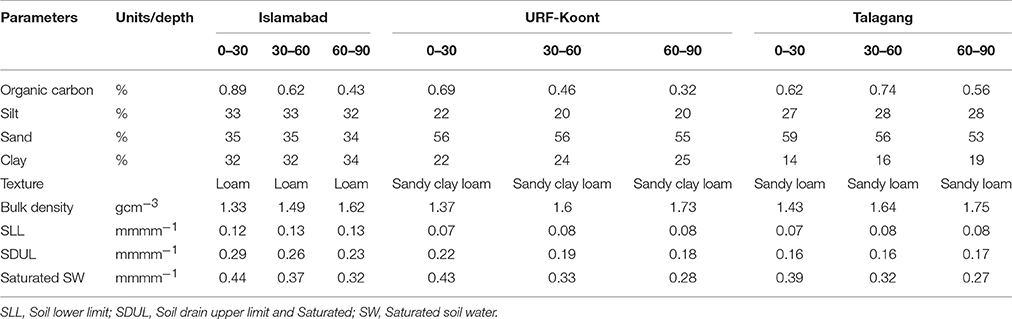
Table 1. Soil physiochemical properties for three study sites.
Climate Description
The daily maximum and minimum temperature, rainfall and day length data were obtained from the meteorological observatories located near the study sites during both years. Missing data were calculated using DSSAT Perturb (2014). The average temperature during 2014–15 was higher (1.32°C) at all the study sites than 2013–14 (Table 2) and this variation in average temperature had a direct influence on wheat growth, development and phenology. The temperature 7 days before and after anthesis (Anthesis Temperature) was recorded and presented in Table 2. Total seasonal rainfall was higher at Islamabad than the other two study sites.
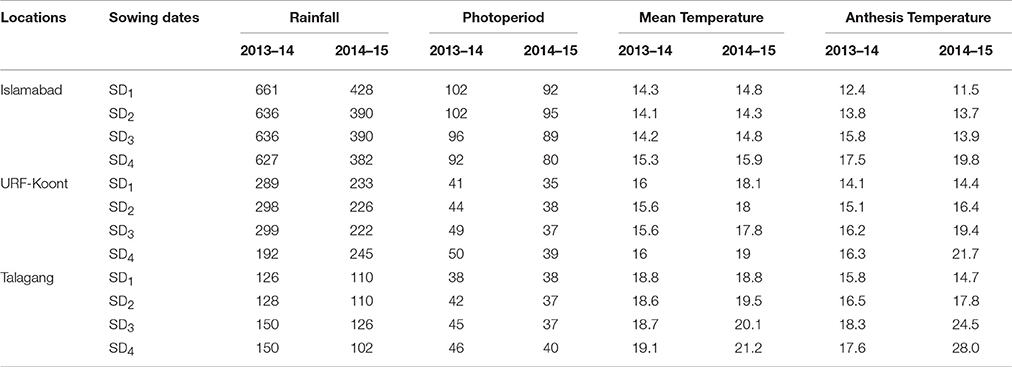
Table 2. Rainfall (mm), day length (hours), average seasonal and anthesis temperature (7 days before and after anthesis) (°C) at the three study sites for four sowing dates (SD) and 2 years.
Experimental Design
To investigate GDD and photoperiod as predictors of wheat phenology, the current study was conducted during 2013–14 and 2014–15 using five spring wheat genotypes and four sowing times under rainfed conditions in Pothwar (350–580 m a.s.l.), Pakistan. A randomized complete block experimental design was used with five wheat genotypes, four sowing dates, and three sites providing diverse environmental conditions (Islamabad, URF-Koont and Talagang). The genotypes used were Dharabi (Parentage: HXL7573/2*BAU//PASTOR, Pedigree: CMSS97Y03676S- 040Y-050M-040SY-030M-21SY-010M-0Y-0SY), Chakwal-50 (Origin: Advance line from CIMMYT, Pedigree: ATTILA/3/HUI/CARC//CHEN/CHTO/4/ATTILA, Selection history: CMBW90M4860-0T0PY-16M-10M-010Y-1M-015Y-0Y), NARC-2009 (Pedigree: INQALAB91/2/TUKURU, Selection history: CGSS99B00015F-099Y-099M-099Y-099M-29Y-0B-0ID), Pak-13 (Parentage and Pedigree information not available at http://wheatatlas.org/country/varieties/PAK/0) and AUR-809 (Parentage and Pedigree information not available at http://wheatatlas.org/country/varieties/PAK/0). The genetic phenotypic architecture of wheat genotypes is presented in Table 3.
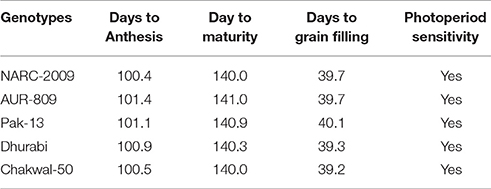
Table 3. Phenological characteristics of five wheat genotypes used in this study.
Sowing dates were planned in such a manner that the growing wheat plants would likely experience cooler, optimum and warmer conditions. Sowing times were 21–30 Oct (SD1, early sowing), 11–20 Nov (SD2, normal sowing), 1–10 Dec (SD3, late sowing) and 21–30 Dec (SD4, very late sowing) during 2013–14 and 2014–15. The normal sowing time was taken as the reference for GDD calculation at each location, and days to flowering and maturity were predicted for each sowing time.
Crop Phenology
Days to anthesis and days to maturity were recorded using Zadok's scale for all study sites, sowing dates, and years (Zadoks et al., 1974).
Growing Degree Days and Photoperiod Calculations
Growing degree days were calculated using the Wang and Engel (1998) method, separately and in combination with photoperiod.
The Wang and Engel (1998) equations used for GDD calculation are
Then
Where WEDD is degree days calculated by the Wang and Engel (1998) method. If Tav < Tmin or Tav > Tmax then WEDD = 0. The cardinal temperatures for GDD calculations pre anthesis were Tmin = 0, Topt = 27.7, and Tmax = 40. For the post anthesis period, the cardinal temperatures were Tmin = 0, Topt = 32.75, and Tmax = 44.
Photoperiod was calculated using the approach introduced in the APSIM wheat model (Zheng et al., 2014), where photoperiod affects the phenology between emergence and floral initiation.
where day length is in hours and the Photoperiod coefficient ranges from 0 to 4.
Photo Growing Degree Days (PGDD), the combination of GDD and photoperiod effects on wheat development between emergence and floral initiation, were calculated by multiplying WEDD by photoperiod as follows:
Statistical Analysis
Analysis of variance (ANOVA) was performed to test the significant differences among means of various parameters for five genotypes across four sowing dates (SDs) and three locations for the 2013–2015 wheat growing seasons using R software.
Results
Observed Parameters (Days to Anthesis and Days to Maturity)
Observed days to anthesis and days to maturity averaged for all genotypes showed significant differences among location and sowing dates in both years (Table 4). The largest number of days to anthesis (110.4) was observed for SD2 during 2013–14 at Islamabad while the lowest number of days to anthesis (86) was recorded for SD4 during 2014–15 at Talagang. On the other hand, the largest number of days to maturity was observed for SD1 (165 d) while lowest number of days to maturity was recorded for SD4 (114 d). Among locations, the cooler location, Islamabad, had more days to anthesis and maturity than the moderate (Koont) and warmer (Talagang) locations.
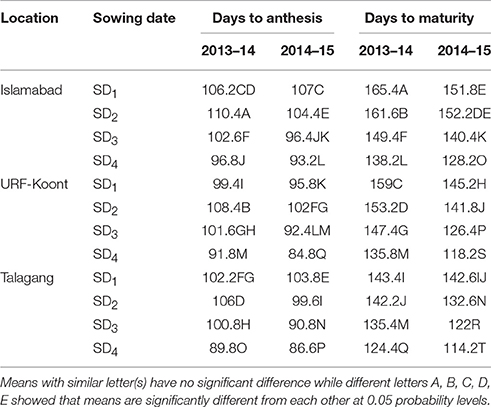
Table 4. Observed wheat phenological development at the three study sites, including four sowing dates (SD) and 2 years.
Days to Maturity in Relation to Seasonal Temperature and Temperature during Flowering
Wheat phenology was significantly changed in response to average seasonal temperature in all sowing dates, sites, and years. At Islamabad, average seasonal temperature ranged from 12 to 17.5°C and for URF-Koont and Talagang it was in the range of 14–22°C and 16.5–24.6°C, respectively. More days to maturity were observed at Islamabad than URF-Koont and Talagang (Figure 2). At later sowing dates, average seasonal temperature was higher than the early sowing so the wheat matured in fewer days during both years. Similarly, average temperature during the 7 days before and after anthesis (average anthesis temperature) greatly influenced the number of days to maturity at three study sites during both years. Average anthesis temperature was higher at Talagang than URF-Koont and Islamabad. Average anthesis temperature was in the range of 10.74–19.97°C, 13.67–21.83°C, and 12.63–28.09°C at Islamabad, URF-Koont and Talagang, respectively (Figure 2B). At Islamabad days to maturity dropped to 127 from 169, while days to maturity dropped to 116 from 161 and 113 from 145 at URF-Koont and Talagang, respectively.
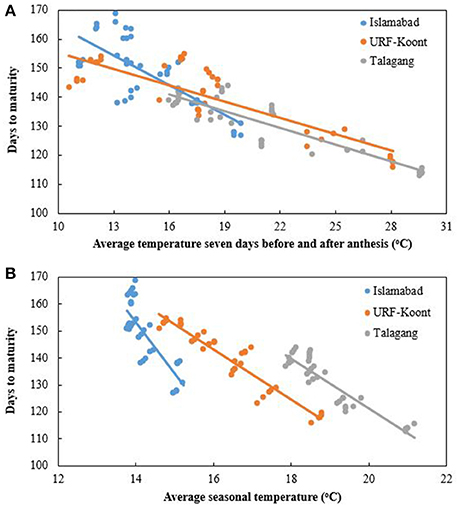
Figure 2. Trend line for number of days to maturity at Islamabad, URF Koont and Talagang including four sowing dates and 2 years as a function of (A) average temperature 7 days before and after anthesis, and (B) average seasonal temperature.
Biological Yield in Relation to Seasonal Temperature and Temperature during Flowering
Biological yield, i.e., above-ground biomass, differed considerably with average seasonal temperature at all sowing dates among all locations during both growing seasons. At Talagang average seasonal temperature ranged from 16.5 to 24.6°C and for URF-Koont and Islamabad it was in the range of 14–22°C and 12–17.5°C, respectively. Higher biological yield was observed at Islamabad than URF-Koont and Talagang (Figure 3). At later sowing dates, average seasonal temperature was higher than the early sowing so the crop matured in fewer days resulting in less production of biomass during both years. The range of average anthesis temperature is presented in Figure 3. A reduction in biological yield was noted with an increase in anthesis temperature. At Islamabad, biological yield was reduced from 11.43 t ha−1 to 3.41 t ha−1, while biological yield decreased from 9.90 t ha−1 to 3.22 t ha−1 and from 9.81 t ha−1 to 3.28 t ha−1 at URF-Koont and Talagang, respectively.
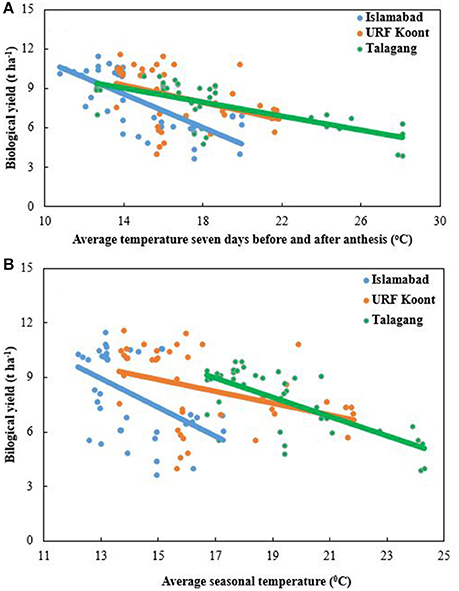
Figure 3. Trend line for biological yield at Islamabad, URF Koont and Talagang including four sowing dates and 2 years as a function of (A) average temperature 7 days before and after anthesis, and (B) average seasonal temperature.
Grain Yield with Respect to Seasonal Temperature and Temperature during Flowering
A reduction in grain yield was recorded with an increase in the average seasonal temperature. At Islamabad, grain yield dropped to 1.10 t ha−1 from 4.08 t ha−1, while grain yield decreased to 0.86 t ha−1 from 3.68 t ha−1 and 0.82 t ha−1 from 3.07 t ha−1 at URF-Koont and Talagang, respectively. Higher grain yield was recorded at Islamabad than at the warmer study sites, URF-Koont and Talagang (Figure 4). At later sowing dates, average seasonal temperature was higher than the early sowing so the wheat matured in fewer days, causing a reduction in grain yield during both years. Average anthesis temperature was higher at Talagang than URF-Koont and Islamabad (Figure 4). Higher anthesis temperature reduced grain yield at all locations.
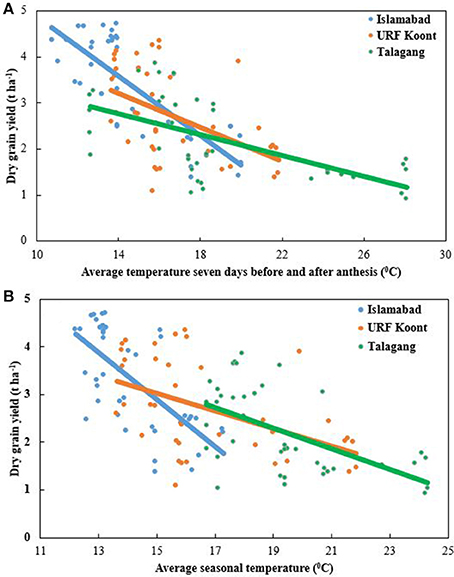
Figure 4. Trend line for grain yield at Islamabad, URF Koont and Talagang including four sowing dates and 2 years as a function of (A) average temperature 7 days before and after anthesis, and (B) average seasonal temperature.
Harvest Index with Respect to Seasonal Temperature and Temperature during Flowering
A reduction in harvest index (HI) was noted with an increase in average seasonal temperature. At Islamabad HI dropped from 0.38 to 0.18, while it dropped from 0.38 to 0.20 and 0.35 to 0.17 at URF-Koont and Talagang, respectively. A higher HI was recorded at Islamabad compared to the warmer study sites (Figure 5A). Higher temperature resulted in a reduction of grain numbers and size (data not presented), thus reducing HI. Average anthesis temperature was higher at Talagang than URF-Koont and Islamabad (Figure 5B). Average anthesis temperature likely influenced grain number, size, yield and HI at the three study sites during both years, but the experimental protocol did not permit isolation of the effects of seasonal and anthesis temperature.
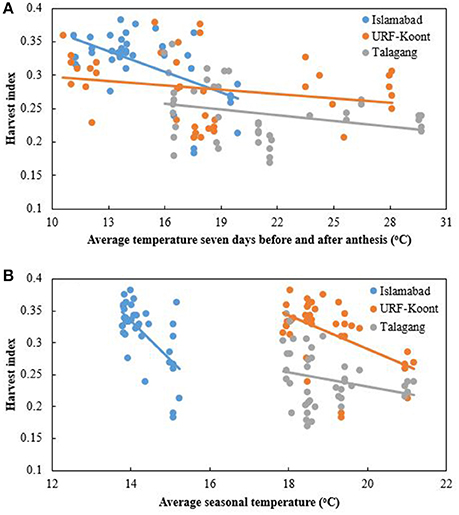
Figure 5. Trend line for Wheat harvest index at Islamabad, URF Koont and Talagang including four sowing dates and 2 years as a function of (A) average temperature 7 days before and after anthesis, and (B) average seasonal temperature.
Predicted Days to Anthesis, Anthesis to Maturity and Maturity
The Wang and Engel (1998) method was used to predict days to anthesis using temperature and phenological observations from SD2 for calibration at each site. Because the difference in phenological stages between genotypes was small, the genotype, Pak-13, was used as representative of wheat phenological responses to temperature. The Wang and Engel (1998) method of GDD calculation with no photoperiod effect overestimated days to anthesis (Figure 6, blue data). When the Wang and Engel (1998) method was combined with photoperiod and setting its coefficient value = 1, the predicted days to anthesis were reduced but they were still higher than the observed days to anthesis. A photoperiod coefficient value of 2 produced predicted days to anthesis that were very close to the observed days to anthesis. With further increases in photoperiod coefficient (3 and 4) the predicted days to anthesis were under estimated (Figure 6, black and yellow data).
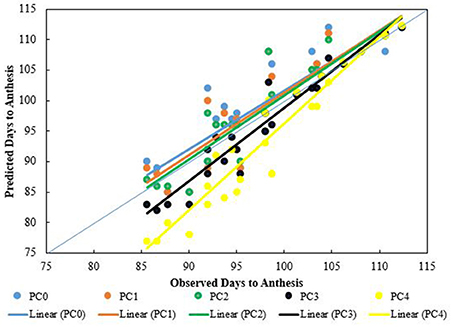
Figure 6. Trend lines for predicted vs. observed number of days to anthesis for four sowing dates, three sites, and 2 years. Predictions are based on the Wang and Engel algorithm (Equation 1) modified by photoperiod effect (Equation 3), the latter using photoperiod coefficients (PC) of 0, 1, 2, 3, and 4.
The predicted number of days from anthesis to maturity matched well the observations (Figure 7). The longest observed and predicted number of days from anthesis to maturity were 67 and 68 days, respectively, while the shortest were 28 and 27 days.
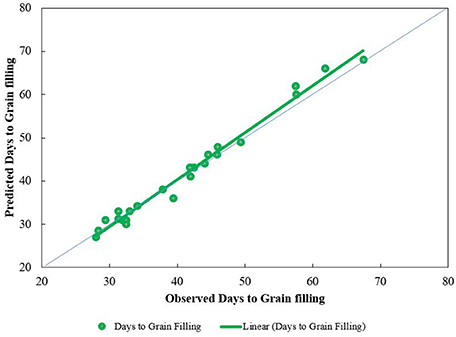
Figure 7. Trend lines for predicted vs. observed number of days from anthesis to maturity for four sowing dates at the three study sites during 2 years. Predictions are based on the Wang and Engel algorithm (Equation 1) modified by photoperiod effect (Equation 3), the latter using a photoperiod coefficient of 2.
The predicted days from emergence to maturity were calculated by adding the number of days to anthesis (using a photoperiod coefficient of 2) plus days from anthesis to maturity. Predicted days to maturity were very close to observed days to maturity (Figure 8).
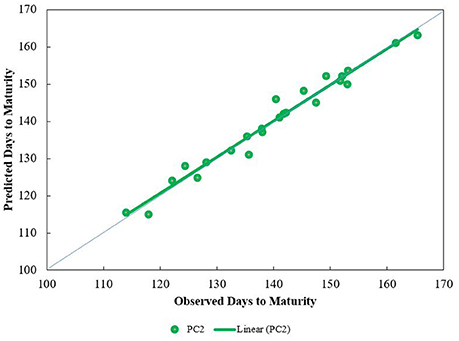
Figure 8. Trend lines for predicted vs. observed days from emergence to maturity at three sites and four sowing dates. Predictions are based on the Wang and Engel algorithm (Equation 1) modified by photoperiod effect (Equation 3), the latter using a photoperiod coefficient of 2.
Discussion
In this study, we saw a reduced number of days to maturity due to higher temperature, which has been reported by other authors, e.g., Sadras and Monzon (2006), who concluded that wheat phenology has a strong correlation with temperature. Temperature effects at three different study sites resulted in reduced number of days to maturity. The differences in phenology were due to variation in climatic parameters that prevailed during the crop life cycle at these sites (Table 2), in addition to the effect of higher seasonal temperature resulting from delayed sowing. Our results were in agreement with the findings of Asseng et al. (2011), Deryng et al. (2014), Hawkins et al. (2013), and Lobell et al. (2011). Wolkovich et al. (2012) reported that a change in the phenology of a crop is the most important indicator of climate change. Furthermore, Wang et al. (2015) suggested adjusting the sowing date to minimize the impact of heat stress, as well as using late-maturing cultivars to maintain crop phenology patterns that utilize resources more effectively. Using crop models to design ideotypes could be a good approach to predict the best genotypes for a target environment under climate change (Gouache et al., 2015). Since phenology is a key component in ideotype design, matching crop growth stages to optimal growing conditions is necessary to utilize resources effectively and to avoid climatic stresses such as the terminal heat stress observed in our studies (Foulkes et al., 2011; Sylvester-Bradley et al., 2012). Gomez-Macpherson and Richards (1995) concluded that phenology is an important aspect of adaptation and maximization of yield as phenology controls the duration of critical growth stages of the crop which has associations with abiotic stresses and further partitioning of assimilates. Accurate prediction of phenology is a very important step to calibrate different crop models (Ceglar and KajfeŽ-Bogataj, 2012; Archontoulis et al., 2014; Ahmed et al., 2016). Models can capture cultivar variations which affect leaf area development, biomass production and grain yield only if they can capture crop phenology accurately. Phenological parameters such as days to maturity are directly linked to crop productivity. Under normal conditions the more days to maturity, the higher is the yield. The higher seasonal temperature obtained in this study by sowing wheat late reduced days to maturity during both years. The Wang and Engel (1998) GDD method with photoperiod adjustments predicted days to maturity accurately, suggesting that spring wheat phenology is sensitive to both temperature and photoperiod. Zhang et al. (2015) argued that wheat genotypes were highly sensitive to photoperiod.
Crop biomass is closely associated with life cycle duration, and temperature is a dominant environmental factor influencing crop development (Liu et al., 2016). Camargo et al. (2016) reported that the relative timing of flowering and grain filling has a direct influence on wheat productivity. In our studies, a decrease in biomass due to higher temperature is consistent with earlier findings that higher heat accelerates crop phenology and crop senescence, which results in earlier crop maturity, lower biomass and lower crop yield (Zhao et al., 2007; Prasad et al., 2008; Hatfield and Prueger, 2015; Prasad and Jagadish, 2015). With higher temperature leading to earlier maturity and lower biomass production, it is critical to consider changing both sowing date and genotype under future warming. In all earlier studies a reduction in growing season length was associated with higher temperature, so current varieties may not be suitable in the future due to shortened growing seasons (Xiao et al., 2010; Asseng et al., 2015; Wang et al., 2015).
An increase in daily atmospheric temperature will accumulate more degree days and hasten maturity. Observed days to maturity varied significantly with atmospheric temperature. An increase in seasonal atmospheric temperature of 2–4°C (e.g., Wheeler et al., 2000) can shorten the crop life cycle, which ultimately reduces yield (Batts et al., 1997; Ahmed and Hassan, 2015). Semenov (2009) used a modeling approach and future climate projections and found that phenology is reduced to 14–16 days due to higher temperature. In our study, higher temperature had a negative correlation with biological and grain yield under all treatments.
For wheat, the Wang and Engel GDD method with photoperiod adjustment (for the period from emergence to anthesis) was effective in predicting days to anthesis and days from anthesis to maturity as a function of changing sowing dates and associated seasonal temperatures. This provides indication that this approach can be useful for predicting crop phenology under global warming scenarios.
Conclusions
Spring wheat phenology is driven by both temperature and photoperiod. Increasing temperatures have a significant effect on wheat crop phenology, biomass production, grain yield, and harvest index. High temperatures occurring in a period 7 days before and after anthesis affected grain numbers (data not presented) and yield but it could not be isolated from the effect of seasonal high temperatures. The Wang and Engel method for the calculation of GDD, coupled with an algorithm to adjust GDD as a function of day length extracted from the APSIM crop growth model, provided good estimates of number of days to anthesis across all sites, sowing dates and years. The Wang and Engel GDD method also provided excellent estimates of the number of days between anthesis and maturity. The good predictive capability of the algorithms tested suggests that they are adequate for estimation of global warming effects on wheat phenology.
Author Contributions
MAA conducted field experiments, collected, and analyzed the data, CS and MA designed the idea. MAA, MA, CS, SH, and RH wrote and finalized the manuscript; MA, CS, and SH conceived, directed the project, and approve of the final version of the manuscript. FH did editing of the article.
Funding
The first author (MAA) is thankful to Higher Education Commission (HEC), Pakistan for providing financial support to complete his Ph.D. studies. The research was financed through HEC Ph.D. Indigenous Fellowships for 5,000 Scholars Phase-II, Batch-II, 2013 PIN No. 213-60762-2AV2-066.
Conflict of Interest Statement
The authors declare that the research was conducted in the absence of any commercial or financial relationships that could be construed as a potential conflict of interest.
Acknowledgments
The authors are highly indebted to Higher Education Commission (HEC) Pakistan, International Research Support Initiative Program (IRSIP) HEC, and Department of Biological Systems Engineering (https://bsyse.wsu.edu/) Washington State University, Pullman USA to carry out the current study. The first author is also grateful to “National Agriculture Research Centre Islamabad” and PMAS-Arid Agriculture University Rawalpindi for providing the research facilities.
References
Ahmad, S., Abbas, G., Fatima, Z., Khan, R. J., Anjum, M. A., Ahmed, M., et al. (2017). Quantification of the impacts of climate warming and crop management on canola phenology in Punjab, Pakistan. J. Agron. Crop Sci. 203, 442–452. doi: 10.1111/jac.12206
Ahmed, M., Akram, M. N., Asim, M., Aslam, M., Hassan, F. U., Higgins, S., et al. (2016). Calibration and validation of APSIM-Wheat and CERES-Wheat for spring wheat under rainfed conditions: models evaluation and application. Comput. Electron. Agric. 123, 384–401. doi: 10.1016/j.compag.2016.03.015
Ahmed, M., and Hassan, F. U. (2015). Response of spring wheat (Triticum aestivum L.) quality traits and yield to sowing date. PLoS ONE 10:e0126097. doi: 10.1371/journal.pone.0126097
Akram, N., and Hamid, A. (2015). Climate change: a threat to the economic growth of Pakistan. Prog. Devel. Stud. 15, 73–86. doi: 10.1177/1464993414546976
Archontoulis, S. V., Miguez, F. E., and Moore, K. J. (2014). A methodology and an optimization tool to calibrate phenology of short-day species included in the APSIM PLANT model: application to soybean. Environ. Model. Soft. 62, 465–477. doi: 10.1016/j.envsoft.2014.04.009
Asseng, S., Ewert, F., Martre, P., Rotter, R. P., Lobell, D. B., Cammarano, D., et al. (2015). Rising temperatures reduce global wheat production. Natur. Clim. Chang. 5, 143–147. doi: 10.1038/nclimate2470
Asseng, S., Foster, I. A. N., and Turner, N. C. (2011). The impact of temperature variability on wheat yields. Glob. Chang. Bio. 17, 997–1012. doi: 10.1111/j.1365-2486.2010.02262.x
Barnabas, B., Jager, K., and Feher, A. (2008). The effect of drought and heat stress on reproductive processes in cereals. Plant Cell Environ. 31, 11–38. doi: 10.1111/j.1365-3040.2007.01727.x
Batts, G. R., Morison, J. I. L., Ellis, R. H., Hadley, P., and Wheeler, T. R. (1997). Effects of CO2 and temperature on growth and yield of crops of winter wheat over four seasons. Eur. J. Agron. 7, 43–52. doi: 10.1016/S1161-0301(97)00022-1
Bewick, T. A., Binning, L. K., and Yandell, B. (1988). A degree-day model for predicting the emergence of swamp dodder in cranberry. J. Am. Soc. Hort. Sci. 113, 839–841.
Camargo, A. V., Mott, R., Gardner, K. A., Mackay, I. J., Corke, F., Doonan, J. H., et al. (2016). Determining phenological patterns associated with the onset of senescence in a wheat MAGIC mapping population. Front. Plant Sci. 7:1540. doi: 10.3389/fpls.2016.01540
Cao, W., and Moss, D. N. (1997). Modeling phasic development in wheat: a conceptual integration of physiological components. J. Agri. Sci. 129, 163–172. doi: 10.1017/S0021859697004668
Ceglar, A., and KajfeŽ-Bogataj, L. (2012). Simulation of maize yield in current and changed climatic conditions: addressing modelling uncertainties and the importance of bias correction in climate model simulations. Eur. J. Agron. 37, 83–95. doi: 10.1016/j.eja.2011.11.005
Craufurd, P. Q., and Wheeler, T. R. (2009). Climate change and the flowering time of annual crops. J. Exp. Bot. 60, 2529–2539. doi: 10.1093/jxb/erp196
Daba, K., Warkentin, T. D., Bueckert, R., Todd, C. D., and Tar'an, B. (2016). Determination of photoperiod- sensitive phase in chickpea (Cicer arietinum L.). Front. Plant Sci. 11:478. doi: 10.3389/fpls.2016.00478
Deryng, D., Conway, D., Ramankutty, N., Price, J., and Warren, R. (2014). Global crop yield response to extreme heat stress under multiple climate change futures. Environ. Res. Letter. 9:034011. doi: 10.1088/1748-9326/9/3/034011
Dettori, M., Cesaraccio, C., and Duce, P. (2017). Simulation of climate change impacts on production and phenology of durum wheat in Mediterranean environments using CERES-Wheat model. Field Crop. Res. 206, 43–53. doi: 10.1016/j.fcr.2017.02.013
Dias, A. S., and Lidon, F. C. (2009). Evaluation of grain filling rate and duration in bread and durum wheat, under heat stress after anthesis. J. Agron. Crop Sci. 195, 137–147. doi: 10.1111/j.1439-037X.2008.00347.x
Dias, A. S., and Lidon, F. C. (2010). Bread and durum wheat tolerance under heat stress: asynoptical overview. J. Food. Agric. 22, 412–436. doi: 10.9755/ejfa.v22i6.4660
DSSAT Perturb (2014). DSSAT Perturb Tool. A New Tool Generates Climate Projection Data for DSSAT Users. Available online at: http://www.climsystems.com/dssat-perturb/
Dwivedi, S. K., Basu, S., Kumar, S., Kumar, G., Prakash, V., Kumar, S., et al. (2017). Heat stress induced impairment of starch mobilisation regulates pollen viability and grain yield in wheat: study in Eastern Indo-Gangetic Plains. Field Crop. Res. 206, 106–114. doi: 10.1016/j.fcr.2017.03.006
Figueiredo, N., Carranca, C., Trindade, H., Pereira, J., Goufo, P., Coutinho, J., et al. (2015). Elevated carbon dioxide and temperature effects on rice yield, leaf greenness, and phenological stages duration. Padd. Wat. Environ. 13, 313–324. doi: 10.1007/s10333-014-0447-x
Foulkes, M. J., Slafer, G. A., Davies, W. J., Berry, P. M., Sylvester-Bradley, R., Martre, P., et al. (2011). Raising yield potential of wheat. III. Optimizing partitioning to grain while maintaining lodging resistance. J. Exp. Bot. 62, 469–486. doi: 10.1093/jxb/erq300
Gomez-Macpherson, H., and Richards, R. (1995). Effect of sowing time on yield and agronomic characteristics of wheat in south-eastern Australia. Aus. J. Agric. Res. 46, 1381–1399. doi: 10.1071/AR9951381
Gouache, D., Bogard, M., Thepot, S., Pegard, M., Le Bris, X., and Deswarte, J. C. (2015). From ideotypes to genotypes: approaches to adapt wheat phenology to climate change. Procedia Environ. Sci. 29, 34–35. doi: 10.1016/j.proenv.2015.07.143
Hansen, J., Sato, M., and Ruedy, R. (2012). Perception of climate change. Proc. Natl. Acad. Sci. U.S.A. 109, E2415–E2423. doi: 10.1073/pnas.1205276109
Hatfield, J. L., and Prueger, J. H. (2015). Temperature extremes: effect on plant growth and development. Weath. Climat. Ext. 10(Pt A), 4–10. doi: 10.1016/j.wace.2015.08.001
Hawkins, E., Fricker, T. E., Challinor, A. J., Ferro, C. A., Ho, C. K., and Osborne, T. M. (2013). Increasing influence of heat stress on French maize yields from the 1960s to the 2030s. Glob. Chang. Bio. 19, 937–947. doi: 10.1111/gcb.12069
Hussain, S. S., and Mudasser, M. (2007). Prospects for wheat production under changing climate in mountain areas of Pakistan-an econometric analysis. Agric. Sys. 94, 494–501. doi: 10.1016/j.agsy.2006.12.001
IPCC (2014). “Climate change 2014,” in Impacts, Adaptation, and Vulnerability, Contribution of Working Group II to the Fifth Assessment Report of the Intergovernmental Panel on Climate Change, eds C. B. Field, V. R. Barros, D. J. Dokken, K. J. Mach, M. D. Mastrandrea, T. E. Bilir, M. Chatterjee, K. L. Ebi, Y. O. Estrada, R. C. Genova, B. Girma, E. S. Kissel, A. N. Levy, S. MacCracken, P. R. Mastrandrea, and L. L. White (Geneva), 688.
Joshi, A. K., Ferrara, O., Crossa, J., Singh, G., Sharma, R., Chand, R., et al. (2007). Combining superior agronomic performance and terminal heat tolerance with resistance to spot blotch (Bipolaris sorokiniana) in the warm humid Gangeticplains of south Asia. Field Crop. Res. 103, 53–61. doi: 10.1016/j.fcr.2007.04.010
Langer, R. H. M., and Olugbemi, L. B. (1970). A study of New Zealand wheats. IV. Effects of extreme temperature at different stages of development. J. Agric. Res. 13, 878–886.
Liu, B., Liu, L., Asseng, S., Zou, X., Li, J., Cao, W., et al. (2016). Modelling the effects of heat stress on post-heading durations in wheat: a comparison of temperature response routines. Agri. Forest Meteor. 222, 45–58. doi: 10.1016/j.agrformet.2016.03.006
Lobell, D., Banziger, M., Magorokosho, C., and Vivek, B. (2011). Nonlinear heat effects on African maize as evidenced by historical yield trials. Natur. Climat. Chang. 1, 42–45. doi: 10.1038/nclimate1043
Madan, P., Jagadish, S., Craufurd, P., Fitzgerald, M., Lafarge, T., and Wheeler, T. (2012). Effect of elevated CO2 and high temperature on seed-set and grain quality of rice. J. Exp. Bot. 63, 3843–3852. doi: 10.1093/jxb/ers077
McMaster, S. G., and Wilhelm, W. W. (1997). Growing degree-days: one equation, two interpretations. Agric. Forest Meteor. 87, 291–300. doi: 10.1016/S0168-1923(97)00027-0
Modarresi, M., Mohammdi, V., Zali, A., and Mardi, M. (2010). Response of wheat yield and yield related traits of high temperature. Cereal Res. Commun. 38, 23–31. doi: 10.1556/CRC.38.2010.1.3
Parmesan, C. (2006). Ecological and evolutionary responses to recent climate change. Ann. Rev. Eco. Evo. Syst. 37, 637–669. doi: 10.1146/annurev.ecolsys.37.091305.110100
Plaut, Z., Butow, B. J., Blumenthal, C. S., and Wrigley, C. W. (2004). Transport of dry matterinto developing wheat kernels and its contribution to grain yield under postanthesis water deficit and elevated temperature. Field Crop. Res. 86, 185–198. doi: 10.1016/j.fcr.2003.08.005
Prasad, P. V. V., and Jagadish, S. V. K. (2015). Field crops and the fear of heat stress – opportunities, challenges and future directions. Procedia Environ. Sci. 29, 36–37. doi: 10.1016/j.proenv.2015.07.144
Prasad, P. V. V., Pisipati, S. R., Ristic, Z., Bukovnik, U., and Fritz, A. K. (2008). Impact of Nighttime Temperature on Physiology and Growth of Spring Wheat All rights reserved. No part of this periodical may be reproduced or transmitted in any form or by any means, electronic or mechanical, including photocopying, recording, or any information storage and retrieval system, without permission in writing from the publisher. Permission for printing and for reprinting the material contained herein has been obtained by the publisher. Crop Sci. 48, 2372–2380. doi: 10.2135/cropsci2007.12.0717
Randall, P. J., and Moss, H. J. (1990). Some effects of temperature regime during grain filling on wheat quality. Aust. J. Agric. Res. 41, 603–617. doi: 10.1071/AR9900603
Rasul, G., Mahmood, A., Sadiq, A., and Khan, S. I. (2012). Vulnerability of Indus delta to climate change in Pakistan. Pak. J. Meteor. 8, 89–107. Available online at: http://www.pmd.gov.pk/rnd/rnd_files/vol8_Issue16/8_Vulnerability%20of%20the%20Indus%20Delta%20to%20Climate%20Change%20in%20Pakistan.pdf
Root, T. L., Price, J. T., Hall, K. R., Schneider, S. H., Rosenzweig, C., and Pounds, J. A. (2003). Fingerprints of global warming on wild animals and plants. Nature 421, 57–60. doi: 10.1038/nature01333
Sadras, V. O., and Monzon, J. P. (2006). Modelled wheat phenology captures rising temperature trends: shortened time to flowering and maturity in Australia and Argentina. Field Crop. Res. 99, 136–146. doi: 10.1016/j.fcr.2006.04.003
Semenov, M. A. (2009). Impacts of climate change on wheat in England and Wales. J. R. Soc.Interfac. 6, 343–350. doi: 10.1098/rsif.2008.0285
Slafer, G. A., and Rawson, H. M. (1994). Sensitivity of wheat phasic development to major environmental factors: a re-examination of some assumptions made by physiologists and modelers. Aust. J. Plant Physiol. 21, 393–426. doi: 10.1071/PP9940393
Stone, P. J., and Nicolas, M. E. (1994). Wheat cultivars vary widely in their responses of grain yield and quality to short periods of post-anthesis heat stress. Funct. Plant Biol. 21, 887–900. doi: 10.1071/PP9940887
Sylvester-Bradley, R., Riffkin, P., and O'Leary, G. (2012). Designing resource-efficient ideotypes for new cropping conditions: wheat (Triticum aestivum L.) in the High Rainfall Zone of southern Australia. Field Crop. Res. 125, 69–82.
Tao, F., Zhang, Z., Shi, W., Liu, Y., Xiao, D., Zhang, S., et al. (2013). Single rice growth period was prolonged by cultivars shifts, but yield was damaged by climate change during 1981–2009 in China, and late rice was just opposite. Glob. Chang. Biol. 19, 3200–3209. doi: 10.1111/gcb.12250
Tashiro, T., and Wardlaw, I. F. (1990). The response to high temperature shock and humidity changes prior to and during the early stages of grain development in wheat. Aust. J. Plant Physiol. 17, 551–561. doi: 10.1071/PP9900551
van Ogtrop, F., Ahmed, M., and Moeller, C. (2014). Principal components of sea surface temperatures as predictors of seasonal rainfall in rainfed wheat growing areas of Pakistan. Meteorol. Appl. 21, 431–443. doi: 10.1002/met.1429
Wang, B., Liu, D. L., Asseng, S., Macadam, I., and Yu, Q. (2015). Impact of climate change on wheat flowering time in eastern Australia. Agri. Forest Meteor. 209–210, 11–21. doi: 10.1016/j.agrformet.2015.04.028
Wang, E., and Engel, T. (1998). Simulation of phenological development of wheat crops. Agric. Sys. 58, 1–24. doi: 10.1016/S0308-521X(98)00028-6
Wheeler, T. R., Craufurd, P. Q., Ellis, R. H., and Porter, J. R., and V. P., P. V. (2000). Temperature variability and the yield of annual crops. Agric. Ecosyst. Environ. 82, 159–167. doi: 10.1016/S0167-8809(00)00224-3
Wolkovich, E. M., Cook, B. I., Allen, J. M., Crimmins, T. M., Betancourt, J. L., Travers, S. E., et al. (2012). Warming experiments underpredict plant phenological responses to climate change. Nature 485, 494–497. doi: 10.1038/nature11014
Xiao, G., Zhang, Q., Li, Y., Wang, R., Yao, Y., Zhao, H., et al. (2010). Impact of temperature increase on the yield of winter wheat at low and high altitudes in semiarid northwestern China. Agric. Water Manag. 97, 1360–1364. doi: 10.1016/j.agwat.2010.04.002
Yang, S., Logan, J., and Coffey, D. L. (1995). Mathematical formulae for calculating the base temperature for growing degree days. Agric. Forest Meteor. 74, 61–74. doi: 10.1016/0168-1923(94)02185-M
Zadoks, J. C., Chang, T. T., and Konzak, C. F. (1974). A decimal code for the growth stages of cereals. Weed Res. 14, 415–421. doi: 10.1111/j.1365-3180.1974.tb01084.x
Zhang, X., Gao, M., Wang, S., Chen, F., and Cui, D. (2015). Allelic variation at the vernalization and photoperiod sensitivity loci in Chinese winter wheat cultivars (Triticum aestivum L.). Front. Plant Sci. 6:00470. doi: 10.3389/fpls.2015.00470
Zhang, X., Wang, S., Sun, H., Chen, S., Shao, L., and Liu, X. (2013). Contribution of cultivar, fertilizer and weather to yield variation of winter wheat over three decades: a case study in the North China Plain. Eur. J. Agron. 50, 52–59. doi: 10.1016/j.eja.2013.05.005
Zhao, H., Dai, T., Jing, Q., Jiang, D., and Cao, W. (2007). Leaf senescence and grain filling affected by post-anthesis high temperatures in two different wheat cultivars. Plant Grow. Regul. 51, 149–158. doi: 10.1007/s10725-006-9157-8
Zheng, B., Chenu, K., Doherty, A., and Chapman, S. (2014). The APSIM-Wheat Module (7.5 R 3008). Available online at: http://www.apsim.info/Portals/0/Documentation/Crops/WheatDocumentation.pdf (Accessed May 2017).
Keywords: wheat, temperature, photoperiod, growing degree days, sowing dates
Citation: Aslam MA, Ahmed M, Stöckle CO, Higgins SS, Hassan Fu and Hayat R (2017) Can Growing Degree Days and Photoperiod Predict Spring Wheat Phenology? Front. Environ. Sci. 5:57. doi: 10.3389/fenvs.2017.00057
Received: 05 December 2016; Accepted: 25 August 2017;
Published: 25 September 2017.
Edited by:
María Rosa Mosquera-Losada, Universidade de Santiago de Compostela, SpainReviewed by:
Shabir Hussain Wani, Michigan State University, United StatesShakeel Ahmad, Bahauddin Zakariya University, Pakistan
Copyright © 2017 Aslam, Ahmed, Stöckle, Higgins, Hassan and Hayat. This is an open-access article distributed under the terms of the Creative Commons Attribution License (CC BY). The use, distribution or reproduction in other forums is permitted, provided the original author(s) or licensor are credited and that the original publication in this journal is cited, in accordance with accepted academic practice. No use, distribution or reproduction is permitted which does not comply with these terms.
*Correspondence: Mukhtar Ahmed, ahmadmukhtar@uaar.edu.pk