Regionalizing Resilience to Acute Meteorological Events: Comparison of Regions in the U.S.
 Kevin Summers
 Linda Harwell
 Lisa M. Smith
 Kyle D. Buck
- Gulf Ecology Division, National Health and Environmental Effects Research Laboratory Office of Research and Development U.S. Environmental Protection Agency, Gulf Breeze, FL, United States
Using a Climate Resilience Screening Index (CRSI) that was developed to represent resilience to acute weather events at multiple scales for the United States, nine regions of the United States are compared for resilience for these types of natural hazards. The comparison examines the domains, indicators, and metrics of CRSI addressing environmental, economic, and societal aspects of resilience to acute climate events at county scales. The index was applied at the county scale and aggregated to represent select regions of the United States. Comparisons showed higher levels of resilience in the Northeast and West, including Alaska, (>4.0) while counties in the South Atlantic and South-Central regions exhibited lower resilience (<2.0) to acute climate events. Northeast, West and Mountain regions of the US are characterized by relatively low levels of risk (<0.26), higher levels of governance (>0.60), and above national median scores for society, built environment and natural environment domains which enhances their resilience scores. South Atlantic and South-Central regions of the US are characterized by higher risk scores (>0.31) accompanied by lower levels of governance (<0.48) and below national median scores for society and built environment domains reducing the region's overall resilience.
Introduction
Natural hazards can result in disasters without proper governance and mitigating systems (Chandra et al., 2007). In the recent past, the United States has witnessed several natural disasters including major hurricanes, earthquakes, tornadoes, and wildfires. While some governance and mitigation measures have been taken, future natural hazards disasters cannot be prevented due to the fact these events can hit random locations, have varying magnitudes, and can take unexpected forms. Therefore, the enhancement of the capacity of communities to resist and recover from these types of natural hazard disasters is paramount. Several global, national, and local agencies are confronted with this situation and have developed frameworks to address these issues (e.g., UN/ISDR, 2002; FEMA, 2012, 2017a,b; NRC, 2012; FDH, 2016; FDEM, 2018).
Resilience is increasingly used as a pathway for understanding the actions of natural hazard disasters. Resilience was originally an ecological concept (Holling, 1973) that was adapted to social systems (Adger, 2000) and eventually to joint human-environmental systems (Folke, 2006). What natural disasters have taught us is that resilience to these disasters needs to be discussed within the framework of integrated socio-ecological systems (Berkes et al., 2003). Similarly, the temporal scale of these disaster events can be short-term (Bruneau et al., 2003; Rose, 2004) associated with specific acute meteorological events or longer-term associated with global change (Dovers and Handmer, 1992). Regardless, there is no common conceptualization for resilience. This manuscript uses a conceptualization for resilience to short-term meteorological hazards (Summers et al., 2017a, 2018) and analyses the results to depict regional comparisons.
Climate Resilience Screening Index—Conceptualization, Approach and Structure
The conceptualization, approach and structure of the Climate Resilience Screening Index (CRSI) for acute meteorological events has been described in detail in Summers et al. (2017a,b). A short synopsis of this index is provided here.
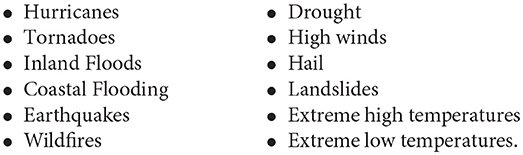
In the construction of the CRSI index, the historical occurrence of acute meteorological events associated with geographic regions throughout the United States were assessed as well as the infrastructure challenges these events created. Discussions with climate experts, in conjunction with the information provided by the National Climate Assessment (Melillo et al., 2014) and the 100 Resilient Cities report (ARUP, 2014) yielded twelve (12) acute meteorological events and natural hazards that were included in CRSI:
No singular approach among existing composite measures of climate resilience met all of the expected needs for developing CRSI. Collectively, however, the reviewed literature provided many of the building blocks (e.g., suites of indicators, indicator groupings, domains). To varying degrees, all of the existing indices offered patterns of indicator groupings. In the final conceptualization of CRSI, five domains were comprised of twenty indicators that were derived from 117 unique metrics. Figure 1 depicts the final CRSI conceptual framework including the domains and indicators of the index. A summary and discussion of the domains, indicators and types of metrics used in CRSI can be found in Summers et al. (2017b, 2018) and are listed in Table 1.
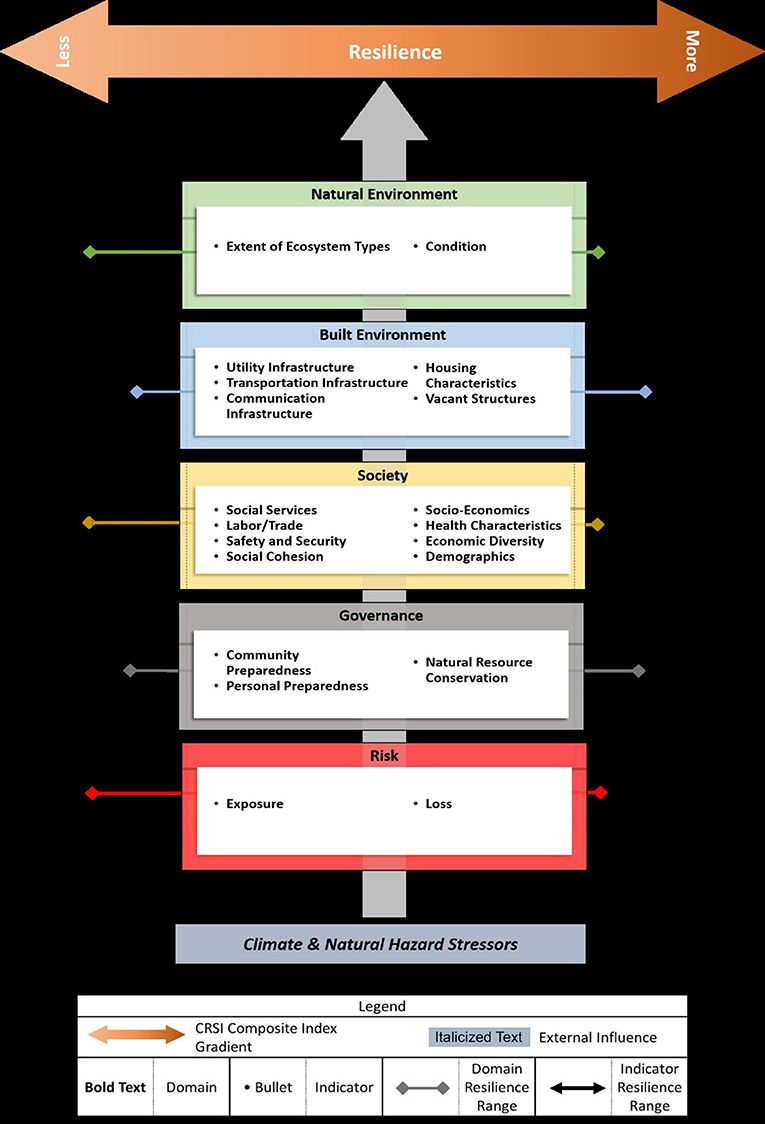
Figure 1. Final CRSI conceptual framework. Arrows projected from boxes to the left and right represent hypothetical increases and decreases in ranges for indicators (black arrows) and domains (colored arrows).
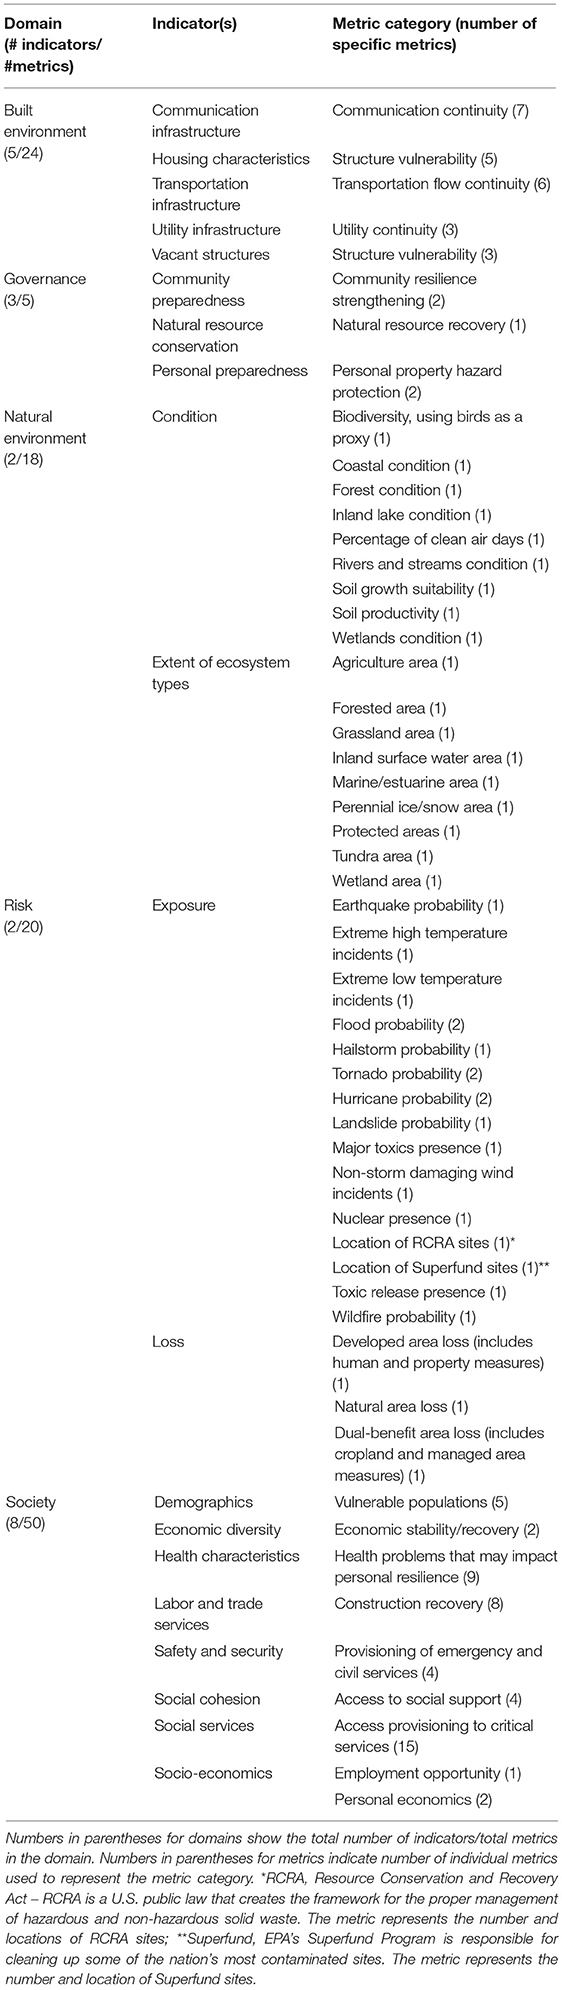
Table 1. List of CRSI domains, indicators, scope, and number of metrics.
All domains for each county, parish and borough (all referred to as county below) were min-max standardized on a scale from 0.01 to 0.99. The final CRSI calculation begins as a scaled value for recoverability/vulnerability derived from Governance and Risk (basic CRSI) with the Governance value being adjusted by the remaining domain scores for social, built environment and natural environment to complete the calculation of CRSI as shown below:
where CRSI(B)i = value of basic resilience (Recovery/Vulnerability or Ri/Vi) and Ri/Vi = Governance in county i/Risk in county i. The overall CRSI score is calculated as:
where CRSIi = the value of CRSI or adjusted resilience for county i and Soc(a)i, BE(a)i, and NE(a)i are the adjustment multipliers for Society, Built Environment, and Natural Environment in each county i, and Riski is the Risk score for county i. The adjustment factors are calculated as:
where Soc(a)i is the adjustment multiplier for society in county i, Soci is the social domain score for county i and Socm is the median social domain score (median is used rather than mean to match the skewed distribution of the data) for all counties;
where BE(a)I is the adjustment multiplier for built environment in county i, BEi is the built environment domain score for county i and BEm is the median built environment domain score for all counties;
and where NE(a)i is the adjustment multiplier for natural environment in county i, NEi is the natural environment domain score for county i and NEm is the median natural environment domain score for all counties.
The national results of CRSI have been provided elsewhere (Summers et al., 2017b, 2018) as well as a regionalization providing direct utility to the U.S. Environmental Protection Agency (EPA)—a regionalization by EPA Regions (the U.S. is divided into 10 EPA regions). However, such a regionalization is of limited utility to non-EPA decision makers. Therefore, the national data has been regionalized by geographic region based on Census Divisions (U.S. Department of Commerce, 2018) and by state to be of better use for these decision-makers as presented in Figure 2. This regionalization separates the United States into nine areas:
1) New England—Connecticut, Maine, Massachusetts, New Hampshire, Rhode Island, and Vermont
2) Middle Atlantic—New Jersey, New York, and Pennsylvania
3) East North Central—Illinois, Indiana, Michigan, Ohio, and Wisconsin
4) West North Central—Iowa, Kansas, Minnesota, Missouri, Nebraska, North Dakota, and South Dakota
5) South Atlantic—Delaware, District of Columbia, Florida, Georgia, Maryland, North Carolina, South Carolina, Virginia, and West Virginia
6) East South Central—Alabama, Kentucky, Mississippi, and Tennessee
7) West South Central—Arkansas, Louisiana, Oklahoma, and Texas
8) Mountain—Arizona, Colorado, Idaho, Nevada, New Mexico, Utah, and Wyoming
9) Pacific—Alaska, California, Hawaii, Oregon, and Washington.
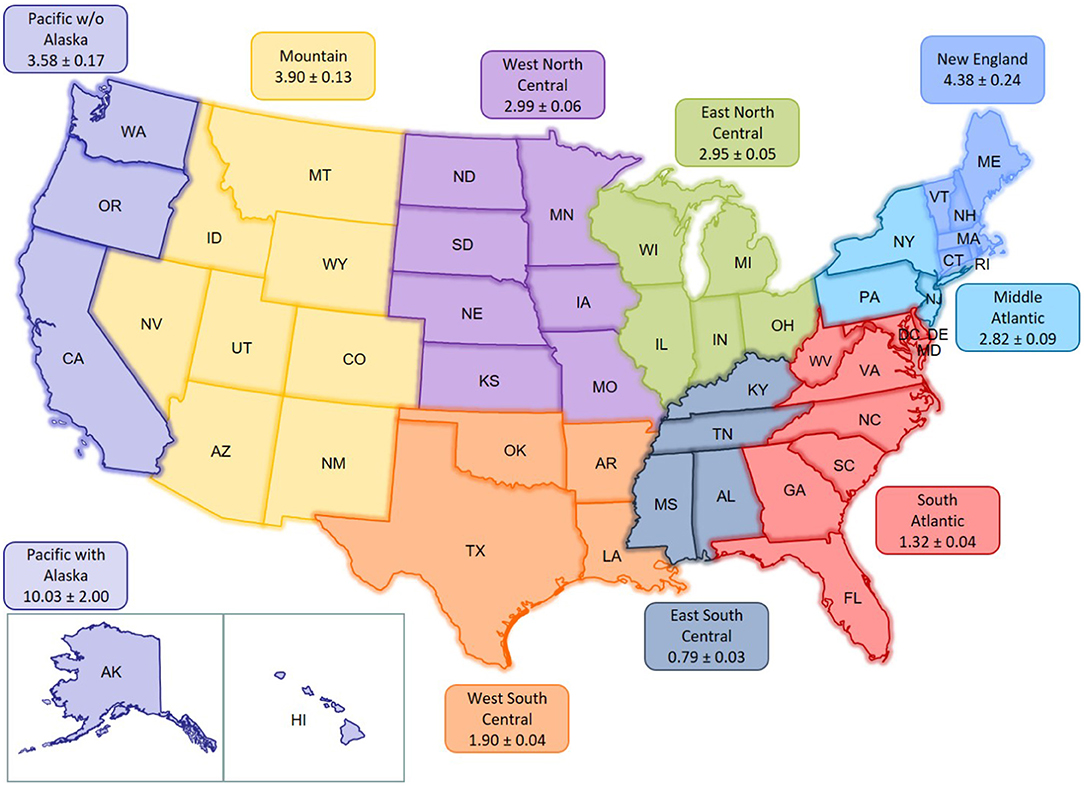
Figure 2. Regionalized CRSI results with estimate of uncertainty.
Data from Alaska is only partially available with about 50% of its boroughs not represented. Due to both missing data and very low risk domain scores for Alaska (risk to acute meteorological events), use of Alaska data skews the scores for the Pacific region. To better represent issues associated with the Pacific region, results will be discussed both including and excluding Alaska.
Regionalization Results
The overall CRSI regionalized results are depicted in Figure 2. These scores show that the Pacific (with or without Alaska), New England, and Mountain Regions display the highest overall resilience while the East South Central, South Atlantic, and West South Central display the lowest overall resilience. This distribution of overall scores is the result of specific regional domain scores (Figure 3). One of the primary domains affecting the overall CRSI score for a region is risk. Risk is comprised of 12 types of meteorological events and is adjusted based on losses due to those events and potential anthropogenic hazard exposures. Figure 4 shows the comparative levels of risk for the events, losses, and anthropogenic risks by U.S. region. In all regions the risk domain is driven by historical exposure with minimal contributions from historical losses. The highlights of the domain scores for each region and its comprising states will be discussed below by individual region.
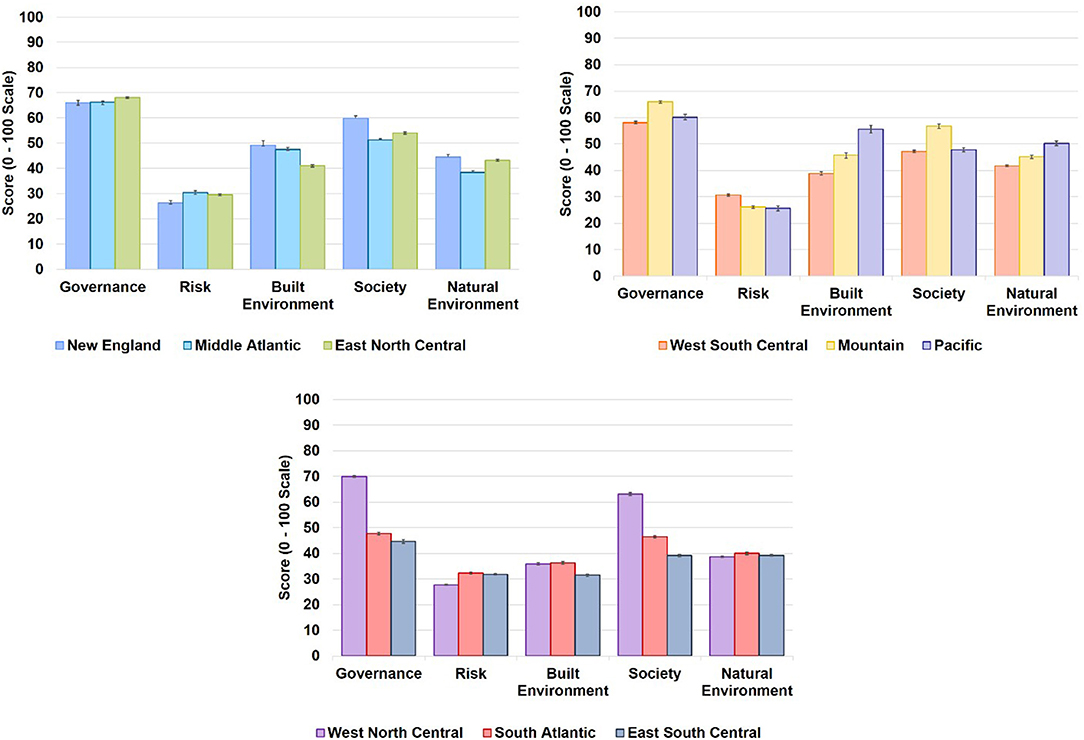
Figure 3. Domain scores by U.S. Region (vertical bars represent uncertainty).
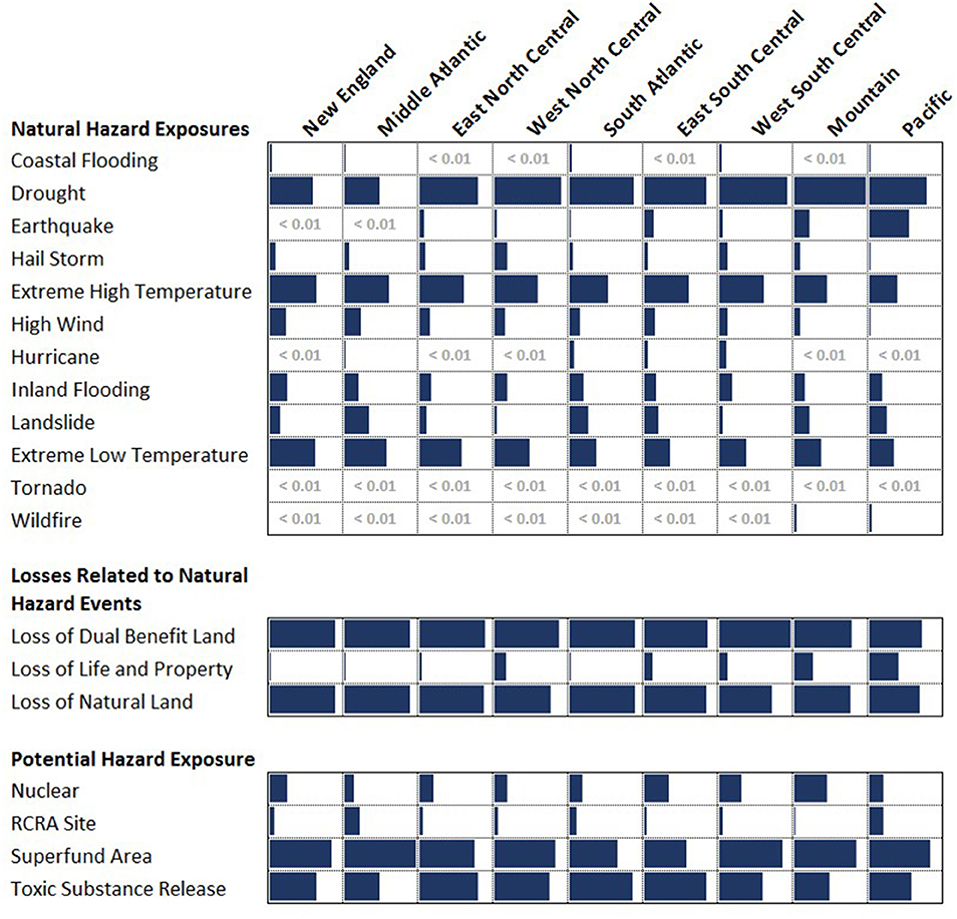
Figure 4. Relative comparison of risk of meteorological events, losses due to those events and potential anthropogenic hazard exposures by region. Sum of each column associated with the three risk subsets equals 1 (or multiplied by 100 equals 100%).
New England
The New England region is comprised of five states and is characterized by the second highest CRSI score in the U.S. (4.375) or the highest score if Alaska is excluded from the Pacific region (Table 2). All states in the New England region are either near the national CRSI average (Rhode Island) or significantly above the national averages (all remaining states in the region). All New England states are characterized by lower than average risk to meteorological events and significantly higher than average governance. All states have average or higher than average built environment scores except Rhode Island which is significantly lower than average (0.302). Similarly, all states have higher than average society scores with Vermont demonstrated among the highest state society scores in the nation (0.671). All New England states have natural environment scores either close to the national average or significantly greater than the average (Rhode Island, 0.511, and Maine, 0.484).
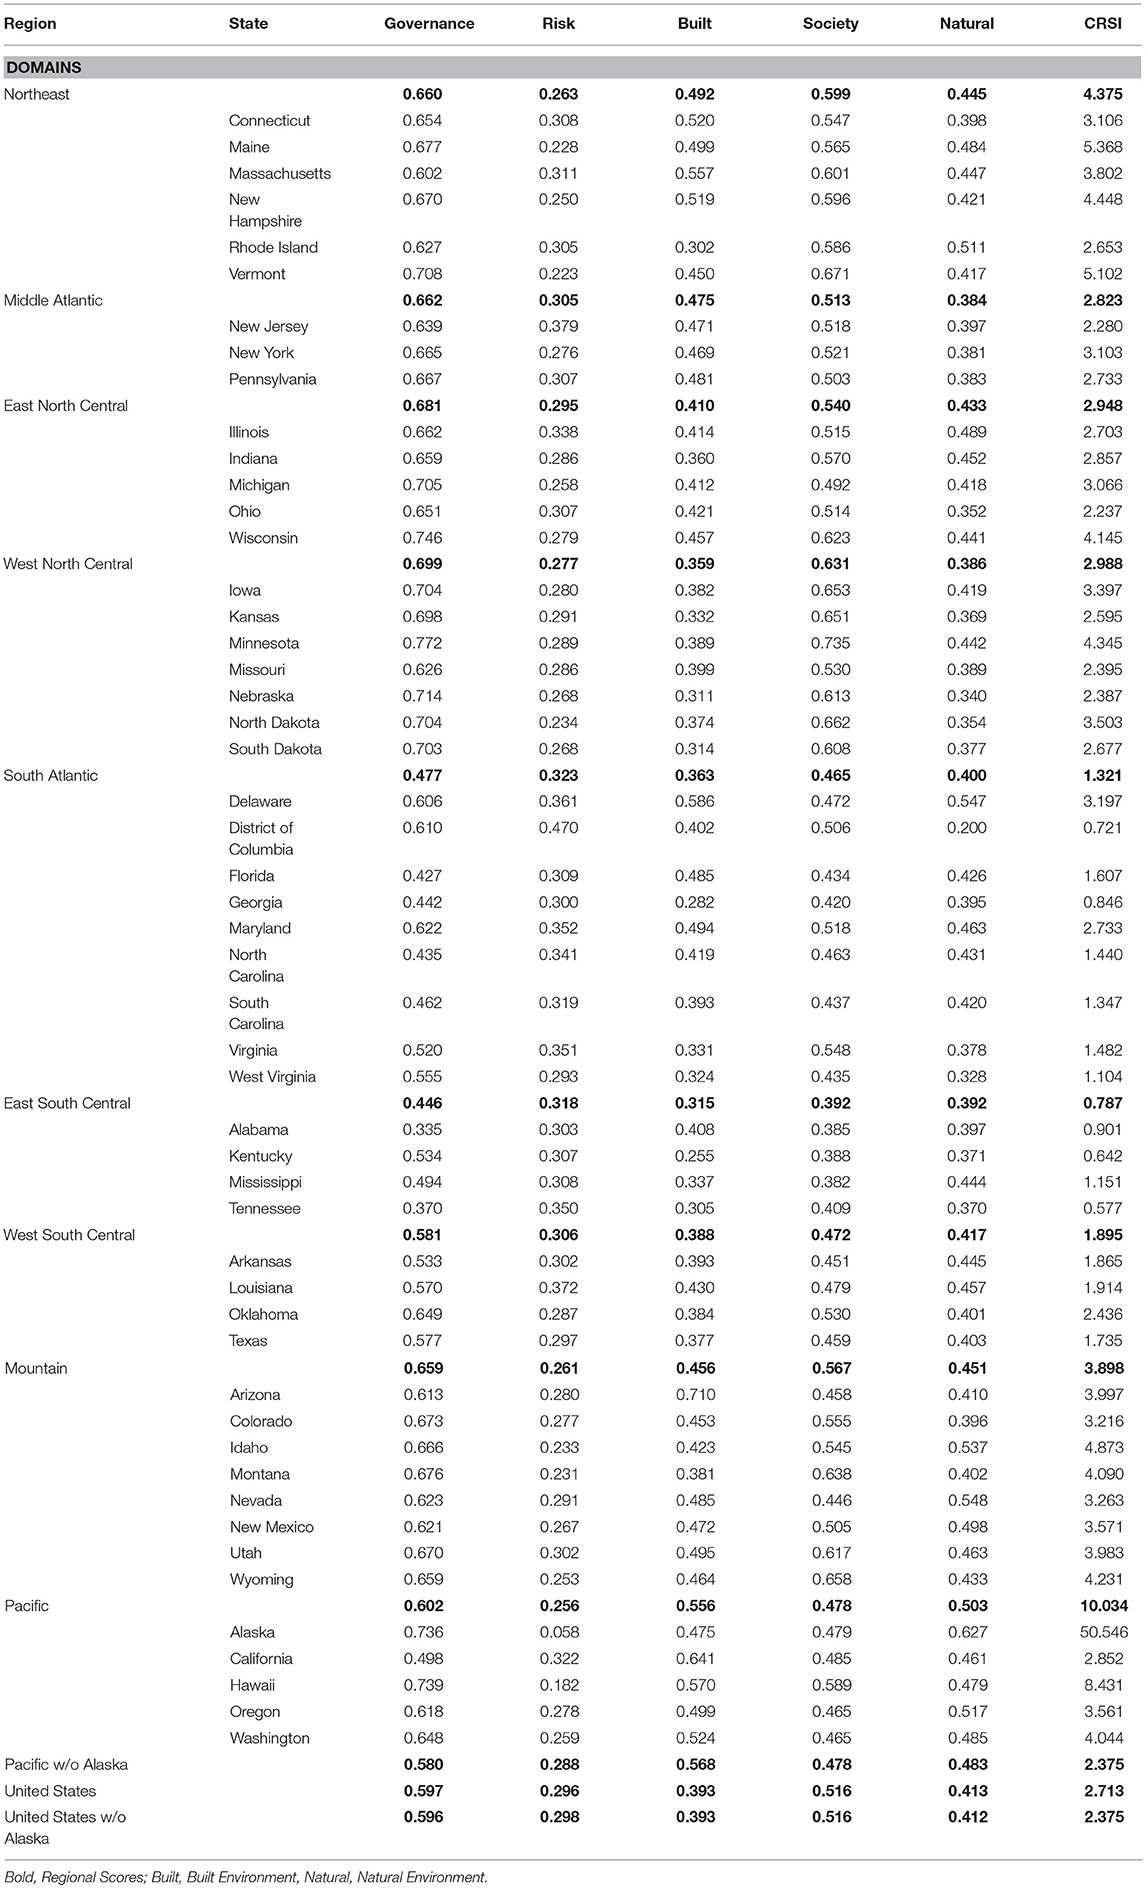
Table 2. Regionalized CRSI scores and domain scores by region and state.
Meteorological risks in New England (Figure 4) are characterized by extreme high and low temperatures (49% of events and well-above the national average) and drought (23% of events but well-below the national average). Inland flooding, high winds and hailstorms comprise the remaining secondary risks at 9, 9, and 3%, respectively, with high wind events being significantly above the national average. These types of events result in minimal loss of life and physical property (about 1% of the loss in New England), although losses to agricultural and silvicultural lands, as well as natural ecosystem, comprise about 99% of losses. Potential anthropogenic hazards existing near sites of meteorological events are dominated by Superfund sites (47%) and general toxic release sites (e.g., industrial outflows) at 36% (both at the national average).
CRSI scores can be deconstructed to assess which indicators are the primary contributors to the score and which indicators contribute weakly to the score. Using polar plots (Figures 5–7), these contributions can be quantified visually for each region of the United States. Figure 5A shows the deconstruction of the New England CRSI score by domains. Risk domains simply reflect histories of exposure and cannot theoretically be altered by human actions to reduce risks. The major contributors to the CRSI score in the New England region are natural resource conservation contributions to governance; demographic characteristics, economic diversity, and socio-economics to society; the number of vacant structures and general housing characteristics to the built environment; and, the extent or acreage of natural ecosystems (not built environments) in the natural environment.
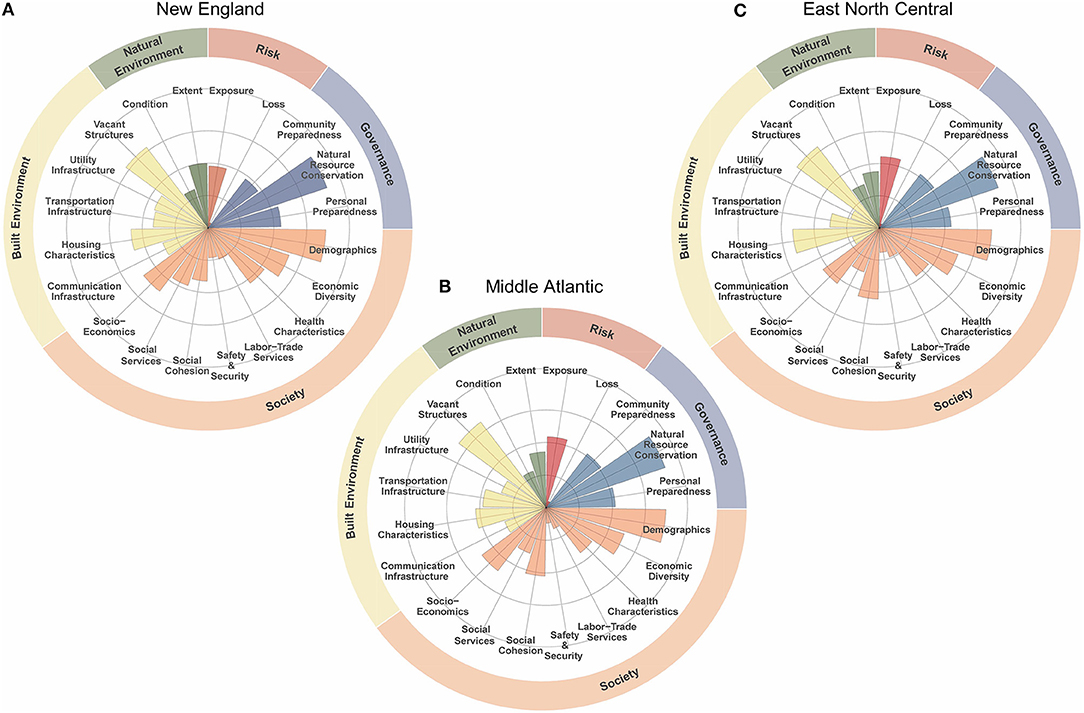
Figure 5. Polar plots of the (A) New England, (B) Middle Atlantic, and (C) East North Central regions.
Of the 67 counties in the New England region, the top 10% of CRSI scores (scores = 6.95 to 12.7) were seen in Maine (3 counties), Vermont (2 counties), and Massachusetts and New Hampshire (1 county each). Only two New England counties (both in Rhode Island) have resilience scores significantly below the national average.
Middle Atlantic
The Middle Atlantic region is comprised of three states and is characterized a moderate CRSI score (2.823) (Table 2). All states in the Middle Atlantic region are near the national CRSI average with New York demonstrating an overall CRSI score slightly above the national average (3.103). Most Middle Atlantic states are characterized by average risk to meteorological events with New Jersey showing elevated risks (0.379) and all states in the region showed significantly higher than average governance scores. All states have higher than average built environment scores and average society scores. All Middle Atlantic states have natural environment scores slightly lower than the national average.
Meteorological risks in the Middle Atlantic region (Figure 4) are characterized by extreme high and low temperatures (46% of events and well-above the national average) and drought (19% of events but well-below the national average). The region is exposed to three other types of meteorological events—landslides (13%), high wind events (9%), and inland flooding (8%). Landslides and high wind events are about twice the national average. These types of events result in minimal loss of life and physical property (<1% of the loss in the Middle Atlantic) although losses to agricultural and silvicultural lands, as well as natural ecosystem, comprise about 99% of losses (equally divided). Potential anthropogenic hazards existing near sites of meteorological events are dominated by Superfund sites (54%, significantly above the national average), general toxic release sites (e.g., industrial outflows) at 26% (significantly below the national average) and RCRA sites (12% at twice the national average).
The major contributors to the CRSI score in the Middle Atlantic region are natural resource conservation contributions to governance; demographic characteristics, economic diversity, socio-economics and social cohesion to society; the number of vacant structures to the built environment; and, the extent and condition of natural ecosystems in the natural environment (Figure 5B).
Of the 150 counties in the Middle Atlantic region, the top 10% of CRSI scores (scores = 4.35 to 5.61) were seen in New York (12 counties) and Pennsylvania (3 counties). Nearly 25% of counties in the Middle Atlantic region has overall CRSI scores significantly below the national average of 2. 375 (excluding Alaska). The 10% of Middle Atlantic counties with the lowest CRSI scores equitably split among the three states with 4–6 counties in each state.
East North Central
The East North Central region of the United States is comprised of five states and is characterized an above average CRSI score (2.948) (Table 2). All states in the East North Central region are either near the national CRSI average or significantly higher than the average with Wisconsin and Michigan demonstrating the highest CRSO scores (4.145 and 3.066, respectively). Most East North Central states are characterized by average risk to meteorological events with Illinois showing elevated risks (0.335) and all states in the region showed significantly higher than average governance scores. All states, except Indiana, have average built environment scores and all states, except Wisconsin, have average, or slightly below average society scores. Indiana's built environment score (0.360) is significantly below the national average while Wisconsin's society score (0.623) is significantly above the national average. All East North Central states, except Ohio (0.352), have natural environment scores higher than the national average.
Meteorological risks in the East North Central region (Figure 4) are characterized by extreme high and low temperatures (47% of events and well-above the national average) and drought (32% of events but at the national average). The region is exposed to five other types of meteorological events—inland flooding (7%), high wind events (6%), landslides (4%), hailstorms (3%), and earthquakes (3%). These five risk exposures were at about the national average. Tornadoes and wildfire exposures (<1%) were comparable to the national average. These types of events result in lower than average loss of life and physical property (1.4% of the loss in the East North Central) although losses to agricultural and silvicultural lands, as well as natural ecosystem, comprise about 98% of losses (equally divided). Potential anthropogenic hazards existing near sites of meteorological events are dominated by general toxic release sites (e.g., industrial outflows) at 44% (slightly above the national average), Superfund sites at 42% (slightly below the national average) and nuclear facilities (11% at the national average).
The major contributors to the CRSI score in the East North Central region are natural resource conservation contributions to governance; demographic characteristics, economic diversity, socio-economics, and social cohesion to society; the number of vacant structures and general housing characteristics to the built environment; and, the extent and condition of natural ecosystems in the natural environment (Figure 5C).
Of the 437 counties in the East North Central region, the top 5% of CRSI scores (scores = 4.75 to 6.00) were seen in Wisconsin (20 counties), Michigan (3), and Illinois and Indiana (1 each). Nearly 15% of counties in the East North Central region have overall CRSI scores significantly below the national average of 2.375 (excluding Alaska). The 5% of East North Central counties with the lowest CRSI scores were largely seen in Ohio (15 counties), with Illinois (6), Indiana (3) and Michigan (1) comprising the remainder.
West North Central
The West North Central region of the United States is comprised of seven states and is characterized an above average CRSI score (2.988) (Table 2). All states in the West North Central region are either near the national CRSI average or significantly higher than the average with Minnesota and North Dakota demonstrating the highest CRSO scores (4.345 and 3.503, respectively). Most West North Central states are characterized by below average risk to meteorological events with North Dakota characterized by significantly below average risks (0.234). All states in the region showed significantly higher than average governance scores with Minnesota demonstrating the highest governance score in the nation (0.772). In fact, five of the seven West North Central states had governance scores >0.7. All states, except Missouri, have below average built environment scores and all West North Central states have slightly or significantly above average society scores. Nebraska, South Dakota and Kansas had society scores that are significantly below the national average (0.311, 0.314, and 0.332, respectively) while Minnesota's society score (0.735) is the highest in the U.S. All West North Central states, except Minnesota and Iowa, have natural environment scores significantly lower than the national average.
Meteorological risks in the West North Central region (Figure 4) are characterized by extreme high and low temperatures (41% of events and slightly above the national average) and drought (36% of events but at the national average). The region is exposed to five other types of meteorological events—hailstorms (7%), inland flooding (7%), high wind events (5%), landslides (1%), and earthquakes (1%). Of these five risk exposures, hailstorms were at about twice the national average while inland flooding and high wind events were at about the national average and landslides and earthquakes were significantly below the national average. Wildfires (0.12%) and tornadoes (0.11%) were slightly above the national average. These types of events result in about twice the national average for loss of life and physical property (9% of the loss in the West North Central) although losses to agricultural and silvicultural lands, as well as natural ecosystem, comprise about 91% of losses (49% for dual use lands and 42% for natural lands). Potential anthropogenic hazards existing near sites of meteorological events are dominated by Superfund sites (46%) being at about the national average, general toxic release sites (e.g., industrial outflows) at 41% (slightly above the national average) and nuclear facilities (10% at the national average).
The major contributors to the CRSI score in the West North Central region are natural resource conservation contributions to governance; demographic characteristics, social cohesion, health characteristics, economic diversity and socio-economics to society; the number of vacant structures and general housing characteristics to the built environment; and, the extent and condition of natural ecosystems in the natural environment (Figure 6A).
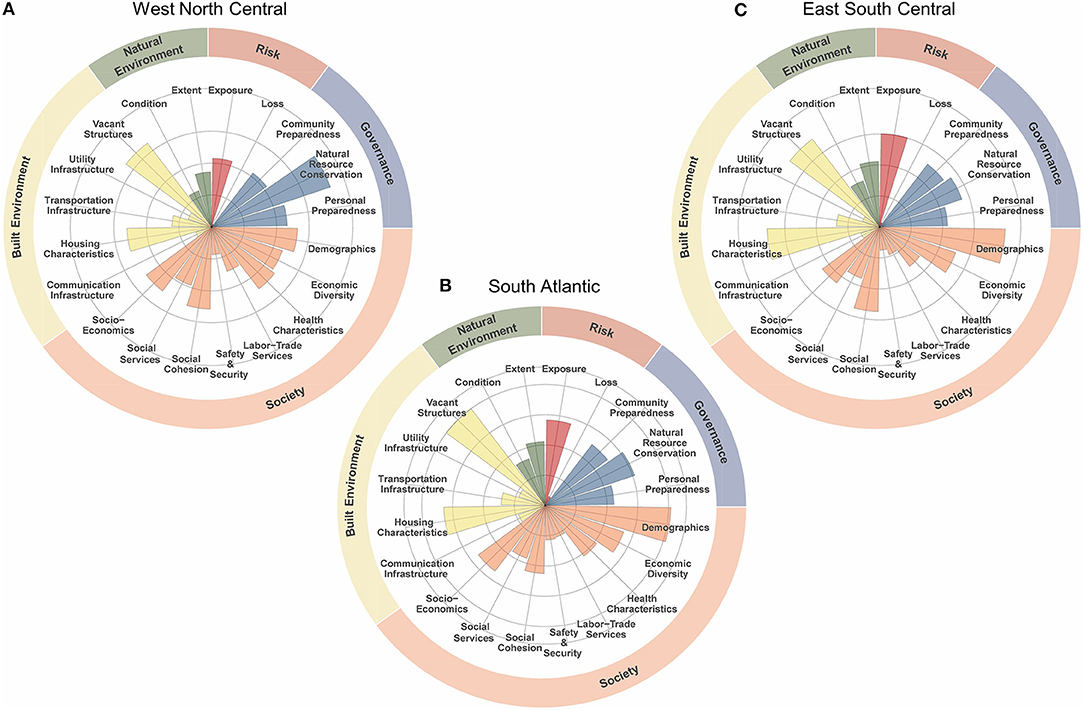
Figure 6. Polar plots of the (A) West North Central, (B) South Atlantic, and (C) East South Central regions.
Of the 618 counties in the West North Central region, the top 5% of CRSI scores (scores = 5.32 to 8.12) were seen in Minnesota (14 counties), South and North Dakota (4 each), Iowa (2) and Nebraska (1). Nearly 25% of counties in the West North Central region have overall CRSI scores significantly below the national average of 2.375 (excluding Alaska). The 5% of West North Central counties with the lowest CRSI scores were largely seen in Nebraska (15 counties), with South Dakota (6), Kansas (2), and North Dakota and Missouri (1 each) comprising the remainder.
South Atlantic
The South Atlantic region of the United States is comprised of eight states and the District of Columbia and is characterized by a significant below average CRSI score (1.321) (Table 2). All states in the South Atlantic region are significantly below the national average except for Delaware (3.179) with the District of Columbia and Georgia displaying the lowest overall CRSI scores (0.721 and 0.846, respectively). The South Atlantic region has the highest risk to acute meteorological events in the nation (0.323). All South Atlantic states, except West Virginia (0.293), are characterized by above to significantly above average risk to meteorological events with the District of Columbia and Delaware characterized by the highest risk scores (0.470 and 0.361, respectively). All states in the region showed significantly lower than average governance scores except for Maryland, Delaware and the District of Columbia (ranging between 0.610 and 0.622). Half of the eight South Atlantic states had governance scores <0.5. States in the South Atlantic region widely spanned the range of national built environment scores with four states (Delaware, Florida, Maryland, and North Carolina) and the District of Columbia being significantly above the average, one state (South Carolina) being at about the average and three states (Georgia, Virginia, and West Virginia) being significantly below the average. All South Atlantic states, except Virginia and Maryland, had society scores well-below the national average. Most South Atlantic states (Delaware, Florida, Maryland, North Carolina, and South Carolina) were either at or above the national average for their natural environment scores. The District of Columbia demonstrated the lowest natural environment score (0.200) while Georgia, Virginia and West Virginia have natural environment scores significantly below the national average.
Meteorological risks in the South Atlantic region (Figure 4) are characterized by extreme high and low temperatures (35% of events and slightly below the national average) and drought (35% of events but at the national average). The region is exposed to six other types of meteorological events – landslides (10%), inland flooding (7%), high wing events (6%), hurricanes (3%), hailstorms (3%), and coastal flooding (1%). Of these six risk exposures, landslides were about 50% above the national average while coastal and inland flooding as well as high wind events were at about the national average. Hurricanes were three times more prevalent than the national average while hailstorms were at about half the national average. Earthquakes (0.70%) were about 30% of the national average while wildfires (0.18%) were twice the national average. These types of events result in minimal loss of life and physical property (1% of the loss in the South Atlantic) although losses to agricultural and silvicultural lands, as well as natural ecosystem, comprise about 99% of losses (equitably distributed). Potential anthropogenic hazards existing near sites of meteorological events are dominated by general toxic release sites (e.g., industrial outflows) at 48% (significantly above the national average) Superfund sites (36%) being significantly below the national average, and nuclear facilities (10% at the national average).
The major contributors to the CRSI score in the South Atlantic region are natural resource conservation and community preparedness contributions to governance; demographic characteristics, economic diversity, socio-economics, social cohesion, and health characteristics to society; the number of vacant structures and general housing characteristics to the built environment; and, the extent and condition of natural ecosystems in the natural environment (Figure 6B).
Of the 588 counties in the South Atlantic region, the top 5% of CRSI scores (scores = 3.10 to 4.8) were seen in Virginia (10 counties), Maryland (9), West Virginia (2) and Florida, Delaware, and North Carolina (1 each). Over 50% of counties in the South Atlantic region have overall CRSI scores significantly below the national average of 2.375. The 5% of South Atlantic counties with the lowest CRSI scores were largely seen in Virginia (16 counties), Georgia (8) and West Virginia (1).
East South Central
The East South Central region of the United States is comprised of four states and is characterized by the lowest overall CRSI score (0.787) (Table 2). All states in the East South Central region are significantly below the national average with only Mississippi showing an overall CRSI score >1.0 (1.151). The East South Central region has the second highest risk to acute meteorological events in the nation (0.318) and the lowest national governance domain score (0.446) with half the states (Alabama and Tennessee) having scores <0.4. States in the East South Central region has the lowest built environment score in the nation (0.315) with three of its states (Kentucky, Mississippi, and Tennessee) with significantly lower than the national average built environment scores. The East South Central region has the lowest society score in the nation (0.392) with all four states significantly below the national average. Most East South Central states (Alabama, Kentucky and Tennessee) were below the national average for their natural environment scores.
Meteorological risks in the East South Central region (Figure 4) are characterized by extreme high and low temperatures (37% of events and slightly below the national average) and drought (33% of events but at the national average). The region is exposed to seven other types of meteorological events—landslides (8%), inland flooding (7%), high wing events (6%), earthquakes (5%), hailstorms (2%), hurricanes (2%), and tornadoes (0.3%). Of these seven risk exposures, landslides, and high wind events were slightly above the national average while inland flooding events were at about the national average. Hurricanes were three times more prevalent than the national average while hailstorms were at about half the national average. Earthquakes (0.70%) and hailstorms (2%) were about 50% above and 50% below the national averages, respectively. Hurricanes were twice as prevalent in the East South Central region and wildfires were about three times more prevalent. These types of events resulted in about a 50% higher prevalence of loss of life and physical property (6% of the loss in the South Atlantic) than that seen for the nation, while losses to agricultural and silvicultural lands, as well as natural ecosystems, comprise about 94% of losses (equitably distributed). Potential anthropogenic hazards existing near sites of meteorological events are dominated by general toxic release sites (e.g., industrial outflows) at 47% (significantly above the national average), Superfund sites (32%) being significantly below the national average, and nuclear facilities (18% at roughly twice the national average).
The major contributors to the CRSI score in the East South Central region are natural resource conservation, community preparedness, and personal preparedness contributions to governance; demographic characteristics, social cohesion, economic diversity and socio-economics to society; general housing characteristics and the number of vacant structures to the built environment; and, the extent and condition of natural ecosystems in the natural environment (Figure 6C).
Of the 364 counties in the East South Central region, all but two counties were significantly below the national average. The only two counties with overall CRSI scores equal to the national average are in Kentucky and Mississippi. Nearly 10% of the counties in this region have negative CRSI scores with the lowest scores being in Kentucky (21 counties), and Tennessee and Mississippi (2 each). Ninety-nine percent of counties in the East South Central region have overall CRSI scores significantly below the national average of 2.375.
West South Central
The West South Central region of the United States is comprised of four states and is characterized by an overall CRSI score (1.895) that is significantly below the national average (Table 2). Seventy-five percent of the states in the West South Central region (Arkansas, Louisiana, and Texas) are significantly below the national average with only Oklahoma showing an overall CRSI score >2.0 (2.436). The risk of acute meteorological events in the West South Central region is about average (0.306) and the regional governance score is also about at the national average. The West South Central region has an average built environment score in the nation (0.388) with only Texas being significantly below the national average. The West South Central region has a below average society score (0.497) with only one state (Oklahoma) being slightly above the national average. All West South Central states were about at the national average for their natural environment scores.
Meteorological risks in the West South Central region (Figure 4) are characterized by extreme high and low temperatures (37% of events and slightly below the national average) and drought (33% of events but at the national average). The region is exposed to eight other types of meteorological events – inland flooding (7%), high wind events (5%), hailstorms (4%), hurricanes (4%), landslides (2%), earthquakes (2%), coastal flooding (1%), and wildfire exposure (0.2%). Of these eight risk exposures, inland flooding, high wind events and hailstorms occurred at about the national average while hurricanes occurred at about four times the national average, wildfires occurred at twice the national average and coastal flooding happened at about 25% above the national average. Earthquakes (2%) and landslides (2%) were about 50% below the national averages. These types of events resulted in about a 50% higher prevalence of loss of life and physical property (6% of the loss in the West South Central) than that seen for the nation, while losses to agricultural and silvicultural lands, as well as natural ecosystems, comprised about 94% of losses (with most of these losses observed in dual benefit lands, 54% and the reminder in natural lands, 40%). Potential anthropogenic hazards existing near sites of meteorological events are dominated by Superfund sites (47%, about the national average), general toxic release sites (e.g., industrial outflows) at 33% (about the national average) and nuclear facilities (17%, at roughly twice the national average).
The major contributors to the CRSI score in the West South Central region are natural resource conservation contributions to governance; demographic characteristics, social cohesion and socio-economics to society; general housing characteristics and the number of vacant structures to the built environment; and, the extent and condition of natural ecosystems in the natural environment (Figure 7A).
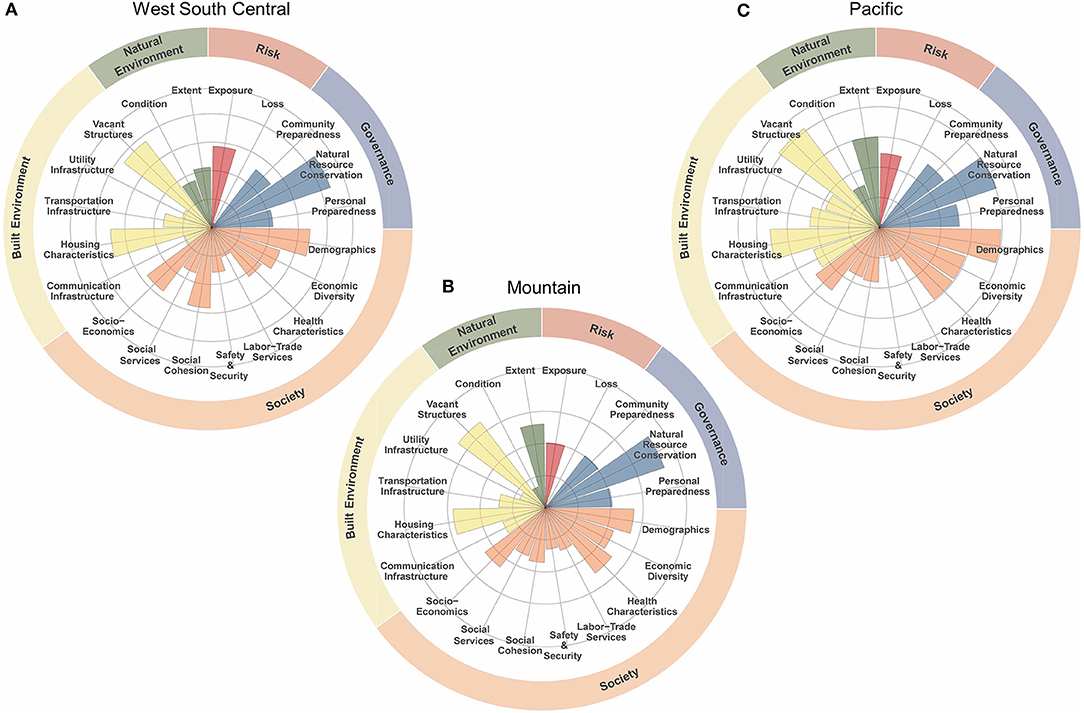
Figure 7. Polar plots of the (A) West South Central, (B) Mountain, and (C) Pacific regions.
Of the 470 counties in the West South Central region, the top 5% of CRSI scores (scores = 3.41–5.72) were seen in Texas (15 counties), Oklahoma (7), Arkansas (2), and Louisiana (1). Nearly 50% of counties in the West South Central region have overall CRSI scores significantly below the national average of 2.375. The 5% of West South Central counties with the lowest CRSI scores were seen almost completely in Texas (24 counties) with one county in Oklahoma.
Mountain
The Mountain region of the United States is comprised of eight states and is characterized by the overall CRSI score (3.898) that is among the highest in the nation (Table 2). All the states in the Mountain region are significantly above the national average with three states (Idaho, Montana and Wyoming) with overall CRSI scores >4.0. The risk of acute meteorological events in the Mountain region is less than average (0.261) and the regional governance score is significantly greater than the national average. The Mountain region has a significantly above average built environment score (0.456) with Arizona having the highest score in the U.S. (0.710) and only Montana being slightly below the national average. The Mountain region has a significantly above average society score (0.567) with only one state (Arizona) being significantly below the national average. All Mountain states were at or significantly above the national average for their natural environment scores.
Meteorological risks in the Mountain region (Figure 4) are characterized by drought (38%) that is significantly higher than the national average and extreme high and low temperatures (32% of events and significantly below the national average). The region is exposed to seven other types of meteorological events—landslides (8%), earthquakes (8%), inland flooding (6%), hailstorms (3%), high wind events (3%), wildfires (1%), and tornadoes (0.1%). Of these seven risk exposures, wildfires exposure is about ten times the national average and earthquake exposure is about 2.5 times the national average. Landslide occurrences are at about 30% above the national average and high wind events are about 50% below the national average. Exposures to inland flooding, hailstorms and tornadoes occur at about the national average. These types of events resulted in about a 300% higher prevalence of loss of life and physical property (14% of the loss in the Mountain) than that seen for the nation, while losses to agricultural and silvicultural lands, as well as natural ecosystems, comprised about 86% of losses (equitably distributed between dual benefit and natural lands). Potential anthropogenic hazards existing near sites of meteorological events are dominated by Superfund sites (47%, about the national average), general toxic release sites (e.g., industrial outflows) at 27% (somewhat less than the national average) and nuclear facilities (25%, at roughly 2.5 times the national average).
The major contributors to the CRSI score in the Mountain region are natural resource conservation contributions to governance; health characteristics, demographic characteristics and socio-economics to society; the number of vacant structures and general housing characteristics to the built environment; and, the extent of natural ecosystems in the natural environment (Figure 7B).
Of the 281 counties in the Mountain region, the top 10% of CRSI scores (scores = 6.59–14.60) were seen in Montana (9 counties), Idaho (9), Colorado (2), New Mexico (2), Wyoming (2), and Utah (1). Three counties in this region have overall CRSI scores that are >10.0. Nearly 20% of counties in the Mountain region have overall CRSI scores significantly below the national average of 2.375. The 10% of Mountain counties with the lowest CRSI scores were seen in Colorado (9), Montana (8), New Mexico (3), Idaho (3) and Wyoming (1).
Pacific
The Pacific region of the United States is comprised of five states and is characterized by the overall CRSI score (10.034 with Alaska and 3.576 without Alaska) that is among the highest in the nation (Table 2). All the states in the Pacific region are significantly above the national average with three states (Alaska, Hawaii, and Washington) with overall CRSI scores >4.0. The risk of acute meteorological events in the Pacific region is less than average (0.256) with Alaska having a risk score of <0.1. Almost half of the boroughs in Alaska have insufficient data to complete CRSO scoring but including the counties with adequate data shows very low risk (0.058) and very high governance (0.736). CRSI does not include chronic, long-term climate changes like sea-level rise and Alaskan topography minimizes coastal flooding and high winds events. The regional governance score including Alaska (0.602) is significantly greater than the national average but excluding Alaska reduces the score to 0.580 which is slightly lower than the national average. The Pacific region has a significantly above average built environment score (0.556 with Alaska and 0.568 without Alaska) with California having among highest scores in the U.S. (0.641) and no states being at or below the national average. The Pacific region has a slightly below average society score (0.478 with or without Alaska) with only one state (Hawaii) being significantly below the national average. All Pacific states were significantly above the national average for their natural environment scores with Alaska having the highest score in the nation (0.627) and Oregon having a score of 0.517.
Meteorological risks in the Pacific region (Figure 4) are characterized by drought (31%) that is about at the national average, earthquakes (22%) that are seven times the national average and extreme high and low temperatures (28% of events and significantly below the national average). The region is exposed to three other types of meteorological events—landslides (9%), inland flooding (7%), hailstorms (3%), and wildfires (1%). Of these three risk exposures, wildfires exposure is about twelve times the national average and landslide exposure is about 50% above the national average. Exposures to inland flooding occur at about the national average. These types of events resulted in about a five times higher prevalence of loss of life and physical property (21% of the loss in the Pacific) than that seen for the nation, while losses to agricultural and silvicultural lands, as well as natural ecosystems, comprised about 78% of losses (equitably distributed between dual benefit and natural lands). Potential anthropogenic hazards existing near sites of meteorological events are dominated by Superfund sites (47%, about the national average), general toxic release sites (e.g., industrial outflows) at 32% (somewhat less than the national average), RCRA exposure at 11% (about twice the national average) and nuclear facilities at 11% (at the national average).
The major contributors to the CRSI score in the Pacific region are natural resource conservation contributions to governance; demographic characteristics, health characteristics and economic diversity to society; the number of vacant structures and general housing characteristics to the built environment; and, the extent of natural ecosystems in the natural environment (Figure 7C).
Of the 160 counties in the Pacific region, the top 10% of CRSI scores (scores = 8.89 to 148.07) were seen in Alaska (20 boroughs), Hawaii (4 counties) and Washington (1). Twenty-one boroughs/counties in this region have overall CRSI scores that are >10.0. Nearly 25% of counties in the region have overall CRSI scores significantly below the national average of 2.375. The 10% of counties with the lowest CRSI scores were seen in California (16), Oregon (6), Washington (2) and Hawaii (1).
Discussion
The results for the regionalization of CRSI can be used for capacity building regardless of CRSI score. The domain and indicator scores, as well as the polar plots, can be used to identify areas where improvements can be made to enhance overall resilience. The only domain in CRSI that cannot be improved per se is the risk domain. This domain is driven by historical observations relating to the tracked meteorological events. If CRSI included long-term climate events, then perhaps human activities could be developed to minimize long-term change which could impact the risk domain of CRSI (Rahmstorf, 2007; Nichols and Cazenave, 2010; Sweet et al., 2017). The remaining CRSI domains—governance, society, built environment, and natural environment—are driven by indicators and metrics that can be modified to improve resilience to acute climate events.
In the New England region, general CRSI scores are high (>3.8) and well-above the national average. However, one state in this region has an overall CRSI score below the regional average—Rhode Island with a CRSI score of 2.653. Rhode Island has suffered from multiple coastal and inland flooding events, winter storms, Superstorm Sandy, and Tropical Storm Irene in the last decade. An evaluation of the New England region, using the polar plot of indicator contribution to domains, show that increases in community preparedness and personal preparedness would enhance regional governance. Enhancements of labor-trade services, safety and security and social cohesion would enhance the society modifier. Improvements in infrastructure would enhance the built environment modifier and increases in natural ecosystem extents and condition would alter the natural environment modifier. Our review of the domain scores for Rhode Island suggest the area for greatest improvement could be in the domain representing the built environment where the Rhode Island score (0.320) is significantly below the national average and hence reducing the state's CRSI score.
Recently, Rhode Island drafted a new statewide climate resilience action strategy (RI-STAB, 2018). The results of the Rhode Island CRSI data were provided to a member the Rhode Island Science and Technical Advisory Board. These results targeted a lower overall CRSI score likely driven by lower built environment scores characterized by critical infrastructure and utilities and building characteristics and average governance scores (lower than most of New England) representing potential issues with emergency preparedness as well as emergency shelters and services. Like the CRSI approach, the Rhode Island Strategy defines climate resilience as “the capacity of individuals, institutions, businesses and natural systems within Rhode Island to survive, adapt, and grow regardless of chronic stresses and weather events they experience” (RI-STAB, 2018, p. 3). Also, like the CRSI results, Rhode Island recognizes that it primary acute meteorological risk events are extreme cold and heat, droughts, and extreme rainfall and flooding. The new strategy addresses built environment issues to reduce vulnerability and improve infrastructure for drinking water and wastewater systems; dam and storm-water systems; power grid and fuel supply issues; and transportation. Realizing the importance of natural systems for community resilience, Rhode Island (already with the highest natural environment domain scores in New England) is planning to increase its efforts to protect and conserve its coastal and inland natural systems. Rhode Island is already experiencing the effects of coastal flooding on buildings, infrastructure, evacuation shelters, and emergency services. The new strategy plan targets enhancements to address these issues. Realization of the actions and activities planned in the new Rhode Island strategy should increase its overall CRSI score to levels similar to other New England states.
The Middle Atlantic state with the lowest overall CRSI score (New Jersey-−2.28) is characterized by the highest risk factors to acute weather events (0.379) which is 20–40% higher than the other states in the region. These events include coastal and inland flooding, Superstorm Sandy, and a variety of high temperature and low temperature events. Because it cannot impact its risk to these events, New Jersey can do little to increase its overall CRSI score other than improve its already above-average governance and built environment scores and average society and natural environment scores. New Jersey Governor's Office of Recovery Rebuilding (2018) is actively developing plans to modify risks by developing governance associated with flood rebuilding standards, and the state's Department of Community Affairs ((NJDCA), 2018) has provided grants post-Sandy to enable development of strategic recovery plans and practices to facilitate smart and efficient rebuilding processes at the local level. Similarly, New Jersey's Office of Emergency Management (NJOEM, 2018) is identifying resiliency opportunities to modify the locations and characteristics of critical infrastructures including drinking water, wastewater, transportation, transit, energy, and communication systems. These infrastructure issues were observed as potential areas of improvement for the Middle Atlantic Region through CRSI analyses.
However, the greatest potential area of improvement for the overall New Jersey CRSI score would be enhancement of ecosystem type extent, and condition. For example, only 31 miles of New Jersey's 130 miles of shoreline are undeveloped (Headland, 2017; Stockton and Hafner, 2018). While some Post-Sandy activities in New Jersey seem to be addressing these resilience enhancements (NJOCM, 2010), few major efforts seem to be occurring in this area. Small efforts like dune reconstruction and vegetation planting are being undertaken, but no larger efforts directed at natural shoreline stabilization, wetland protection, and ecosystem condition improvements are included.
In the South Atlantic region, both Georgia and the District of Columbia displayed overall CRSI scores of less than one. The District of Columbia is characterized by high risk (0.470, nearly 50% above the US average) and is prone to frequent inland and coastal flooding (flash flooding, river flooding, tropical systems, dam breaks, and heavy snow melts). The District of Columbia showed a very low Natural Environment domain score (0.200) compared to the national average of 0.413. Enhancing the natural environment might be difficult for the District as it is surrounded on multiple sides by the Potomac and Anacostia Rivers and is characterized by extensive areas of impervious surface. Minimizing impervious surfaces and maximizing the conservation and re-development of riparian corridors, wetlands, and greenspaces are likely the areas where improvements would be anticipated to enhance the District's CRSI score. Similar improvements in infrastructure (e.g., transportation and water systems) would enhance the District's already above average built environment domain score.
On the other hand, Georgia (CRSI score of 0.846) has an average risk score but below average domain scores for governance, built environment, society and natural environment. Improvement in any of these domains would increase Georgia's CRSI score. Georgia's risks can be easily characterized by inland flooding, high wind events, hailstorms and tornadoes ((NWS), 2018). Governance improvements in the South Atlantic region could focus more on holistic and catchment-oriented flood risk management rather than the emphasis on structure measures and construction which have dominated the past. Similar efforts in Germany have shown some success in reducing the adverse consequences of flooding for human health, the environment, cultural heritage and economic activity (Heintz et al., 2012). Georgia has a few large urban centers with diverse work forces where flooding occurs regularly. However, much of Georgia is comprised of small communities and counties where labor and trade services are not diverse and rebuilding after a meteorological event (e.g., tornado, flood) can be very difficult without construction labor pools. Creating enticements to develop these labor pools even if shared by several proximal counties would increase the CRSI scores of these counties. Finally, improvements in housing characteristics through upgrading building codes and reducing the number of vacant structures should increase a presently very low building environment domain score for Georgia (0.282). Homes and businesses throughout Georgia and the South Atlantic region would benefit from enhanced building codes and standard resulting in increased resilience (FEMA, 2017a). Georgia's neighboring state, Florida, has demonstrated how to enhance its building code to create greater resilience to storm events (PDH Academy, 2017). Florida building codes change in response to new technology and knowledge about weather events. Codes affecting the built environment should be modified or updated in response to changes in technology and procedures, growing and maturing with the times. With the increased storm activity of 2017, recently updated building codes guided by storms of the past were put to the test and demonstrated Florida community's enhanced resilience. These codes utilized more information about code strengths and weaknesses, building practices, and new building materials that helped homes and commercial properties withstand weather events.
California demonstrates an above average risk domain (0.322) dominated by drought and temperature extremes. The increased incidence of wildfires (10 times the national average), earthquakes (7 times the national average) and landslides (50% above the national average) contribute to a major portion of human life and dollar losses resulting from acute meteorological events. According to CRSI domain scores, California has the lowest governance domain score in the Pacific region (0.498); this is significantly below the national average and 50–75% below the remaining states in the region. While having among the highest built environment scores in the nation, California has increased building code requirements to withstand at least minimal to moderate earthquake impacts. California's seismic construction requirements are designed to protect the lives of those inside. But even with the most modern codes, building to the state's minimum requirements still leave some new buildings severely damaged in a major earthquake to the point of being a complete loss. Further enhancing these types of building codes would increase the state's CRSI scores but governance enhancement designed to increase personal and community preparedness would likely modify the governance score for California positively.
Wildfires, another type of event of increasing frequency and magnitude, in 2017 were the most destructive fires on record. A total of 9.133 fires burned over 1.3 million acres including 5 of the 20 most devastating wildland-urban interface fires in California history (CDFFP, 2018). Enhanced personal and community preparedness for wildfires would likely modify the governance score for California significantly. For example, the Tubbs fire in Napa and Sonoma counties, which ignited on October 8, 2017, killed 22 people, damaged 5,643 structures, and burned 36,807 acres, making it the single most destructive fire in California history. Interviews with personnel of the California Department of Forestry and Fire Protection demonstrated that little could be done to contain the fire but the lack of personal preparedness was demonstrated by the number of vehicles still parked in their driveways after calls for mandatory evacuations (Irfan, 2017). Fires are becoming more damaging because Californians keep building in harm's way much the same way homebuilders in flood plains rebuild homes after flood destruction. Deliberate decisions and unintended consequences of urban development over decades have turned many parts of California into tinderboxes (Irfan, 2017). This is also reflected in the Environmental Domain score for California (0.461), which is the lowest in the Pacific region, where natural habitats that might have reduced human life and property losses have become part of or consumed by suburban and urban sprawl (Irfan, 2017).
As evidenced by the data and examples above, direct enhancement in governance, environment, and even building codes and reduction of vacant structures would increase the resilience score for states like California. Georgia, New Jersey, Rhode Island, and the District of Columbia. Using CRSI scores and interpreting the deconstruction of those scores, can be critical elements to consider in resilience capacity building in these states and the District of Columbia. Using the Climate Recovery Screening Index to inform capacity building can enrich the dialogue and contribute to decision making that results in stronger community resilience to acute climate events.
Author Contributions
All authors listed have made a substantial, direct and intellectual contribution to the work, and approved it for publication.
Disclaimer
The views expressed in this manuscript are those of the authors and do not necessarily represent the views or policies of the U.S. Environmental Protection Agency. Any mention of trade names, products, or services does not imply an endorsement by the U.S. Government or the U.S. Environmental Protection Agency. The EPA does not endorse any commercial products, services, or enterprises.
Conflict of Interest Statement
The authors declare that the research was conducted in the absence of any commercial or financial relationships that could be construed as a potential conflict of interest.
References
Adger, W. N. (2000). Social and ecological resilience: are they related? Prog. Hum. Geogr. 24, 347–364. doi: 10.1191/030913200701540465
Berkes, F., Colding, J., and Folke, C. (eds.). (2003). Navigating Social-Ecological Systems: Building Resilience for Complexity and Change. Cambridge: Cambridge University Press.
Bruneau, M., Chang, S., Eguchi, R., Lee, G., O'Rourke, T., Reinhorn, A., et al. (2003). A framework to quantitatively assess and enhance seismic resilience of communities. Earthquake Spectra 19, 733–752. doi: 10.1193/1.1623497
CDFFP (California Department of Forestry and Fire Protection) (2018). Incident Information. Available online at: http://cdfdata.fire.ca.gov/incidents/incidents_stats?year=2017
Chandra, R. K., Papadopoulos, G. A., and Karanci, A. N. (2007). Disasters due to natural hazards. Nat. Hazards 40, 501–502. doi: 10.1007/s11069-006-9010-4
Dovers, S. R., and Handmer, J. W. (1992). Uncertainty, sustainability and change. Global Environ. Change 2, 262–276.
FDEM (Florida Department of Emergency Management) (2018). Florida's Severe Weather Awareness Guide. Available online at: https://www.floridadisaster.org/globalassets/library/2018-guidefinal.pdf
FDH (Florida Department of Health) (2016). Florida Emergency Preparedness Guide. Available online at: http://www.floridahealth.gov/programs-and-services/emergency-preparedness-and-response/_documents/preparedness-guide-large-print.pdf
FEMA (Federal Emergency Management Agency) (2012). Crisis Response and Disaster Resilience 2030: Forging Strategic Action in an Age of Uncertainty. Available online at: https://www.fema.gov/media-library-data/20130726-1816-25045-5167/sfi_report_13.jan.2012_final.docx.pdf
FEMA (Federal Emergency Management Agency) (2017a). Draft Interagency Concept for Community Resilience Indicators and National-Level Measures. Available online at: https://www.fema.gov/community-resilience-indicators
FEMA (Federal Emergency Management Agency) (2017b). Building Science Branch Brochure – Wind Hazards. Available online at: https://www.fema.gov/media-library-data/1496953980230-d52857ef8919276187b3c57d7c851239/Wind_508.pdf
Folke, C. (2006). Resilience: the emergence of a perspective for social-ecological systems analyses. Glob. Environ. Change 16, 253–267. doi: 10.1016/j.gloenvcha.2006.04.002
Headland, J. R. (2017). “Quantifying resilience: coastal structure and nourished beaches,” in Coastal Structures and Solutions to Coastal Disasters Joint Conference, 2015. Available online at: https://ascelibrary.org/doi/pdf/10.1061/9780784480304.062
Heintz, M. D., Hagemeier-Klose, M., and Wagner, K. (2012). Towards a risk governance culture in flood policy – findings from the implementation of the “floods directive” in Germany. Water 4, 135–156. doi: 10.3390/w4010135
Holling, C. S. (1973). Resilience and stability of ecological systems. Annu Rev. Ecol. Syst. 4, 1–23.
Irfan, U. (2017). California's Wildfires Are Not “Natural” – Humans Made Them Worse at Every Step. Vox. Available online at: https://www.vox.com/energy-and-environment/2017/10/12/16458242/risk-wildfires-worse-climate-change-california-san-francisco-los-angeles (Accessed December 8, 2017).
Melillo, J. M., Richmond, T., and Yohe, G. W. (2014). Climate Change Impacts in the 11 United States: The Third National Climate Assessment. U.S. Global Change Research Program, 12. Available online at: http://nca2014.globalchange.gov/report
New Jersey Governor's Office of Recovery and Rebuilding (2018). Planning for Resiliency. Available online at: http://nj.gov/gorr/resiliency/
Nichols, R. J., and Cazenave, A. (2010). Sea-level rise and its impact on coastal zones. Science 328, 1517–1520. doi: 10.1126/science.1185782
NJDCA (New Jersey Department of Community Affairs) (2018). Planning for Resiliency. Available online at: http://nj.gov/gorr/resiliency/
NJOCM (New Jersey Office of Coastal Management. New Jersey Department of Environmental Protection) (2010). Getting to Resilience: A Coastal Community Resilience Evaluation Tool. Available online at: http://www.state.nj.us/dep/cmp/docs/gtr-resilience.pdf
NJOEM (New Jersey Office of Emergency Management) (2018). Planning for Resiliency. Available online at: http://nj.gov/gorr/resiliency/
NRC (National Research Council). (2012). Disaster Resilience: A National Imperative. Washington, DC: The National Academies Press.
NWS (National Weather Service) (2018) Severe Storm Climatology for North and Central Georgia. Available online at: https://www.weather.gov/ffc/svrclimo
PDH Academy (2017). How Severe Weather Affects the Future of Building Codes. Available online at: https://pdhacademy.com/2017/12/21/severe-weather-affects-future-building-codes/
Rahmstorf, S. (2007). A semi-empirical approach to projecting future sea-level rise. Science 315, 368–370. doi: 10.1126/science.1135456
RI-STAB (Rhode Island Science and Technical Advisory Board) (2018). “Resilient Rhody” – Statewide Climate Resilience Action Plan, Draft. Providence, Rhode Island. Available online at: http://climatechange.ri.gov/documents/rev-resstrategy.pdf
Rose, A. (2004). Defining and measuring economic resilience to disasters. Disaster Prevent Manage. 13, 307–314. doi: 10.1108/09653560410556528
Stockton, R., and Hafner, S. (2018). Beach Stabilization: Structure and Beach Nourishment Alternatives. Available online at: https://intraweb.stockton.edu/eyos/coastal/25yrConference/Beach-Stabilization.pdf
Summers, J. K., Harwell, L. C., Buck, K. D., Smith, L. M., Vivian, D. N., Bousquin, J. J., et al. (2017a). Resilience Screening Index (CRSI): An Assessment of Resilience to Acute Meteorological Events and Selected Natural Hazards. Washington, DC: Protection Agency. EPA600/R-17/238.
Summers, J. K., Harwell, L. C., Smith, L. M., and Buck, K. D. (2018). Climate Resilience Screening Index (CRSI): Development and Application to the U.S. Submitted to GeoHealth. Minneapolis, MN: Community Indicator Consortium.
Summers, J. K., Smith, L. M., Harwell, L. C., and Buck, K. D. (2017b). Conceptualizing holistic community resilience to climate events: foundation for a climate resilience screening index. GeoHealth 1, 151–164. doi: 10.1002/2016GH000047
Sweet, W. V., Kopp, R. E., Weaver, C. P., Obeysekera, J., Horton, R. M., Thieler, E. R., et al. (2017). Global and Regional Sea Level Rise Scenarios for the United States. NOAA Technical Report, NOS CO-OPS 083. Available online at: https://ntrs.nasa.gov/archive/nasa/casi.ntrs.nasa.gov/20180001857.pdf
U.S. Department of Commerce, Economics Statistics Administration U.S. Census Bureau. (2018). Census Regions and Divisions of the United States. Available online at: https://www2.census.gov/geo/pdfs/maps-data/maps/reference/us_regdiv.pdf
UN/ISDR (United Nations International Strategy for Disaster Reduction). (2002). Living With Risk: A Global Review of Disaster Reduction Initiatives. Prepared as an Interagency Effort Coordinated by the ISDR Secretariat. Geneva. Available online at: http://www.adrc.asia/publications/LWR/LWR_pdf/index.pdf
Keywords: climate events, resilience, vulnerability, recoverability, natural hazards
Citation: Summers K, Harwell L, Smith LM and Buck KD (2018) Regionalizing Resilience to Acute Meteorological Events: Comparison of Regions in the U.S. Front. Environ. Sci. 6:147. doi: 10.3389/fenvs.2018.00147
Received: 16 August 2018; Accepted: 08 November 2018;
Published: 30 November 2018.
Edited by:
Yang Liu, Emory University, United StatesReviewed by:
Sofia Kottou, National and Kapodistrian University of Athens, GreeceGulnihal Ozbay, Delaware State University, United States
Copyright © 2018 Summers, Harwell, Smith and Buck. This is an open-access article distributed under the terms of the Creative Commons Attribution License (CC BY). The use, distribution or reproduction in other forums is permitted, provided the original author(s) and the copyright owner(s) are credited and that the original publication in this journal is cited, in accordance with accepted academic practice. No use, distribution or reproduction is permitted which does not comply with these terms.
*Correspondence: Kevin Summers, summers.kevin@epa.gov