Arsenic in Groundwater in South West Ireland: Occurrence, Controls, and Hydrochemistry
 Ellen McGrory1
  Emma Holian2 Alberto Alvarez-Iglesias3 Norma Bargary4
  Eoin J. McGillicuddy5 Tiernan Henry1 Eve Daly1
  Liam Morrison1*
- 1Earth and Ocean Sciences, School of Natural Sciences and Ryan Institute: Environmental, Marine and Energy Research, National University of Ireland, Galway, Ireland
- 2School of Mathematics, Statistics and Applied Mathematics, National University of Ireland, Galway, Ireland
- 3HRB Clinical Research Facility, National University of Ireland, Galway, Ireland
- 4Department of Mathematics and Statistics, University of Limerick, Limerick, Ireland
- 5School of Chemical and Pharmaceutical Sciences, Dublin Institute of Technology, Dublin, Ireland
Globally numerous regions have been identified with elevated arsenic within groundwater which can result in potential adverse health risks. In Ireland, a previous national-scale research assessment of groundwater identified isolated clusters of elevated arsenic and indicated that lithology was a major controlling factor on arsenic in groundwater. Complementary comparisons of national-scale and regional-scale groundwater assessments of arsenic are lacking in Europe when compared to other global regions. The aims of this study were to demonstrate the value of a regional-scale groundwater hydrochemistry dataset with an existing national-scale approach, describe anomalies that can become the focus of attention for public health and economic reasons, and to provide a wider context for arsenic in groundwater within Ireland and Europe. Regional-scale data using 470 locations comprising 1,493 analyses using several hydrochemical parameters (arsenic, pH, conductivity, iron, manganese, sodium, potassium, calcium, magnesium, and total hardness) in south west Ireland were integrated with geological, hydrogeological, and land use datasets. Statistical analysis was performed using a combination of methods including score tests of geological groups using an empirical cumulative distribution function plot in addition to spatial analysis. Results revealed that hydrochemical parameters exhibited different spatial clusters, which was generally associated with lithology. Arsenic was elevated in sandstone derived bedrock. Weak correlation of arsenic with other hydrochemical parameters were observed and redox-sensitive elements like manganese and iron showed a greater diversity in spatial occurrence. This study has shown that the variation of hydrochemical parameters are controlled by regional geology. Finally, the paper focuses on anomalies identified by concentrations of individual ions or statistical associations in the context of, for example, historical mineral exploration and mining in the area and also discusses whether groundwater chemistry sampling on this scale can assist in future mineral exploration, as well as guiding the future development of high quality public and private water supplies.
Introduction
Arsenic contamination of groundwater via geogenic processes occurs in various locations globally with the most affected area being documented within the Quaternary deltas of south east Asia (Smedley and Kinniburgh, 2013). The health effects of arsenic exposure are well known and include skin, lung, and bladder cancer (Kapaj et al., 2006; Baris et al., 2016).
National-scale studies in the United States (US) by the US Geological Survey (USGS; Focazio et al., 2000; Ryker, 2001, 2003; Welch et al., 2001; Lee and Helsel, 2005; Gronberg, 2011) and others (Lockwood et al., 2004; Frederick et al., 2016) have led to the generation of spatial distribution maps of arsenic in groundwater. To fill the voids as a result of a national-scale assessment approach, regional groundwater studies (especially for areas with insufficient data, e.g., Mid-Atlantic states), have been used to demonstrate arsenic contamination on greater spatial scales (Sanders et al., 2012). These regional studies incorporated in part or full, secondary data (or historical, and/or ancillary data) including from areas of New England (Ayotte et al., 2003, 2006, 2015; Ayotte, 2017), New Hampshire (Ayotte et al., 2016; Andy et al., 2017), Maine (Yang et al., 2009, 2012), Minnesota (Erickson and Barnes, 2005, 2006), Michigan (Meliker et al., 2008), North Carolina (Kim et al., 2011; Sanders et al., 2012), California (Ayotte et al., 2016), Texas (Gong et al., 2014), New Mexico (Hoover et al., 2017), and Pennsylvania (Peters and Burkert, 2008; Gross and Low, 2013). Similar studies have been conducted in Canadian provinces including Nova Scotia (Drummer et al., 2015; Kennedy and Drage, 2017), Saskatchewan (McLeod et al., 2017), and New Brunswick (Klassen et al., 2009). In Asia various prediction based models have been used in numerous regions (Rodríguez-Lado et al., 2008, 2013; Winkel et al., 2008).
Conversely in Europe there have been two (Greece and Ireland) previous national-scale arsenic groundwater assessments (Dokou et al., 2015; McGrory et al., 2017) with no regional-scale assessments having occurred. Greater numbers of national-scale assessments would assist in providing information on the patterns and distribution of arsenic in groundwater resources. This is a key consideration as the distribution of arsenic in groundwater in Europe, with no characteristic pattern occurring, when compared with Asia and South America (Ravenscroft et al., 2009). In most European countries naturally occurring arsenic is generally lower than the World Health Organization (WHO) standard of 10 μg L−1 (Van Halem et al., 2009).
Regional-scale assessments can complement national-scale studies through assisting in the understanding of the potential controls of arsenic by determining the distribution at a greater scale. The presence of these regional datasets of arsenic within Europe is expected to be high due to the greater intensity of routine monitoring practices. These types of datasets have been previously harnessed [e.g., in Ireland (McGrory et al., 2017), Greece (Dokou et al., 2015), and for manganese in Scotland (Homoncik et al., 2010)] for improved groundwater management. While the use of geostatistical modeling can be used with success for generating prediction maps, these techniques suffer from limitations including data availability, data quality, and local scale arsenic mobilization variations due to complex groundwater flow paths (Ayotte et al., 2011; Bretzler et al., 2017a). As outlined by Frederick et al. (2016), generally when exploring potential relationships between elevated arsenic and various explanatory variables two primary modeling strategies can be used: logistic regression (e.g., Ayotte et al., 2003; Winkel et al., 2008; Gross and Low, 2013; Bretzler et al., 2017b), or decision tree analysis (Hossain and Piantanakulchai, 2013; Tesoriero et al., 2017). However, in this present study, an alternative approach to these modeling techniques, previously applied successfully by McGrory et al. (2017) which used similar predictor variables in addition to detailed aqueous geochemistry data that can potentially explain the spatial distribution of arsenic in relation to groundwater controls (e.g., bedrock geology) was utilized. A distinct advantage of this approach is that some datasets, as is the case here, do not include well-depth information and therefore can't be analyzed using these other modeling approaches which can integrate depth as a co-variate in the model.
One potential drawback of utilizing these extensive and valuable datasets is that they often encompass long term monitoring data (i.e., datasets often span years to decades) which can result in the presence of censored data, often with different limits of detection (DL) due to advancements and developments in instrumental and analytical technology over time. This censored data is reported as being below the (DL, i.e., data reported as < x μg L−1 where x is a numerical value (McGrory et al., 2017). Numerous approaches have been adopted to overcome these limitations, such as removal of censored data (with resulting loss of information), censored data analysis and/or substitution methods. These substitution methods (i.e., DL*1/2) are the most commonly used for the assessment of groundwater quality parameters at various spatial scales (Meliker et al., 2008; Homoncik et al., 2010; Sanders et al., 2012; Gong et al., 2014; Frederick et al., 2016; McLeod et al., 2017).
Surface geochemistry has been traditionally adopted for geochemical exploration, but recently the use of groundwater geochemistry data has been used as an alternative approach as it is an important medium for exploration of many different styles of mineralisation including porphyry copper, volcanogenic massive sulfide (VWS), sandstone uranium, and gold (Leybourne and Cameron, 2010). The advantage over these surface geochemical methods in that it provides 3-dimensional perspective of the area as groundwater recharges to depth, which increases the likelihood of interaction with buried mineralisation (Leybourne and Cameron, 2010). Groundwater can be collected as a geochemical sampling medium and its chemistry can be used to fingerprint groundwater-mineralisation interactions with this approach leading to significant cost-savings for the mineral exploration industry using existing boreholes (de Caritat and Kirste, 2005). Incorporation of regional and local hydrology for the interpretation of groundwater geochemistry for geochemical exploration can assist in tracing an anomaly back to its source (Carey et al., 2003; Gilliss et al., 2004; Leybourne and Cameron, 2010). By evaluating existing groundwater geochemical datasets, anomalies can be detected and evaluated as an initial geochemical exploration tool.
Building upon previous work (McGrory et al., 2017) the objectives of this current study were to (a) assess the spatial distribution of arsenic (and other hydrochemical parameters including iron, manganese, pH, etc.) within groundwater at a regional-scale in relation to different geological, hydrogeological, and land use categories, (b) identify if any correlations exist between arsenic and other hydrochemical parameters (e.g., iron, manganese, pH, etc), (c) elucidate potentially controlling factors of elevated arsenic in groundwater, and (d) compare observations with a national-scale approach and past mining activities.
Methodology
Study Area (County Kerry)
County Kerry is located in the southwest region of Ireland and covers an area of 4,807 km2 (Figure 1) with a total population of 145,502 (CSO, 2011). The topography of Kerry includes mountains, lowlands and hills. The MacGillycuddy Reeks (mid Kerry) are a high-relief massif which consists of Devonian sandstones and shales (Anderson et al., 2000). Due to the prevailing south-westerly winds and the mountainous landscape, Kerry receives one of the highest amounts of rainfall in Ireland. The landscape occurred as a result of large-scale folding, faulting, and thrusting during the Variscan Orogeny (290 mya) with the subsequent erosion by water and ice (Pracht, 1997). Upper Carboniferous shales are located at the east and north, while Lower Carboniferous limestones dominate western Kerry. Silurian and Devonian sandstones are located within the south and west with pockets of volcanic rocks scattered throughout Kerry.
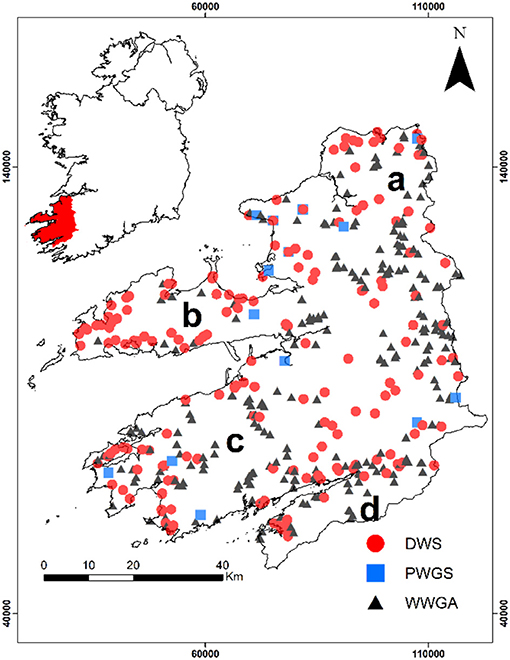
Figure 1. Spatial distribution of monitoring locations in Kerry in relation to the three datasets used in this study (where DWS, drinking water supplies; WWGAs, well water grant applications; PWGS, public water groundwater sources) and regions (where a = northern area of study site, b = Dingle Peninsula, c = Iveragh Peninsula, and d = Beara Peninsula).
Borehole Design and Construction
The bedrock below the Republic of Ireland is ancient. All the rocks are over 300 million years old, and have undergone multiple phases of compression and deformation (Environmental Protection Agency, 2013). The hard, unweathered bedrock does not contain open pore spaces through which groundwater can flow. As a result, groundwater flows through major and minor joints, fractures or gaps in the bedrock. The bedrock aquifers of Ireland are not aquifers in the classic sense. They are not homogeneous porous media, but rather they are heterogeneous, impermeable, and non-porous (Environmental Protection Agency, 2013).
In the past, boreholes which were designed and constructed in Ireland in order to maximize the flow of groundwater into the borehole. The design of these old type boreholes resulted in a blend of both shallow and deep groundwater flowing into the borehole (Figure 2A). This often leads to these groundwater supply sources being polluted by shallow groundwater. The inadequacy of the old type boreholes has been realized. A modern borehole design is being adopted that deliberately excludes the shallow, more easily contaminated groundwater and draws upon only the deeper, less easily polluted groundwater (Figure 2B; IGI, 2007; Environmental Protection Agency, 2013). Unfortunately, in Kerry, most drinking water supply boreholes in the past have been constructed according to Figure 2A, and therefore for this study it is presumed that many water samples could be a blend of shallow and deeper groundwater. Water coming into a borehole at a shallow level will usually have had a shorter and more rapid travel path than water entering a borehole at greater depth. Therefore, deeper groundwater will have had a longer contact time with the rock and minerals exposed in the sides of the fractures or conduits through which the water has passed. The chemistry of groundwater changes with depth and length of travel path. It is not possible to determine the proportion of the water sample coming from different depths in each borehole, because the geological and construction records for the older type boreholes are either absent or less than adequate. It is possible to retro-actively determine the proportion of water entering boreholes at different depths if the producing section hole is not lined or screened. However, this determination involves different types of pumping tests, video camera surveys, geophysical logging and depth sampling. This work could take several days if not weeks for each borehole. This level of investigation for over 400 boreholes in Kerry was beyond the scope of either this study or the original local authority water quality monitoring programme.
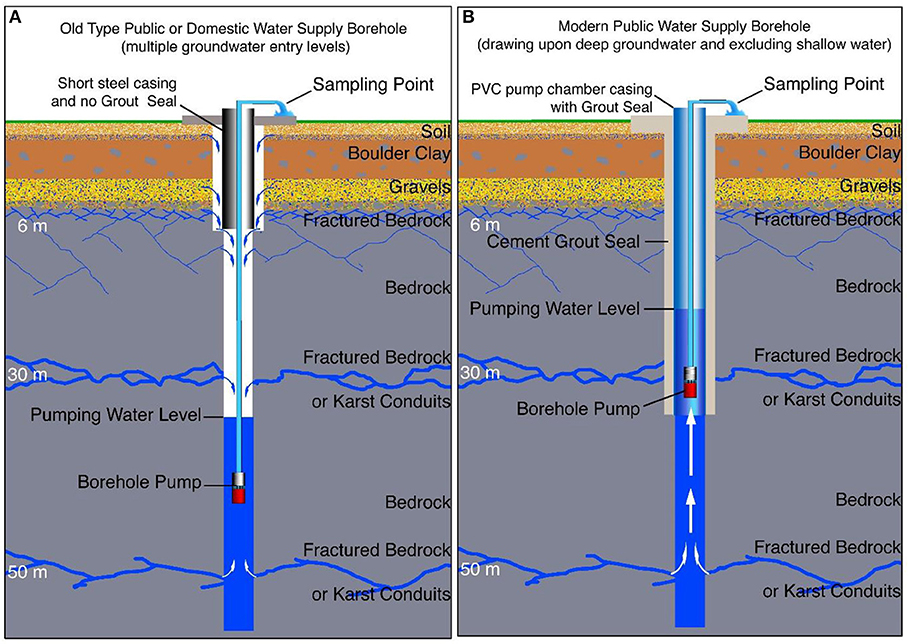
Figure 2. Graphical representation of an (A) older and (B) more modern borehole construction. The pumps in older boreholes are often too powerful and set deep. These boreholes are usually pumped intensely for short periods. Groundwater cascades down the borehole from shallow levels to the pump. On the other hand more modern boreholes have pumps set within the pump chamber casing. The pumps are usually operated gently and continuously. The deep groundwater flows to the pump.
Data Description
As part of a national-scale assessment of arsenic in groundwater in Ireland (McGrory et al., 2017), regional-scale datasets were also collected, including one from Country Kerry. This dataset in Kerry was composed of laboratory analyses (As, Fe, Mn, pH, conductivity, Na, Ca, K, Mg, and total hardness) of samples collected from routine monitoring of public and private water supplies by local authority officials, and also laboratory analyses submitted to Kerry County Council by private householders when they applied for a government grant after they had drilled and pumped a new water supply borehole. The Kerry data set forms an amalgamation of three data sets; drinking water supplies (DWSs), well water grant applications (WWGAs), and public groundwater sources (PWGS), with the majority of samples coming from private sources (Figure 1). Samples from WWGAs dataset are spread throughout county Kerry and are a good indicator of the extent of spatial variations in arsenic concentration. Hydrochemical parameters in the dataset include arsenic (As, μg L−1), iron (Fe, μg L−1), manganese (Mn, μg L−1), hydrogen ion potential (pH, pH units), electrical conductivity (EC, μS cm−1), sodium (Na, mg L−1), potassium (K, mg L−1), calcium (Ca, mg L−1), magnesium (Mg, mg L−1), and total hardness (TH as CaCO3, mg L−1). Other parameters were sometimes measured (e.g., selenium, zinc, lead), but as these were not always analyzed, they were not included in the overall analysis and assessment, except where appropriate in order to inform the interpretation and discussion of the results. In addition redox potential and major anions were not measured.
The three datasets (DWS, WWGA, and PWGS) were amalgamated to create a central database. Table 1 shows the number of missing values for each of the parameters. For example, at two of the monitoring sites, there were three analyses for arsenic, which had no reportable Detection Limit for arsenic, but had missing arsenic values. Both of these sites were removed in addition to another site from the statistical analysis leaving 467 sites and 1,490 analyses. Further elaboration on removed sites are described in Table S1 and Text 1 of the Supplementary Information.
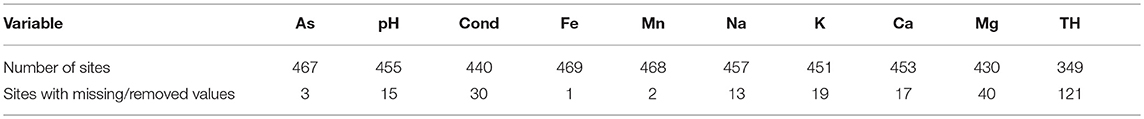
Table 1. Site numbers for each variable (total sites 470).
The local authority did not have hydrogeologists, hydrochemists, or geochemists on their staff, or engage outside expertise, to collect the groundwater samples, carry out analyses of unstable physicochemical parameters at the well head, and specify parameters to be analyzed in the laboratory. As a result, this dataset is imperfect and less than ideal, but the fact that a local authority conducted this sampling and analysis was a major step forward, and the fact that this, albeit imperfect, groundwater arsenic data set from the Atlantic coast exists is important for the scientific community interested in arsenic in groundwater. While the authors were not involved in the sampling design or analysis of this dataset, the paper is an attempt to show what can be done successfully with such an imperfect dataset, and also shows that with such a dataset some interpretation techniques are of limited value. The paper shows, in effect, the limitations that such a sampling methodology and suite of analysis parameters impose on the interpretation.
Groundwater Sampling and Analysis
Groundwater samples were either collected from taps or in some instance's samples were taken from the borehole directly. Samples were filtered (0.45 μm) if they were highly turbid and were analyzed using an Agilent 7500 ce series inductively coupled plasma—mass spectrometer (ICP-MS; Agilent Technologies, Japan) using USEPA method 200.8 (1999). Data was collected from 2004 to 2012 (DWS, 2004–2012; WWGA, 2006–2012; PWGS, 2004–2011) and is a combination of individual 1,493 analyses from 470 locations (DWS, 833; WWGA, 613; PWGS, 47) with the number of analyses at each site ranged from 1 to 39. Information relating to borehole design and construction were not investigated during the sampling programme.
Groundwater Sampling and Analysis
Groundwater samples were either collected from taps or in some instance's samples were taken from the borehole directly. Samples were filtered (0.45 μm) if they were highly turbid and were analyzed using an Agilent 7500 series inductively coupled plasma—mass spectrometer (ICP-MS; Agilent Technologies, Japan). Data was collected from 2004 to 2012 (DWS, 2004–2012; WWGA, 2006–2012; PWGS, 2004–2011) and is a combination of individual 1,493 analyses from 470 locations (DWS, 833; WWGA, 613; PWGS, 47) with the number of analyses at each site ranged from 1 to 39. Information pertaining to borehole construction were not recorded during sampling.
Explanatory Variables
Aqueous geochemical data were incorporated into a geographical information system (GIS), where geological data was integrated using a spatial join. Data included Geological Survey Ireland (GSI) databases: “National Generalized Bedrock Map (Rock Unit Group),” “Bedrock Aquifer,” “Groundwater Vulnerability,” “1:100,000 Bedrock Geology”, and “Quaternary (Sediments)” maps. The 27 rock unit groups (RUGs) of the “National Generalized Bedrock (Rock Unit Group)” are classified based on differing water-flow characteristics (Geological Survey of Ireland, 2005; Bruen, 2009). However, in order to reduce the complexity and have adequate sample numbers per classification, the RUGs were reduced from 27 to 11 classifications for the generation of a new parameter (i.e., rock type) as per McGrory et al. (2017) and Zhang et al. (2008a). The database of “Bedrock Aquifer” has nine classifications delineated using hydrogeological data and RUG information (DELG/EPA/GSI, 1999; Fitzsimons et al., 2005). However, only a subset of these classifications were used in this study due to the regional nature of the study site. The “Groundwater Vulnerability” database characterizes the risk of contamination of groundwater by polluting activities and is based on the classification according to DELG/EPA/GSI (1999). For each site, land cover was derived in this study in the form of the updated CORINE land cover (CLC 2012) databases (Lydon and Smith, 2014). Inclusion of the 1:500,000 “Quaternary (Sediments)” GIS layer was included to assist in linking Quaternary deposits to arsenic concentrations (Meehan, 2013; Meehan et al., 2014). Tables S2–S7 show rock type, aquifer, groundwater vulnerability, rock, quaternary, and CORINE land cover data for the study area For the CORINE dataset there are three levels of detail, Level 1, 2, and 3 were specified as CORINE (L1), CORINE (L2), and CORINE (L3), respectively. Maps showing these databases with groundwater monitoring points are illustrated in Figures S1–S6.
Statistical Analysis
Due to the presence of multiple analyses at some locations, the maximum value recorded for each parameter was utilized (i.e., on a worst-case scenario basis; Kim et al., 2011; McGrory et al., 2017). In order to determine the statistical relationship between hydrochemical and explanatory variables, the empirical cumulative distribution function (ECDF) was computed for censored data using the Kaplan-Meier method (Helsel, 2012). To determine if statistically significant differences existed between the distribution functions of the hydrochemical parameters in the different geological and hydrogeological groups, a score test was performed using the NADA1 package (Lee, 2017) in the statistical environment R (R Development Core Team, 2017). In order to account for the differences between the aqueous parameters across different groups pairwise comparisons using a Bonferroni correction was performed. Groupings with <5 sites, e.g., Basalt (n = 2) for arsenic rock type, were removed prior to forming the descriptive ECDF plots and applying the score tests. More detailed information in relation to sample number and removed groupings for explanatory variables can be observed in Tables S8–S15.
Figures were plotted with regulatory values: groundwater threshold value for arsenic (7.5 μg L−1) (European Communities, 2010), indicator parameters for pH, conductivity, sodium, manganese and iron (6.5–9.5 pH units, 2,500 μS cm−1, 200 mg L−1, 50 μg L−1 and 200 μg L−1 respectively; European Communities, 2007, 2014), interim guideline values for potassium, magnesium, calcium, and total hardness (as CaCO3) (5 mg L−1, 50 mg L−1, 200 mg L−1, and 200 mg L−1 respectively; Environmental Protection Agency, 2003). While the GTV for arsenic is 7.5 μg L−1 its parametric value is 10 μg L−1 (European Communities, 2014).
A correlation analysis was performed to ascertain if any relationship of arsenic and other hydrochemical parameters were present. For censored correlation analysis either one value is censored (singly censored) or both values in the observation pair are censored (doubly censored; Helsel, 2012) and a combination of both singly and doubly censored data was present within this dataset (except for conductivity and pH). Due to the presence of multiple DLs, the non-parametric correlation coefficient Kendall's tau (τ) was used to determine the strength of the monotonic relationship between two variables, x and y (Helsel and Hirsch, 2002; Helsel, 2012) using the cenken function in the NADA package (Lee, 2017). The highest value at each site was used for the correlation, however, when there was a tie for the highest value (i.e., 3 analyses within the same site had the same highest value for arsenic), with a differing y value (i.e., iron) then all of these tied values were included as repeated measures. In the instance where the maximum arsenic concentration had a missing value (NA) for the other variable (e.g., NA calcium value), then the next available pair was included for which arsenic value is maximized within those available pairs.
Interval Mapping
Interval mapping of each hydrochemical parameter was generated using a system of five classes (the class division depended on the parameter being investigated) using ArcGIS® 10.2 (ESRI®, Colorado) in Irish National Grid (1965 Datum; McGrory et al., 2017).
Hot-Spot Analysis
In order to identify spatial clusters and outliers, the hot-spot analysis technique of Local Indicator of Spatial Association (LISA) or Local Moran's I statistic, a class of local statistics, was performed. This technique can be used to address outliers, locate spatial associations, and identify local clusters (i.e., high value clusters; Anselin, 1995, 1996). A 1-sample Kolmogorov-Smirnov (K-S) non-parametric test for normality was performed in addition to a normal score transformation to each parameter. Following this, a Local Moran's I cluster map was created in GeoDa™ 1.4.6 using a threshold distance of 10 km at a significance level of 0.05 (999 permutations; Anselin et al., 2006) with the resulting shapefile being analyzed in ArcGIS® 10.2 (ESRI®, Colorado) in Irish National Grid (1965 Datum). The threshold distance of 10 km was used based on a variogram computed as part of the national-scale assessment of arsenic in groundwater (McGrory et al., 2017). To briefly explain the designations of the hot-spot analysis, when a positive value results from an autocorrelation then these locations have similarly high or low values as its neighbors which are termed spatial clusters then this site is defined as high-high (i.e., high values in a high value neighborhood) or low-low (i.e., low values in a low value neighborhood; Zhang et al., 2008b). In comparison, a negative autocorrelation results in a spatial outlier which is categorized as either low-high (a low value in a high value neighborhood) or high-low (a high value in a low value neighborhood; Zhang et al., 2008b).
Results
Interval Mapping
Interval mapping of groundwater quality parameters are illustrated in Figure 3 (and Figures S7A–I) with the corresponding number of values per classification illustrated in Table 2. The majority of sites exhibited concentrations that are below the guideline values for most parameters. Manganese and iron were observed to be above the indicator values and showed a greater spatial distribution when compared to arsenic for a higher proportion of sites for a higher proportion of sites with both elements showing a greater spatial distribution when compared to arsenic which may result from greater variation in lithology. Widespread elevated concentration of manganese (>50 μg L−1) and iron (>200 μg L−1) occur around Kerry with concentrations reaching a maximum of 9,987 μg L−1 and 24,180 μg L−1, respectively. A distinct spatial cluster of elevated arsenic occurred in-between the Dingle Peninsula and Beara Peninsula (Figure 3). Within this location of elevated arsenic the pH is at a neutral to alkaline range. To the north of the study area there are smaller clusters with elevated arsenic concentrations. Other parameters such as conductivity, sodium, and magnesium exhibit similar spatial patterns to calcium and total hardness (i.e., similar low and elevated locations), while potassium exhibits a distinct spatial pattern.
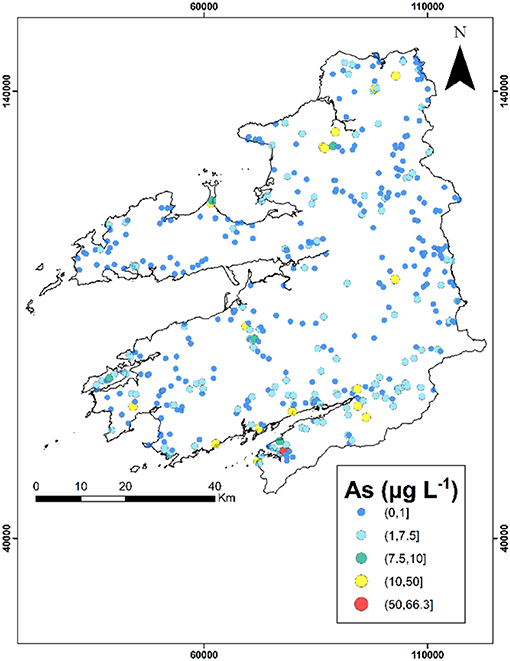
Figure 3. Spatial distribution of arsenic divided into five intervals.
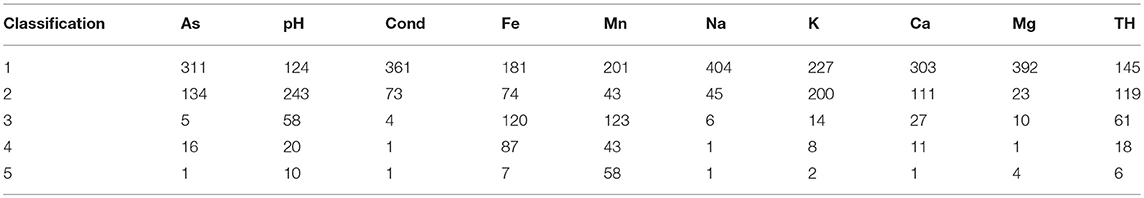
Table 2. Number of sites per interval classification (refer to Figure 3 for classification).
Hot-Spot Analysis
Hot-spot analysis of groundwater quality parameters are illustrated in Figure 4 with Table 3 (and Figures S8A–I) showing the corresponding number of values per classification. In this study, the hot-spot analysis revealed that most locations are defined as not-significant groups that do not contribute to spatial outliers or clusters. Generally, in the study area, there is a greater presence of spatial clusters rather than spatial outliers, and in north Kerry a high-high spatial cluster occurred for conductivity, sodium, potassium, calcium, magnesium, and total hardness. Additionally another large spatial cluster is present within the Iveragh Peninsula as a low-low cluster for the previous parameters. However, this spatial cluster is less defined for calcium and total hardness.
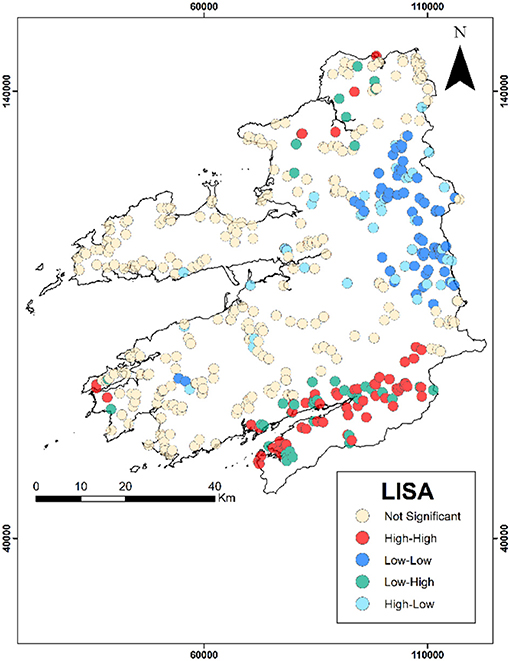
Figure 4. Hot-spot distribution of arsenic.
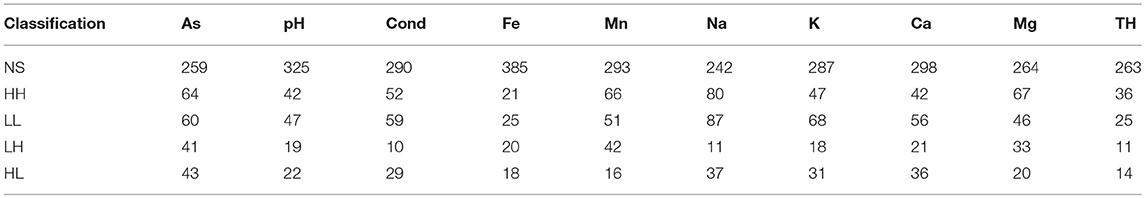
Table 3. Number of sites per hot-spot classification (where NS, not-significant; HH, high-high; LL, low-low; LH, low-high; and HL, high-low).
Arsenic also presents the greater number of spatial outliers within the dataset as either low-high or high-low. Within the north of the study area high-low spatial outliers are present, while to the south (Beara Peninsula) there is a group of low-high spatial outliers within a group of high-high spatial clusters. The majority of the arsenic high-high groups are contained within this cluster. To the east there is also a group of high-high pH values and manganese values to the west. There are no iron spatial clusters within this high-high pH area, but present in the north of the study area. The low-low arsenic spatial cluster is contained within the east of Kerry, with this locality containing a high-high manganese cluster.
Geological Constraints on Groundwater Parameters
Arsenic
Arsenic ECDF plots for rock type, aquifer, vulnerability, rock, quaternary, CORINE (L1), CORINE (L2), and CORINE (L3) are illustrated in Figures 5A–J. The observations give evidence to suggest distributions of arsenic concentration in groundwater differ across rock types (p ≈ 0.000) with pairwise comparisons indicating statistically significant differences between Sandstone (ORS/NRS) and Sandstone (p = 0.0403) and between Sandstone (ORS/NRS) and Sandstone/Shale (p = 0.0203). While some differences were observed between Pure Limestone and the groups Sandstone/Shale, Sandstone, and Sandstone (ORS/NRS) these differences are not statistically significant. Figure 4D presents the ECDFs for the more detailed categorization of rock, while Figures 4E,F, provide additional ECDFs for the contrasts of rock types found statistically significant (i.e., between Sandstone (ORS/NRS) and Sandstone/Shale, and between Sandstone (ORS/NRS) and Sandstone). This was repeated where appropriate for the other parameters and presented in the SI. Pairwise comparisons show that differences exist between the groups NAM and CH (p ≈ 0.000).
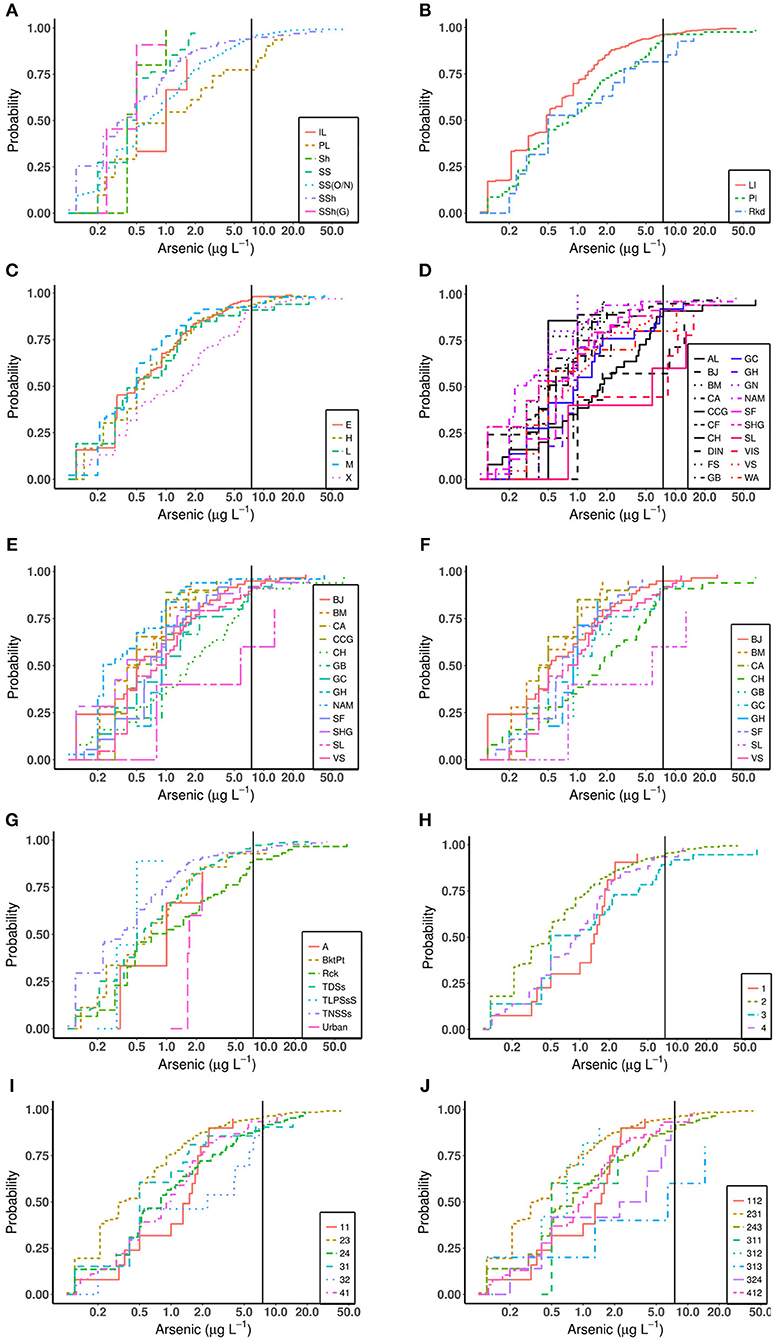
Figure 5. ECDF plot displaying the empirical distribution function of arsenic in relation to (A) rock type, (B) aquifer, (C) groundwater vulnerability, (D) rock, (E) rock (SS(ON) and SSH), (F) rock (SS(ON) and SS), (G) quaternary, (H) CORINE(L1), (I) CORINE(L2), and (J) CORINE(L3). The arsenic GTV value of 7.5 μg L−1 is represented as a black vertical line.
The distributions of arsenic concentration differ across the quaternary groupings (p ≈ 0.000) with pairwise comparisons showing that differences exist between the groups of TNSSs and Rck (p = 0.002), between TNSSs and TDSs (p = 0.012), between Urban and TLPSsS (p = 0.003) and between Urban and TNSSs (p = 0.001).
There is evidence the distributions of arsenic concentration differ across aquifer groupings (p = 0.016) with pairwise comparisons showing differences between the groups Pl and Ll (p = 0.020). Generally more elevated concentrations of arsenic were observed in the group Ll. For groundwater vulnerability groupings the distributions of arsenic concentration also differ (p = 0.005), with pairwise comparisons illustrating differences exist between the groups X and E (p = 0.022), between X and H (p = 0.040), and between X and M (p = 0.007).
For CORINE land cover, three levels of categorization were investigated depending on their detail, CORINE (L1), CORINE (L2), and CORINE (L3). The distributions of arsenic concentration differ across the CORINE (L1) groupings (p = 0.004) with pairwise comparisons showing differences between Agricultural Areas and Wetlands (p = 0.036). The further detailed categorization of CORINE (L2) pairwise comparisons showed differences exist between the groups Urban Fabric and Pastures (p = 0.038), between Pastures and Heterogeneous Agricultural Areas (p = 0.002), and between Pastures and Inland Wetlands (p = 0.005). For CORINE (L3) groupings, pairwise comparisons showed differences between groups Pastures and Land Principally Occupied by Agricultures (p = 0.006), and between groups Pastures and Peat Bogs (p = 0.004).
pH
pH ECDF plots for rock type, aquifer, vulnerability, rock, quaternary, CORINE (L1), CORINE (L2), and CORINE (L3) are illustrated in Figures S9A–H. The data gave no evidence to suggest the distribution of pH differ across rock types, or across aquifer groupings, or between groundwater vulnerability groupings. For rock groupings, the observations give no evidence to suggest the distributions of pH differ, however pairwise comparisons highlighted a difference between the groups SF and CH (p = 0.048). The distributions of pH differ across the different quaternary groupings (p = 0.014) with pairwise comparisons showing that statistical differences exist between the groups Urban and TDSs (p = 0.015) and between Urban and TNSSs (p = 0.006). The distribution of pH did not differ across any of the CORINE groupings.
Electrical Conductivity
Electrical conductivity ECDF plots for rock type, aquifer, vulnerability, rock, quaternary, CORINE (L1), CORINE (L2), and CORINE (L3) are illustrated in Figures S10A–K. The distributions of electrical conductivity differ across rock type (p ≈ 0.000) with pairwise comparisons indicating statistically significant differences between Pure Limestone and Sandstone (p ≈ 0.000), between Pure Limestone and Sandstone (ORS/NRS; p ≈ 0.000), and between Pure Limestone and Sandstone/Shale (p ≈ 0.000). The distribution of electrical conductivity differ across the different rock groupings (p ≈ 0.000) with pairwise comparisons showing statistical differences between the groups of BJ and GH (p ≈ 0.000), BJ and SHG (p ≈ 0.000), BJ and VIS (p ≈ 0.000), BJ and WA (p ≈ 0.000), BM and GH (p = 0.019), BM and SHG (p = 0.011), BM and VIS (p = 0.009), BM and WA (p = 0.043), CA and GH (p = 0.007), CA and VIS (p = 0.006), CA and WA (p = 0.016), CF and GH (p 0.015), CH and GH (p ≈ 0.000), CH and SHG (p = 0.001), CH and VIS (p ≈ 0.000), CH and WA (p ≈ 0.000), FS and GH (p ≈ 0.000), FS and SHG (p = 0.011), FS and VIS (p ≈ 0.000), FS and WA (p = 0.006), GC and GH (p ≈ 0.000), GC and SHG (p = 0.003), GC and VIS (p ≈ 0.000), GC and WA (p = 0.001), GH and NAM (p ≈ 0.000), GH and VS (p ≈ 0.000), NAM and SHG (p ≈ 0.000), NAM and VIS (p ≈ 0.000), NAM and WA (p ≈ 0.000), SF and VIS (p = 0.020), SF and WA (p = 0.021), SHG and VS (p = 0.003), VIS and VS (p ≈ 0.000), and between VS and WA (p ≈ 0.000). The distributions of electrical conductivity differ across the quaternary groupings (p = 0.004) with pairwise comparisons showing a difference between TNSSs and TDSs (p = 0.025).
For aquifer groupings the distributions of electrical conductivity differ (p ≈ 0.000) with pairwise comparisons showing differences between Rkd and Ll (p ≈ 0.000) and between Rkd and Pl (p ≈ 0.000). Groundwater vulnerability groupings also show significant differences in electrical conductivity (p ≈ 0.000) with pairwise comparisons showing differences between L and E (p ≈ 0.000), and between L and X (p = 0.025). The observations give no evidence of any differences in conductivity across any of the three CORINE groupings.
Iron
Iron ECDF plots for rock type, aquifer, vulnerability, rock, quaternary, CORINE (L1), CORINE (L2), and CORINE (L3) are presented in Figures S11A–H. The distributions of iron concentration do not differ across rock type groupings and across rock groupings, nor across aquifer groupings, groundwater vulnerability groupings, or any of the three CORINE groupings. While there was evidence to suggest the distribution of iron concentrations differ across the different quaternary groupings (p = 0.026), however in the global test, pairwise comparisons applying the correction for multiple testing showed no differences between pairs of groups.
Manganese
Manganese ECDF plots for rock type, aquifer, vulnerability, rock, quaternary, CORINE (L1), CORINE (L2), and CORINE (L3) are illustrated in Figures S12A–I. For rock types the distributions of manganese concentration differ (p ≈ 0.000) with pairwise comparisons indicating differences between Sandstone/Shale and Sandstone (ORS/NRS; p = 0.001). The distribution of manganese concentrations differ across rock groupings (p = 0.001) with pairwise comparisons mainly showing differences between BM and other categories of rock, i.e., between BM and BJ (p = 0.029), BM and CCG (p ≈ 0.000), BM and CF (p = 0.006), BM and FS (p = 0.003), BM and GN (p ≈ 0.000), BM and NAM (p = 0.015), BM and SF (p = 0.037), BM and SHG (p ≈ 0.000), BM and SL (p = 0.040) and between BM and VS (p = 0.010). The distributions of manganese concentrations also differ across quaternary groupings (p = 0.002) with pairwise comparisons indicating differences between the TNSSs and TDSs (p = 0.011).
The observations give no evidence to suggest distributions of manganese concentrations differ across aquifer groupings and groundwater vulnerability groupings
For CORINE (L1) and CORINE (L2) groupings, there is no evidence of a difference in manganese concentration, however significant differences are found when looking at CORINE (L3) groupings (p = 0.027), in specifically between groups Pastures and Broad-Leaved Forest as shown from the pairwise comparisons (p = 0.015).
Major Cations
To maintain brevity of this section, the statistical results of the pairwise comparisons incorporating both text and ECDFs of the major cations (Na, K, Ca, Mg, and total hardness) have been moved to the SI. The associated sections for each major cation parameter included in the SI are: Na (Text 2, Figures S13A–K), K (Text 3, Figures S14A–L), Ca (Text 4, Figures S15A–K), Mg (Text 5, Figures S16A–I), and total hardness (Text 6, Figures S17A–J).
Correlation of Arsenic With Other Variables
Table 4 displays the correlation of arsenic with other hydrochemical variables with an example of the correlation plot of arsenic (with pH and manganese) provided in Figures 6A,B which highlights the presence of censoring. Arsenic displays weak positive correlations with the other hydrochemical parameters (except for potassium), showing no correlation, at the 0.05 significance level. In addition, weak correlations are also observed between other the trace metals (i.e., iron and manganese) and the hydrochemical parameters. Interestingly, only a very weak correlation is observed between iron and pH (−0.02), manganese and pH (−0.05) while for iron and manganese evidence of a correlation exists (0.30). pH is a dominant mechanism for the mobility of iron and manganese in groundwater. Redox potential (Eh) also plays a critical role in iron and manganese mobility, but was not available in this present dataset. In contract to the trace metals, a weak to moderate positive correlation exists between conductivity, calcium, sodium, and magnesium.
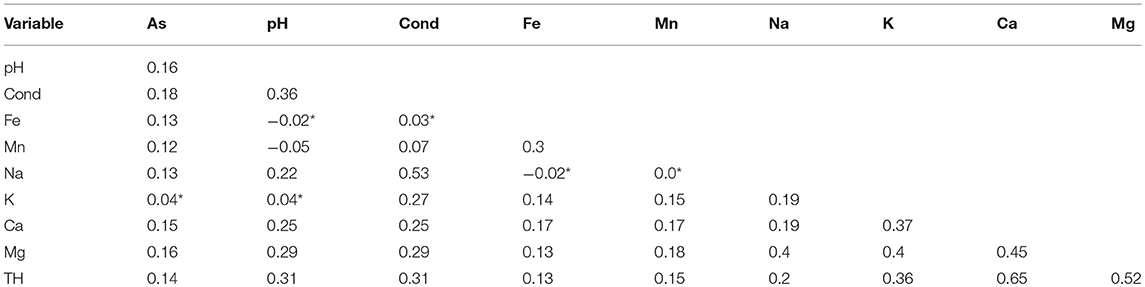
Table 4. Correlation matrix of water quality parameters (all correlation coefficients denoted by * are not significant at the 5% significance level).
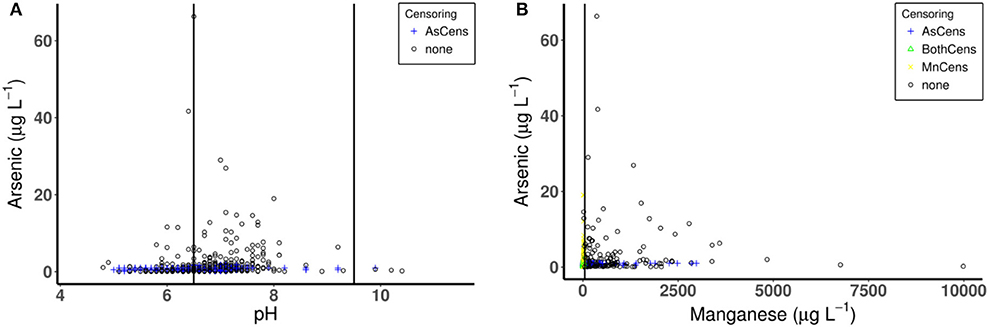
Figure 6. Correlation plot of arsenic (A) and pH (6.5, 9.5) and (B) Mn (50 μg L−1). Values in parenthesis are water quality standard values. Where AsCens is censored values for arsenic, BothCens are both values censored and none indicates no censoring.
One feature to comment upon is the fact that Kendall's tau is generally 0.15 lower than Spearman's rho and Pearson's r given the same strength of correlation as it is measured on a different scale (Helsel and Hirsch, 2002).
Discussion
Source of Arsenic: Geogenic or Anthropogenic?
Lithology
The primary rock type associated with elevated concentrations of arsenic in groundwater in this regional study were sandstone derived rocks, which was also previously observed from a national scale assessment of arsenic in groundwater in Ireland (McGrory et al., 2017). The national-scale assessment indicated that elevated concentrations of arsenic were primarily associated with the sandstone derived rock type of Sandstone/Shale (Greywacke; McGrory et al., 2017), but in the present regional study this rock type was not statistically significant with regards to arsenic distribution in groundwater (however, it is worth noting that it had a low sample number). Elsewhere, elevated arsenic concentrations have been recorded in fractured bedrock aquifers within calcareous metasedimentary bedrock (Ayotte et al., 2003 and 2006) similar to the sandstone derived rock type [Sandstone/Shale (Greywacke)]. While a difference was observed in arsenic levels from wells in Pure Limestone and these sandstone rock types, it was not statistically significant at the 5% significance level and it is worth noting that a vast abundance of different sandstone derived lithologies occur in this region of Ireland, i.e., Old Red Sandstones (Fay et al., 2007; Figure S1). Furthermore, lower concentrations of arsenic in sandstone rocks reflect the predominance of low-arsenic minerals (i.e., feldspar and quartz) in this rock type (Smedley and Kinniburgh, 2013).
The present study illustrates that favorable geochemical conditions for arsenic mobilization may exist within the Devonian rock type Sandstone (ORS/NRS). Similarly, groundwater from the Devonian Old Red Sandstones of the Welsh borders (Shand et al., 2003), South Wales (Moreau et al., 2004) and the Moray Firth and Strathmore in Scotland (Ó Dochartaigh et al., 2006, 2010) exhibited elevated arsenic concentrations. Frequently Old Red Sandstones often produce groundwater that contain high concentrations of iron and manganese in Ireland (Sleeman and Pracht, 1999).
Groundwater from the Caha Mountain Formation, which is derived from the Devonian Sandstones (TDSs, Quaternary) exhibited elevated arsenic concentrations. This high arsenic cluster is located on the northern margin of the south Munster Basin, a boundary extending from south Cork to Kenmare (north of Beara Peninsula). The Caha Mountain Formation lies south of the Beara Peninsula where groundwater contains elevated arsenic which may also extend into other regions of the Peninsula, including County Cork. While a relationship exists between arsenic in groundwater and the surrounding lithology, it shows a weak correlation amongst other hydrochemical parameters which has also been observed elsewhere (Ayotte et al., 2003; Liesch et al., 2015).
Similarly groundwater of the poorly exposed Namurian (Undifferentiated) Formation, included within the Sandstone/Shale rock type, also contained elevated concentrations of arsenic. This Namurian Formation contains bedrock strata which include black shales (Sevastopulo, 2009) which have been demonstrated to give rise to elevated arsenic in groundwater (Peters and Burkert, 2008; Ryan et al., 2015; Rddad, 2017) due to the presence of pyrite (Paikaray, 2012). Black shales can also be enriched in other redox-sensitive elements, e.g., selenium and uranium. To the north of this Namurian Formation (within the Sandstone/Shale rock type), concentrations of molybdenum and selenium (68–155 mg kg−1 and 16–42 mg kg−1, respectively) are elevated within the bedrock while arsenic concentrations (17–29 mg kg−1) remain somewhat elevated (Parnell et al., 2016). The highest values of molybdenum and selenium in these shales in Kerry were recorded in Ballybunion (Parnell et al., 2016), but in the present study groundwater concentrations here were < 7.5 μg L−1. Given that there are some localities within the Sandstone/Shale rock type that have elevated arsenic, manganese and to a lesser extent iron, further research is required to evaluate if other redox-sensitive elements (i.e., molybdenum, selenium, and uranium) are of concern in groundwaters. Similar spatial patterns can be observed with rock types for arsenic and manganese [i.e., Sandstone (ORS/NRS) and Sandstone/Shale]. Given that shale (i.e., Sandstone/Shale) contain elevated arsenic the potential for arsenic mobilization to groundwater through oxidation of sulfide minerals remains a possible mechanism (Ravenscroft et al., 2009). Further details of arsenic interval mapping overlain with rock lithology are presented in Figure S18.
It is noteworthy that while no differences were observed in groundwater iron across the different rock types, manganese concentrations were significantly different between Sandstone (ORS/NRS) and Sandstone/Shale indicating the possible role of manganese oxyhydroxides in arsenic mobilization. The overall correlation between these elements was weak, but some similar spatial clusters of arsenic, manganese and pH occurred in southern Kerry. While the spatial pattern of arsenic is clustered around small high-high clusters, both iron and manganese exhibited a greater spatial diversity.
Aquifer Classification
Generally more elevated arsenic concentrations were observed within the aquifer classification Ll and the groundwater vulnerability classification E (extreme), H (high), and M (medium). It is possible that local contamination of anthropogenic origin may reflect the high concentrations in these groundwater vulnerability groups. The Ll classification is a poorly productive aquifer (PPA) that is only moderately productive in local zones and is associated with the Sandstone (ORS/NRS) group, as well as igneous, metamorphic, carbonate, and other clastic rock types across Ireland. This aquifer classification has also been found to contain elevated arsenic on a national-scale study in Ireland (McGrory et al., 2017). Some of these Devonian aquifers are fractured enough to have developed some permeability, however, this is not to an extent to be classified as regionally important aquifers (Pracht, 1997). Recent research has demonstrated that fractured bedrock aquifers give rise to elevated concentrations of arsenic (Bondu et al., 2016) and other trace metals in groundwaters in the US, Canada, Africa, France, Italy, Greece, and certain regions in Asia (Ayotte et al., 2003, 2006; Smedley et al., 2007; Verplanck et al., 2008; Ryan et al., 2011, 2015; Drummer et al., 2015; Reyes et al., 2015; Zkeri et al., 2015; Andy et al., 2017). In Ireland, these hard rock aquifers, or poorly productive aquifers (PPA) underlie 60% of the country (Robins and Misstear, 2000) and provide an important water source for farms, houses, small housing estates, hotels, and small businesses. Despite not being regarded as sources for large public water supplies, they are important for small public and public group supply schemes, and in terms of delivering water (and associated pollutants) via shallow groundwater pathways.
Land Use Categories
In New England variations in arsenic concentrations in groundwater occur across the different land use categories with the most variation being found in agriculture which was attributed to the use of arsenical-based pesticides (Ayotte et al., 1999). Historically in Ireland, arsenic based compounds have been used as wood preservatives, herbicides, and biocides (insecticides and rodenticides) with arsenic enriched soils in old orchards (FSAI, 2016). In the present study, while the agricultural (pastures and arable land) groups display significantly different levels of arsenic in their associated groundwater, it is not anticipated that anthropogenic activities such as the application of pesticides, resulted in the arsenic variation by land use (despite being an agricultural intensive area), but rather a function of the underlying lithology, i.e., the parent material. Spatial patterns of rock type and quaternary groups occur within these same area of statistically significant land use categories. For example, the Agriculture Areas group (including Pastures) toward the north of the study area coincides with Sandstone/Shale rock types, quaternary groupings, and TNSSs. To the south and west the land use category Wetlands (including Inland Wetlands and Peat Bogs) is overlies Sandstone (ORS/NRS) and quaternary grouping Rck and TDSs. It is therefore plausible that the weathered parent material is responsible for controlling arsenic in groundwater which is evident from the pairwise comparisons. The Namurian derived tills (TNSSs), Sandstone/Shale, and Pastures to the north and the TDSs and Rck, Sandstone (ORS/NRS) and Wetlands to the south and west had elevated concentrations of arsenic.
Another possible explanation could be the triggering of a release of geogenic arsenic via agricultural practices (i.e., nutrients) specifically the potentially critical risk factor being the presence of Peat Bogs which coincides with Sandstone (ORS/NRS). Reductive dissolution of iron oxyhydroxides influenced by a strong redox driver, i.e., organic matter, can release arsenic upon reduction of the ferrous state (Ravenscroft et al., 2009). The presence of peaty layers is a suitable risk factor for arsenic mobilization (Ravenscroft, 2007). These peaty layers around Kerry coincide with arsenic concentrations in soil at < 6 mg kg−1 (Fay et al., 2007). Although these peaty layers could provide organic matter to drive reductive dissolution of iron oxyhydroxides within this locality, further investigations are required in order to corroborate these preliminary observations. Other redox sensitive elements like manganese are also generally present alongside arsenic in groundwater in this area, while groundwater pH generally shows an alkaline relationship, but little overlap was observed in relation to iron. In addition to arsenic the hydrochemical parameters manganese, sodium, and potassium (and to a lesser degree total hardness) showed differences in land use categories.
The weaker relationship between arsenic in groundwater and land use categories in comparison to lithology may be as a result of comparing historic land use data and current water quality data as groundwater may have traveled a distance from the land use category that initially affected the water quality (Ayotte et al., 1999). As a result locations with elevated arsenic concentrations in groundwater originating from a specific land use category could now occur and be sampled in a different land use category elsewhere (Ayotte et al., 1999; Liesch et al., 2015). This weaker relationship between arsenic and land use may be a result of the use of agricultural based compounds, due to bias in areas requiring pesticide application. Manganese, sodium, and potassium also showed a relationship with land use cover with differing groups observed. Potassium can be found in some macronutrient fertilizes such as N-P-K (nitrogen, phosphorous, and potassium). Groundwater characterization in Germany found that arsenic also showed a statistically significant difference with land-use classification and hydrogeological units (Liesch et al., 2015) but like the present study no statistical difference in regards to land-use for iron, manganese (for some categories) and pH occurred, while a statistical difference existed for calcium and magnesium (Liesch et al., 2015). In non-carbonate areas, such as the ORS/NRS areas in Kerry agricultural land can be limed, i.e., with calcium and magnesium.
Groundwater Vulnerability
On a national-scale in Ireland, arsenic was not related to groundwater vulnerability (McGrory et al., 2017), but the present regional-scale study observed that differences occurred (X and E, X and H, and X and M). Areas of high or extreme groundwater vulnerability could be susceptible to surface contamination (i.e., historical pesticide application) with contaminant properties, travel time, groundwater depth, and subsoil permeability being key characteristics that affect groundwater vulnerability within a location. Taking this and land cover into account, it could be possible that some arsenic sources are anthropogenic derived, however arsenic in is more likely to be controlled by the lithology. Given that a higher proportion of groundwater within agricultural land use areas contained elevated arsenic, some point source may exist which may also be the case for cations.
Linking Arsenic Concentrations With Historic Mining Activities
While the presence of arsenic within groundwaters around the study area are mainly geogenic in origin, some of the concentrations may have resulted from past mining activities. In the south of the study area (between the Iveragh and Beara Peninsula) a cluster of elevated groundwater arsenic occur near metallic mineral locations such as malachite, copper, chalcopyrite, lead, zinc, silver, and pyrite. Many metallic deposits were worked in this region such as silver, manganese, iron, and gold, but it was the copper deposits that generated economic interest (Pracht and Sleeman, 2002). Copper mineralisation in this area is hosted in Upper Devonian rocks that underwent low grade metamorphism during the Variscan Orogeny (Pracht and Sleeman, 2002). These copper ores are associated with three distinct styles of mineralisation: (i) low grade stratiform deposits of disseminated copper-iron and copper sulfides, (ii) poorly mineralised, quartz-calcite veinlets carrying the same ore minerals as the disseminated stratiform deposits, and (iii) thick quartz veinlets containing a more varied mineralogy including lead, bismuth, molybdenum, arsenic, antimony, and minor gold phases (Ni wen et al., 1999; Pracht and Sleeman, 2002). In the West Carbery District, the majority of veins are hosted within the Toe Head and Old Head Sandstone Formations. One groundwater monitoring location in the Old Head Sandstone Formation had elevated arsenic in addition to copper, iron, and manganese at Rosdohan (Table S16). Other monitoring locations from this area had low concentrations of copper (either not-detected or <50 μg L−1) except for one location to the east. While low concentrations of arsenic were observed, copper concentrations approached 2,827 μg L−1 (Table S17) and from this area of Slaheny, copper was extracted from the Lower Limestone Shales as chalcopyrite and tetrahedrite (Pracht, 1997). However, the highest concentrations of copper observed in the study area are present at north of the Iveragh Peninsula in low-arsenic acidic groundwaters in Killorglin with a maximum concentration of copper of 15,580 μg L−1 in addition to zinc concentrations measured at a maximum of 1,990 μg L−1 (Table S18). Historically the Old Red Sandstones have been known to contain copper mineralisation. However, no known occurrence of historic mining or copper mineralisation is present within this location which may warrant further investigation for geochemical exploration. While no surrounding locations had elevated copper, a location east of the area had copper concentrations at 218 μg L−1 (Table S19). The lead concentrations are low in these locations because generally lead is insoluble in groundwater.
In relation to the scattered cluster of elevated arsenic in groundwater in northern Kerry there is no evidence of elevated levels of copper detected. However, Cole (1922) recorded that the Geololgical Survey of Ireland (GSI) in 1859 reported a former mine at Ballinglanna (2 km north of the village of Causeway in north Kerry; Sleeman and Pracht, 1999). They reported evidence of lumps of galena in a stream running through the townland providing historic evidence of metal mineralisation in this area of elevated arsenic concentrations in groundwater.
Relationship of Other Hydrochemical Parameters
While arsenic demonstrates weak correlations with other hydrochemical variables in groundwater across the study area, moderate correlations are apparent between conductivity, sodium, calcium, magnesium, and total hardness (and to a lesser extent potassium). A group of high-high spatial clusters for conductivity, sodium, calcium, potassium, magnesium, and total hardness are evident toward the north of Kerry with low-low spatial clusters observed around the Iveragh Peninsula. The high-high spatial clusters extend to a lesser extent for both sodium and magnesium. Interestingly, within the high-high arsenic spatial cluster the other hydrochemical parameters are observed as either low-low spatial clusters or not-significant groups. These hydrochemcial parameters (conductivity, sodium, potassium, and calcium) also show the same pattern within rock types, i.e., between Pure Limestone and Sandstone, Pure Limestone and Sandstone (ORS/NRS), and Pure Limestone and Sandstone/Shale. For potassium in groundwater additional differences were apparent within both rock types Sandstone/Shale and Sandstone (ORS/NRS) which were also observed for conductivity, potassium, and calcium. As a result, fewer statistical differences between rock groupings are contained within total hardness and magnesium when compared to the larger diversity within conductivity, sodium, potassium, and calcium. Greatest variations occurred within the rock groups GC, SHG, VIS, and WA.
Comparison With Other Regions
The national-scale assessment of arsenic in groundwater in Ireland reported concentrations ranging from < 0.2 to 234 μg L−1 (McGrory et al., 2017). Concentrations of arsenic measured within this study are not grossly elevated as seen elsewhere globally, especially in south east Asia, but represent a level of low-to-moderate arsenic exposure. Similarly low concentrations of arsenic have been observed in European groundwater (using bottled water as a proxy; Table 5), but at concentrations higher than what was previously observed for Ireland. While the arsenic concentrations in this work are low-to-moderate, they represent the potential for long-term low-dose arsenic exposure, which can induce chronic health effects (Moon et al., 2012; Bräuner et al., 2014; Stea et al., 2014; Tsuji et al., 2014). Generally higher concentrations of cations have been observed elsewhere in Europe, whereas the concentrations of iron and manganese found within Kerry represents elevated concentrations when compared to other regions within Europe (Table 5). Lower concentrations of manganese were found in Scottish groundwater which ranged from <3 to 1,900 μg L−1 (Homoncik et al., 2010).
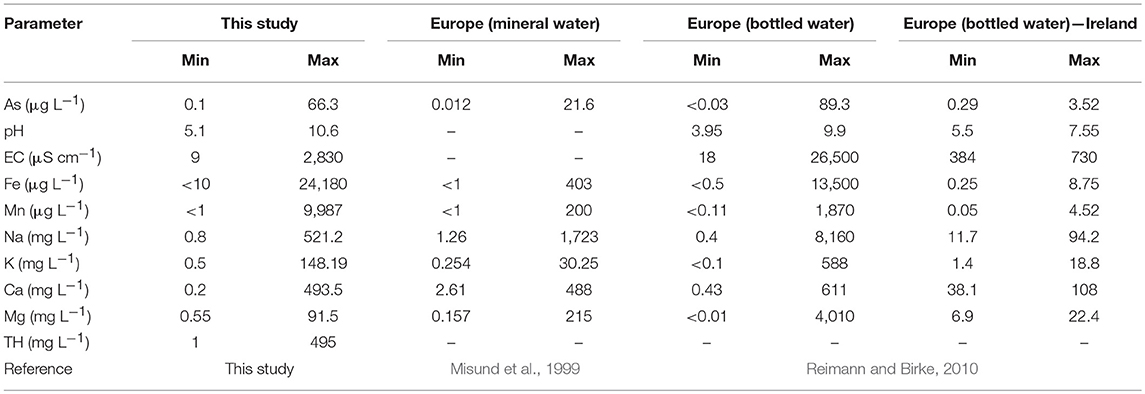
Table 5. Comparison of arsenic within European regions.
Strengths, Limitations, and Recommendations for Future Research
The objective of this present work was to understand the controls and distribution of arsenic and other hydrochemical parameters within groundwater at a regional-scale. This was accomplished using an imperfect dataset collected as part of routine monitoring of groundwater by a local authority. This work is of value for the data and the results of the interpretation that it contains, but it is also of value because there are obvious gaps or omissions in the sampling and analysis which identify the limitations that such a sampling methodology, and suite of analytical parameters, impose on the interpretation.
However, by harnessing these existing historic hydrochemistry datasets, this work has demonstrated that it is cost effective in delineating potential areas of arsenic contamination in groundwater (and any other contaminants for that matter). This is especially beneficial where no detailed studies exist for a region (e.g., Kerry) and can be used as a basis for developing appropriate detailed investigations. The methodological approach developed in the present study and by McGrory et al. (2017) can be utilized in many regions around the world where such datasets exist. This particularly extends to Europe where such assessments using existing geochemical datasets are not harnessed for their potential benefits in comparison with their adoption in studies in the US (Ayotte et al., 2003). These techniques cannot replace systematic arsenic sampling and monitoring strategies but can act as a useful tool in locating potential areas of arsenic contamination (Bretzler et al., 2017a).
To determine statistically significant differences between groundwater hydrochemical parameters and the different geological, hydrogeological, and land classifications, then some simplification of these explanatory variables was needed. While these simplifications resulted in a more robust statistical analysis, a potential loss of information may have been observed as a result of this geological simplification (i.e., rock type). However, by harnessing detailed geological information as another explanatory variable in this study (e.g., 1:100 k bedrock geology, rock), some of these limitations can be overcome and further assist in explaining variations at the local scale. While more detailed geology of 1:5 K or 1:10 K would have greatly improved the understanding of how the geology potentially controls arsenic at a local-scale, this type of detailed geology map was unavailable for this area. A limitation occurs in the interpretation of the land use data as it must be noted that the CORINE land cover data is a proxy for land use.
Data within this study has revealed a distinct spatial occurrence of elevated arsenic occurring in the south of the study area (Dingle Peninsula and north of the Beara Peninsula). These localities warrant further detailed groundwater investigations in order to understand local variations in arsenic hydrochemistry. The recent national-scale study has shown that there is a presence of elevated arsenic in the region of the neighboring county, Cork (McGrory et al., 2017) with soil in this locality containing elevated arsenic (Fay et al., 2007). Based on findings in the present study, and previous work (McGrory et al., 2017), the PPAs, especially with a sandstone lithology, warrant further investigation for biogeochemical processes involving arsenic.
In other countries, where the bedrock is young (i.e., < 60 million years old) and consists of porous, relatively homogenous stratigraphic units, it would be reasonable to expect that arsenic concentrations in the groundwater would reflect the mineralogy of the rock and the geochemical processes taking place in the rock. It is expected that there would be some correlation between rock type, geochemical processes, and arsenic concentrations. This paper demonstrates that attempting to make this correlation in Kerry, and probably in the rest of the Ireland, is challenging, because the rocks of Kerry are old and impermeable, and groundwater does not flow through the rock itself, but groundwater (often in copious amounts) can flow through the breaks in the rock. These breaks consist of joints, fractures, faults, karst solution conduits, and weathered veins. Therefore, the contact between flowing groundwater and the rock matrix is on the faces of the breaks in the rock. This contact can be prolonged or brief.
In addition, this study also demonstrates that it is important to understand the design and construction of each borehole that is sampled. Some boreholes in the data set are probably modern (Figure 2B) where casing and cement grout have been used to exclude the ingress into the borehole of shallow groundwater and soil water. Most old or cheaply constructed boreholes do not exclude the shallow groundwater (Figure 2A). The shallow water will contain dissolved oxygen and organic acids from the often-peaty soils. Samples from these older, inexpensive boreholes will contain a blend of shallow groundwater, and deeper groundwater with a different Redox potential, age, pH, and chemical composition. The paper shows that it is important to fully understand the design and hydraulic characteristics of each borehole used as a sampling point to interpret the results. This understanding of each borehole takes time, but without it, it will be difficult to interpret anomalous data.
Conclusions
Within this regional-scale study area there is a relationship between arsenic and lithology (i.e., Sandstone/Shale (ORS/NRS) and Sandstone/Shale) which may indicate that the underlying rock is a strong predictor of arsenic in groundwater. However, more targeted studies are required to confirm this and further understand local-scale variations. Whilst the variation of trace elements like arsenic, manganese, and to some extent, iron are constrained within a small number of lithology groupings, the distribution of the major cations (sodium, potassium, calcium, magnesium, and total hardness) in addition to electrical conductivity exhibit a greater variation. This study has used an approach which integrated geological and hydrogeological data in order to reveal potential lithological controls of arsenic and other parameters in groundwater which will be of interest to researchers other regions. With the growing body of secondary groundwater datasets being generated in Europe and elsewhere, the methods presented here will be of interest on how to utilize an imperfect dataset. This study demonstrates that groundwater geochemistry at the regional-scale can identify metal ion anomalies which can be used to assist in future mineral exploration, as well as guiding future development and sustainability of good quality water resources.
Author Contributions
All authors in the research manuscript entitled Arsenic in groundwater in south west Ireland: occurrence, controls, and hydrochemistry have provided significant contributions toward the final article. EM and LM designed and conceived the study with inputs from EH, AA-I, NB, EJM, ED, and TH. EM, EH, and AA-I conducted the spatial and geostatistical analysis. EM prepared the figures and EM wrote the core text of the manuscript with assistance from LM and EH. All authors were involved in revisions of the manuscript. for the initial planning, experimental design, development of the concepts was developed by EM and LM. LM was responsible and overall supervision with assistance from ED and TH.
Conflict of Interest Statement
The authors declare that the research was conducted in the absence of any commercial or financial relationships that could be construed as a potential conflict of interest.
Acknowledgments
Funding based on research grant-aided by the Department of Communications, Energy and Natural Resources under the National Geoscience Programme 2007-2013. The views expressed in this study are the author's own and do not necessarily reflect the views and opinions of the Minister for Communications, Energy and Natural Resources. The authors acknowledge support of the HEA under PRTLI4 for licensing OSI Digital Imagery through the Ryan Institute. This work includes Ordnance Survey Ireland data reproduced under OSi License number NUIG220212. Unauthorized reproduction infringes Ordnance Survey Ireland and Government of Ireland copyright. © Ordnance Survey Ireland, 2012. The authors would like to thank the members of local government for data collection (particularly David Lenihan) and David Ball and Taly Hunter Williams for providing invaluable discussions on the manuscript. The authors would also like to thank David Ball for preparation of Figure 2 for this paper.
Supplementary Material
The Supplementary Material for this article can be found online at: https://www.frontiersin.org/articles/10.3389/fenvs.2018.00154/full#supplementary-material
Footnotes
1. ^Version 1.6-1. https://cran.r-project.org/web/packages/NADA/index.html (Accessed December 26, 2017).
References
Anderson, E., Harrison, S., Passmore, D. G., and Mighall, T. M. (2000). Holocene alluvial-fan development in the Macgillycuddy's Reeks, southwest Ireland. GSA Bull. 112, 1834–1849. doi: 10.1130/0016-7606(2000)112<1834:HAFDIT>2.0.CO;2
Andy, C. M., Fahnestock, M. F., Lombard, M. A., Hayes, L., Bryce, J. G., and Ayotte, J. D. (2017). Assessing models of arsenic occurrence in drinking water from bedrock aquifers in New Hampshire. J. Contemp. Water Res. Educ. 160, 25–41. doi: 10.1111/j.1936-704X.2017.03238.x
Anselin, L. (1995). Local indicators of spatial association – LISA. Geogr. Analysis 27, 93–115. doi: 10.1111/j.1538-4632.1995.tb00338.x
Anselin, L. (1996). “The Moran scatterplot as an ESDA tool to assess local instability in spatial association,” in Spatial Analytical Persepctives on GIS in Environmental and Socio-Economic Sciences, eds M. Fischer, H. J. Scholten, and D. Unwin (London: Taylor and Francis). 111–125.
Anselin, L., Syabri, I., and Kho, Y. (2006). GeoDa: an introduction to spatial data analysis. Geogr. Analysis 38, 5–22. doi: 10.1111/j.0016-7363.2005.00671.x
Ayotte, J. D. (2017). “Arsenic hazard and associated health risks: New England, USA aquifers,” in Best Practice Guide on the Control of Arsenic in Drinking Water, eds P. Bhattacharya, D. A. Polya, and D. Jovanovic (London: IWA Publishing). 141–151.
Ayotte, J. D., Belaval, M., Olson, S. A., Burow, K. R., Flanagan, S. M., Hinkle, S. R., et al. (2015). Factors affecting temporal variability of arsenic in groundwater used for drinking water supply in the United States. Sci. Total Environ. 505, 1370–1379. doi: 10.1016/j.scitotenv.2014.02.057
Ayotte, J. D., Montgomery, D. L., Flanagan, S. M., and Robinson, K. W. (2003). Arsenic in groundwater in eastern New England: occurrence, controls, and human health implication. Environ. Sci. Technol. 37, 2075–2083. doi: 10.1021/es026211g
Ayotte, J. D., Nielsen, M. G., Robinson, G. R. Jr., and Moore, R. B. (1999). Relation of Arsenic, Iron, and Manganese in Ground Water to Aquifer Type, Bedrock Lithogeochemistry, and Land Use in the New England Coastal Basins. Water-Resources Investigations Report 99-4162. United States Geological Survey, New Hampshire.
Ayotte, J. D., Nolan, B. T., and Gronberg, J. A. (2016). Predicting arsenic in drinking water wells of the Central Valley, California. Environ. Sci. Technol. 50, 7555–7563. doi: 10.1021/acs.est.6b01914
Ayotte, J. D., Nolan, B. T., Nuckols, J. R., Cantor, K. P., Robinson, J.r,., Baris, D., et al. (2006). Modelling the probability of arsenic in groundwater in New England as a tool for exposure assessment. Environ. Sci. Technol. 40, 3578–3585. doi: 10.1021/es051972f
Ayotte, J. D., Szabo, Z., Focazio, N. J., and Eberts, S. M. (2011). Effect of human-induced alteration of groundwater on concentrations of naturally-occurring trace elements at water-supply wells. Appl. Geochem. 26, 747–762. doi: 10.1016/j.apgeochem.2011.01.033
Baris, D., Waddell, R., Freeman, L. E. B., Schwenn, M., Cold, J. S., Ayotte, J. D., et al. (2016). Elevated bladder cancer in northern New England: the role of drinking water and arsenic. J. Natl. Cancer Inst. 108:djw099. doi: 10.1093/jnci/djw099
Bondu, R., Cloutier, V., Rosa, E., and Benzaazoua, M. (2016). A review and evaluation of the impacts of climate change on geogenic arsenic in groundwater from fractured bedrock aquifers. Water Air Soil Pollut. 227:6. doi: 10.1007/s11270-016-2936-6
Bräuner, C. V., Nordsborg, R. B., Andersen, Z. J., Tjønneland, A., Loft, S., and Raaschou-Nielsen, O. (2014). Long-term exposure to low-level arsenic in drinking water and diabetes incidence: a prospective study of the diet, cancer and health cohort. Environ. Health Perspect. 122, 1059–1065. doi: 10.1289/ehp.1408198
Bretzler, A., Berg, M., Winkel, L., Amini, M., Rodriguez-Lado, L., Sovann, C., et al. (2017a). “Geostatistical modelling of arsenic hazard in groundwater,” in Best Practice Guide on the Control of Arsenic in Drinking Water, eds P. Bhattacharya, D. A. Polya, and D. Jovanovic (London: IWA Publishing). 153–160.
Bretzler, A., Lalanne, F., Nikiema, J., Podgorski, J., Pfenninger, N., Berg, M., et al. (2017b). Groundwater arsenic contamination in Burkina Faso, West Africa: predicting and verifying regions at risk. Sci. Total Environ. 584–585, 958–970. doi: 10.1016/j.scitotenv.2017.01.147
Bruen, M. (2009). Hydrology and the water framework directive in Ireland. Biol. Environ. 109B, 207–220. doi: 10.3318/BIOE.2009.109.3.207
Carey, M. L., McPhail, D. C., and Taufen, P. M. (2003). Groundwater flow in playa lake environments: impact on gold and pathfinder element distribution in groundwaters surrounding mesothermal gold deposits, St. Ives area, Eastern Goldfields, Western Australia. Geochem. Explor. Envir. Analysis 3, 57–71. doi: 10.1144/1467-787302-045
Cole, G. A. G. (1922). Memoir and Map of Locations With Minerals of Economic Importance and Metalliferous Mines in Ireland. Memoirs of the Geological Survey of Ireland. Dublin: The Statutory Office, 155.
CSO (Central Statistics Office) (2011). Population of each Province, County and City, 2011. Available online at http://www.cso.ie/en/statistics/population/populationofeachprovincecountyandcity2011/ (Accessed, December 26, 2017).
de Caritat, P., and Kirste, D. (2005). Hydrochemistry applied to mineral exploration under cover in the Curnamona Province. MESA J. 37, 13–17.
DELG/EPA/GSI (1999). Groundwater Protection Schemes. (Dublin: Joint Publication of Department of the Environment and Local Government, Environmental Protection Agency and the Geological Survey of Ireland), 30.
Dokou, Z., Kourgialas, N. N., and Karatzas, G. P. (2015). Assessing groundwater quality in Greece based on spatial and temporal analysis. Environ. Monitor. Assess. 187, 774–790. doi: 10.1007/s10661-015-4998-0
Drummer, T. J. B., Yu, Z. M., Nauta, L., Murimboh, J. D., and Parker, L. (2015). Geostatistical modelling of arsenic in drinking water wells and related toenail arsenic concentrations across Nova Scotia, Canada. Sci. Total Environ. 505, 1248–1258. doi: 10.1016/j.scitotenv.2014.02.055
Environmental Protection Agency (EPA.). (2003). Towards Setting Guideline Values for the Protection of Groundwater in Ireland. Wexford: Environmental Protection Agency, 41.
Environmental Protection Agency (EPA.). (2013). Borehole Construction and Wellhead Protection. Advance Note No. 14. Wexford: Environmental Protection Agency, 36.
Erickson, M. L., and Barnes, R. J. (2005). Glacial sediment causing regional-scale elevated arsenic in drinking water. Ground Water 43, 796–805. doi: 10.1111/j.1745-6584.2005.00053.x
Erickson, M. L., and Barnes, R. J. (2006). Arsenic concentration variability in public water system wells in Minnesota, USA. Appl. Geochem. 21, 305–317. doi: 10.1016/j.apgeochem.2005.12.005
European Communities EC. (2007). European Communities (Drinking Water) (No.2) Regulations, S.I. No. 278 of 2007, pp. 34.
European Communities EC. (2010). European Communities Environmental Objective (Groundwater) Regulations, S.I. No. 9 of 2010, pp. 41.
European Communities EC. (2014). European Union (Drinking Water) Regulations, S.I. No 122 of 2014, pp. 34.
Fay, D., Kramers, G., Zhang, C., McGrath, D., and Grennan, E. (2007). Soil Geochemical Atlas of Ireland. Dublin: Teagasc and Environmental Protection Agency, 128.
Fitzsimons, V., Daly, D., Wright, G., and Williams, T. H. (2005). “Rock type versus fractures” – current understanding of Irish aquifers,” in Proceedings of the IAH (Irish Group) 25th Annual Groundwater Conference. International Association of Hydrogeologists (Irish Group), Dublin, 17–28.
Focazio, M. J., Welch, A. H., Watkins, S. A., Helsel, D. R., and Horn, M. A. (2000). A Retrospective Analysis on the Occurrence of Arsenic in Ground-Water Resources of the United States and Limitations in Drinking-Water-Supply Characterizations. United Stated Geological Survey, Virginia, Water-Resources Investigations Report 99-4279, 27.
Frederick, L., VanDerslice, J., Taddie, M., Malecki, K., Gregg, J., Faust, N., et al. (2016). Contrasting regional and national mechanisms for predicting elevated arsenic in private wells across the United States using classification and regression trees. Water Res. 91, 295–304. doi: 10.1016/j.watres.2016.01.023
FSAI (Food Safety Authority of Ireland) (2016). Metals of Toxicological Importance in the Irish Diet. Report of the Scientific Committee to the Food Safety Authority of Ireland. FSAI, Dublin, 64.
Geological Survey of Ireland GSI. (2005). Approach to Delination of Groundwater Bodies. Paper by the Working Group on Groundwater. Guidance Document No. GW2. Dublin: GSI, 18.
Gilliss, M. L., Al, T. A., Blowes, D. W., Hall, G. E. M., and MacLean, B. (2004). Geochemical dispersion in groundwater from a weathered Cu-Zn deposit in glaciated terrain. Geochem. Explor. Environ. Analysis 4, 291–305. doi: 10.1144/1467-7873/04-206
Gong, G., Mattevada, S., and O'Bryant, S. E. (2014). Comparison of the accuracy of kriging and IDW interpolations in estimating groundwater arsenic concentrations in Texas. Environ. Res. 130, 59–69. doi: 10.1016/j.envres.2013.12.005
Gronberg, J. A. M. (2011). Map of Arsenic in Groundwater of the United States. Reston, VA: United States Geological Survey.
Gross, E. L., and Low, D. J. (2013). Arsenic concentrations, related environmental factors, and the predicted probability of elevated arsenic in groundwater in Pennsylvania. United States Geological Survey Scientific Investigations Report 2012-5257. (Virginia), 46.
Helsel, D. (2012). Statistics for Censored Environmental Data Using Minitab and R. 2nd Ed. (Wiley), 324. doi: 10.1002/9781118162729
Helsel, D. R., and Hirsch, R. M. (2002). Statistical Methods in Water Resources. United States Geological Survey Techniques for Water-Resources Investigations, Book 4, Chapter A3. USGS, pp. 512.
Homoncik, S. C., MacDoland, A. M., Heal, K. V., Dochartaigh, B. É., and Ngwenya, B.T. (2010). Manganese concentrations in Scottish groundwater. Sci. Total Environ. 408, 2467–2473. doi: 10.1016/j.scitotenv.2010.02.017
Hoover, J., Gonzales, M., Shuey, C., Barney, Y., and Lewis, J. (2017). Elevated arsenic and uranium concentrations in unregulated water sources on the Navajo Nation, USA. Exposure Health 9, 113–124. doi: 10.1007/s12403-016-0226-6
Hossain, M. M., and Piantanakulchai, M. (2013). Groundwater arsenic contamination risk prediction using GIS and classification tree method. Eng. Geol. 156, 37–45. doi: 10.1016/j.enggeo.2013.01.007
Kapaj, S., Peterson, H., Liber, K., and Bhattacharya, P. (2006). Human health effects from chronic arsenic poisoning – a review. J. Environ. Sci. Health Part A 41, 2399–2428. doi: 10.1080/10934520600873571
Kennedy, G. W., and Drage, J. M. (2017). An Arsenic in Well Water Risk Map for Nova Scotia Based on Observed Patterns of Well Water Concentrations of Arsenic in Bedrock Aquifers. Nova Scotia Natural Resources, Open File Report ME 2017-003, Halifax, 35.
Kim, D., Miranda, M. L., Tootoo, J., Bradley, P., and Gelfand, A. E. (2011). Spatial modelling for groundwater arsenic levels in North Carolina. Environ. Sci. Technol. 45, 4824–4831. doi: 10.1021/es103336s
Klassen, R. A., Douma, S. L., Ford, A., Rencz, A., and Grunsky, E. (2009). Geoscience Modelling of Relative Variation in Natural Arsenic Hazard Potential in New Brunswick. Geological Survey of Canada. Current Research 2009-07 Canada, 9. doi: 10.4095/247834
Lee, L., and Helsel, D. (2005). Baseline models of trace elements in major aquifer of the United States. Appl. Geochem. 20, 1560–1570. doi: 10.1016/j.apgeochem.2005.03.008
Leybourne, M. I., and Cameron, E. M. (2010). Groundwater in geochemical exploration. Geochem. Explor. Environ. Analysis 10, 99–118. doi: 10.1144/1467-7873/09-222
Liesch, T., Hinrichsen, S., and Goldscheider, N. (2015). Uranium in groundwater – fertilizers versus geogenic sources. Sci. Total Environ. 536, 981–995. doi: 10.1016/j.scitotenv.2015.05.133
Lockwood, J. R., Schervish, M. J., Gurian, P. L., and Small, M. J. (2004). Analysis of contaminant co-occurrence in community water systems. J. Am. Stat. Assoc. 99, 45–56. doi: 10.1198/016214504000000061
Lydon, K., and Smith, G. (2014). CORINE Landcover 2012 Ireland: Final Report. Environmental Protection Agency, Wexford, 55.
McGrory, E. R., Brown, C., Bargary, N., Williams, N. H., Mannix, A., Zhang, C., et al. (2017). Arsenic contamination of drinking water in Ireland: a spatial analysis of occurrence and potential risk. Sci. Total Environ. 579, 1863–1875. doi: 10.1016/j.scitotenv.2016.11.171
McLeod, L., Bharadwaj, L., Epp, T., and Waldner, C. L. (2017). Use of principal components and kriging to predict groundwater-sourced rural drinking water quality in Saskatchewan. Int. J. Environ. Res. Public Health 14, 1065–1090. doi: 10.3390/ijerph14091065
Meehan, R. (2013). The Merging of Quaternary Map Datasets: End of Project Report. Geological Survey of Ireland, Dublin, 107.
Meehan, R., Pellicer, X., and Sheehy, M. (2014). Debris of the ice ages mapped out. Earth Sci. Ireland 15, 32–35.
Meliker, J. R., AvRuskin, G. A., Slotnick, M. J., Goovaerts, P., Schottenfeld, D., Jacquez, G. M., et al. (2008). Validity of spatial models of arsenic concentrations in private well water. Environ. Res. 106, 42–52. doi: 10.1016/j.envres.2007.09.001
Misund, A., Frengstad, B., Siewers, U., and Reimann, C. (1999). Variation of 66 elements in European bottled mineral waters. Sci. Total Environ. 243/244, 21–41. doi: 10.1016/S0048-9697(99)00307-1
Moon, K., Guallar, E., and Navas-Acien, A. (2012). Arsenic exposure and cardiovascular disease: an updated systematic review. Curr. Atheroscler. Rep. 14, 542–555. doi: 10.1007/s11883-012-0280-x
Moreau, M., Shand, P., Wilton, N., Brown, S., and Allen, D. (2004). Baseline Report Series: 12. The Devonian Aquifer of South Wales and Herefordshire. Report No. CR/94/185N. British Geological Survey, Keyworth, 65.
Ni wen, R. A., Ixer, R. A., Kinnaird, J. A., Ashworth, J. R., and Nex, P. A. (1999). Ore petrology and metamorphic mobilization of copper ores in red beds, SouthWest County Cork, Ireland. Trans. Inst. Mining Metallurgy Sec. B 108, 53–63.
Ó Dochartaigh, B. É., Smedley, P. L., MacDonald, A. M., and Darling, W.G. (2010). Baseline Scotland: Groundwater Chemistry of the Old Red Sandstone aquifers of the Moray Firth Area. Report No. OR/10/031. British Geological Survey (for the Environmental Agency), Keyworth, 86.
Ó Dochartaigh, B. É. Ó., Smedley, P. L., MacDonald, A. M., and Darling, W.G. (2006). Baseline Scotland: The Lower Devonian Aquifer of Strathmore. Report No. CR/06/250N. British Geological Survey, Keyworth, 60.
Paikaray, S. (2012). Environmental hazards of arsenic associated with black shales: a review on geochemistry, enrichment and leaching mechanism. Rev. Environ. Sci. Bio/Technol. 11, 289–303. doi: 10.1007/s11157-012-9281-z
Parnell, J., Brolly, C., Spinks, S., and Bowden, S. (2016). Selenium enrichment in Carboniferous Shales, Britain and Ireland: problem or opportunity for shale gas extraction. Appl. Geochem. 66, 82–87. doi: 10.1016/j.apgeochem.2015.12.008
Peters, S. C., and Burkert, L. (2008). The occurrence and geochemistry of arsenic in groundwater of the Newark basin of Pennsylvania. Appl. Geochem. 23, 85–98. doi: 10.1016/j.apgeochem.2007.10.008
Pracht, M. (1997). Geology of Kerry – Cork: A Geological Description to Accompany the Bedrock Geology 1:100,000 Scale Map Series, Sheet 21, Kerry – Cork. Geological Survey of Ireland, Dublin, 70.
Pracht, M., and Sleeman, A. G. (2002). Geology of West Cork: A Geological Description to Accompany the Bedrock Geology 1:100,000 Scale Map Series, Sheet 24, West Cork. Geological Survey of Ireland, Dublin, 79.
R Development Core Team (2017). R: A Language and Environment for Statistical Computing. Vienna: R Foundation for Statistical Computing. Available online at: www.R-project.org.
Ravenscroft, P. (2007). Predicting the Global Extent of Arsenic Pollution of Groundwater and its Potential Impact on Human Health. New York, NY: UNICEF, 71.
Ravenscroft, P., Brammer, H., and Richards, K. (2009). Arsenic Pollution: A Global Synthesis. West Sussex: Wiley-Blackwell, 588. doi: 10.1002/9781444308785
Rddad, L. (2017). Fixation and redistribution of arsenic during early and late diagenesis in the organic matter-rich members of the Lockatong Formation, Newark basin, USA: implications for the quality of groundwater. Atlant. Geol. 53, 253–268. doi: 10.4138/atlgeol.2017.010
Reimann, C., and Birke, M. (2010). Geochemistry of European Bottled Water. Stuttgart: Borntraeger Science Publishers, 268.
Reyes, F. A. P., Crosta, G. B., Frattini, P., Basirico, S., and Della Pergola, R. (2015). Hydrochemical overview and natural arsenic occurrence in groundwater from alpine springs (upper Valtellina, Northern Italy). J. Hydrol. 529, 1530–1549. doi: 10.1016/j.jhydrol.2015.08.029
Robins, N. S., and Misstear, B. D. R. (2000). Groundwater in the Celtic regions. Geol. Soc. Lond. 182, 5–17. doi: 10.1144/GSL.SP.2000.182.01.02
Rodríguez-Lado, L., Polya, D., Winkel, L., Berg, M., and Hegan, A. (2008). Modelling arsenic hazard in Cambodia: a geostatistical approach using ancillary data. Appl. Geochem. 23, 3010–3018. doi: 10.1016/j.apgeochem.2008.06.028
Rodríguez-Lado, L., Sun, G., Berg, M., Zhang, Q., Xue, H., Zheng, Q., et al. (2013). Groundwater arsenic contamination throughout China. Science 341, 866–868. doi: 10.1126/science.1237484
Ryan, P. C., Kim, J., Wall, A. J., Moen, J. C., Corenthal, L. G., Chow, D. R., et al. (2011). Ultramafic-derived arsenic in a fractured bedrock aquifer. Appl. Geochem. 26, 444–457. doi: 10.1016/j.apgeochem.2011.01.004
Ryan, P. C., West, D. P., Hattori, K., Studwell, S., Allen, D. A., and Kim, J. (2015). The influence of metamorphic grade on arsenic in metasedimentary aquifers: a case study from western New England, USA. Sci. Total Environ. 505, 1320–1330. doi: 10.1016/j.scitotenv.2014.05.021
Ryker, S. J. (2001). Mapping arsenic in ground water: a real need, but a hard problem. Geotimes Newsmagaz. Earth Sci. 46, 34–36.
Ryker, S. J. (2003). “Arsenic in ground water used for drinking water in the United States,” in Arsenic in Ground Water: Geochemistry and Occurrence, eds A. H. Welch and K. G. Stollenwerk (New York, NY: Kluwer Academic Publishers), 165–178. doi: 10.1007/0-306-47956-7_6
Sanders, A. P., Messier, K. P., Shehee, M., Rudo, K., Serre, M. L., and Fry, R. C. (2012). Arsenic in North Carolina: public health implications. Environ. Int. 38, 10–16. doi: 10.1016/j.envint.2011.08.005
Sevastopulo, G. D. (2009). “Carboniferous: Mississippian (Serpukhovian) and Pennsylvanian,” in The Geology of Ireland, eds C. H. Holland and I. S. Sanders (Dunedin), 267–294.
Shand, P., Cobbing, J., Tyler-White, R., Tooth, A., and Lancaster, A. (2003). Baseline Report Series: 9. The Lower Greensand of Southern England. Report No. CR/03/273N. British Geological Survey (for the Environmental Agency), Keyworth, 63.
Sleeman, A. G., and Pracht, M. (1999). Geology of The Shannon Estuary: A Geological Description to Accompany the Bedrock Geology 1:100,000 Scale Map Series, Sheet 17, The Shannon Estuary. Dublin: Geological Survey of Ireland, 77.
Smedley, P. L., and Kinniburgh, D. G. (2013). “Arsenic in groundwater and the environment,” in Essentials of Medical Geology: Revised Edition, eds O. Selinus, B. Alloway, J. A. Centeno, R. B. Finkelman, R. Fuge, U. Lindh, P. Smedley (Dordrecht: Springer), 279–310. doi: 10.1007/978-94-007-4375-5_12
Smedley, P. L., Knudsen, J., and Maiga, D. (2007). Arsenic in groundwater from mineralised Proterozoic basement rocks in Burkina Faso. Appl. Geochem. 22, 1074–1092. doi: 10.1016/j.apgeochem.2007.01.001
Stea, F., Bianchi, F., Cori, L., and Sicari, R. (2014). Cardiovascular effects of arsenic: clinical and epidemiological findings. Environ. Sci. Pollut. Res. 21, 244–251. doi: 10.1007/s11356-013-2113-z
Tesoriero, A. J., Gronberg, J. A., Juckem, P. F., Miller, M. P., and Austin, B. P. (2017). Predicting redox-sensitive contaminant concentrations in groundwater using random forest classification. Water Resourc. Res. 52, 7316–7331. doi: 10.1002/2016WR020197
Tsuji, J. J. S., Perez, V., Garry, M. R., and Alexander, D. D. (2014). Association of low-level arsenic exposure in drinking water with cardiovascular disease: a systematic review and risk assessment. Toxicology 323, 78–94. doi: 10.1016/j.tox.2014.06.008
Van Halem, D., Bakker, S. A., Amy, G. L., and van Dijk, J. C. (2009). Arsenic in drinking water: a worldwide water quality concern for water supply companies. Drinking Water Eng. Sci. 2, 29–34. doi: 10.5194/dwes-2-29-2009
Verplanck, P. L., Mueller, S. H., Goldfarb, R. J., Nordstrom, D. K., and Youcha, E. K. (2008). Geochemical controls of elevated arsenic concentrations in groundwater, Ester Dome, Fairbanks district, Alaska. Chem. Geol. 255, 160–172. doi: 10.1016/j.chemgeo.2008.06.020
Welch, A., Ryker, S., Helsel, D., and Hamilton, P. (2001). Arsenic in ground water of the United States: an overview. Water Well J. 2, 30–33.
Winkel, L., Berg, M., Amini, M., Hug, S. J., and Johnson, C. A. (2008). Predicting groundwater arsenic contamination in Southeast Asia from surface parameters. Nat. Geosci. 1, 536–542. doi: 10.1038/ngeo254
Yang, Q., Jung, H. B., Culbertson, C. W., Marvinney, R. G., Loiselle, M. C., Locke, D. B., et al. (2009). Spatial pattern of groundwater arsenic occurrence and association with bedrock geology in greater Augusta, Maine. Environ. Sci. Technol. 43, 2714–2719. doi: 10.1021/es803141m
Yang, Q., Jung, H. B., Marvinney, R. G., Culbertson, C. W., and Zheng, Y. (2012). Can arsenic occurrence rates in bedrock aquifers be predicted? Environ. Sci. Technol. 45, 2080–2087. doi: 10.1021/es203793x
Zhang, C., Fay, D., McGrath, D., Grennan, E., and Carton, O. T. (2008a). Statistical analyses of geochemical variables in soils of Ireland. Geoderma 146, 378–390. doi: 10.1016/j.geoderma.2008.06.013
Zhang, C., Luo, L., Xu, W., and Ledwith, V. (2008b). Use of local Moran's I and GIS to identify pollution hotspots of Pb in urban soils of Galway, Ireland. Sci. Total Environ. 398, 212–221. doi: 10.1016/j.scitotenv.2008.03.011
Keywords: arsenic, geology, spatial analysis, groundwater, iron, manganese
Citation: McGrory E, Holian E, Alvarez-Iglesias A, Bargary N, McGillicuddy EJ, Henry T, Daly E and Morrison L (2018) Arsenic in Groundwater in South West Ireland: Occurrence, Controls, and Hydrochemistry. Front. Environ. Sci. 6:154. doi: 10.3389/fenvs.2018.00154
Received: 31 August 2018; Accepted: 03 December 2018;
Published: 18 December 2018.
Edited by:
Prosun Bhattacharya, Royal Institute of Technology, SwedenReviewed by:
Ratan Kumar Dhar, City University of New York, United StatesBarbora Doušová, University of Chemistry and Technology in Prague, Czechia
Copyright © 2018 McGrory, Holian, Alvarez-Iglesias, Bargary, McGillicuddy, Henry, Daly and Morrison. This is an open-access article distributed under the terms of the Creative Commons Attribution License (CC BY). The use, distribution or reproduction in other forums is permitted, provided the original author(s) and the copyright owner(s) are credited and that the original publication in this journal is cited, in accordance with accepted academic practice. No use, distribution or reproduction is permitted which does not comply with these terms.
*Correspondence: Liam Morrison, liam.morrison@nuigalway.ie