Geogenic Arsenic and Microbial Contamination in Drinking Water Sources: Exposure Risks to the Coastal Population in Bangladesh
 Ratnajit Saha
 Nepal C. Dey
 Mahfuzar Rahman
 Prosun Bhattacharya
 Golam H. Rabbani6
- 1School of Science and the Environment, Memorial University of Newfoundland-Grenfell Campus, Corner Brook, NL, Canada
- 2BRAC Research and Evaluation Division, Dhaka, Bangladesh
- 3JPG School of Public Health, BRAC University, Dhaka, Bangladesh
- 4KTH-International Groundwater Arsenic Research Group, Department of Sustainable Development, Environmental Science and Engineering, KTH Royal Institute of Technology, Stockholm, Sweden
- 5Faculty of Health, Engineering and Sciences, International Centre for Applied Climate Science, School of Civil Engineering and Surveying, University of Southern Queensland, Toowoomba, QLD, Australia
- 6Department of Public Health and Informatics, Bangabandhu Sheikh Mujib Medical University, Dhaka, Bangladesh
The study aimed to investigate the most usable drinking water sources quality and the dependent population's exposure to potentially contaminated water. The specific area chosen for the study was the coastal area in Satkhira district's Tala Upazila. Six hundred and fourty nine most usable drinking water sources were selected, that included Deep Tubewell (DTW), Shallow Tubewell (STW) and Pond Sand Filter (PSF) for drinking water sampling. Following standard sampling procedures, in-situ measurements were taken for seven important water quality parameters: Arsenic-As, Iron-Fe, Electrical Conductivity-EC, Temperature-Temp, Total Coliform- TC, E-coli, and Fecal Coliform-FC. In addition, semi-structured questionnaire surveys were conducted at corresponding dependent households (HH). Weighted arithmetic water quality index (WQI) was used to calculate the suitability of the derived water for drinking purposes. In the tested water sources, As, Fe and EC range were found 0–500 μg/L, 0–18 mg/L, and 165–8,715 μS/cm, respectively. Of all the tested water sources, 74% exceeded the permissible limit for As, 83% for Fe and 99% for EC, according to WHO standards. Comparatively higher percentages of Point of Uses (PoU) were found to be more contaminated than Point of Sources (PoS), such as TC found in 38% PoS and 54% of corresponding PoU, E. coli found in 24% PoS and 35% of PoU and FC found in 45% PoS and 55% of PoU. WQI suggested that the majority (72%) of most usable drinking water sources were found to be unsuitable for drinking. Thus, 40% of the population (0.12 million) in the study area were directly consuming contaminated water. Dependent household members most frequently suffered from fever, diarrhea and high blood pressure, resulting in the average household spending USD 3–13 per month/HH for health-related expenditures, which is higher than national average. To acquire safe drinking water, the majority (58%) of the dependent HH expressed willingness to pay USD 1 per month/ HH which is costly for them. The situation can be improved by installing a deep tube well for safe drinking water, periodically testing the water quality, educating the public for better hygiene practices, and providing entrepreneurial incentives to help deliver safe water to the public at lower cost.
Introduction
The hydrological system in the coastal area is influenced by seawater and hydro-geochemical processes that are leading to deteriorating drinking water quality in groundwater systems (Chidambaram et al., 2018). In the tidal delta plain of south-western Bangladesh, high salinity and Arsenic (As) concentrations in groundwater is a widespread problem (Ayers et al., 2016). Safe drinking water is one of the most essential requirements for a healthy population of people (Hossain et al., 2014). Groundwater is the principal source of potable drinking water for a significant percentage of the world' population, groundwater is considered safer to drink in comparison to surface water (Singh et al., 2012). Groundwater is also an important natural resource for domestic and industrial water supply as well as agricultural purposes (Shrivastava et al., 2014). In Bangladesh, about 130 million people (97% of total population) obtain water from 10 million tube wells (TW) (Mukherjee and Bhattacharya, 2001; van Geen et al., 2003; Yu et al., 2003; Hossain et al., 2014). Most of the people are often drinking untreated groundwater, which is a critical public health risk. Therefore, providing a solution for safe and drinkable groundwater in Bangladesh is an environmental health issue of the highest priority (Bhattacharya et al., 1997). In several Asian countries, including Bangladesh and West Bengal (an adjacent Indian state), toxic elemental (e.g., As) concentration in groundwater and its impact on human health has been widely researched (Bhattacharya et al., 2002; Yu et al., 2003; van Geen et al., 2008; Das et al., 2009; Shrivastava et al., 2014; Ghosh et al., 2017), and it is considered the largest and most important societal and environmental problem in this region of the world at the current time (Kapaj et al., 2006).
Groundwater with high concentrations of geogenic arsenic (As) occurs naturally (Kapaj et al., 2006) and extensively in the Holocene alluvial aquifers of Bangladesh (von Brömssen et al., 2006). Biogeochemical and hydrologic processes at these groundwater sites are presently affecting human activity (Fendorf et al., 2010), as carcinogenic levels of dissolved As are seeping into the groundwater system (van Geen et al., 2008). High As concentration in groundwater is recognized as a severe environmental problem in many parts of the world, because of the potential risk when consumed. An estimated 150 million people in more than 70 countries around the world are at risk of developing serious health problems due to high As concentration in their drinking water (Rahman et al., 2000; Bhattacharya et al., 2002; Ravenscroft et al., 2005; Ahmed et al., 2006; Kapaj et al., 2006). Bangladesh is one of the most severely affected countries from As contamination because most of the population depends on groundwater as their main sources of drinking water, domestic water supplies, and other vital areas. Because of this, As has been identified as a serious public health concern in affected areas, such as Bangladesh (Lokuge et al., 2014; Hossain, 2015). A national survey conducted by BBS/UNICEF (2011) in 2009 reported that about half of the population (53 million) in Bangladesh are exposed to elevated As concentration in their drinking water from groundwater systems found in 322 upazilas under 61 districts (out of 64 total districts) in Bangladesh. In Bangladesh and West Bengal, high As concentrations occur most commonly in shallow aquifers at depths <100 m (Bhattacharya et al., 1997; Ahmed et al., 2004; Biswas et al., 2014; Hossain et al., 2015; Mahmud et al., 2017). Several actions have already been taken to provide access to safe drinking water in As contaminated areas of Bangladesh through the installation of tube wells (TWs) at targeted deeper depth aquifer (von Brömssen et al., 2006). Most of the tube wells are classified as deep tube well (DTW) because their depth typically goes beyond 150 m. TW water has been shown to significantly reduce the incidence of diarrheal diseases and sub-sequent mortality in Bangladesh, because it provides access to water with a lower concentration of As (Dey et al., 2017b). TW water has achieved remarkable success in the supply of safe drinking water (Hossain et al., 2015), even though in many areas, people are still using As contaminated well water for drinking. Escherichia coli (E. coli) and thermo-tolerant (Fecal) coliforms (FC) bacteria are index organisms as microbial contaminants in drinking water. Measures of E. coli and FC in drinking water are important indicators for fecal contamination, water borne pathogens, and the level of health risk in drinking water (Gruber et al., 2014). Additionally, Water Quality Index (WQI) is one of the most effective tools used to determine the suitability of drinking water. WQI uses a rating reflection of composite influence of different water quality parameters. The calculated rating value is used to classify water quality and contamination level in both surface and groundwater. WQI was first developed by Horton in 1965. Since then, this tool has been used as a comprehensive guideline for water resource management and policies (Yisa and Jimoh, 2010).
The southern part (coastal areas) of Bangladesh (approximately 29,000 km2) makes up about 20% of Bangladesh's total land area. This coastal area is specially affected by high tidal waters, salinity intrusions, and cyclones/storm surges, etc. (MoWR, 2005). Saline water intrusions significantly affect the hydro-chemical composition of aquifer water (Chidambaram et al., 2018), and 53% of the aquifers in the coastal region of Bangladesh are affected by Bay of Bengal—saline water intrusion (MoFDM, 2005). As well as that, shallow aquifers in Meghna river basins and coastal plains are extremely As enriched, as more than 80% TW are considered As contaminated (Ahmed et al., 2004). Particularly in the Southern part of Bangladesh, As concentration in shallow tube wells are uniformly higher in comparison to other regions of Bangladesh (van Geen et al., 2008). High Fe concentration, turbidity and bacterial contamination are associated with water sources found in the South-western coastal areas of Bangladesh. Contaminated water negatively impacts many species' interactions in the food web of the aquatic ecosystem and the people's public health. According to WHO (2009), about 80% of human diseases are caused by contaminated water. Excessive As and salinity levels in groundwater contaminates drinking water sources and adversely affects human health, especially people living in the floodplain of the Ganges delta (Ravenscroft et al., 2005; Mahmud et al., 2017).
In recent years, the coastal areas of Bangladesh have been experiencing safe water scarcity and the deterioration of drinking water quality (Saha et al., 2018). Many inhabitants are dependent on a single water source for drinking water, because many other nearby sources have become contaminated through natural and anthropogenic influences. The severity is more severe in the deltaic and alluvial deposits in the Southern coastal part of Bangladesh. In the study area, high salinity, As and Fe in groundwater were the major water quality contaminants found in drinking water (Mahmud et al., 2017). Drinking water quality found from the most popular drinking water sources in the study area were not properly identified (Javed et al., 2014). To secure public health, precise and appropriate information needs to be collected following standard procedure (Talawat and Chandel, 2008). The overall aim of the study was to investigate the quality of drinking water in the most usable point of sources and to estimate the portion of the population that may be under threat from toxic elements and coliform bacteria found in their drinking water. The study's findings should provide sufficient and complete information about the drinking water quality in the most usable PoS, which will help in formulating necessary recommendations to identify alternative options for safe supply of water in the study area.
Materials and Methods
The Study Area
Tala Upazila of Bangladesh's Satkhira district was selected as the study area. The exact location of the study area is in the Southwest coastal area of Bangladesh (22°35′0″ to 22°50′0″ N and 89°5′0″ to 89°20′0″ E). The total population of the study area is around 0.3 million (three hundred thousand), or 72,465 households with an average of five household members. The literacy rate of the study area is 50.9% for people 7 years and older, which is significantly low (BBS, 2014).
Criteria for Selecting Drinking Water Sources for Sampling
A total of 649 of the most frequently used drinking water point of sources (PoS), including Deep Tubewell (DTW), Shallow Tubewell (STW) and Pond Sand Filter (PSF), were selected for water sampling. These PoS were selected from 50,819 operative water sources, of which 31,624 sources were being used for drinking purposes (C3ER, 2015). Some specific criteria were used to select the PoS. These were: (1) Must be operating full year round (Jakariya et al., 2007), (2) At least 20 households (HH) must depend on the water source, and (3) The water source must be mainly used for drinking purposes. Additionally, drinking water samples from point of use (PoU) of the corresponding dependent 260 HHs' were collected for microbial analysis. Each of the selected PoS for water sampling was being used by at least 20 to 1,000 HHs. Selected PoS were classified into four categories: low (11–20 HHs), moderate (21–50 HHs), high (51–100 HHs), and very high (101–1,000 HHs) use of drinking water sources. The locations of sampling points for PoS and PoU are shown in Figure 1.
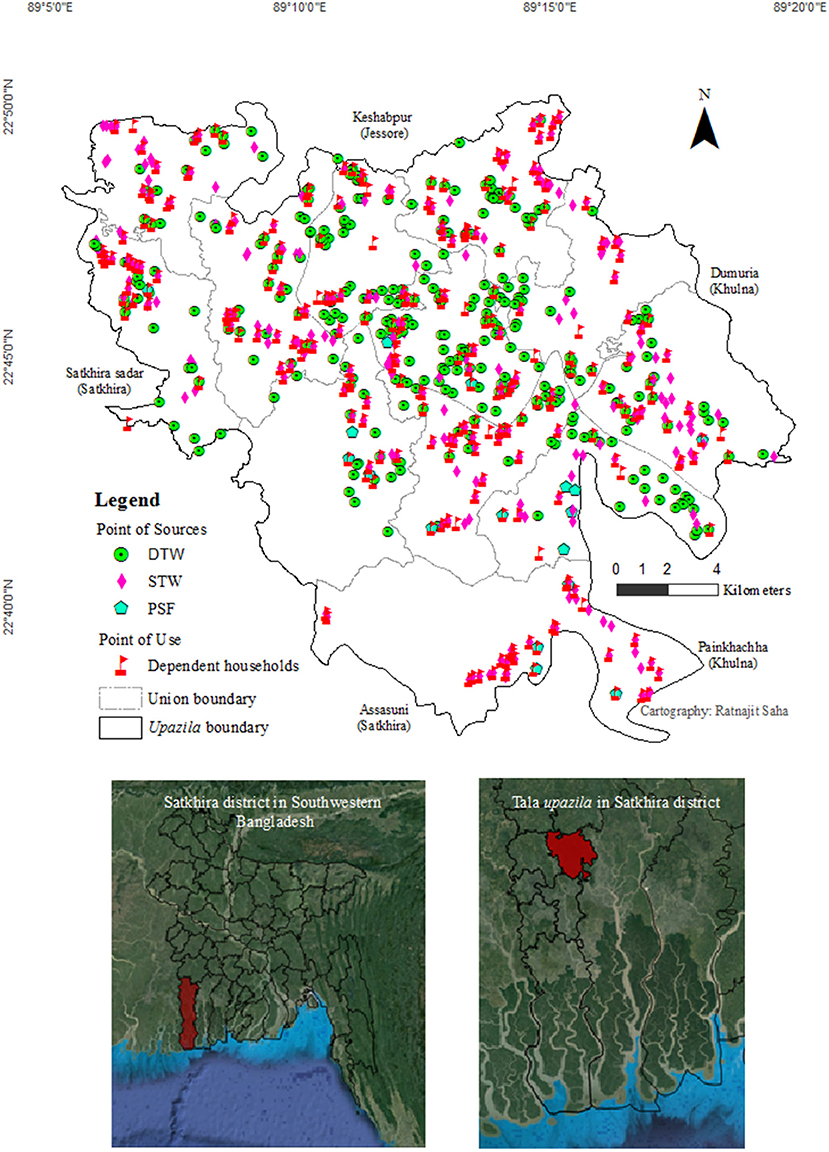
Figure 1. Location of water sampling PoS and corresponding PoU in Tala upazila of Satkhira district in Southwestern Bangladesh.
Water Sampling and Testing of Water Quality Parameters
Water samples were collected between August and September 2015 from selected 649 PoS. TW water (groundwater) samples were collected from a final output device, after the well was purged for the first 2 min by hand pumping. PoU water samples were collected from the last used drinking water glasses. Seven important water quality parameters: Temperature (Temp), Electrical Conductivity (EC), Total Iron (Fe), Arsenic (As), Total Coliform (TC), E. coli, and Fecal Coliform (FC) were tested in both PoS and PoU. Distribution of tested water quality parameters in different water sources has been described in Table 1. Temp, EC, Fe and As measurements were done at the sampling site at PoS. Coliform bacteria (TC, E. coli, FC) were tested for both PoS and PoU water samples. To analyze TC, E. coli, and FC in the laboratory, each water sample was collected in a transparent, white color, clean and sterilized 500 ml plastic bottle. Each bottle was immediately kept into a cooling box at below 4°C to maintain the quality of water sample. The indicator organism (bacteria colony) were counted in 100 mL water samples and this was completed in the laboratory. Portable field test kits and standard scientific methods were used to measure water quality parameters. Coliform colonies were counted in the laboratory. Temp and EC were measured using a Pocket Pro High Range Conductivity Tester (Product #9531400; HACH Co. USA), detection limit 0–50°C for Temp and 0–1,990 μS/cm for EC (resolution: 1 μS/cm); Fe by using Iron Test Kit (IR-18, #146400, color disc 92799; HACH Co. USA), detection limit 0–5 mg/L; As by using Hach EZ Arsenic Test Kit (Test Strip (EZ), Dual Range, #2822800; HACH Co. USA), detection limit 0–4,000 μg/L, and Coliform Bacteria (TC, E. coli, and FC) by using a Portable Microbiology Test Kit (Membrane Filtration Technique; HACH Co. USA), sensitivity 1 CFU/mL and indicator organism (bacteria colony) were counted in 100 mL water sample. For EC, Fe and Coliform Bacteria measurement, some samples were diluted with distilled water because of high concentration and, after analysis, the obtained value was multiplied by the dilution factor (Saha et al., 2018).
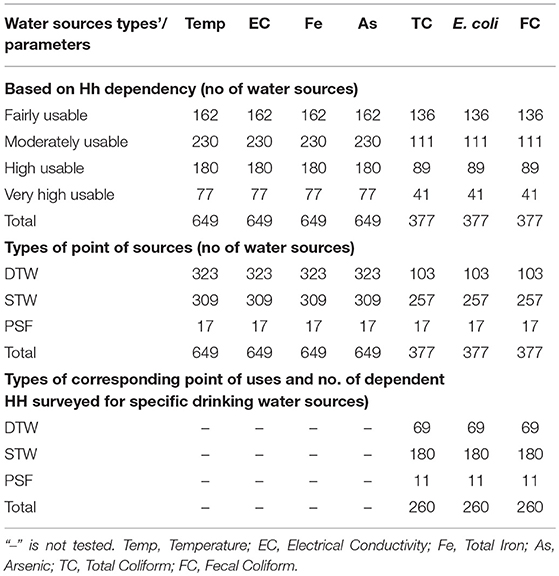
Table 1. Distribution of tested drinking water sources, water quality parameters and no. of surveyed dependent HH.
WQI Calculation
Weighted arithmetic index method was used to calculate WQI (Yisa and Jimoh, 2010), as shown below:
qi = (Ci/Si) × 100, where qi, Ci, Si indicated quality rating scale, concentration of ith parameter and standard value of ith parameter, respectively.
Relative weight (Wi) was calculated by the value inversely proportional to standard (Si) value of the parameter: Wi = 1/Si.
The overall WQI was calculated by aggregated quality rating (qi) with unit weight (Wi), and that was divided by the aggregated unit weight (Wi) value using the relation (Yisa and Jimoh, 2010) as seen below:
WQI was calculated at only most frequently used drinking water sources (649 PoS), considering seven important drinking water quality parameters (Temp, EC, Fe, As, TC, E. coli, and FC) followed by the WHO drinking water guideline (Saha et al., 2018). Individual water quality parameters and the drinking water source's WQI were computed.
Dependent Household Survey
A semi-structured questionnaire survey was conducted in the corresponding dependent 260 HHs (Table 1). HH survey was conducted during sampling from the selected different types of drinking water sources. Major contents of the questionnaire addressed Section 1: General information of water sources and household locations; Section 2: Household disease and socio-economic status (income and health expenditure); Section 3: Drinking water condition and willingness to pay; and Section 4: Water quality test result (laboratory test result of coliform bacteria for the specific households) (Supplementary Data Sheet).
Several steps were followed to calculate the number of HH and identify the HHs regarding specific water sources (Table 1 described the below listed numbers):
1. A total 649 most usable PoS were identified for sampling in the study area
2. Temp., EC, Fe and As were tested at 649 PoS including DTW, STW and PSF (Supplementary Table 1)
3. TC, E. coli, and FC were tested at 377 PoS (out of 649 PoS) that was 58% of total PoS
4. TC, E. coli, and FC were tested at 260 corresponding PoU (Supplementary Table 2) that was 68% of the PoS where coliform bacteria were tested
5. That corresponding 260 HH were surveyed where 69 HH (67%) were selected out of 103 DTW dependent HH, 180 HH (70%) were selected out of 258 STW dependent HH and 11 HH (65%) were surveyed out of 17 PSF dependent HH
6. Based on the above specification, households were selected randomly for survey.
Standardization of Reference Values
Seven important water quality parameters were analyzed to determine the concentration levels. These parameters were compared with the WHO and Bangladesh Drinking Water Standards (BDWS) values to calculate the number of water sources that failed to meet drinking water standards. Selected TWs for drinking water sampling were classified into two types: one is DTW (depth ≥ 150 m), and the other is STW (depth ≤ 150 m) (Ahmed et al., 2004). According to WHO and BDWS guideline, the limit values for drinking water quality parameters were, respectively, 10 and 50 μg/L for As; 0.3 and 1.0 mg/L for Fe; 250 and 600 μS/cm for EC; 25°C for Temp; 0 CFU/100 mL for TC, 0 CFU/100 mL for E. coli and 0 CFU/100 mL for FC (for Coliform Bacteria WHO and BDWS were same) (Singh et al., 2012; Gruber et al., 2014; Hossain et al., 2015; Akter et al., 2016). Yisa and Jimoh (2010) categorized WQI values into five types: excellent (<50), good (50–100), poor (101–200), very poor (201–300), and unsuitable (>300) for drinking.
Descriptive Statistical Analysis
Descriptive statistical analysis (range, mean, standard deviation, and frequency distribution), WHO BDWS experimental values and matrix of linear correlation were calculated and compared to test the interrelationship among each of the water quality parameters. The calculation and comparisons were completed using STATA 12.0. ArcGIS 10 was used for preparing the location map and indicating the sampling points in the study area. Calculation of WQI and potential exposure number of the population and the respective tables, graphs, and figures were prepared using Microsoft Office Excel 2013 (Saha et al., 2018).
Results
Water Quality Status at the PoS
Water temperature ranged from 25.8 to 36.6°C (SD ± 1.38), meaning every water source in the study area failed meeting the WHO and BDWS standard (Table 2). The range of Electrical Conductivity (EC) was found to be between 165 and 8,715 μS/cm (mean 2494.14), with very high variability (SD ± 2192.95). All tested PoS exceeded WHO standards, and according to BDWS, 96% of all water sources crossed the recommended value for drinking. In terms of addressing Fe in drinking water sources, the range was found to be 0–18 mg/L (mean 3.07), with variation among the sources being not so high (SD ± 2.90). According to WHO and BDWS, most water sources (83 and 61%, respectively) failed to meet drinking water standards. In all of the tested usable drinking water sources, minimum and maximum As concentration was found to be between 0 and 500 μg/L (mean 61.69), and the variation of tested results was found to be quite high (SD ± 67.66). According to WHO standard, three-fourths (74%) of the most frequently used drinking water sources were found to be As contaminated, but according to BDWS standards, only 36% of the water sources exceeded the permissible limit of As concentration for drinking water. The permissible limit for Coliform bacteria (TC, E. coli, and FC) were the same, according to both WHO and BDWS standards. The range of TC was found to be 0–208 CFU/100 mL, with high variability (SD ± 32.67), and 38% of the tested water sources exceeded BDWS. Based on HH dependency, a comparatively higher proportion of low (30%) and moderate (40%) usable water sources, almost all PSF and half of STW (50%) failed to meet safe TC level. E. coli was found in all types of sources with the range 0–160 CFU/100 mL, variability wasn't found to be very high (SD ± 15.79) and 24% of all drinking water sources exceeded the permissible E. coli limit. The majority of STW (60%) and low usable (50%) drinking water sources contained E. coli. Besides, FC bacteria test results indicated that 45% of all water sources were contaminated, with the FC range being found to be 0–212 CFU/100 mL, with wider variability (SD ± 44.97) amongst water sources. Almost all low and moderately usable water sources and most of the STW water sources were found to contain FC bacteria.
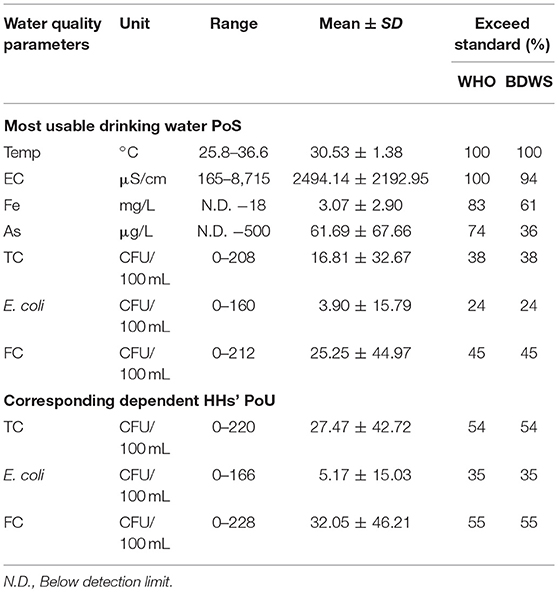
Table 2. Basic statistics of water quality parameters in PoS and PoU.
Toxic Elements and Coliform Bacterial Contamination Pathways From PoS to PoU
In the study area, the people did not typically treat their water before drinking. Thus, if PoS were contaminated by high elemental concentration and coliform bacteria, then dependent HHs will be likely exposed to contaminated water. In all the PoU, the range of TC was found to be between 0 and 220 CFU/100 mL (mean 27.47) (Table 2), and the proportion of contaminated PoU (54%) was found to be much higher than the corresponding PoS (38%) (Figure 2). The minimum and maximum value of E. coli in PoU were found to be 0–166 (mean 5.17), while variation of E. coli was to be not very high. E. coli contaminated PoU (35%) were found to be slightly higher than the corresponding value for PoS (24%). As well, in all the dependent HH's PoU, FC range was found to be between 0 and 228 CFU/100 mL (mean 32.05), with high variability and percentages of contaminated PoU (55%) found to be slightly higher than the corresponding contaminated PoS (45%).
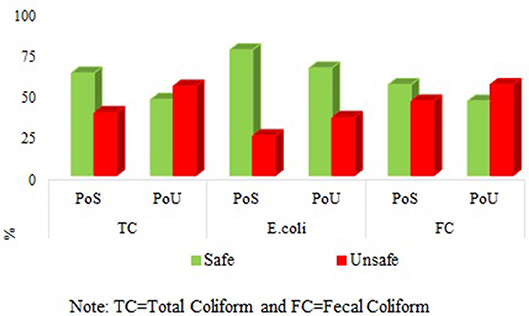
Figure 2. Contamination pathway of Coliform bacteria from PoS to PoU. TC, Total Coliform; FC, Fecal Coliform.
Relationship Among Water Quality Parameters
Simple correlation co-efficient was determined to find the degree of association amongst the seven water quality parameters within PoS and the coliform bacterial interrelationship between PoS and PoU. In PoS, weak positive relationships existed among Fe and As; E. coli and TC; FC and TC. Good positive correlations were found between TC and E. coli; TC, and FC (Table 3). Furthermore, for both PoS and corresponding PoU, a weak positive relationship was observed among TC, E. coli, and FC. Noticeable positive correlations were found between PoS TC and PoU TC; and also PoS TC and PoU FC (Table 4).
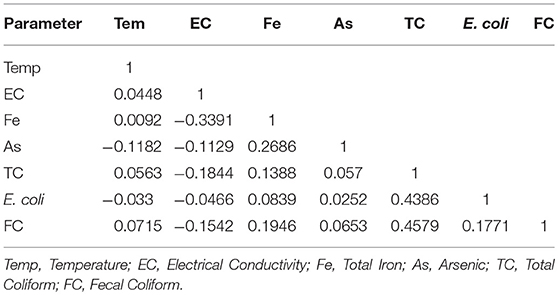
Table 3. Pearson correlations among different water quality parameters at PoS (Obs 377).
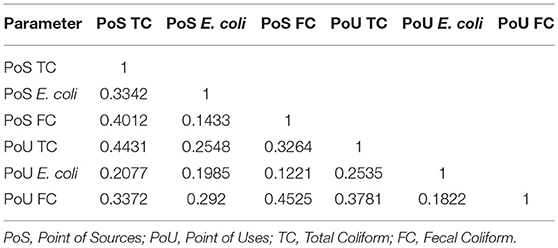
Table 4. Pearson correlations among different coliform bacteria at PoS and corresponding PoU (Obs 260 in both side).
WQI Calculation at Most Usable Drinking Water Sources
At the time of WQI calculation, it was assumed that all of the seven parameters had an influence on the determined WQI value. However, high WQI value were found to be mainly caused by high concentrations of As, Fe and EC. The range for calculated WQI values was found to be between 0.8 and 7,352 (mean 200), and the individual parameter wise range of computed values in different steps are described in Table 5. In all the tested water sources, 89 (14%) were determined as excellent, 90 (14%) as good, 41 (6%) as poor, 27 (4%) as very poor and 402 (62%) as unsuitable for drinking. HH dependency basis analysis suggested that excellent to good and poor to unsuitable water sources were found to be, respectively, 10 and 90% in low dependent water sources, 30% and 70% in moderately dependent water sources, 32 and 68% in high dependent water sources, and lastly 45 and 55% in very high dependent drinking water sources (Figure 3). According to the type of water sources, more than half of DTW (52%) were found to be good to excellent and almost all STW (98%) and PSF (94%) were found to be poor to unsuitable drinking water sources.
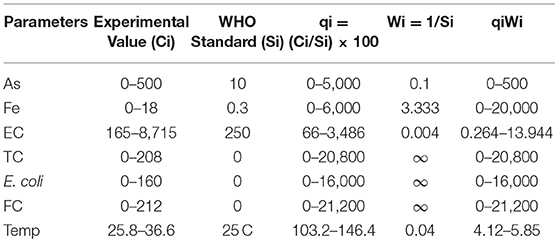
Table 5. Range of computed value in different steps during WQI calculation in tested PoS.
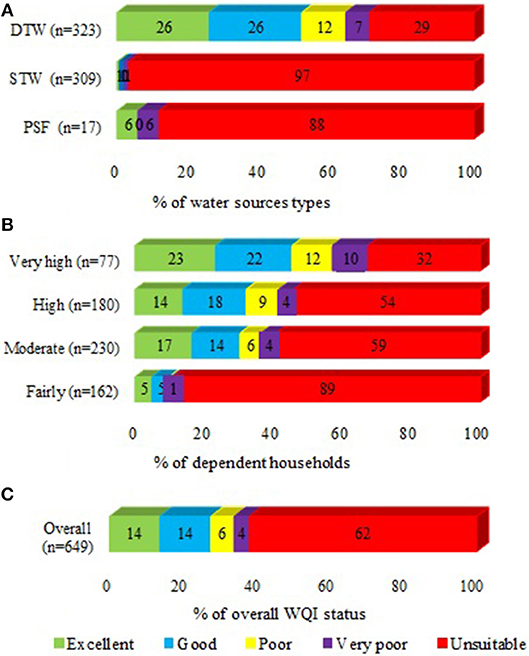
Figure 3. Classification of WQI in PoS based on HH dependency and types of water sources: (A) % of water sources types, (B) % of dependent HH, and (C) % of overall WQI status.
Population Exposed to Potential Health Risk and Mitigation
According to WQI, the most frequently used PoS were found to be poor to unsuitable for drinking, and HH dependency basis calculation suggested that about 0.12 million people (40% population of the study area) were directly consuming contaminated water (Table 6). As a consequence, a massive number of the population are at a potential health risk for acute and chronic waterborne diseases. Dependent HH survey results indicated that, in the last 15 days of survey date, HH members most frequently suffered from fever, diarrhea, dysentery, colds, and high blood pressure. Dependent HH regularly spend a significant amount of money (USD 3–13 per month/HH) for health-related expenditures, even though about half of HHs were struggling financially, living on monthly incomes <USD 70 and annual incomes < USD 850). Besides, 164 (63%) surveyed HH (out of 260 HH) considered themselves as poor and ultra-poor, comparing other HHs in their village. To acquire safe drinking water, most of the dependent HH population (62%) expressed willingness to pay for safe drinking water. Among the HHs whom expressed willingness to pay, 58% HH said they would be willing to pay up to USD 1 per month/HH, while 20% of HHs said they would be willing to pay up to USD 2.6 per month/HH. Dependent HHs were also searching for various facilities to purchase safe drinking water, such as going to piped water facilities and carrying bottled or canteen water back to their home. Some HH sought to collect safe water from a fixed place.
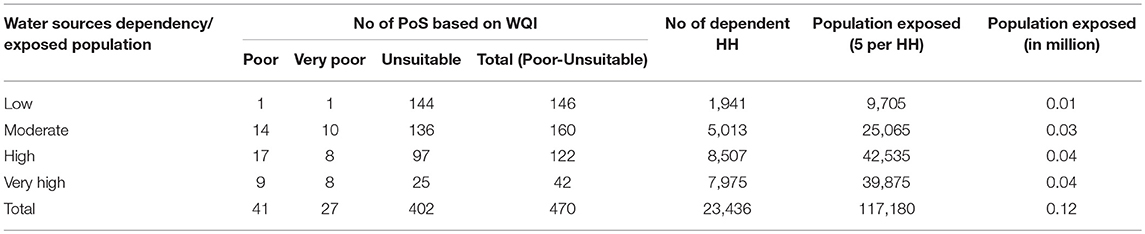
Table 6. Calculation of population exposed to potential water borne diseases in study area.
Discussion
In the study area, groundwater systems contained a high concentration of As, salinity, and iron. There is an increasing scarcity of safe drinking water sources, and an increasing number of people are depending on a single drinking water source for drinking uncontaminated water, because nearby drinking water sources were found to be chemically (As, Fe, EC, etc.) or microbiologically (TC, E. coli, and FC) contaminated.
Temperature is an important indicator of physic-chemical and biological activities of drinking water (Morrison et al., 2001). In the present study, drinking water temperature of tested sources were not found so high. If the water temperature elevated to 25°C or above, then the temperature could significantly affect the solubility of dissolved oxygen and amplify the taste and odor of drinking water (Singh et al., 2012). Electrical Conductivity (EC) is a good measure of dissolved solids in water. EC depends on the concentration of ions and nutrients in the water. Purer drinking water generally has a comparatively low EC value (100–2,000 μS/cm) (Ijeh and Udoinyang, 2013; Cronin et al., 2017). In the study area, almost all the drinking water sources failed to meet the drinking water standard for EC, with the data found also containing a high range. In a recent study (Dey et al., 2018), it was found that, in the coastal area of South-west Bangladesh, over 94% of TW contain a higher EC value than the Bangladesh standard. In 2010, Bahar and Reza (2010) found that, in the coastal area, groundwater systems were mostly alkaline e.g., EC range were found to be between 962 and 9,370 μs/cm. Saha et al. (2018) mentioned that, in the Tala Upazila of Satkhira district, high levels of salinity were found in the greater depth aquifers (256 to 411 m), and salinity concentrations were found to be six times or more than the recommended levels. This finding also matches with Khanom and Salehin (2012). High EC values indicate poor quality drinking water that threatens environmental and public health (Bangladesh Water Act, 2013; Minar et al., 2013; Chidambaram et al., 2018). The present investigation revealed that most drinking water sources contained high concentrations of Fe. Excess Fe is responsible for the poor taste of drinking water. Fe is regarded as non-toxic, and acute and chronic health impacts have not been widely documented (Merrill et al., 2011). However, in the human body, the absorption of high amounts of Fe may be responsible for pancreas, spleen, heart and vital organ damage, especially the liver when Fe concentration exceeds 200 mg/L.
High level of As concentration were found in the most frequently used drinking water sources. In a recent study (Dey et al., 2018), it was found that in the coastal region of Bangladesh, over one-third of high dependent drinking water sources (TW) were As contaminated. High As concentration could be the result of the after-product of natural geo-chemical processes. The lower portion of the Ganges-Brahmaputra river system is considered to be moderately to severely As enriched (Ahmed et al., 2004; Saha et al., 2018). Dietary intake of water and food (through irrigation with arsenic contaminated groundwater) have been identified as one of the major pathways for As exposure and as a potential health hazard of people (Yu et al., 2003; Kapaj et al., 2006; Rahman et al., 2008; Khan et al., 2014). As is transported by blood to different organs in the body, mainly in the form of monomethylarsonic acid. Bladder cancer risk can be increased by up to 2.7 times if As concentrations exceed 10 μg/L in drinking water (Lokuge et al., 2014; Akter et al., 2016). Inauen et al. (2013) found that 21% of all mortality occurred in the As contaminated sub-districts in Bangladesh. Thus, high As contamination could be responsible for high risks of morbidity and mortality in exposed populations (Yu et al., 2003; Kapaj et al., 2006; Flanagan et al., 2012; Shrivastava et al., 2014; Hossain, 2015).
Diarrhea is the third leading cause of death. Microbial pathogens (coliform bacteria) are mainly responsible for waterborne diseases (Javed et al., 2014). Based on the Colony Forming Unit (CFU), Gruber et al. (2014) categorized water samples into five types including safe (0 CFU), low risk (1–10 CFU), intermediate risk (11–100 CFU), high risk (101–1,000 CFU), and very high risk (more than 1,000 CFU). Present findings indicate that a higher percentage of corresponding point of use (PoU) contain a higher number of coliform bacteria than point of sources (PoS). Saha et al. (2018) and Dey et al. (2017a) found that shallow aquifers are more microbiologically contaminated than greater depth aquifer. Around 40% of shallow tubewells in Tala Upazila (the same study area), were found to be contaminated with fecal organisms (Saha et al., 2018). Generally, groundwater is much less likely to contain microbial pathogens in comparison to surface water (Fendorf et al., 2010; Saha et al., 2018). Contaminated water bodies pose a high risk to human health via waterborne pathogens (Harwood et al., 2014). Poor sanitation conditions could be one of the major causes of microbial contaminations in shallow depth aquifers. Biological pollutant load (Coliform Bacteria) at PoS could be attributed to storage of HH's waste, contaminated stagnant water, and latrine pit being situated at a shorter distance from PoS (<10 m) (Dey et al., 2017b). Agricultural runoff and ground storage of high organic content matter could be responsible for pathogenic content at PoS (Khanna et al., 2013). Exposure to coliform bacteria could cause many severe adverse effects on overall public health, such as such as urinary tract infections, cystitis, and kidney infections. These bacterium are also responsible for environmental degradation, as some types of E. coil have been found to be responsible for damaging vegetables (Javed et al., 2014).
A positive correlation between parameters indicates the parameters likely share a common source, while negative correlation likely means the parameters share a different source (Nwankwoala et al., 2014). In this study, a positive relationship was found between closely related parameters of the same sources and a negative relationship was found between different parameters of different sources. The interrelationship could be dependent on environmental conditions, particularly the nature of the elements (Davies et al., 2005). Linear relationship of different parameters, such as As, Fe, and EC, could be attributed to natural activity, and the interrelationship of TC, E. coli, and FC could be attributed to biological activity. In the coastal Bangladesh (Bengal basin), As showed a significant correlation with Fe (Ghosh et al., 2017). In a recent study, Chidambaram et al. (2018) mentioned that association of Fe with other elements is the major controlling factor of groundwater chemistry in the coastal area of Bangladesh and India (West Bengal). However, in this study, most of the most frequently used drinking water sources in the study area were found to be unsuitable for human consumption, because of the high WQI value (Yisa and Jimoh, 2010; Khanna et al., 2013). Thus, a large percentage of the population depends on poor to unsuitable drinking water sources, and scarcity of safe drinking water sources is reflected in the study area. This is one of the most serious health issues in the coastal region of Bangladesh, believed to be mainly caused by the combined effect of arsenic and salinity (Abedin et al., 2014). Dependent populations of unsuitable drinking water sources are facing high adverse risk to their health due to exposure to highly toxic elements and pathogens, causing them to suffer from various waterborne diseases (Flanagan et al., 2012). The exposure pathways of contaminants may vary from region to region, depending on factors such as human activity, geological composition of the aquifer and more. Also, various climatic and geomorphic conditions such as rainfall, runoff, infiltration rate, groundwater level and fluctuation, groundwater flow pattern, distribution pattern of toxic elements, and many more, can influence exposure pathways (Bhattacharya et al., 2002, 2011; Shrivastava et al., 2014).
Alternative safe water management plan is highly essential to protect public health, especially in the study area. In a recent study conducted in the Tala Upazila of Satkhira district, Saha et al. (2018) identified safe TW installation sites based on calculating the WQI for drinking water sources, and GIS-based, geo-statistical, and spatial analysis. By using these techniques, before installation, it will be easy to explore suitable sites with the depth necessary for discovering high quality drinking water. However, in an arsenic hotspot area in Bangladesh, people are using pond sand filter (PSF), rain water harvester (RWH), surface water filter membrane, and arsenic removal filter (ARF) as alternative drinking water sources. Most people prefer arsenic-safe tubewell because of its easy operation and availability of water year-round (Hossain et al., 2015). In the study area, most dependent populations expressed willingness to pay for safe drinking water, despite poor living standards. This willingness to pay coincided with Dey et al. (2018) study's findings where 75% of surveyed households, in a coastal Upazila of Bangladesh, showed “willingness to pay USD 0.25 per week for 20 L of safe drinking water per day”. In 2013, Harun and Kabir (2013) mentioned that, in the coastal region of Bangladesh, affected communities have increased willingness to pay for sustainable safe drinking water technologies like PSF and RWH. In the study area, installation of water treatment plans, such as arsenic removal plants and desalination plants, could be better alternative options to fight against this water contamination crisis. To minimize financial costs, Public Private Partnership (PPP) or Build, Operate and Transfer (BOT) business structures would be ideal options for the installation and effective operation of water treatment plans (Basar, 2012). People are preferring tubewell (TW), usually deep TW as a safe drinking water. One of the major concerns is that when we are using greater depth aquifer for extracting drinking water, that aquifer could be more contaminated. Before installing TW, testing aquifer is essential. The Sida-SASMIT provided unique examples to get safe drinking water, such as targeting red sand aquifer and intermediate aquifer, which could be feasible for extracting As, Fe, and Mn (manganese) free safe water (SASMIT Concept Note, 2014).
To improve this situation, certain steps need to be taken to ensure safe drinking water. These steps include installation of safe TW; near water bodies need to be protected from water pollution; keeping safe distance (>10 m) between water sources and contamination sources (pit latrine); periodical and long term monitoring periods of drinking water sources need to be implemented; hygiene behavior needs to be taught and practiced, as well as practicing using safe drinking water sources; and a sufficient water treatment plan needs to be established, etc. (Rahman et al., 2000; Bhattacharya et al., 2011; Cronin et al., 2017; Dey et al., 2017b). However, in terms of the Water Safety Planning (e.g., WHO, 2009) approach, appropriate strategies, and effective and socially accepted frameworks for water resources management, are also necessary for communities to reduce the risk of contamination of water (Flanagan et al., 2012; Cronin et al., 2017; Bhattacharjee et al., 2019). Thus, ensuring the availability and sustainability of water sources are highly essential for public health and meeting target of Sustainable Development Goals (SDGs).
Conclusion
The study area in Bangladesh has been experiencing deteriorating drinking water quality in groundwater systems due to increased salinity and high As concentration. Day by day, increasing numbers of people are becoming dependent on a single drinking water source. Most of these drinking water sources contain an unacceptable level of As, Fe and Salinity, with point of uses containing a very high number of coliform bacteria. According to WQI, three quarters of the most frequently used drinking water sources are found to be “poor to unsuitable” for drinking water purposes. In the study area, 40% of the population (0.12 million) have been consuming contaminated water and facing harmful health risks through the transfer of acute and chronic waterborne diseases. Dependent HH members on contaminated water sources suffered from several diseases, such as fever, diarrhea, dysentery, colds, high blood pressure and more. HH members seem to spend USD 3 to 13 per month for health-related expenditures, which is significantly higher than the national average spending for health-related expenditure. Most dependent HHs expressed willingness to pay USD 1 per month/HH to acquire safe drinking water. To improve this situation, certain steps need to be taken to ensure safe drinking water. These steps include the installation of deep tubewell (DTW) for safe water, the periodical testing of water quality, increased awareness and practice of hygienic behavior, entrepreneurial development and incentive to allow business to supply safe water at low cost. Appropriate water safety planning and strategies are also necessary at the household level to reduce the risk of geogenic and microbial contamination. Further research is needed to acquire a better understanding of the individual health risks associated with being dependent on contaminated drinking water sources.
Author Contributions
RS was responsible for development of concept, study design, data collection and analysis, data interpretation, and drafting the manuscript. ND was involved in study design, training for data collection, partial data analysis, data interpretation, and partial drafting of the manuscript. MR was contributed in study design, training for data collection, data interpretation, and partial drafting of the manuscript. PB was involved in study design, validity of study concept, drafting of the manuscript, and review of draft manuscript. GR was helped in study design, data interpretation, and review of draft manuscript.
Funding
BRAC Water, Sanitation and Hygiene (WASH) Program and DFID through Strategic Partnership Assistance (SPA) provided the fund to conduct this study.
Conflict of Interest Statement
The authors declare that the research was conducted in the absence of any commercial or financial relationships that could be construed as a potential conflict of interest.
Acknowledgments
The authors sincerely acknowledge BRAC Water, Sanitation and Hygiene (WASH) Program for the financial support to conduct this important research project. The research grant for conducting this study was funded by DFID, through Strategic Partnership Assistance (SPA). Authors are grateful to BRAC Research and Evaluation Division (RED) for offering the chance to conduct this study, and providing the necessary assistance. We would also like to thank the Center for Climate Change and Environmental Research (C3ER), BRAC University, Dhaka for all the support for water point census datasets of Tala Upazila, and helping us select the water points. Authors would also like to greatly acknowledge Mr. Gabriel Grunwald, Department of Naval Architecture, Marine Institute, Memorial University of Newfoundland, St. John's, Newfoundland, Canada, for his assistance in copy editing of the manuscript. The authors are giving special thanks to the research assistants who participated in the in-situ experiment. We would also like to thank all other researchers who offered their valuable comments and suggestions during execution of the study and manuscript preparation.
Supplementary Material
The Supplementary Material for this article can be found online at: https://www.frontiersin.org/articles/10.3389/fenvs.2019.00057/full#supplementary-material
References
Abedin, M. A., Habiba, U., and Shaw, R. (2014). Community perception and adaptation to safe drinking water scarcity: salinity, arsenic, and drought risks in coastal Bangladesh. Int. J. Disaster Risk Sci. 5, 110–124. doi: 10.1007/s13753-014-0021-6
Ahmed, K. M., Bhattacharya, P., Hasan, M. A., Akhter, S. H., Alam, S. M. M., Bhuyian, M. A. H., et al. (2004). Arsenic enrichment in groundwater of the alluvial aquifers in Bangladesh: an overview. Appl. Geochem. 19, 181–200. doi: 10.1016/j.apgeochem.2003.09.006
Ahmed, M. F., Ahuja, S., Alauddin, M., Hug, S. J., Lloyd, J. R., Pfaff, A., et al. (2006). Ensuring safe drinking water in Bangladesh. Science 314:1687. doi: 10.1126/science.1133146
Akter, T., Jhohura, F. T., Akter, F., Chowdhury, T. R., Mistry, S. K., Dey, D., et al. (2016). Water Quality Index for measuring drinking water quality in rural Bangladesh: a cross-sectional study. J. Health Populat. Nutr. 35:4. doi: 10.1186/s41043-016-0041-5
Ayers, J. C., Goodbred, S., George, G., Fry, D., Benneyworth, L., Hornberger, G., et al. (2016). Source of salinity and arsenic in groundwater in southwest Bangladesh. Geochem. Trans. 17:4. doi: 10.1186/s12932-016-0036-6
Bahar, M. M., and Reza, M. S. (2010). Hydro-chemical characteristics and quality assessment of shallow groundwater in a coastal area of Southwest Bangladesh. Environ. Earth Sci. 61, 1065–1073. doi: 10.1007/s12665-009-0427-4
Bangladesh Water Act (2013). Act No. 14 of 2013. Legislative and Parliamentary Affairs Division. Ministry of Law, Justice and Parliamentary Affairs. Governments of the People's Republic of Bangladesh. Available online at: http://warpo.gov.bd/acts/WaterActEnglish.pdf (accessed August 01, 2015).
Basar, A. (2012). Water security in coastal region of Bangladesh: would desalination be a solution to the vulnerable communities of the sundarbans? Bangladesh e-J Sociol. 9, 31–39. Available online at: https://www.eldis.org/document/A63037
BBS (2014). Bangladesh Population and Housing Census 2011, National Report, Volume 2, Union Statistics. Dhaka: Bangladesh Bureau of Statistics, Statistics and Information Division, Ministry of Planning, Government of the People's Republic of Bangladesh.
BBS/UNICEF (2011). Bangladesh National Drinking Water Quality Survey of 2009. Bangladesh Bureau of Statistics/United Nations Children's Fund. Dhaka: UNICEF.
Bhattacharjee, S., Saha, B., Saha, B.o., Uddin, M. S., Panna, C. H., Bhattacharya, P., et al. (2019). Groundwater governance in Bangladesh: established practices and recent trends. Groundwater Sustain. Dev. 8, 69–81. doi: 10.1016/j.gsd.2018.02.006
Bhattacharya, P., Chatterjee, D., and Jacks, G. (1997). Occurrence of arsenic-contaminated groundwater in alluvial aquifers from Delta Plains, Eastern India: options for safe drinking water supply. Int. J. Water Resources Dev. 13, 79–92. doi: 10.1080/07900629749944
Bhattacharya, P., Hossain, M., Rahman, S. N., Robinson, C., Nath, B., Rahman, M., et al. (2011). Temporal and seasonal variability of arsenic in drinking water wells in Matlab, southeastern Bangladesh: a preliminary evaluation on the basis of a 4 year study. J. Environ. Sci. Health Part A 46, 1177–1184. doi: 10.1080/10934529.2011.598768
Bhattacharya, P., Jacks, G., Ahmed, K. M., Routh, J., and Khan, A. A. (2002). Arsenic in groundwater of the bengal delta plain aquifers in Bangladesh. Bull. Environ. Contamination Toxicol. 69, 538–545. doi: 10.1007/s00128-002-0095-5
Biswas, A., Bhattacharya, P., Mukherjee, A., Nath, B., Alexanderson, N., Kundu, A. K., et al. (2014). Shallow hydro-stratigraphy in an arsenic affected region of Bengal Basin: implication for targeting safe aquifers for drinking water supply. Sci. Total Environ. 485–486, 12–22. doi: 10.1016/j.scitotenv.2014.03.045
C3ER (2015). Water Sources Census in Tala Upazila to Ensuring Safe Drinking Water in Coastal Region. Dhaka: BRAC University.
Chidambaram, S., Sarathidasan, J., Srinivasamoorthy, K., Thivya, C., Thilagavathi, R., Prasanna, M. V., et al. (2018). Assessment of hydrogeochemical status of groundwater in a coastal region of Southeast coast of India. Appl. Water Sci. 8:27. doi: 10.1007/s13201-018-0649-2
Cronin, A. A., Odagiri, M., Arsyad, B., Nuryetty, M. T., Amannullah, G., Santoso, H., et al. (2017). Piloting water quality testing coupled with a national socioeconomic survey in Yogyakarta province, Indonesia, towards tracking of Sustainable Development Goal 6. Int. J. Hyg. Environ. Health 220, 1141–1151. doi: 10.1016/j.ijheh.2017.07.001
Das, B., Rahman, M. M, Nayak, B., Pal, A., Chowdhury, U. K., et al. (2009). Groundwater arsenic contamination, its health effects and approach for mitigation in West Bengal, India and Bangladesh. Water Qual. Expo. Health 1, 5–21. doi: 10.1007/s12403-008-0002-3
Davies, B., Valente, M. B., and Hall, A. (2005). The Zambezi Rivers in Mozambique: the physicochemical status of the middle and lower Zambezi prior to the closure of the Cobora Bassa Dam freshwater. Biology 7, 187–189. doi: 10.1111/j.1365-2427.1977.tb01668.x
Dey, N. C., Parvez, M., Dey, D., Saha, R., Ghose, L., Barua, M. K., et al. (2017b). Microbial contamination of drinking water from risky tubewells situated in different hydrological regions of Bangladesh. Int. J. Hyg. Environ. Health 220, 621–636. doi: 10.1016/j.ijheh.2016.12.007
Dey, N. C., Parvez, M., Saha, R., Islam, M. R., Akter, T., Rahman, M., et al. (2018). Water quality and willingness to pay for safe drinking water in Tala Upazila in a coastal district of Bangladesh. Exposure Health OnlineFirst, 1–14. doi: 10.1007/s12403-018-0272-3
Dey, N. C., Saha, R., Parvez, M., Bala, S. K., Islam, A. K. M. S., Paul, J. K., et al. (2017a). Sustainability of groundwater use for irrigation of dry-season crops in northwest Bangladesh. Groundwater Sustain. Dev. 4, 66–77. doi: 10.1016/j.gsd.2017.02.001
Fendorf, S., Michael, H. A., and van Geen, A. (2010). Spatial and temporal variations of groundwater arsenic in South and Southeast Asia. Science 328, 1123–1127. doi: 10.1126/science.1172974
Flanagan, S. V., Johnston, R. B., and Zheng, Y. (2012). Arsenic in tube well water in Bangladesh: health and economic impacts and implications for arsenic mitigation. Bull. World Health Org. 90, 839–846. doi: 10.2471/BLT.11.101253
Ghosh, D., Routh, J., and Bhadury, P. (2017). Sub-surface biogeochemical characteristics and its effect on arsenic cycling in the holocene gray sand aquifers of the Lower Bengal Basin. Front. Environ. Sci. 5:82. doi: 10.3389/fenvs.2017.00082
Gruber, J. S., Ercumen, A., and Colford, J. M. J. (2014). Coliform bacteria as indicators of diarrheal risk in household drinking water: systematic review and meta-analysis. PLoS ONE 9:e107429. doi: 10.1371/journal.pone.0107429
Harun, M. A. Y. A., and Kabir, G. M. M. (2013). Evaluating pond sand filter as sustainable drinking water supplier in the Southwest coastal region of Bangladesh. Appl. Water Sci. 3:161–166. doi: 10.1007/s13201-012-0069-7
Harwood, V. J., Staley, C., Badgley, B. D., Borges, K., and Korajkic, A. (2014). Microbial source tracking markers for detection of fecal contamination in environmental waters: relationships between pathogens and human health outcomes. FEMS Microbiol. Rev. 38, 1–40. doi: 10.1111/1574-6976.12031
Hossain, M. (2015). Sustainable Arsenic Mitigation–A Strategy for Scaling-Up Safe Water Access. Ph.D. Thesis, School of Architecture and the Build Environment, KTH Royal Institute of Technology, Stockholm, Sweden.
Hossain, M., Bhattacharya, P., Frape, S. K., Jacks, G., Islam, M. M., Rahman, M. M., et al. (2014). Sediment color tool for targeting arsenic-safe aquifers for the installation of shallow drinking water tubewells. Sci. Total Environ. 493, 615–625. doi: 10.1016/j.scitotenv.2014.05.064
Hossain, M., Rahman, S. N., Bhattacharya, P., Jacks, G., Saha, R., and Rahman, M. (2015). Sustainability of arsenic mitigation interventions—an evaluation of different alternative safe drinking water options provided in Matlab, an arsenic hot spot in Bangladesh. Front. Environ. Sci. 3:30. doi: 10.3389/fenvs.2015.00030
Ijeh, I. B., and Udoinyang, I. E. (2013). Assessment of the groundwater quality in parts of imo river basin, Southeastern Nigeria: the case of imo shale and ameki formations. J. Water Resource Protect. 5, 715–722. doi: 10.4236/jwarp.2013.57072
Inauen, J., Hossain, M. M., Johnston, R. B., and Mosler, H.-J. (2013). Acceptance and use of eight arsenic-safe drinking water options in Bangladesh. PLoS ONE 8:e53640. doi: 10.1371/journal.pone.0053640
Jakariya, M., Vahter, M., Rahman, M., Wahed, M. A., Hore, S. K., Bhattacharya, P., et al. (2007). Screening of arsenic in tubewell water with field test kits: evaluation of the method from public health perspective. Sci. Total Environ. 379, 167–175. doi: 10.1016/j.scitotenv.2006.11.053
Javed, F., Ahmed, M. N., Shah, H. U., Iqbal, M. S., Wahid, A., and Ahmad, S. S. (2014). Effects of seasonal variations on physicochemical properties and concentrations of faecal coliform in river Kabul. World Appl. Sci. J. 29, 142–149. doi: 10.5829/idosi.wasj.2014.29.01.2080
Kapaj, S., Peterson, H., Liber, K., and Bhattacharya, P. (2006). Human health effects from chronic arsenic poisoning—a review. J. Environm. Sci. Health Part A 41, 2399–2428. doi: 10.1080/10934520600873571
Khan, N. I., Brouwer, R., and Yang, H. (2014). Household willingness to pay for arsenic-free drinking water in Bangladesh. J. Environ. Manag. 143, 151–161. doi: 10.1016/j.jenvman.2014.04.018
Khanna, D. R., Bhutiani, R., Tyagi, B., Tyagi, P. K., and Ruhela, M. (2013). Determination of water quality index for the evaluation of surface water quality for drinking purpose. Int. J. Sci. Eng. 1, 9–14. Available online at: https://pdfs.semanticscholar.org/abcd/76cb3f6acb47e91ce939e2446472fb0572ac.pdf
Khanom, S., and Salehin, M. (2012). Salinity constraints to different water uses in coastal area of Bangladesh: a case study. Bangladesh J. Sci. Res. 25, 33–42. doi: 10.3329/bjsr.v25i1.13048
Lokuge, K. M., Smith, W., Caldwell, B., Dear, K., and Milton, A. H. (2014). The effect of arsenic mitigation interventions on disease burden in Bangladesh. Environ. Health Perspect. 112, 1172–1177. doi: 10.1289/ehp.6866
Mahmud, M. I., Sultana, S., Hasan, M. A., and Ahmed, K. M. (2017). Variations in hydro-stratigraphy and groundwater quality between major geomorphic units of the Western Ganges Delta plain, SW Bangladesh. Appl. Water Sci. 7, 2919–2932. doi: 10.1007/s13201-017-0581-x
Merrill, R. D., Shamim, A. A., Ali, H., Labrique, A. B., Schulze, K., Christian, P., et al. (2011). Iron status of women is associated with the iron concentration of potable groundwater in rural Bangladesh. J. Nutr. 141, 944–949. doi: 10.3945/jn.111.138628
Minar, M. H., Hossain, M. B., and Shamsuddin, M. D. (2013). Climate change and coastal zone of bangladesh: vulnerability, resilience and adaptability. Middle-East J. Sci. Res. 13, 114–120. doi: 10.5829/idosi.mejsr.2013.13.1.64121
MoFDM (2005). Building Resilient Future. Dhaka: Ministry of Food and Disaster Management, Government of Bangladesh.
Morrison, G., Fatoki, O. S., Persson, L., and Ekberg, A. (2001). Assessment of the impact of point source pollution from the Keiskammahoek Sewage Treatment Plant on the Keiskamma River—pH, electrical conductivity, oxygen- demanding substance (COD) and nutrients. Water 27, 475–480. doi: 10.4314/wsa.v27i4.4960
MoWR (2005). Coastal Zone Policy, 2005. Dhaka: Ministry of Water Resources, Government of Bangladesh.
Mukherjee, A. B., and Bhattacharya, P. (2001). Arsenic in groundwater in the Bengal Delta Plain: slow poisoning in Bangladesh. Environ. Rev. 9, 189–220. doi: 10.1139/a01-007
Nwankwoala, H. O., Amadi, A. N., Oborie, E., and Ushie, F. A. (2014). Hydro chemical Factors and Correlation Analysis in Groundwater Quality in Yenagoa, Bayelsa State, Nigeria. Appl. Ecol. Environ. Sci. 2, 100–105. doi: 10.12691/aees-2-4-3
Rahman, M. A., Hasegawa, H., Rahman, M. M., Miah, M. A. M., and Tasmin, A. (2008). Straight head disease of rice (Oryza sativa L.) induced by arsenic toxicity. Environ. Exp. Bot. 62, 54–59. doi: 10.1016/j.envexpbot.2007.07.016
Rahman, M. M., Hassan, M. Q., Islam, M. S., and Shamsad, S. Z. K. M. (2000). Environmental impact assessment on water quality deterioration caused by the decreased Ganges outflow and saline water intrusion in south-western Bangladesh. Environ. Geol. 40, 31–40. doi: 10.1007/s002540000152
Ravenscroft, P., Burgess, W. G., Ahmed, K. M., Burren, M., and Perrin, J. (2005). Arsenic in groundwater of the Bengal Basin, Bangladesh: distribution, field relations, and hydrogeological setting. Hydrogeol. J. 13, 727–751. doi: 10.1007/s10040-003-0314-0
Saha, R., Dey, N. C., Rahman, S., Galagedara, L., and Bhattacharya, P. (2018). Exploring suitable sites for installing safe drinking water wells in coastal Bangladesh. Groundwater Sustain. Dev. 7, 91–100. doi: 10.1016/j.gsd.2018.03.002
SASMIT Concept Note (2014). Sustainable Arsenic Mitigation Community driven initiatives to target arsenic safe groundwater as sustainable mitigation strategy—Concept Note. Report number: Sida Contribution: 73000854: 1. Stockholm: Environmental Science and Engineering, KTH Royal Institute of Technology.
Shrivastava, A., Barla, A., Yadav, H., and Bose, S. (2014). Arsenic contamination in shallow groundwater and agricultural soil of Chakdaha block, West Bengal, India. Front. Environ. Sci. 2:50. doi: 10.3389/fenvs.2014.00050
Singh, M. K., Jha, D., and Jadoun, J. (2012). Assessment of physico-chemical status of groundwater samples of Dholpur District, Rajasthan, India. Int. J. Chem. 4:96. doi: 10.5539/ijc.v4n4p96
Talawat, R. K., and Chandel, C. P. S. (2008). Quality of groundwater of Jaipur city, Rajasthan (India) and its suitability for domestic and irrigation purpose. Appl. Ecol. Environm. Res. 6, 79–88. doi: 10.15666/aeer/0602_079088
van Geen, A., Zheng, Y., Goodbred, J. R. S., Horneman, A., Aziz, Z., Cheng, Z., et al. (2008). Flushing history as a hydrogeological control on the regional distribution of arsenic in shallow groundwater of the Bengal Basin. Environ. Sci. Technol. 42, 2283–2288. doi: 10.1021/es702316k
van Geen, A., Zheng, Y., Versteeg, R., Stute, M., Horneman, A., Dhar, R. K., et al. (2003). Spatial variability of arsenic in 6000 tubewells in a 25 km2 area of Bangladesh. Water Resour. Res. 39:1140. doi: 10.1029/2002WR001617
von Brömssen, M., Jakariya, M., Bhattacharya, P., Ahmed, K. M., Hasan, M. A., Sracek, O., et al. (2006). Targeting low-arsenic aquifers in Matlab Upazila, Southeastern Bangladesh. Sci. Total Environ. 379, 121–132. doi: 10.1016/j.scitotenv.2006.06.028
WHO (2009). Water Safety Plan Manual: Step-by-step Risk Management for Drinking-water Suppliers. Available online at: http://www.who.int/water_sanitation_health/publications/publication_9789241562638/en/ (accessed August 01, 2015).
Yisa, J., and Jimoh, T. (2010). Analytical studies on water quality index of river Landzu. Am. J. Appl. Sci. 7, 453–458. doi: 10.3844/ajassp.2010.453.458
Keywords: water quality, most usable water sources, dependent households, water quality index, population exposed, coastal area
Citation: Saha R, Dey NC, Rahman M, Bhattacharya P and Rabbani GH (2019) Geogenic Arsenic and Microbial Contamination in Drinking Water Sources: Exposure Risks to the Coastal Population in Bangladesh. Front. Environ. Sci. 7:57. doi: 10.3389/fenvs.2019.00057
Received: 22 March 2018; Accepted: 15 April 2019;
Published: 08 May 2019.
Edited by:
Frederick Ato Armah, University of Cape Coast, GhanaReviewed by:
Tanushree Bhattacharya, Birla Institute of Technology, Mesra, IndiaAlok Chandra Samal, University of Kalyani, India
Copyright © 2019 Saha, Dey, Rahman, Bhattacharya and Rabbani. This is an open-access article distributed under the terms of the Creative Commons Attribution License (CC BY). The use, distribution or reproduction in other forums is permitted, provided the original author(s) and the copyright owner(s) are credited and that the original publication in this journal is cited, in accordance with accepted academic practice. No use, distribution or reproduction is permitted which does not comply with these terms.
*Correspondence: Ratnajit Saha, saharatnajit@gmail.com