Quantifying and Mapping Atmospheric Potassium Deposition for Soil Ecosystem Services Assessment in the United States
 Elena A. Mikhailova1*
  Gregory C. Post2
  Michael P. Cope3
  Christopher J. Post1
  Mark A. Schlautman4 Lisha Zhang5
- 1Department of Forestry and Environmental Conservation, Clemson University, Clemson, SC, United States
- 2Economics Department, Reed College, Portland, OR, United States
- 3Soil Health Institute, Morrisville, NC, United States
- 4Department of Environmental Engineering and Earth Sciences, Clemson University, Clemson, SC, United States
- 5Agricultural Sciences Department, Clemson University, Clemson, SC, United States
National Atmospheric Deposition Program (NADP) databases are important for quantifying and mapping the contribution of atmospheric deposition to soil provisioning ecosystem services. These databases provide information about the atmospheric deposition of potassium (K+) which is an essential element and component of many fertilizing materials. Atmospheric deposition flows (wet, dry, and total) serve as one input of K+ to soils; however, deposition varies spatially across the United States (U.S.). This study ranked an estimated provisioning value of soil ecosystem services due to atmospheric K+ deposition within the contiguous U.S. by state and region based on the 16-year period from 2000 to 2015. The total provisioning ecosystem value of atmospheric potassium deposition was over $406M (i.e., 406 million U.S. dollars) ($179M wet + $227M dry) per year based on a 5-year moving average of $500 per metric ton of potassium chloride (KCl) fertilizer in the U.S. The highest ranked regions for total value of K+ deposition per year were: (1) West ($86.5M), (2) South Central ($80.4M), and (3) Southeast ($80.2M). The highest ranked states for total value of K+ deposition per year were: (1) Texas ($44.3M), (2) California ($18.3M), and (3) New Mexico ($1.35M). Atmospheric potassium deposition is a source of K which is essential for human health. Given a U.S. population of 325.7 million people (2017), and a recommended daily intake of 4.7 g per person per day of K, it would require at least 1,531 metric tons/day of potassium to ensure that every person is able to meet their daily potassium requirement. In terms of monetary value, it will cost nearly $1.5M per day based on a moving 5-year average U.S. price of $500 per metric ton of KCl fertilizer. The results of this study provide a methodology to estimate and map the value of atmospheric potassium deposition for ecosystem services assessments, which can be helpful in conducting nutrient audits at various scales to address the United Nations (UN) Sustainable Development Goals.
Introduction
The Millennium Ecosystem Assessment [Millennium Ecosystem Assessment (MEA), 2005] popularized the concept of ecosystem services as, “the benefits people obtain from ecosystems. These include provisioning services such as food, water, timber, and fiber; regulating services that affect climate, floods, disease, wastes, and water quality; cultural services that provide recreational, aesthetic, and spiritual benefits; and supporting services such as soil formation, photosynthesis, and nutrient cycling.” Both direct (e.g., provisioning services) and indirect (e.g., supporting services) ecosystem services are vital components for supporting life on our planet; however, the lack of valuing these services in the form of policy is contributing to the degradation of our planet's ecological systems (Costanza et al., 1997; Gowdy, 1997; Lovett and Noel, 2008; Dominati et al., 2010; Baveye et al., 2016). These ecosystem services have been highly impacted over the last 50 years and their degradation has consequentially affected human well-being [Millennium Ecosystem Assessment (MEA), 2005]. Economics focuses more on prices than value, which is exemplified with the highly held importance on direct services (e.g., provisioning services) than indirect services (e.g., supporting services) (Heal, 2000; Lovett and Noel, 2008). Provisioning services are goods that can be extracted from the environment, while supporting services relate to soil formation and nutrient cycling [Millennium Ecosystem Assessment (MEA), 2005].
Atmospheric deposition can act as either an ecosystem service (e.g., input of essential nutrients; Mikhailova et al., 2018) or as an ecosystem disservice (e.g., input of pollution; Swain et al., 1992). Previous research has also shown derived benefits from atmospheric deposition such as the deposition of Saharan dust on increased ocean and rainforest productivity (Swap et al., 1992; Hamza, 2008; Mahowald et al., 2017). Although the atmosphere and atmospheric deposition provide numerous ecosystem services, they do not always go through the market because the atmosphere often is considered to be a “free” or “public good” which is nonrival and non-excludable (Heal, 2000; Holzman, 2012). Mikhailova et al. (2018) argued that atmospheric deposition is not always a “public good” because its contents can be deposited in the land within “private boundaries” (e.g., a farm) making “atmospheric goods” into “private goods” for which consumption is “rival” and “excludable” (Heal, 2000). Very often, ecosystem services are difficult to monetize, because “nature is the most complex system” (Holzman, 2012). One commonly used valuation technique is based on estimating “replacement cost” (Holzman, 2012). This method, in which one evaluates the cost of replacing an ecosystem service with a perfect human-derived substitute, is used as a measure of the economic value of ecosystem services.
Groshans et al. (2018a,b) stressed the importance of translating science-based “biophysical accounts” into boundary-based “administrative accounts” and used this accounting framework to estimate the replacement cost of soil inorganic carbon (SIC) by soil order, state, region, land resource region (LRR) using the State Soil Geographic (STATSGO) soil database. Mikhailova et al. (2018) used this accounting framework and identified the input of atmospherically deposited Ca2+ ions to the continental United States (U.S.) as a provisioning ecosystem service because it is a component of “raw” agricultural liming material (CaCO3). Mikhailova et al. (2018) ranked an estimated provisioning value of soil ecosystem services due to atmospheric Ca2+ deposition within the contiguous U.S. by state and region. According to their calculations, the total provisioning ecosystem value of atmospheric Ca2+ deposition was $65M (i.e., 65 million U.S. dollars) based on an average 2014 price of $10.42 per U.S. ton of agricultural limestone (CaCO3) or nearly $355M based on an average 2014 price of $33.00 per U.S. ton gypsum (CaSO4∙2H2O) (Mikhailova et al., 2018). In another study related to atmospheric deposition, Groshans et al. (2018c) ranked the provisioning ecosystem services value of atmospheric Mg2+ deposition in the United States by soil order, state, and region. The total value of provisioning ecosystem services contributed from atmospheric Mg2+ deposition was $47M (e.g., 47 million U.S. dollars) based on a national average price (2014) of $12.90 per U.S. ton of agricultural dolomite (CaMg(CO3)2).
Potassium plays an important role in the ecosystem services and Sustainable Development Goals (SDGs) in order to sustain global human societies (Keestra et al., 2016). First of all, potassium belongs to soil chemical properties, and it plays an important role in soils, plants, human and animal nutrition (Hasanuzzaman et al., 2018; Islam et al., 2018). The significance of potassium in agriculture (especially as a soil macronutrient) is well documented (Manning, 2010) and the following examples are specifically linked to the selected SDGs (Keestra et al., 2016) (numbers 2, 3, and 15 correspond to the specific SDGs):
2. End hunger, achieve food security and improve nutrition and promote sustainable agriculture;
Potassium is an important nutrient, and Sheldrick et al. (2002) reported that the depletion of K is particularly severe which results in an annual global deficit of 20 kg K ha−1. In terms of monetary cost, this annual global deficit is valued at just over $19 ha−1 based on a moving 5-year average price of U.S. $500 per metric ton of potassium chloride (KCl) (Yager, 2016). According to Sheldrick et al. (2002), soil and surface balances for potassium can vary by different regions in the world. Sardans and Peñuelas (2015) reported global potassium contents in various soils with Aridisols, Mollisols, and Vertisols having the highest potassium contents, and Inceptisols, Andisols, and Spodosols having the lowest potassium contents.
3. Ensure healthy lives and promote well-being for all at all ages;
Potassium is extremely important for human health and various biological functions such as being a co-factor for many enzymes, required for insulin secretion, creatine phosphorylation, carbohydrate metabolism, and protein synthesis (Ringer and Bartlett, 2007). Given a global population of 7.7 billion people (2018), and a recommended daily intake of 4.7 g per person per day of potassium (U.S. Department of Health Human Services U.S. Department of Agriculture, 2015-2020), it would require at least 36,190 metric tons/day of potassium to ensure that every person is able to meet their daily potassium requirement. In terms of monetary value, this potassium requirement would cost $34.5M each day based on a moving 5-year average price of U.S. $500 per metric ton of potassium chloride (KCl) (Yager, 2016). Given a U.S. population of 325.7 million people (2017), and a recommended daily intake of 4.7 g per person per day of K, it would require at least 1,531 metric tons/day of potassium to ensure that every person is able to meet their daily potassium requirement. In terms of monetary value, it will cost nearly $1.5M per day based on a moving 5-year average U.S. price of $500 per metric ton of KCl fertilizer (Yager, 2016).
15. Protect, restore and promote sustainable use of terrestrial ecosystems, sustainably manage forests, combat desertification and halt and reverse land degradation and biodiversity loss.
Potassium is important for activation of 80 different enzymes responsible for various plant and animal processes (e.g., energy metabolism, starch synthesis, nitrate reducation, photosynthesis, sugar degradation etc.), and helping plants to adapt to environmental stress (e.g., drought, winter, diseases, et al.) (Brady and Weil, 2002). Potassium is a key soil nutrient for agricultural crops and a deficit in soil potassium can reduce plant yields and increase plant susceptibility to disease (Rawat et al., 2016). Plant ecosystems, including forests and grasslands growth can be limited by available potassium (Sardans and Peñuelas, 2015). Potassium is also involved in physiological water use mechanisms in plants and can help mitigate plant drought stress (Sardans and Peñuelas, 2015).
Unlike other soil nutrients, potassium is present in the soil solution only as K+ (Figure 1; Brady and Weil, 2002). Retention of K+ is dependent on cation exchange capacity (CEC) which is largely affected by the predominant clay minerals (e.g., illite, vermiculite, etc.) (Manning, 2010). Soil K+ retention is different for the 12 soil orders, with the lowest retention associated with highly leached and weathered soils (e.g., Ultisols, Oxisols). For soils with potassium deficiencies, the two most common soil fertilizers used for supplementing potassium are muriate of potash (MOP; more commonly referred to as potassium chloride or KCl) and sulfate of potash (SOP); more commonly referred to as potassium sulfate or K2SO4) (Havlin et al., 1999). United States consumption of KCl was 6,411,121 short U.S. tons in 2014 (USDA/ER, 2019), which would have cost almost 3 billion dollars assuming a 5-year moving average of $500 per metric ton of potassium chloride (KCl) in the U.S. (Yager, 2016).
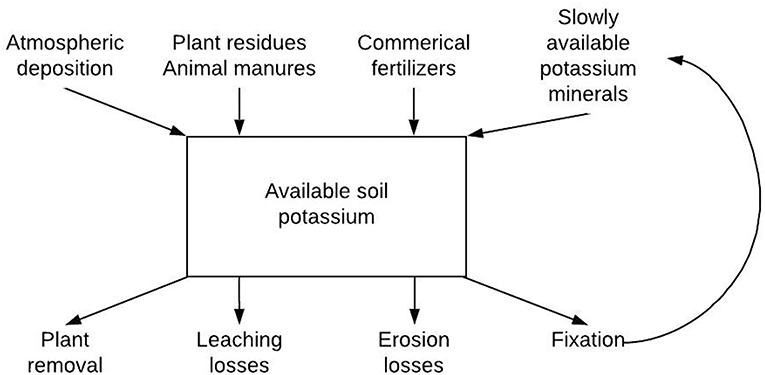
Figure 1. The role of atmospheric potassium deposition in the gains and losses of available soil potassium under average field conditions (adapted from Brady and Weil, 2002).
Although significant research has been done on potassium in soils and atmosphere, the contribution of atmospheric deposition of potassium to soils often is not accounted for in ecosystem services valuations (Manning, 2010) (Figure 1). For example, quantifying the gains and losses of available potassium in soil due to fixation dynamics, potassium release from soil minerals, erosional and leaching losses, etc., limit our ability to quantify the stocks and flows of potassium associated with ecosystem services (Bilias and Barbayiannis, 2019). The objective of this study was to assess and rank the contribution of atmospheric potassium (K+) deposition flows to soil provisioning ecosystem services within the contiguous U.S. by state and region. A monetary valuation of atmospheric wet, dry, and total K+ deposition was calculated based on a moving 5-year average price of U.S. $500 per metric ton of potassium chloride (KCl) (Yager, 2016). This method, in which we evaluate the cost of replacing an ecosystem service with a human-derived substitute (potassium chloride, KCl), is called the replacement cost approach, and it is commonly used as a measure of the economic value of ecosystem services.
Materials and Methods
The Accounting Framework
Atmospheric potassium deposition (flow) from atmospheric capital into soil capital represents the amount of potassium defined in a spatial and temporal context, which is in this study is the quantity of potassium deposition (kg) per area (ha) per unit time (year) (Figure 2). Table 1 provides a conceptual overview of the accounting framework for valuation of various atmospheric potassium deposition flows: wet, dry, and total.
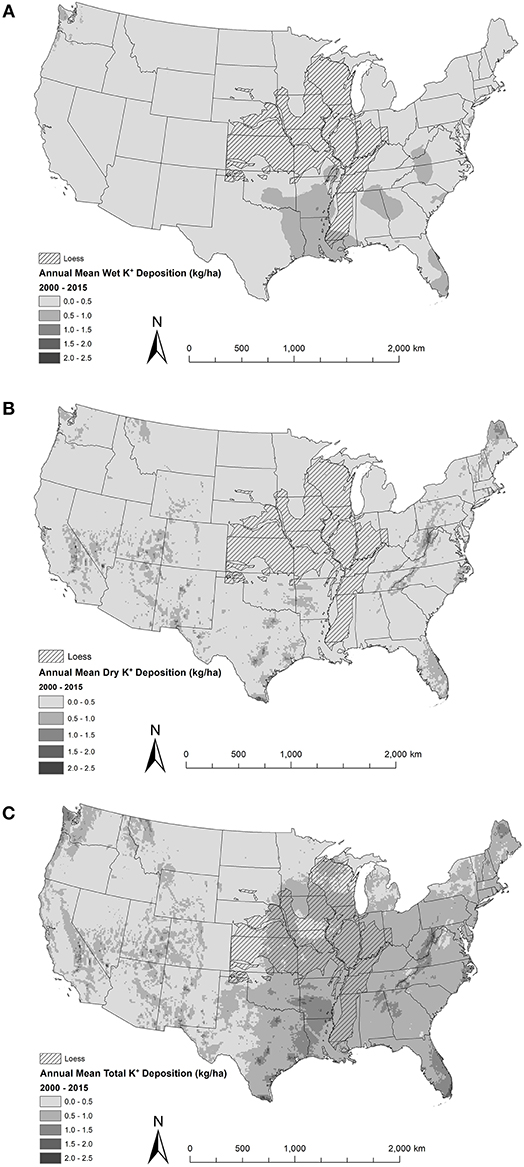
Figure 2. Area-normalized annual mean K+ deposition (kg/ha) for the years 2000–2015 in the contiguous United States: (A) wet, (B) dry, and (C) total.
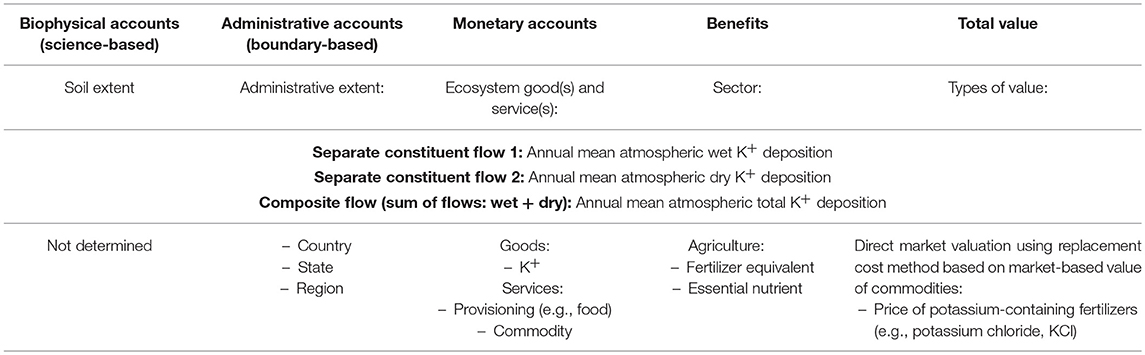
Table 1. Conceptual overview of the annual atmospheric K+ deposition accounting framework used in this study (adapted from Groshans et al., 2018b).
The Monetary Valuation of the Atmospheric K+ Deposition Flows
The overall monetary valuation procedure used to calculate atmospheric deposition of K+ was adapted from the approach reported by Mikhailova et al. (2018) for calcium and by Groshans et al. (2018c) for magnesium deposition from the atmosphere. Briefly, annual atmospheric K+ deposition (kg ha−1) gradient maps were downloaded from the National Atmospheric Deposition Program (NADP) website (National Atmospheric Deposition Program (NRSP-3), 2018) in Grid format (Table 1). The maps' estimates of annual atmospheric K+ deposition were calculated using samples from field sites operated by the NADP and National Trends Network (NTN). Samples were collected from field sites weekly. Details on sample collection, laboratory methods, quality control, and mapping methods can be found in several open-source publications using the NADP website (National Atmospheric Deposition Program (NRSP-3), 2018). An inverse distance weighting algorithm was used to spatially interpolate precipitation-weighted annual mean K+ concentration (mg/L) measured at field sites to a continuous raster map layer with an approximate 2 km resolution. The resulting concentration map was then multiplied by annual precipitation maps developed using the PRISM precipitation model (Daly et al., 2008). The annual mean atmospheric K+ deposition (kg ha−1) over the study period was computed for each map cell using the Cell Statistics function in ArcGIS® 10.4 (ESRI, 2016) and then converted to U.S. dollars per area (i.e., hectare) and U.S. dollars in Microsoft Excel using the following equations:
Note that the price values calculated in U.S. dollars and dollars per ha represent the money that would be required simply to purchase potassium chloride (KCl) without consideration of other important costs, such as the equipment, fuel, and labor that would be required to incorporate the potassium fertilizers into the soil, nor any external costs associated with extracting and processing of potassium chloride etc. (Groshans et al., 2018b). There is an implicit assumption that potassium deposition onto the soils is not lost because of erosion, runoff, etc. Also potassium sources found in deposition cannot be distinguished between redistribution and recycling. Potassium found in dust and rainfall likely comes from terrestrial sources that can quickly be re-deposited or be transported for large distances across the U.S. (Mikhailova et al., 2018). Dust deposition can be influenced by the loess extent. Therefore, loess distribution was incorporated into the maps based on previously mapped loess distribution using 0.1 × 0.1° gridded map layers derived from USGS (2016) maps (Lineback et al., 1983; Miller et al., 1988; Holbrook et al., 1990; Gray et al., 1991; Hallberg et al., 1991; Denne et al., 1993; Whitfield et al., 1993; Swinehart et al., 1994), and complied by Kohfeld and Harrison (2001).
Results
Atmospheric K+ deposition provides a substantial monetary value to the U.S. in the form of goods (e.g., K+, etc.) and services (e.g., provisioning, etc.) for agricultural benefit (e.g., fertilizing, etc.) and therefore can be evaluated using commodity prices for potassium chloride (KCl) (Table 2). The total provisioning ecosystem value of atmospheric potassium deposition was $406M (i.e., 406 million U.S. dollars) ($179M wet + $227M dry) per year based on a 5-year moving average of $500 per metric ton of potassium chloride (KCl) in the U.S. The value of average annual K+ deposition varies across the country at the state and region scales based on data from time period of 2000–2015.

Table 2. Total value (rankings) and area-averaged value (rankings) of annual atmospheric wet K+ deposition for each state (region) for the 16-year period 2000–2015 based on a moving 5-year average price of U.S. $500 per metric ton of potassium chloride (KCl) (Yager, 2016).
The highest ranked states for total value of wet K+ deposition per year were: (1) Texas ($18.2M), (2) Arkansas ($7.83M), and (3) Louisiana ($7.42M) (Table 2, Figure 3A). Area-normalized total mean annual values of wet K+ deposition varied by state from a low of $0.06 ha−1 (Nevada) up to 0.63 ha−1 (Louisiana) (Table 2, Figure 3A). The highest ranked regions for total value of wet K+ deposition were: (1) Southeast ($43.7M), (2) South Central ($40.1M), and (3) Midwest ($30.6M) (Table 2, Figure 4A). Area-normalized total mean annual values of wet K+ deposition varied by region from a low of $0.11 ha−1 (West) up to 0.41 ha−1 (Southeast) (Table 2, Figure 4A).
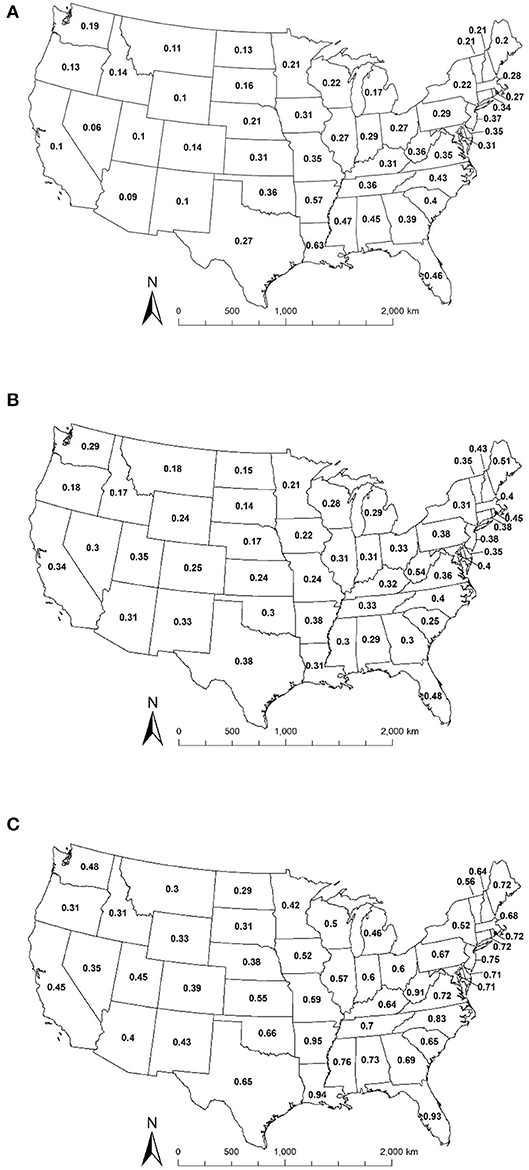
Figure 3. Area-normalized value of annual K+ deposition ($/ha) for different states in the contiguous United States based on a moving 5-year average price of U.S. $500 per metric ton of potassium chloride (KCl) (Yager, 2016): (A) wet, (B) dry, and (C) total.
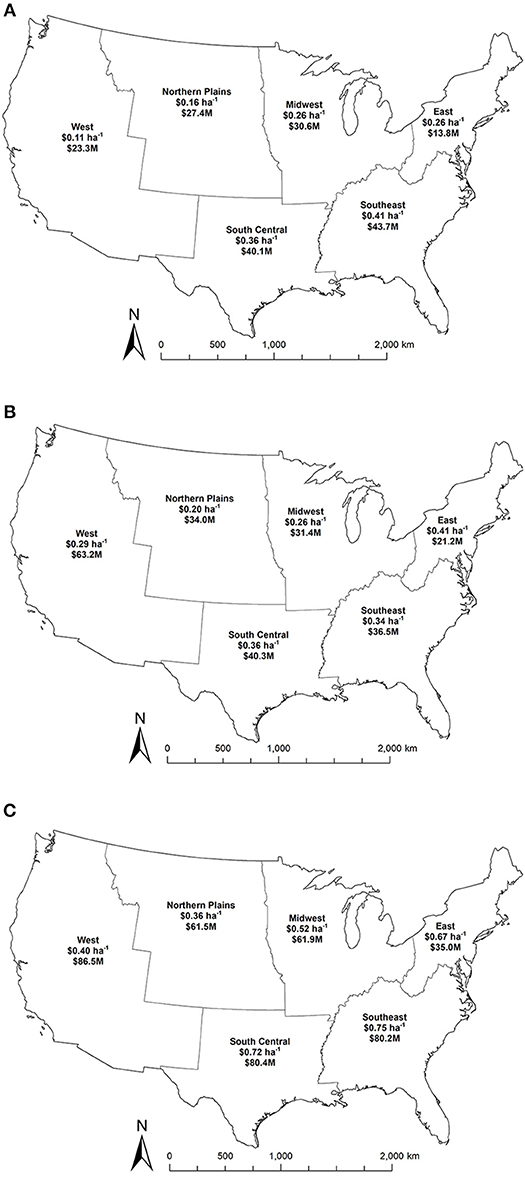
Figure 4. Area-normalized value of annual K+ deposition ($/ha, top number), and value of total storage ($, bottom number) and for different regions in the contiguous United States based on a moving 5-year average price of U.S. $500 per metric ton of potassium chloride (KCl) (Yager, 2016): (A) wet, (B) dry, and (C) total.
The highest ranked states for total value of dry K+ deposition were: (1) Texas ($26.1M), (2) California ($14.0M), and (3) New Mexico ($10.5M) (Table 3, Figure 3B). Area-normalized total mean annual values of dry K+ deposition varied by state from a low of $0.14 ha−1 (South Dakota) up to 0.54 ha−1 (West Virginia) (Table 3, Figure 3B). The highest ranked regions for total value of dry K+ deposition were: (1) West ($63.2M), (2) South Central ($40.3M), and (3) Southeast ($36.5M) (Table 3, Figure 4B). Area-normalized total mean annual values of dry K+ deposition varied by region from a low of $0.20 ha−1 (Northern Plains) up to 0.41 ha−1 (East) (Table 3, Figure 4B).
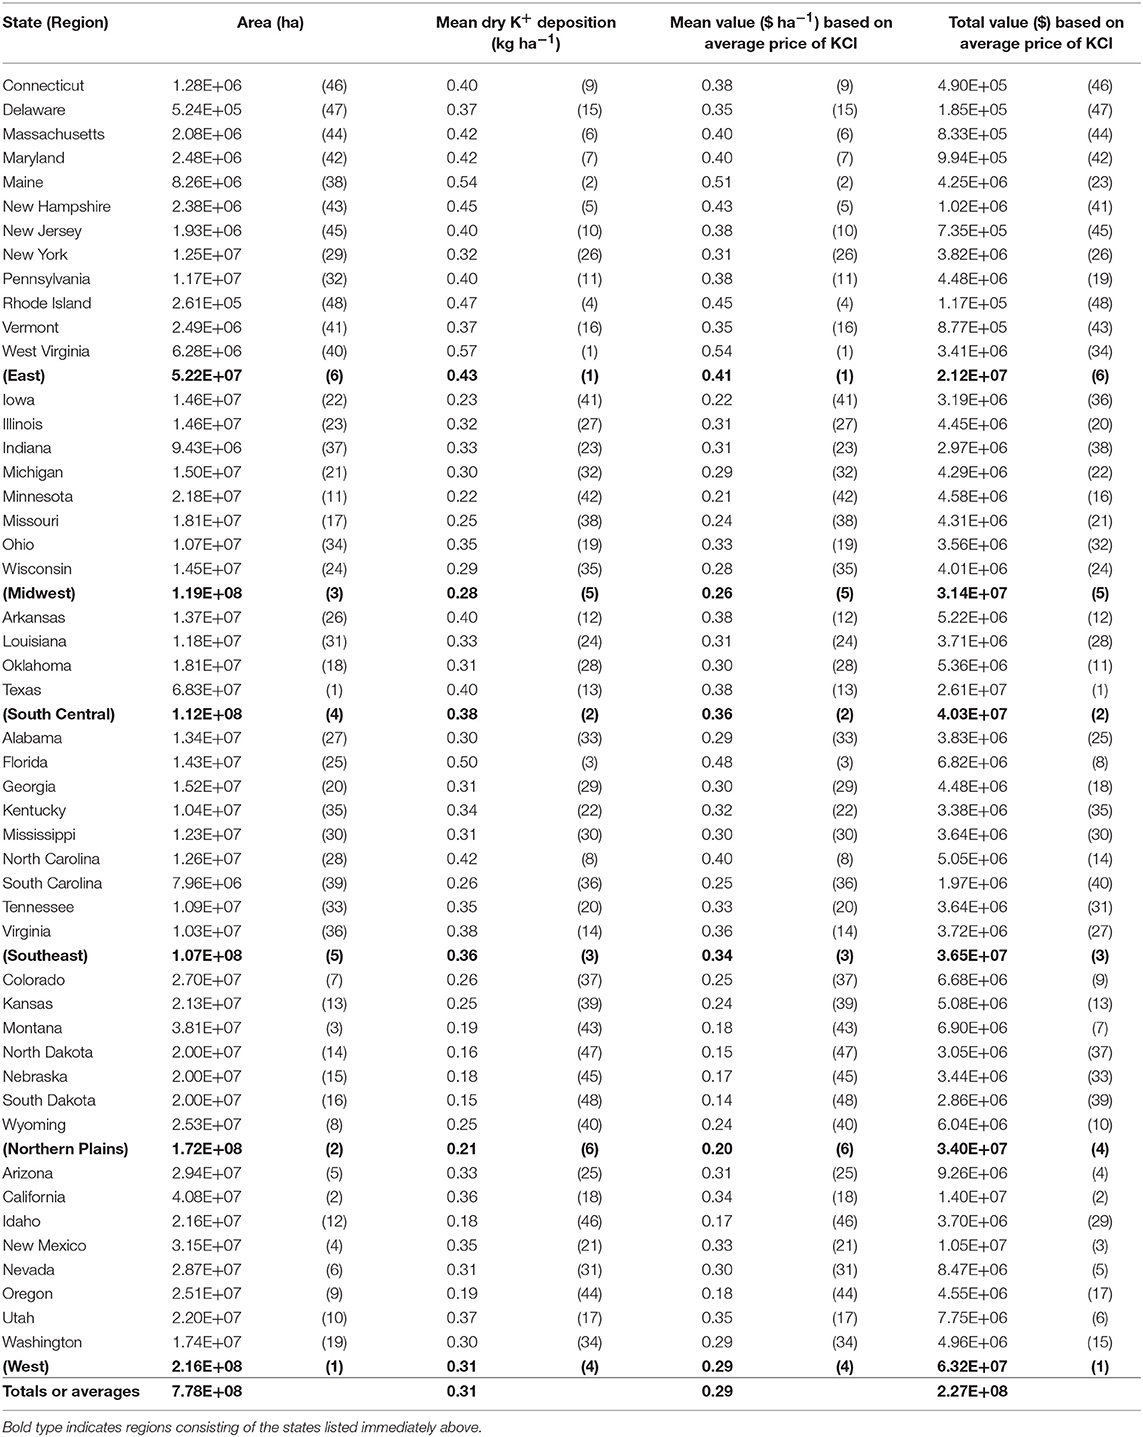
Table 3. Total value (rankings) and area-averaged value (rankings) of annual atmospheric dry K+ deposition for each state (region) for the 16-year period 2000–2015 based on a moving 5-year average price of U.S. $500 per metric ton of potassium chloride (KCl) (Yager, 2016).
The highest ranked states for total value of total K+ deposition were: (1) Texas ($44.3M), (2) California ($18.3M), and (3) New Mexico ($13.5M) (Table 4, Figure 3C). Area-normalized total mean annual values of total K+ deposition varied by state from a low of $0.29 ha−1 (North Dakota) up to 0.95 ha−1 (Arkansas) (Table 4, Figure 3C). The highest ranked regions for total value of total K+ deposition were: (1) West ($86.5M), (2) South Central ($80.4M), and (3) Southeast ($80.2M) (Table 4, Figure 4C). Area-normalized total mean annual values of total K+ deposition varied by region from a low of $0.36 ha−1 (Northern Plains) up to 0.75 ha−1 (Southeast) (Table 4, Figure 4C).
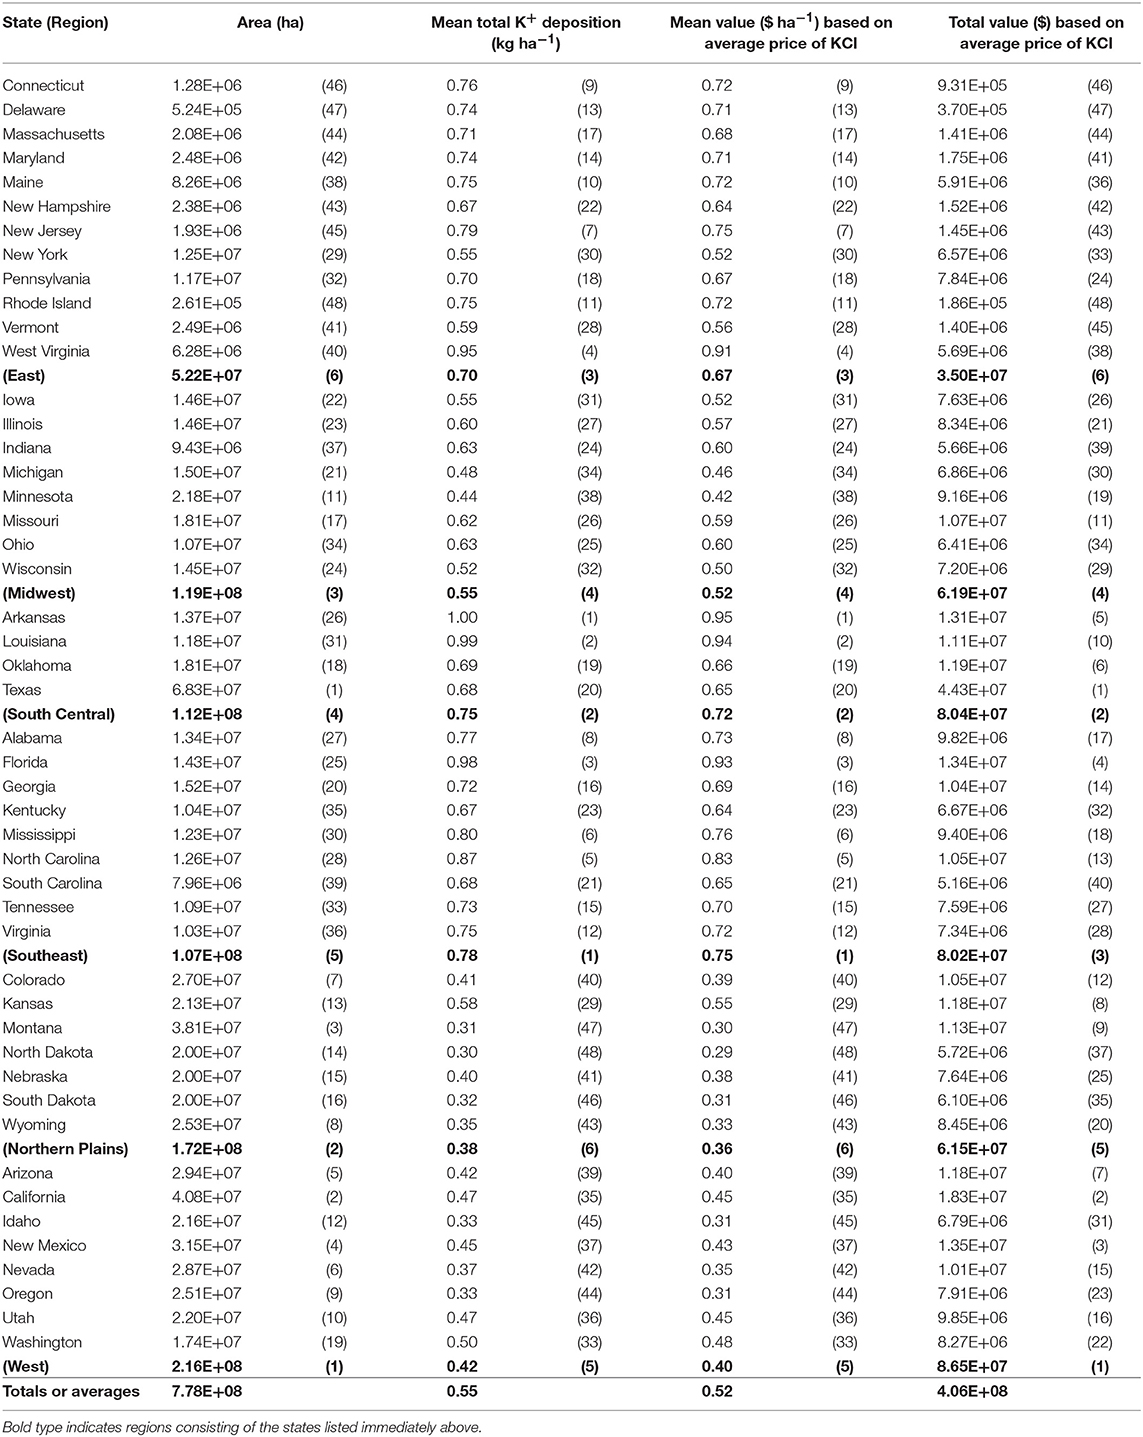
Table 4. Total value (rankings) and area-averaged value (rankings) of annual atmospheric total K+ deposition for each state (region) for the 16-year period 2000–2015 based on a moving 5-year average price of U.S. $500 per metric ton of potassium chloride (KCl) (Yager, 2016).
Discussion
Losses of potassium from the soil, particularly from highly leached and weathered soils, is a major problem causing soil degradation and threatening sustainable agriculture and development. Although several studies have attempted to conduct potassium audits at various scales, these audits lack monetary evaluation and rarely include the atmospheric K+ contribution (Sheldrick et al., 2002). An important distinction related to the potential impact of potassium deposition is if agricultural productivity increases with potassium additions which depends on the soil type and existing potassium stocks. Areas where deposition may have more significant impact are indicated by states where a higher percentage of soil samples require potassium additions to avoid profit loss (Figure 5). Deposition of potassium from the atmospheric to land surfaces can be a source of K+ to soils as well, for example, potassium in the rain across the U.S. tends to have relatively small and uniform concentrations (0.1–0.2 mg/l) over the whole country (Junge and Werby, 1958). Potassium from marine sources accounts for about 10% of K+ in the U.S. continental rain (Berner and Berner, 1996). Non-marine sources of K+ vary from area to area and include: dissolution of soil dust, potassium-containing fertilizers, pollen and seeds, biogenic and anthropogenic aerosols, and burning (e.g., forest, grasslands, etc.) (Berner and Berner, 1996). It is interesting to note that some states which have relatively high deposition rates of K+ (Figure 2) also have high crop needs for K+ fertilization (Figure 5); these states tend to be in the Southeast U.S. with Ultisols being the dominant soil order. Ultisols are highly weathered and leached soils, with low ability to retain nutrients in the soil matrix that are enriched in kaolinitic clays. Das et al. (2019) also reported a high need for K+ fertilization in cultivated kaolinitic red soils in eastern India.
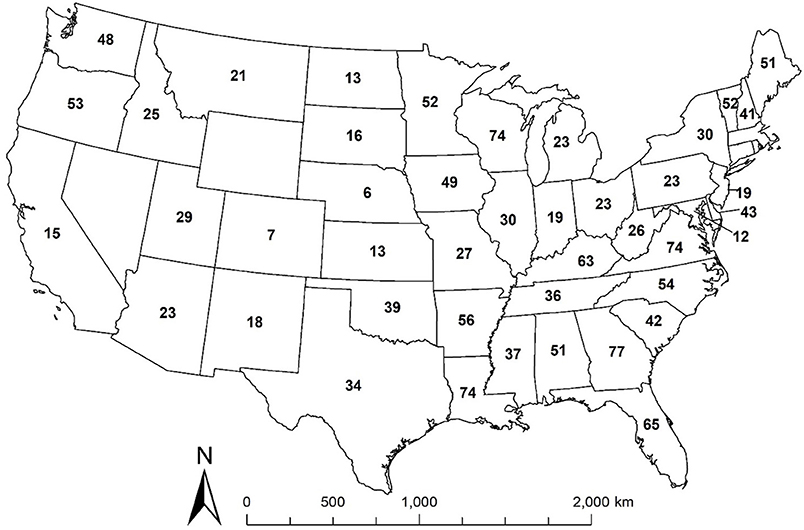
Figure 5. Percent of soil samples, which need yearly K additions to prevent loss of profit for the majority of agricultural crops in 2005 for different states in the contiguous United States (modified from Fixen et al., 2007).
The fact that atmospheric K+ deposition is not accounted for in the market can result in externalities leading to the inefficient use of soil resources, human-derived fertilizers, and decision-making about agricultural production (Groshans et al., 2018a,b). This study quantified and mapped contribution of atmospheric K deposition to soil provisioning ecosystem, services in the contiguous United States based on fertilizer replacement costs. The replacement cost method is best used in cases such as this, where it is employed to establish the economic value of a single, rather than multiple, ecosystem services (Sundberg, 2004). According to Heal (2000), there are pros and cons associated with the replacement cost approach. One of the advantages is that “it can work even if there is no marketed service for which the natural service contributed” (Heal, 2000). In other words, it allows one to estimate the monetary values of ecosystem services in an indirect way, even when ecological data are absent in the market. On the other hand, “replacements rarely replace all the services, so they capture only a part of the value” (Heal, 2000). Therefore, under some conditions, the replacement cost method may overestimate or underestimate the value of an ecosystem service (Pearce et al., 1996). It has also been argued that replacement cost “is not a proper estimate of the value unless the cost is incurred, however, if the supply were to start running out, then the market price would rise toward the replacement cost, which would become more relevant as an indicator of value” (Heal, 2000). Finally, the replacement cost method is based on the idealized assumption that the replacements used are perfect substitutes for ecosystem services and environmental goods. Such perfect substitutes, however, rarely exist (Edwards-Jones et al., 2000). Atmospheric K+ deposition is an important source of potassium because it is currently considered to be a “free public good,” which does not cost anything to produce, purchase, and distribute compared to commercial potassium fertilizers. It is not evenly distributed within the landscape and can fluctuate depending on the dynamic nature of the atmospheric deposition.
Failure to account for the value of atmospheric K+ deposition in the market can result in externalities that lead to the inefficient use of soil resources and poor decision-making about agricultural production (Groshans et al., 2018a). There are two potential methods for assessing the economic value of environmental resources. The first of these, the preference-based method, measures value in terms of individuals' willingness to pay (WTP) for environmental resources or their willingness to accept (WTA) compensation if they were deprived of those resources. The higher the WTP or WTA, the more the resource is worth. The second method for assessing the value of ecosystem resources is the cost-based method. This typically employs the “replacement cost” method, which measures the value of ecosystem goods and services by determining how much it would cost to replace them if they were damaged.
Both methods have their own strengths and weaknesses. When market information about the ecosystem service in question is adequate, the preference-based system can be quite useful, since WTP or WTA can be measured directly, as individuals can easily express their WTP or WTA based on the available market information. Although such direct measurement of WTP and WTA is the most straightforward and accurate approach, it's not frequently used in the evaluation of environmental resources, as the market information is usually inadequate in such cases.
When market information is inadequate, however, WTP or WTA can still be indirectly measured by examining the demands for related goods in the market. The Hedonic Pricing Method (HPM) is the most popular used method for indirectly measuring WTP and WTA. This method works by comparing the market prices of two goods that differ only in their ecosystem characteristics and services (De Groot et al., 2002). A classic example of this method is a study conducted by Wilson and Carpenter (1999) to determine the value of freshwater ecosystem services in the US. In their study, two properties were identified that were identical with the exception of the water quality for wetlands, rivers, streams, and lakes. The value of the water quality was determined by the difference in value between these two properties. While the HPM can be quite useful, the biggest challenge is to find two identical sites that differ only with respect to the particular ecosystem characteristic being studied. This is especially difficult when ecosystem services overlap and interact with each other, making it nearly impossible to isolate a single characteristic for study. Given these considerations, the preference-based method—whether direct or indirect—is not the appropriate approach for this study. This is because the market information regarding the atmospheric deposition of K+ is lacking, thereby ruling out the possibility of direct measurement, while indirect measurement is also ruled out by the fact that it would be nearly impossible to find the sort of nearly identical sites, differing only in their atmospheric K+ deposition, that would be necessary to conduct such a measurement. Thus, the cost-based approach is a more appropriate alternative for this study.
The replacement cost method is well-suited to cases such as this, where it will be employed to establish the economic value of a single ecosystem service, rather than several at once (Sundberg, 2004). According to Heal (2000), there are other pros and cons associated with the replacement cost approach. One of the advantages is that “it can work even if there is no marketed service for which the natural service contributed” (Heal, 2000). In other words, it allows one to estimate the monetary values of ecosystem services in an indirect way, even when ecological data are absent in the market, as is the case for the present study. On the other hand, “replacements rarely replace all the services, so they capture only a part of the value” (Heal, 2000). Thus, under some conditions, the replacement cost method may over- or underestimate the value of an ecosystem service (Pearce et al., 1996). It has also been argued that replacement cost “is not a proper estimate of the value unless the cost is incurred, however, if the supply were to start running out, then the market price would rise toward the replacement cost, which would become more relevant as an indicator of value” (Heal, 2000). Finally, the replacement cost method is based on the idealized assumption that the replacements used are perfect substitutes for ecosystem services and environmental goods. Such perfect substitutes, however, rarely exist (Edwards-Jones et al., 2000). Despite these drawbacks, however, the replacement cost method is still the most appropriate approach for the present study, as it at least makes possible the assessment of the economic value of atmospheric K+ deposition, even if those evaluations are somewhat idealized.
Conclusions
Atmospheric deposition contains remarkable quantities of potassium (K+), which can be considered a fertilizing material, but it has not been included in economic valuations of ecosystem services. These flows represent potential quantifiable ecosystem services provided by the atmosphere and deposited on land which provides important information across the contiguous United States for potassium audits on a more site-specific basis. Local audits could use the deposition information combined with soil and crop information to determine its realized value. NADP contains data on wet, dry, and total K+ deposition within the contiguous U.S. The amount of this atmospheric K+ fertilizing material varies by science-based biophysical accounts (e.g., soil order, parent material, climate etc.), and boundary-based administrative accounts (e.g., country, state, region etc.). This spatial distribution information could be linked to existing or future policy with regards to sustainable soil nutrient management. The fact that atmospheric K+ deposition has positive value but zero market price results in the negative externality and the inefficient use of land. Estimating the replacement cost of atmospheric K+ deposition is the crucial step to correcting the market failure. The results of this study provide market-based replacement costs of atmospheric K+ deposition within the administrative boundaries. Future research on atmospheric K+ deposition and ecosystems services should combine spatial and temporal variation in atmospheric replacement costs or other methods of valuation. Another important future research consideration is understanding supply and demand for atmospheric K+ deposition in terms of ecosystem services to meet the SDGs.
Author Contributions
EM: conceptualization. EM and MS: methodology. GP and MC: visualization. EM, GP, CP, MS, and LZ: writing—review and editing.
Funding
Clemson University provided funding for this study. Technical Contribution No. 6680 of the Clemson University Experiment Station. This material is based upon work supported by NIFA/USDA, under projects: SC-1700541.
Conflict of Interest Statement
The authors declare that the research was conducted in the absence of any commercial or financial relationships that could be construed as a potential conflict of interest.
Acknowledgments
This study was based on data from the National Atmospheric Deposition Program (NRSP-3).
References
Baveye, P. C., Baveye, J., and Gowdy, J. (2016). Soil “ecosystem” services and natural capital: critical appraisal of research on uncertain ground. Front. Env. Sci. 4, 1–48. doi: 10.3389/fenvs.2016.00041
Berner, E. K., and Berner, R. A. (1996). Global Environment: Water, Air, and Geochemical Cycles. Upper Saddle River, NJ: Prentice Hall.
Bilias, F., and Barbayiannis, N. (2019). Potassium availability: an approach using thermodynamic parameters derived from quantity-intensity relationships. Geoderma 338, 355–364. doi: 10.1016/j.geoderma.2018.12.026
Brady, N. C., and Weil, R. R. (2002). The Nature and Properties of Soils, 13th Edn. Upper Saddle River, NJ: Prentice Hall.
Costanza, R., d'Arge, R., Groot, R., Farber, S., Grasso, M., Hannon, B., et al. (1997). The value of the world's ecosystem services and natural capital. Nature 387, 253–260. doi: 10.1038/387253a0
Daly, C., Halbleib, M., Smith, J. I., Gibson, W. P., Dogget, M. K., Taylor, G. H., et al. (2008). Physiographically sensitive mapping of climatological temperature and precipitation across the conterminous United States. Int. J. Climatol. 28, 2031–2064. doi: 10.1002/joc.1688
Das, D., Dwivedi, B. S., Datta, S. P., Datta, S. C., Meena, M. C., Agarwal, B. K., et al. (2019). Potassium supplying capacity of a red soil from eastern India after forty-two years of continuous cropping and fertilization. Geoderma 341, 76–92. doi: 10.1016/j.geoderma.2019.01.041
De Groot, R. S., Wilson, M. A., and Boumans, R. M. (2002). A typology for the classification, description and valuation of ecosystem functions, goods and services. Ecol. Econ. 41, 393–408. doi: 10.1016/S0921-8009(02)00089-7
Denne, J. E., Luza, K. V., Richmond, G. M., Jensen, K. M., Fishman, W. D., and Wermund, G. (1993). “Quaternary geologic map of the Wichita 4° × 6° Quadrangle, United States. Map NJ-14”, in Quaternary Geologic Atlas of the United States, eds. G. M. Richmond and A. C. Christiansen Misc. Invest. Ser. Map I-1420 (Denver, CO: USGS).
Dominati, E., Patterson, M., and Mackay, A. (2010). A framework for classifying and quantifying the natural capital and ecosystem services of soils. Ecol. Econ. 69, 1858–1868. doi: 10.1016/j.ecolecon.2010.05.002
Edwards-Jones, G., Davies, B., and Hussain, S. S. (2000). Ecological Economics: An Introduction. Oxford: Blackwell Science.
Fixen, P. E., Bruulsema, T. W., Johnston, A. M., Mikkelsen, R. L., Murrell, T. S., Snyder, C. S., et al. (2007). The Fertility of North American Soils. International Plant Nutrition Institute (IPNI). Available online at: http://www.ipni.net/article/IPNI-3030
Gowdy, J. M. (1997). The value of biodiversity: markets, society, and ecosystems. Land Econ. 73, 25–41. doi: 10.2307/3147075
Gray, H. H., Bleuer, N. K., Lineback, J. A., Swadley, W. C., Richmond, G. M., Miller, R. A., et al. (1991). “Quaternary geologic map of the Louisville 4° × 6° Quadrangle, United States. Map NJ-16”, in Quaternary Geologic Atlas of the United States, eds. G. M. Richmond, and D.S. Fullerton. Misc. Invest. Ser. Map I-1420 (Denver, CO: USGS).
Groshans, G., Mikhailova, E., Post, C., Schlautman, M., Cope, M., and Zhang, L. (2018c). Contribution of atmospheric deposition to soil provisioning ecosystem services in the contiguous United States: Part 2. Magnesium. ProScience 5, 52–57. doi: 10.14644/dust.2018.009
Groshans, G. R., Mikhailova, E. A., Post, C. J., and Schlautman, M. A. (2018a). Accounting for soil inorganic carbon in the ecosystem services framework for the United Nations sustainable development goals. Geoderma 324, 37–46. doi: 10.1016/j.geoderma.2018.02.009
Groshans, G. R., Mikhailova, E. A., Post, C. J., Schlautman, M. A., Zurqani, H. A., and Zhang, L. (2018b). Assessing the value of soil inorganic carbon for ecosystem services in the contiguous United States based on liming replacement costs. Land 7:149. doi: 10.3390/land7040149
Hallberg, G. R., Lineback, J. A., Mickelson, D. M., Knox, J. C., Goebel, J. E., Hobbs, H. C., et al. (1991). “Quaternary geologic map of the Des Moines 4° × 6° Quadrangle, United States. Map NK-15”, in Quaternary Geologic Atlas of the United States, eds. G. M. Richmond, D. S. Fullerton, and A. C. Christiansen Misc. Invest. Ser. Map I-1420 (Denver, CO: USGS).
Hamza, W. (2008). Nutritive contribution of Sahara dust to aquatic environment productivity: a laboratory experimental approach. Verh. Internat. Verein. Limnol. 30, 82–86. doi: 10.1080/03680770.2008.11902089
Hasanuzzaman, M., Borhannuddin, M. H. M., Nahar, K., Hossain, M. S., Mahmud, J. A., Hossen, M. S., et al. (2018). Potassium: a vital regulator of plant responses and tolerance to abiotic stresses. Agronomy 8:31. doi: 10.3390/agronomy8030031
Havlin, J. L., Beaton, J. D., Tisdale, S. L., and Nelson, W. L. (1999). Soil Fertility and Fertilizers: An Introduction to Nutrient Management, 6th Edn. Upper Saddle River, NJ: Prentice Hall.
Heal, G. (2000). Nature and the Marketplace: Capturing the Value of Ecosystem Services. Covelo, CA: Island Press.
Holbrook, D. F., Gilliland, W. A., Luza, K. V., Pope, D. E., Wermund, E. G., Miller, R. A., et al. (1990). “Quaternary geologic map of the Vicksburg 4°x 6° Quadrangle, United States. Map NI-15,” in Quaternary Geologic Atlas of the United States, eds. G. M.Richmond, and D. S. Fullerton. Misc. Invest. Ser. Map I-1420 (Denver, CO: USGS).
Holzman, D. C. (2012). Accounting for nature's benefits: the dollar value of ecosystem services. Environ Health Perspect. 120, A153–A157. doi: 10.1289/ehp.120-a152
Islam, S., Timsina, J., Salim, M., Majumdar, K., and Gathala, M. K. (2018). Potassium supplying capacity of diverse soils and K-use efficiency of maize in South Asia. Agronomy 8:121. doi: 10.3390/agronomy8070121
Junge, C. E., and Werby, R. T. (1958). The concentration of chloride, sodium, potassium, calcium and sulfate in rainwater over the United States. J. Meteorol. 15, 417–425. doi: 10.1175/1520-0469(1958)015andlt;0417:TCOCSPandgt;2.0.CO;2
Keestra, S.D., Bouma, J., Wallinga, J., Tittonell, P., Smith, P., Cerda, A., et al. (2016). The significance of soils and soil science towards realization of the United Nations Sustainable Development Goals. Soil 2, 111–128. doi: 10.5194/soil-2-111-2016
Kohfeld, K. E., and Harrison, S. P. (2001). DIRTMAP: the geological record of dust. Earth Sci Rev. 54, 81–114. doi: 10.1016/S0012-8252(01)00042-3
Lineback, J. A., Bleuer, N. K., Mickelson, D. M., Ferrand, W. R., and Goldthwait, R. P. (1983). “Quaternary geologic map of the Chicago 4° × 6° Quadrangle, United States. Map NK-16,” in Quaternary Geologic Atlas of the United States, eds. G. M.Richmond, and D. S. Fullerton. Misc. Invest. Ser. Map I-1420 (Denver, CO: USGS).
Lovett, J. C., and Noel, S. (2008). Valuing ecosystem goods and services. Afr. J. Ecol. 46, 117–118. doi: 10.1111/j.1365-2028.2008.00988.x
Mahowald, N. M., Scanza, R., Brahney, J., Goodale, C. L., Hess, P. G., Moore, J. K., et al. (2017). Aerosol deposition impacts on land and ocean carbon cycles. Curr. Clim. Change Rep. 3, 16–31. doi: 10.1007/s40641-017-0056-z
Manning, D. A. C. (2010). Mineral sources of potassium for plant nutrition. A review. Agron Sustain Dev. 30, 281–294. doi: 10.1051/agro/2009023
Mikhailova, E., Cope, M., Groshans, G., Post, C., Schlautman, M., and Zhang, L. (2018). Contribution of atmospheric deposition to soil provisioning ecosystem services in the contiguous United States: Part 1. Calcium. ProScience 5, 58–68. doi: 10.14644/dust.2018.010
Millennium Ecosystem Assessment (MEA) (2005). Ecosystems and Human Well-Being: Synthesis. Millennium Ecosystem Assessment Series. World Resources Institute. Washington, DC: Island Press.
Miller, R. A., Maher, S. W., Copeland, C. W., Rheams, J., LeNeathery, K. F., Gilliland, T., et al. (1988). “Quaternary geologic map of the Lookout Mountain 4° × 6° Quadrangle, United States. Map NI-16,” in Quaternary Geologic Atlas of the United States, eds. G. M. Richmond, and D. S. Fullerton. Misc. Invest. Ser. Map I-1420 (Denver, CO: USGS).
National Atmospheric Deposition Program (NRSP-3) (2018). National Atmospheric Deposition Program (NRSP-3). Madison, WI: Wisconsin State Laboratory of Hygiene. Available online at: http://nadp.slh.wisc.edu/
Pearce, D., Moran, D., and Shresta, R. K. (1996). “The economic value of biodiversity,” in Natural Resources Forum Vol. 20. (London: Butterworths), 79.
Rawat, J., Sanwal, P., and Saxena, J. (2016). “Potassium and its role in sustainable agriculture,” in Potassium Solubilizing Microorganisms for Sustainable Agriculture, eds V.S. Meena, et al. (Chennai: Springer Nature Group), 235–253.
Sardans, J., and Peñuelas, J. (2015). Potassium: a neglected nutrient in global change. Global Ecol. Biogeogr. 24, 261–275. doi: 10.1111/geb.12259
Sheldrick, W. F., Syers, J. K., and Lingard, J. (2002). A conceptual model for conducting nutrient audits at national, regional and global scales. Nutr. Cycl. Agroecosys. 62, 61–67. doi: 10.1023/A:1015124930280
Sundberg, S. (2004). Replacement Costs as Economic Values of Environmental Change: A Review and an Application to Swedish Sea Trout Habitats. Stockholm: Beijer International Institute of Ecological Economics; The Royal Swedish Academy of Sciences. Available online at: http://citeseerx.ist.psu.edu/viewdoc/download?doi=10.1.1.632.4004andrep=rep1andtype=pdf
Swain, E. B., Engstrom, D. R., Brigham, M. E., Henning, T. A., and Brezonik, P. L. (1992). Increasing rates of atmospheric mercury deposition in midcontinental North America. Science 257, 784–787. doi: 10.1126/science.257.5071.784
Swap, R., Garstang, M., Greco, S., Talbot, R., and Kållberg, P. (1992). Saharan dust in the Amazon Basin. Tellus B Chem. Phys. Meteorol. 44, 133–149. doi: 10.3402/tellusb.v44i2.15434
Swinehart, J. B., Dreezen, V. H., Richmond, G. M., Tipton, M. J., Bretz, R., Steece, F. V., et al. (1994). “Quaternary geologic map of the Platte River 4° × 6° Quadrangle, United States. Map NK-14,” in Quaternary Geologic Atlas of the United States, ed. G. M. Richmond. Misc. Invest. Ser. Map I-1420 (Denver, CO: USGS).
U.S. Department of Health and Human Services and U.S. Department of Agriculture (2015-2020). Dietary Guidelines for Americans, 8th Edn. Available online at: http://health.gov/dietaryguidelines/2015/guidelines/
USDA/ER (2019). Fertilizer Use and Price. Available online at: https://www.ers.usda.gov/data-products/fertilizer-use-and-price.aspx
USGS (2016). Minerals Yearbook, 2014: Stone, Crushed [Advance Release]. U.S. Department of the Interior, U.S. Geological Survey. Available online at: https://minerals.usgs.gov/minerals/pubs/commodity/stone_crushed/myb1-2014-stonc.pdf
Whitfield, J. W., Ward, R. A., Denne, J. E., Holbrook, D. F., Bush, W. V., Lineback, J. A., et al. (1993). “Quaternary geologic map of the Ozark Plateau 4° × 6° Quadrangle, United States. Map NJ-15,” in Quaternary Geologic Atlas of the United States, eds. G. M. Richmond, and D. S. Fullerton. Misc. Invest. Ser. Map. I-1420. (Denver, CO: USGS).
Wilson, M. A., and Carpenter, S. R. (1999). Economic valuation of freshwater ecosystem services in the United States: 1971–1997. Ecol. Appl. 9, 772–783. doi: 10.1890/1051-0761(1999)009[0772:EVOFES]2.0.CO;2
Keywords: agriculture, fertilization, flow, potassium chloride, STATSGO
Citation: Mikhailova EA, Post GC, Cope MP, Post CJ, Schlautman MA and Zhang L (2019) Quantifying and Mapping Atmospheric Potassium Deposition for Soil Ecosystem Services Assessment in the United States. Front. Environ. Sci. 7:74. doi: 10.3389/fenvs.2019.00074
Received: 18 January 2019; Accepted: 14 May 2019;
Published: 21 June 2019.
Edited by:
Philippe C. Baveye, AgroParisTech Institut des Sciences et Industries du Vivant et de L'environnement, FranceReviewed by:
Meihua Deng, ZheJiang Academy of Agricultural Sciences, ChinaFotis Bilias, Aristotle University of Thessaloniki, Greece
Copyright © 2019 Mikhailova, Post, Cope, Post, Schlautman and Zhang. This is an open-access article distributed under the terms of the Creative Commons Attribution License (CC BY). The use, distribution or reproduction in other forums is permitted, provided the original author(s) and the copyright owner(s) are credited and that the original publication in this journal is cited, in accordance with accepted academic practice. No use, distribution or reproduction is permitted which does not comply with these terms.
*Correspondence: Elena A. Mikhailova, eleanam@clemson.edu