Small-Scale Spatial Variability of Soil Chemical and Biochemical Properties in a Rewetted Degraded Peatland
 Wakene Negassa
 Christel Baum
 Andre Schlichting
  Jürgen Müller
 Peter Leinweber
- Faculty of Agricultural and Environmental Sciences, University of Rostock, Rostock, Germany
There is indication in the literature that degradation of natural peatlands reduced spatial variability of soil chemical and biochemical properties. However, we lack empirical data on the impact of rewetting peatland on the spatial variability of these properties. We investigated the spatial variability of the soil properties of a peatland that has been used for extensive and intensive grazing from 1400 to 1970. The peatland has been rewetted since 1970, and we collected 50 soil samples from 50 grid cells of 0–10, and 10–20 cm soil depths in October 2001. We measured 33 important soil chemical and biochemical properties and evaluated the data with descriptive and geospatial statistical analyses. The concentrations of most plant available nutrients were low with high coefficients of variation (CV) that ranged from 15 to 117%, whereas the CV of most of the total and oxalate extracted elements was ≤15% CV. The degree of phosphorus (P) saturation (DPS) and P saturation ratio (PSR) were 11% and 0.05, which were low as compared to the threshold levels of 25% DPS and 0.11 PSR for mineral and wetland soils. The microbial biomass C and N ranged from 389 to 2,463 mg kg−1 and 32 to 215 mg kg−1 at the depth of 0–10 cm and from 343 to 1570 mg kg−1 and 14 to 160 mg kg−1 at the depth of 10–20 cm, respectively. Similarly, the dehydrogenase and β-glucosidase activities were lower by 76 and 61% at the soil depth of 10–20 cm compared to the upper 10 cm. The geospatial statistical analysis revealed that 87% of the soil chemical properties were spatially correlated and 85% of the spatial correlation was strong with <0.20 nugget to sill ratio at 5 to 12 m ranges. Similarly, 86 and 71% of the biochemical properties were strongly spatially correlated at the depth of 0–10, and 10–20 cm, respectively, with ≤0.16 nugget to sill ratio at the short ranges (4 to 6 m). The strong spatial correlation of most of the soil chemical and biochemical properties at short ranges indicate the high variability of the rewetted peatland.
Introduction
Soil chemical and biochemical properties may vary strongly from small scale to large scale that influence services and functions obtained from peatland ecosystems (Jenerette and Wu, 2004). The heterogeneity is apparent in peatlands at landscape, habitat, and microscales (Larkin, 2016). A previous study showed that spatial heterogeneity of soil chemical and biochemical properties can be reduced after degradation of natural peatlands (Brooks et al., 2005). However, rewetting degraded peatlands could create spatially heterogeneous soil properties (Gallardo, 2003). For instance, alternation of water loads to peatlands can alter soil chemical and biochemical properties (Kercher and Zedler, 2004) and plant community composition (Mentzer et al., 2006) thereby nutrient transformations and release not only at the landscape scale but also at small scale. The success of restoration of degraded peatland by rewetting can depend on the type of peatland, intensity of initial degradation, peat characteristic, biota community, and climatic condition (Joosten and Clarke, 2002; Höper, 2007). These important biotic and abiotic factors can cause spatial variability that could influence the biogeochemistry of natural and rewetted peatland ecosystems (Whiting and Chanton, 2001; Bubier et al., 2003).
Most European countries, including Germany, have degraded more than 85% of their original peatlands (Joosten, 1997; Lamers et al., 2015; Joosten et al., 2017). It has been estimated that 930 000 ha of peatlands have been drained to increase the area available for agriculture in Germany and about one-third of the degraded peatlands is located in Mecklenburg–West Pomerania, northern Germany (Förster, 2009). However, considerable efforts have been undertaken to restore the degraded peatlands since 2000. Between 2000 and 2008, about 10% of the degraded peatlands was rewetted (Förster, 2009). Although the biogeochemistry of peatlands has been researched intensively (Reddy and DeLaune, 2008; Strack, 2008; Landry and Rochefort, 2012), no information is available on the influence of rewetting degraded peatlands on spatial variability of soil chemical and biochemical properties.
A number of studies have been conducted to understand the effects of peatland restoration on chemical properties and greenhouse gas emissions (Höper et al., 2008; Couwenberg, 2009; Haapalehto et al., 2011; Krüger et al., 2015; Karki et al., 2016; Herzsprung et al., 2017), bioavailable nutrients (Dietrich and MacKenzie, 2018), water table depth and vegetation composition (Bantilan-Smith et al., 2009; Haapalehto et al., 2011; Görn and Fischer, 2015). Most previous studies investigated chemical and biochemical properties in contrasting peatland management systems (Groffman et al., 1996; Bruland et al., 2006; Dick and Gilliam, 2007; Nkheloane et al., 2012), microbial colonization, and activities in constructed wetlands (Hunt et al., 1997; Truu et al., 2009), rewetted (Baum et al., 2003; Andersen et al., 2006), and natural peatlands (Gutknecht et al., 2006). Studies conducted in rewetted peatlands also mostly focused on methane, nitrous oxide, and carbon dioxide emissions (e.g., Waddington and Roulet, 1996; Dasselaar et al., 1998; Krohn et al., 2017). A few studies also investigated the phosphorus status in degraded peatland and wetland soils (Litaor et al., 2003; Zak et al., 2008; Nair, 2014; Emsens et al., 2017).
Soil spatial variability can develop from uneven litter decomposition, vegetation composition, soil moisture content, topographic position, and historical land use, and soil management practice (Baldrian, 2014). These factors could influence chemical and biochemical processes differently in different peatlands. For example, dehydrogenase enzyme mostly operates under anaerobic soil conditions (Wolinska and Stepniewska, 2012), whereas protease and acid phosphatase activities decline as soils become more anaerobic (Reddy and DeLaune, 2008). Furthermore, the rate of synthesis, release and stability of phosphatase depends on soil pH, and soil organic matter (SOM) (Tabatabai, 1994; Baldrian, 2014). The sensitivity of a soil enzyme to pH changes is variable from one soil enzyme to another (Acosta-Martínez and Tabatabai, 2000). A few studies conducted on soils in mountain forest indicated that acid phosphatase and β-glucosidase activities were spatially correlated at the range of 3 m (Yang et al., 2018), whereas, microbial biomass showed spatial variability within 6 m (Štursová et al., 2016). Similarly, soil pH and total N showed strong spatial correlation in the range of ~0.4 m to a few meters because of variations in soil moisture, vegetation, soil, and management practices (Baldrian, 2014).
Vegetation composition and distribution can significantly influence soil chemical and biochemical properties, and thereby restoration of rewetted degraded peatlands (Borga et al., 1994; Boon et al., 1996; Dick and Gilliam, 2007; Wiedermann et al., 2017). For instance, restoration of a degraded peatland depends on the recolonization of the original flora, and fauna that play a leading role in peat accumulation and nutrient cycle. Understanding the plant community composition and distribution is particularly important in a rewetted peatland for monitoring a success of a degraded peatland restoration process (Zerbe et al., 2013).
Employing conventional soil sampling and statistical analysis such as composite sampling with the assumptions of sample independent, normal sample distribution, and a randomized experimental design have less power in detecting spatial variability of soil properties than geospatial analysis (Rossi et al., 1992; Kravchenko et al., 2006; Nkheloane et al., 2012). Suitable geospatial analysis can help detect spatial variability of soil chemical and biochemical properties. The geospatial analysis has been also used successfully in detecting spatial distributions of SOM (Kravchenko et al., 2006; Kumar, 2015; Liu et al., 2015). The results of many studies indicated that correlation, linear regression and regression kriging captured spatial variability of mineral soils (Kumar et al., 2012; Wang et al., 2013). However, only a few studies used such a statistical tool to understand spatial correlation of soil chemical and biochemical properties in peatlands (Nkheloane et al., 2012; Marton et al., 2015).
The scale at which samples are collected to study spatial variability of soil chemical and biochemical properties can influence interpretations of biogeochemical processes in peatlands (Hunt et al., 1997; Gutknecht et al., 2006). To understand spatial variability in rewetted peatland, small-scale soil sampling is required as the soil environments could be heterogeneous depending on management practices and historical land uses (Klironomos et al., 1999; Truu et al., 2009). However, little information is available on spatial variability of soil chemical, and chemical properties at small scale in rewetted peatlands. Therefore, the objective of the present study was to investigate the spatial variability of selected soil chemical and biochemical properties and vegetation composition of a rewetted degraded fen peatland.
Materials and Methods
Site Description and Soil Sampling
The study site is located in a telmatic peatland of Warnow Valley, Northern Germany (Figure 1A). The site is part of about 250,000 hectares of peatlands in the Federal State of Mecklenburg-Western Pomerania, Northeast Germany. Historically, the first references to any agricultural use of these fens near Rostock date back to 1471, and the use has been very extensive for more than 400 years (Hanschke, 1996). Nearby the sampling site, there are ponds originating from peat excavation after the mid-Nineteenth century; however, the most intensive of the peatland has been started immediately after the WW2 (1945–59). Lowering of groundwater level to enable peat excavation concurrently allowed a stepwise intensification of the previously only occasional agricultural use of the peatland, which however remained only moderately intensive until the 1960s. In almost all similar fen peatlands in Northern Germany, drainage, and agricultural use have been intensified from the early 1970s on by digging deeper drainage ditches that enabled heavy machinery for compacting meadows, fertilizer application, and grass harvest to travel at the fen peatland. Two to three cuts for silage and intermitted mineral fertilizer applications became the common management regime, which essentially led to peat subsidence and mineralization, nutrient transfers into waterways (Warnow River). The intensive uses degraded the site so severely and the meadows became unproductive, cleaning of drainage ditches was given up (end 1950s). Finally, the areas were taken out of a regular agricultural use (end 1970s) and gradually rewetted passively because the drainage ditches get closed by sediment accumulation (Hanschke, 1996). The degradation of the fenland probably resulted in a more heterogeneous soil structure because of stamping through from the undulated mineral ground beneath the peat. The passive rewetting of the degraded fenland likely reduced further peat oxidation although the surface soil of the peatland usually dries for at least 2 months during summer season (June to August).
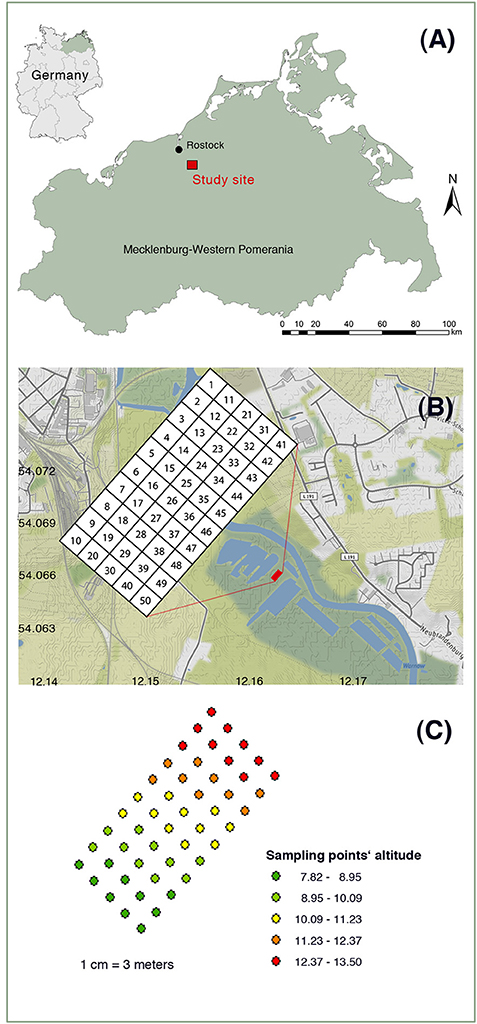
Figure 1. Location of the study site (A), plot arrangement (B), and elevations (C) of peat sampling plots.
The climate is characterized by annual means of 592 mm precipitation and 8.4°C temperature. The thickness of the peat layer is about 2.7 m and classified as Eutri-Ombric Histosol and Hemic Haplofibrist according to the World Reference Base for Soil Resources (IUSS Working Group WRB, 2015), and Soil Survey Staff (1999), respectively.
The soil samples were collected from the upper 0–10 and 10–20 cm depths after 20 years of rewetting the degraded peatland in October 2001. Samples from both depths were used for the analyses of pH, water content, and biochemical properties. Since the contents of SOM, plant available, total and oxalate-extracted elements were similar in both depths, we used only the data generated from the 0 to 10 cm depths for these soil variables. The soil samples were collected from 50 grid cells with an individual grid cell size of 3 m × 3 m (Figure 1B). A soil sample was collected from each grid cell using a Macauley sampler. After the sampling, the plant roots were removed, and the samples were homogenized. Soil water content at sampling was determined by gravimetry, whereas SOM was determined by loss-on-ignition method. Field moist samples were used for the biochemical analysis immediately after sampling or stored in a freezer until required for analysis. Separate subsamples were air dried at 35°C for the determination of selected soil chemical properties.
Chemical and Biochemical Analyses
The soil pH was determined by suspending the samples in 0.01 M CaCl2-solution with 1:2 ratio of sample to solution using a glass electrode and pH-meter. The Al, Fe, Mn, and P associated with non-crystalline minerals were extracted by acid ammonium oxalate (Schwertmann, 1964; Courchesne et al., 2008), whereas the P was extracted by sodium hypobromide (Phyp), and microwave assisted acid digestion (total P) (Dick and Tabatabai, 1977). The concentration of oxalate extracted elements and total P were determined by inductively coupled plasma-optical emission spectroscopy (ICP-OES) (Jobin Yvon 238 Ultrace, Instruments S.A. GmbH, D-85630 Grasbrunn, Germany). Furthermore, the degree of P saturation (DPS) was calculated using the following formula as suggested for wetland soils by Nair and Reddy (2013):
where Pox, Feox, and Alox were oxalate extracted P, Fe, and Al in molar concentrations. α is an empirical factor to account for the fraction of Fe and Al responsible for P sorption and researchers usually use 0.5 (Litaor et al., 2003; Nair, 2014). When the corrective factor α is omitted, the P saturation ratio (PSR) can be used which is a simple ratio of molar Pox to molar (Feox + Alox) (Nair, 2014).
The amounts of Corg and total N were determined by dry combustion using a CNS analyzer (Vario EL, Elementar Analysensysteme GmbH, D-63452 Hanau, Germany). The plant available nutrients were extracted by 0.01 M CaCl2 and measured by ICP-OES. The total K, Ca, Mg, Al, Fe, and Mn were extracted by aqua regia digestion after calcination of the soil samples and ICP- OES was used to determine their concentrations.
The microbial biomass carbon and nitrogen were extracted by 0.5 M K2SO4 solution after fumigation following the method recommended by Vance et al. (1987) and modified by Joergensen (1995). The biomass carbon was estimated using the following formula:
Where EC is the organic C extracted from fumigated soil sample minus the organic C extracted from non-fumigated soil sample, KEC = 0.45 is the proportionality factor to convert EC to microbial biomass C. EN: the flush of NH-N due to fumigation, KEN = 0.57 was the proportionality factor to convert EN to microbial biomass N (Jenkinson, 1988). The dehydrogenase, acid phosphatase and β-glucosidase activities were determined following the procedures outlined by Tabatabai (1994), whereas the protease activity by the method of Ladd and Buttler (1972).
Vegetation Analysis
We recorded species compositions of each of grid cell in August 2008, and the percent of the vegetation cover of each 50 grid cell was estimated by the “vegan” version 2.4-5 (Oksanen et al., 2017) using the R environment version 3.3.2. (R Development Core Team 2016). The vegetation data were analyzed for species diversity using the Shannon and the Simpson indices and for grid cell vegetation composition's dissimilarity by the Bray-Curtis and the Gower indices. The multivariate ordination methods “detrended correspondence analysis” (DCA) and “non-metric multidimensional scaling” (NMDS) were used to explore compositional gradients in vegetation patterns across the grid cells. Soil chemical and biological parameters were fitted to NMDS ordination to analyze soil-vegetation-relationships. Goodness of fit was tested by permutation (n = 999). Only traits with a marked correlation to the ordination matrix at the p < 0.1 level were plotted as vectors into the ordination frame.
Statistical Analysis
The descriptive statistics, correlation matrix and principal component analysis of the gravimetric water content, chemical, and biochemical properties such pH, SOM, plant available nutrients, oxalate extractable, and total elements, soil microbial biomass, and enzymes activities were analyzed using SAS version 9.4 (SAS Institute Inc., 2013). However, the spatial correlation was analyzed by Geostatistical software GS+TM version 7 (Gamma Design Software, Plainwell, Michigan, USA). We run a semivariogram analysis to evaluate the spatial correlation of soil chemical and biochemical properties. A typical semivariogram can be described by nugget effect, range and sill. Nugget represents micro-scale variation at h = 0, range is the distance at which data are no longer correlated, and sill is the plateau where the semivariogram reaches at the range (Berry, 2005). The soil chemical and biochemical properties were fitted to linear, spherical, exponential, and Gaussian models to obtain best fit based on the lowest residual sum of squares (RSS). The semivariogram was interpreted based on nugget: sill ratio. The nugget to sill ratio indicates what percent of the overall variance is found at a distance smaller than the smallest lag interval, and it gives a sense of how much variance was accounted for in the model. The nugget: sill ratio can be interpreted as strong spatial correlation (<0.25), and moderate (0.25–0.75), and no spatial correlation (>0.75) (Cambardella et al., 1994). The low nugget: sill ratio (<0.25) indicates a large part of the variance is introduced spatially that implying a strong spatial dependence and vice versa for the large nugget: sill ratio.
Results
Gravimetric Water Content, and Plant Nutrient Elements
The gravimetric water content and pH were slightly higher at the soil depth of 0–10 than at the 10–20 cm (Table 1), and the water content was in the range of 66 to 83% for the 0–10 cm depth, and 63 to 79% for the 10–20 cm soil depth. However, depths did not change pHH2O and pHCaCl2, but the pHH2O was slightly higher than pHCaCl2 at both depths. The coefficient of variation (CV) of the water content at the 0–10 cm soil depth was higher than at the 10–20 cm soil depth. Concentration of the selected plant available nutrients were low except for sulfur (S) and magnesium (Mg) (Table 2). Furthermore, the CV of most plant available nutrients were high and ranged from 15 to 117%. The CV of plant available Mn was particularly very high (117%) followed by plant available Fe (55%).
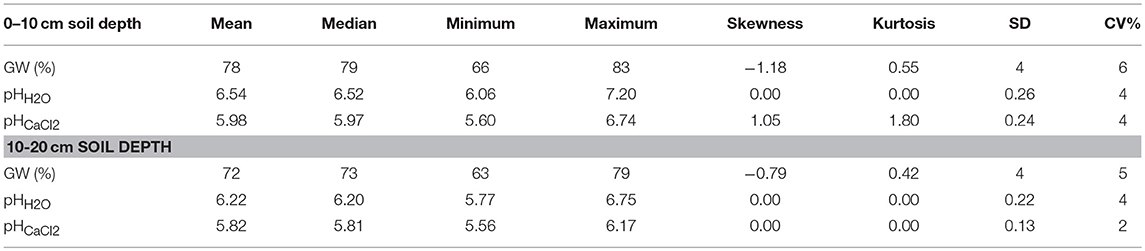
Table 1. Gravimetric water (GW) content and pH in the surface and subsurface soil of a rewetted peatland.
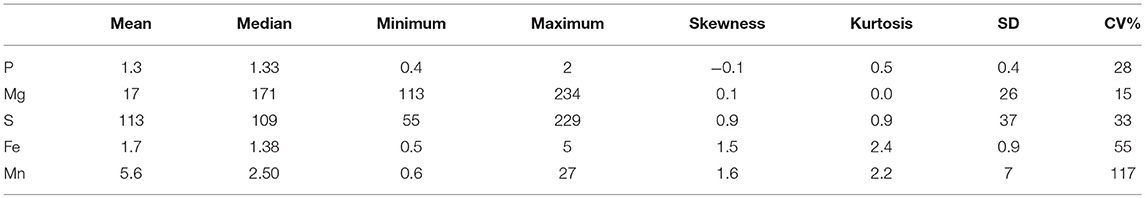
Table 2. Selected plant available nutrients (mg kg−1 dry soil) in the surface soil of a rewetted peatland.
SOM, Oxalate Extracted, and Total Elements
The concentrations of SOM, oxalate-extracted, and total elements are presented in Table 3. The SOM, Corg and total N were in the range of 490 to 760, 250 to 360, and 20 to 30 g kg−1, respectively, with CV in the range of 9 to 11%. Similarly, the concentration of total P and S were in the range of 1.4 to 1.8, and 5 to 8 g kg−1, respectively, and their CVs were in the range of 10 and 12%. The mean mass ratios of C: N, C: P, and C: S calculated from the Table 3 were 11, 213 and 53, respectively. Similarly, the N: P, and N: S ratios were 20 and 5, respectively. The hypobromide-extracted P (Phyp) was 85% of the total P extracted by aqua regia, whereas the Pox was about 29% of the total P (Table 3). The concentration of Ca was the highest followed by total Fe and Al excluding Corg and total N, whereas the concentrations of total K and Mn were the lowest.
Table 3. Soil organic matter, total, and ammonium oxalate extractable elements concentrations in the surface soil of a rewetted peatland.
The oxalate-extracted elements were in the ranges of 0.32 to 0.58 g kg−1 for Pox, 9 to 16 g kg−1 for Feox, 0.85 to 1.53 g kg−1 for Alox, and 0.2 to 0.7 g kg−1 for Mnox (Table 3). These were 29, 81, 14, and 67% of the total concentrations of P, Fe, Al, and Mn, respectively. The CV of the oxalate extracted elements were in the range of 10 to 24%, and the CV of Alox was the lowest, whereas the CV of Mnox was the highest. Furthermore, the DPS, and PSR were in the range of 7.47 to 13.16% and 0.04 to 0.07, respectively (Table 3). The CV of DPS and PSR were similar to the CV of total and oxalate extracted elements.
Biochemical Properties
The microbial biomass C ranged from 389 to 2,463 mg kg−1 (0–10 cm) and 343 to 1,570 mg kg−1 (10–20 cm). Furthermore, the microbial biomass N was in the ranges of 32 to 215 mg kg−1 (0–10 cm) and 14 to 160 mg kg−1 (10–20 cm). This resulted in microbial biomass C: N ratios of 11 (0–10 cm) and 14 (10–20 cm) (Table 4). The microbial biomass C and N were low by 46 and 55% at the 10–20 cm soil depth, respectively, as compared to that of the 0–10 cm soil depth. Similarly, the dehydrogenase and β-glucosidase activities was low by 76 and 61%, and the acid phosphatase and protease activities were low by about 23 and 6% at the depth of 10–20 cm as compared to that of the 0–10 cm soil depth, respectively.
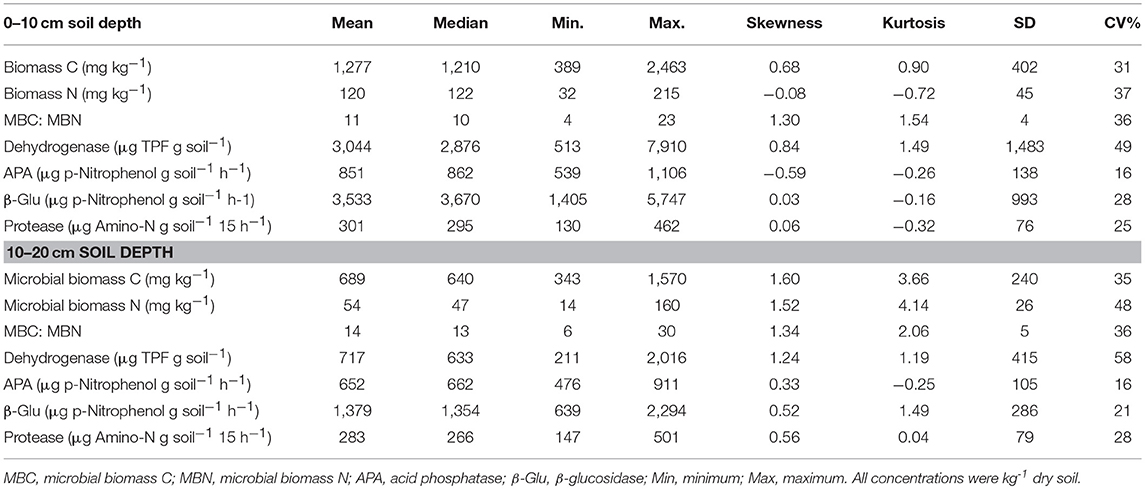
Table 4. Soil microbial biomass and enzyme activities in surface and subsurface soil of a rewetted peatland.
Relationships of Chemical and Biochemical Properties
The soil microbial biomass C was significantly (P < 0.05) correlated with the microbial biomass N, β-glucosidase, and acid phosphatase activities, whereas microbial biomass N was significantly correlated with the acid phosphatase activity (Table 5). Similarly, β-glucosidase activity was significantly correlated with dehydrogenase and acid phosphatase activities. However, there were no significant correlations between the biochemical activities and plant available nutrients except for the available P and microbial biomass N. We also observed a few significant correlations among the plant available elements. For instance, the plant available Mg was significantly correlated with plant available Mn and P.
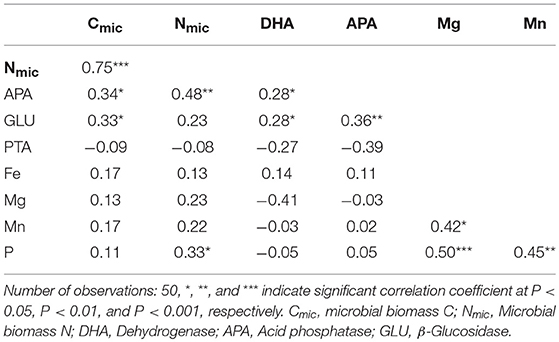
Table 5. Pearson correlation coefficient among biochemical activities and plant available nutrients in surface of a rewetted peatland.
The correlation of biochemical properties with the concentration of SOM, total and oxalate extracted elements were not significant (P > 0.05) except for the dehydrogenase activity which was significantly negatively correlated with total Ca, SOM, Corg, total N, and S (data not shown). However, the correlations among the SOM, total N, total S, total P, Phyp, and Pox and total Mn were highly significant (P < 0.001) (Table 6). These parameters were also strongly correlated with concentrations of most of the plant available nutrients. Similarly, the concentration of total Ca was strongly correlated with the concentration of SOM and most of the total elements. Furthermore, the concentration of total P was highly significantly correlated (P < 0.001) with Phyp, Mnox, and Feox, total Al, Ca, and total Fe. The concentration of total Mn was also strongly correlated with Mnox, total Fe, Feox, total Ca, and total Al. The correlation among the concentration of some plant available nutrients and total elements were positive; however, the Pox was significantly negatively correlated with the Corg, total S, total N, and Phyp.
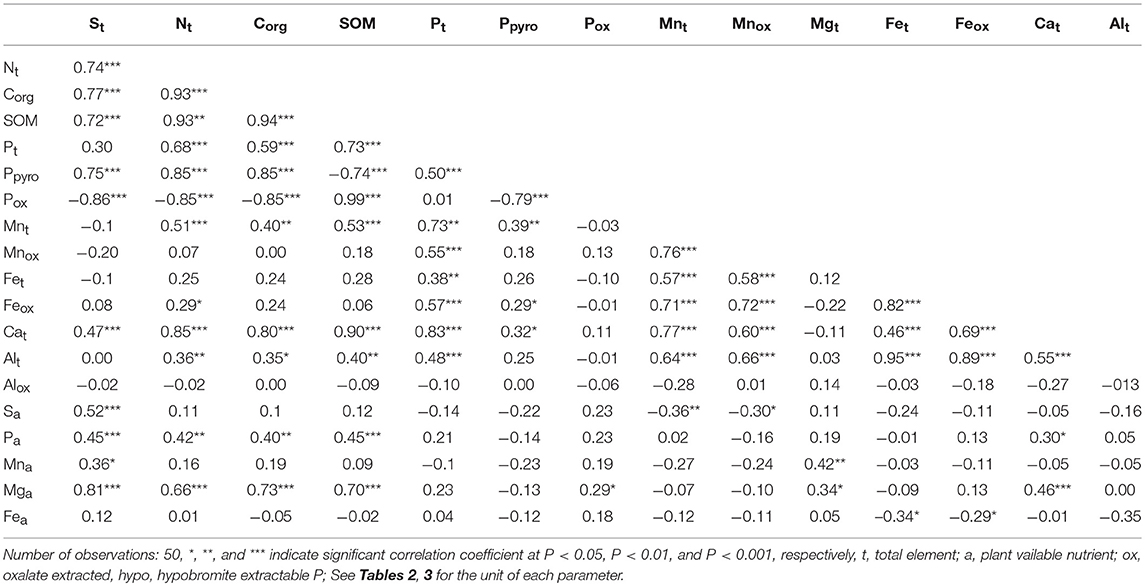
Table 6. Pearson correlation coefficients among soil organic matter, selected available plant nutrients and total element concentrations in surface soil of a rewetted peatland.
principal component analysis separated the biochemical properties in two depths in which the biochemical properties at the 0–10 cm depths mostly contributed to PC1 and those at the 10–20 cm mostly contributed to the PC2 (Figure 2). The PC1 explained about 23% of the total variance with the positive loading of microbial biomass C and N, acid phosphatase, β-glucosidase, dehydrogenase, and with the negative loading of protease of the 0–10 cm depth and β-glucosidase of 10–20 cm depth. On the other hand, PC2 explained 20% of the total variance with the positive loading of microbial biomass C and N, acid phosphatase, β-glucosidase, dehydrogenase, and negative loading of the protease at the depth of 10–20 cm. Furthermore, the principal component analysis separated the chemical properties into four main groups depending on their contribution to the total variance with positive and negative loadings where the PC1 explained 51 % and PC2 14% of the total variance (Figure 3). The high positive loading came from Corg, total N, DSP, hypobromide extracted P and water content, whereas total S, PSR, SOM, Pox, Alox, Mnox, and pH-CaCl2 contributed to the high negative loading.
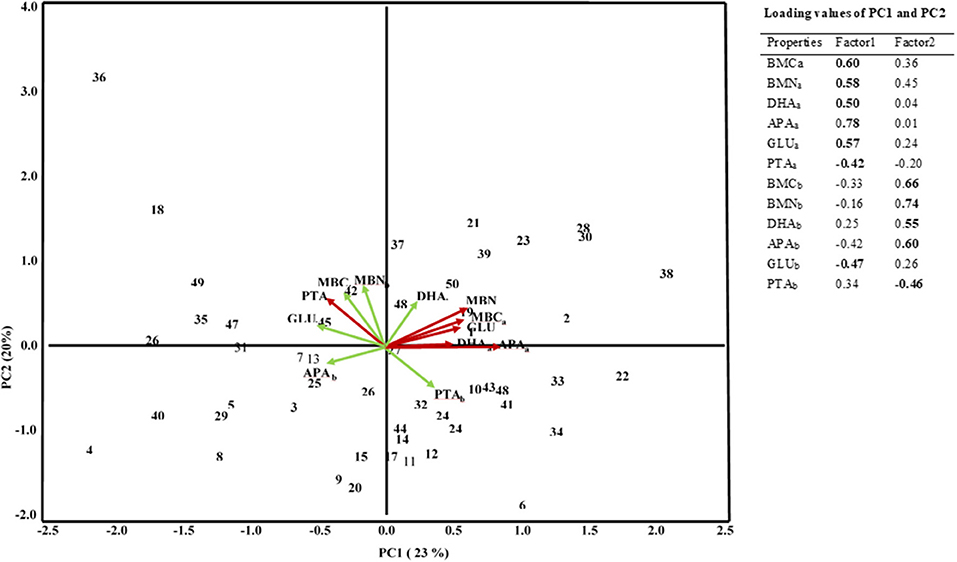
Figure 2. PCA of soil biochemical properties in a rewetted peatland. MBC, microbial biomass C; MBN, Microbial biomass N; DHA, Dehydrogenase; APA, Acid phosphatase; GLU, β-Glucosidase; PTA, Protease. The subscript “a” and “b” represent samples of 0–10 and 10–20 cm depths, respectively. Numbers in the Figure stand for the number of sampling grid cells.
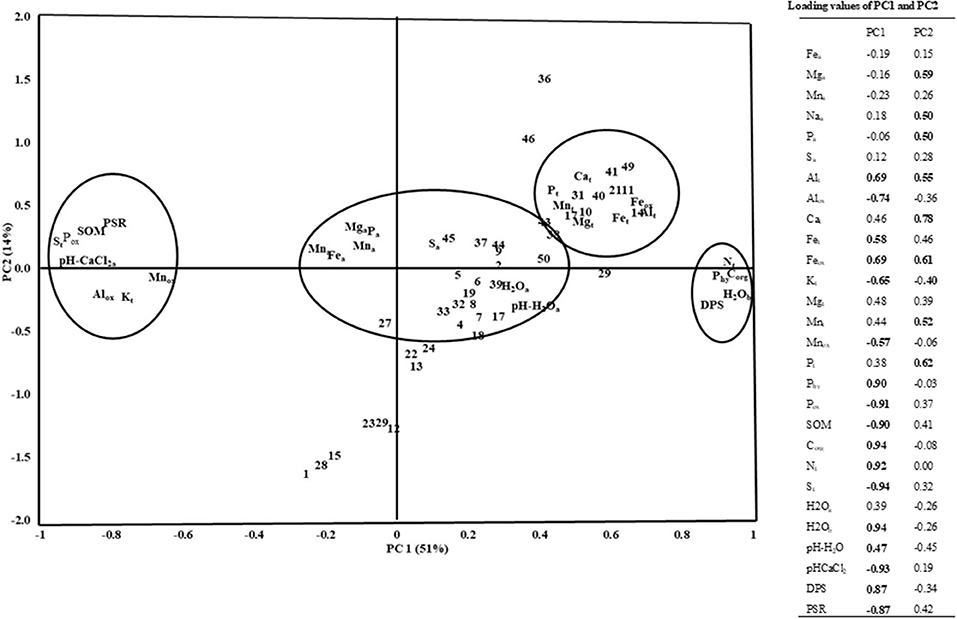
Figure 3. PCA of soil chemical properties in a rewetted peatland. Subscript: “a”: plant available elements, “t”: total element, ox, oxalate extracted elements; Phy, hypobromide extracted P; H2Oa, water content of 0–10 cm soil depth; H2Ob, water content of 10–20 cm soil depth; DPS, degree of P saturation; PSR, P saturation ratio, numbers in the Figure stand for the number of sampling grid cells.
Spatial Correlation of Chemical and Biochemical Properties
The nugget to sill ratio of soil pHH2O and pHCal2 were 0.07 and 0.16 at 6 and 10 m ranges, respectively, at the 0–10 cm soil depth (Table 7). All of the biochemical properties showed strong spatial correlation at the depths of 0–10 cm except for protease activity (Table 7 and Figure 4). The strong spatial correlation was revealed by the lowest nugget to sill ratio, which was ≤ 0.07 except for microbial biomass C where the nugget to sill ratio was 0.27. At 10–20 cm peat depth, pHH2O, pHCalcl2, microbial biomass C had no spatial correlation since they were fitted best to the linear model. However, the microbial biomass and enzymes activities were strongly spatially correlated at the soil depth of 10–20 cm except for the microbial biomass C and dehydrogenase activity. The biochemical properties were not only spatially correlated but also the spatial correlation appeared at the shortest range of 4 to 9 m (Table 7). Overall, about 86, and 71% of the biochemical properties were strongly spatial correlated at the depth of 0–10 cm, and 10–20 cm, respectively.
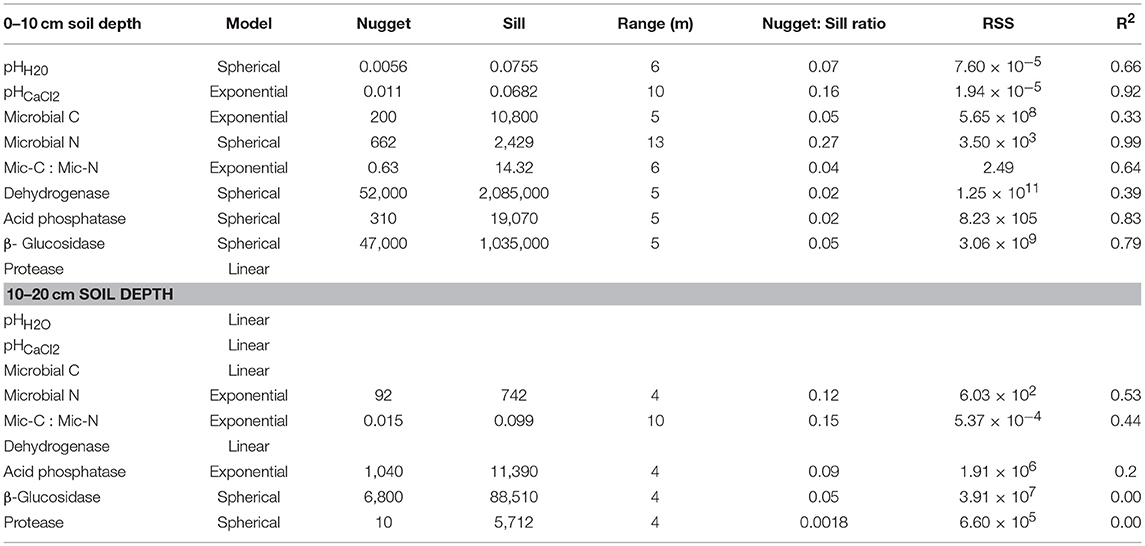
Table 7. Spatial correlation of soil pH and biochemical properties in the surface and subsurface soil of a rewetted peatland.
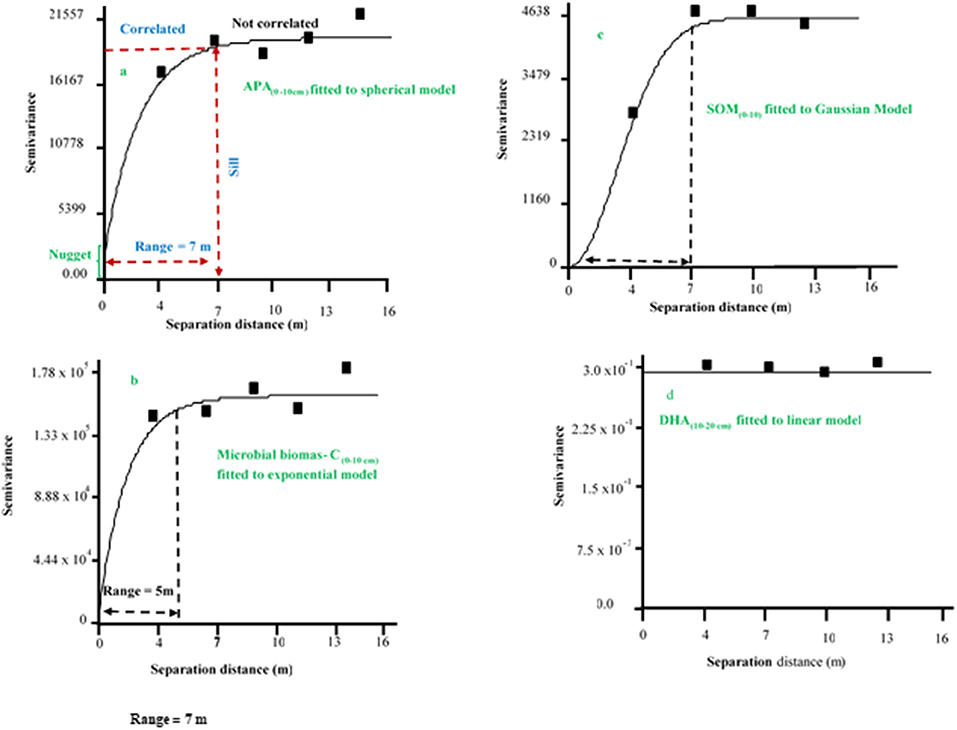
Figure 4. Example of semivariogram of soil chemical and biochemical properties fitted to spherical, exponential, Gaussian, and linear models. APA, acid phosphatase activity; SOM, soil organic matter; DHA, dehydrogenase.
The gravimetric water content, plant available nutrients, total and oxalate extracted elements showed strong spatial correlations (Table 8). In general, the nugget to sill ratio of 15 of the 24 soil properties were ≤ 0.1 at the ranges of 5 to 10 m which indicated the plant available and total elements were strongly spatially correlated at the short distance interval. Similarly, the DPS and PSR were strongly spatially correlated with the nugget to sill ratio of 0.17 and 0.16 at the range of 8 and 5 m, respectively. Among the 23 soil chemical properties, only Feox, total Al, and Fe lacked spatial correlation, whereas plant available Mn and S, and total K showed moderate spatial correlation with the nugget to sill ratio of 0.32, 0.32, and 0.41, respectively (Table 8).
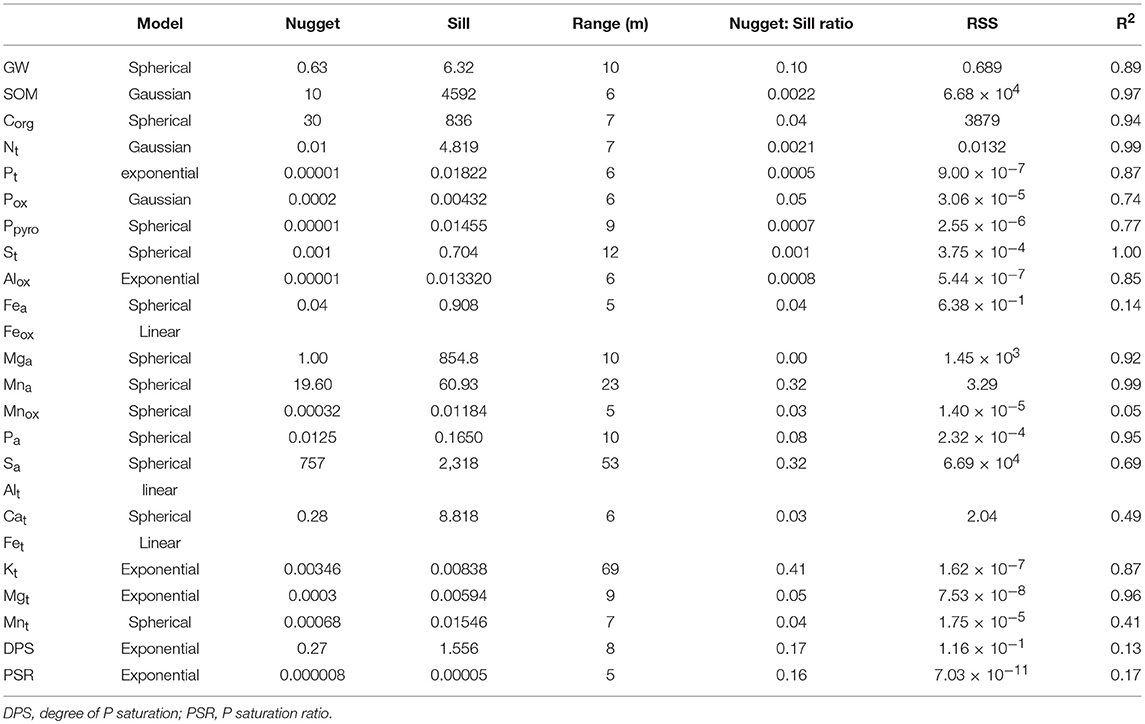
Table 8. Spatial correlation of gravimetric water content (GW), soil organic matter, available plant nutrients, total and oxalate extractable elements in the surface of a rewetted peatland.
Vegetation Composition
The vegetation composition indicated the transition from wet grassland to extensive reed (Phragmitis australis) dominated vegetation (Figure 4). Turquois colored dots in the DCA-plot indicate the plot positions as arranged according to their similarity in plant composition. The position of the single species in the ordination space is given by the brown colored BCI-name, an abbreviation of their Latin names. Five plots differed markedly in their composition of the vegetation from the conglomerated rest. NMDS was based on a Bray & Curtis dissimilarity matrix and allows a gradient analysis to explore possible soil-vegetation-relationships. Fitting of all analyzed soil-chemical and soil-biological traits as environmental variables and use them for gradient analyses was successful for Nmic, Alox, and Feox (Figure 4).
Discussion
Chemical and Biochemical Properties
The pH-H2O and pH-CaCl2 remained constant around 6 which can be attributed to the buffering capacity of CO2 in the saturated peat soil (Reddy and DeLaune, 2008). Furthermore, the low CV of pH (Table 1) can be attributed to pH is the log transformed H+ concentration. Different studies also reported ls ow CV for pH from the tropical wetlands (Nkheloane et al., 2012) and temperate bog and fens (Ulanowski and Branfireun, 2013; Barrett and Watmough, 2015).
The low concentrations of some plant available nutrients agreed with the results of previous study that indicated 0.01 M CaCl2 recovered the lowest plant available P among 14 soil P extraction methods (Wuenscher et al., 2015). This is also true for the proportion of plant available P, Fe, and Mn to their respective concentrations of total elements that were in the range of 0.01 to 1% (Tables 2, 3). We explain the low concentrations and proportions of 0.01 M CaCl2 extracted plant available nutrients by the weak extractant and/or existence of the elements in stable organic and inorganic complex forms (Table 2). Such low concentrations of plant available nutrients could jeopardize the growth and development of plant communities adapted to the drained peatlands, although plants grown in anoxic soil conditions have their own mechanisms to adapt to low plant available nutrients (Elzenga and van Veen, 2010). The highest CV of the plant available Mn followed by Fe indicated the highest variability of these plant available nutrient elements in the studied peatland.
In contrast to the plant available nutrients, the CV of the total concentrations of most elements and SOM were low (Table 3) which indicates that the rewetting and drying cycles of peats did not influence the variability of these soil constituents. Similarly, low CV was reported for SOM from restored temperate peatland and tropical wetlands (Bruland et al., 2006; Nkheloane et al., 2012).
The Feox was 81% of the total Fe that indicated the major proportion of total Fe existed in poorly crystalline mineral form (Table 3) (Courchesne et al., 2008). The higher concentration of Feox than Alox and Mnox also showed the non-crystalline Fe in the rewetted peatland could control P solubility (Nair, 2014). However, the mean of (DPS 10.6%) and PSR (0.05) in the present study were very low as compared to the threshold level of P leaching which are 25% DPS in degraded peatland (Litaor et al., 2003) and 0.11 PSR for wetland soil (Nair and Reddy, 2013). This implies that potential loss of P to the ground and drainage water could be low. Although oxalate could recover some P associated with SOM, the proportion of Pox, 29% of the total P, was comparable to the proportion of sum of inorganic P fractions in peat soils of northern Germany (Schlichting et al., 2002). According to these authors, 75–80% of the total P were organic P in the peat soils. Since more than 75% of the total P existed in organic P form, maintaining and/or improving the SOM content of peatlands by rewetting not only sequestrates C but also stores P in unavailable organic P form.
The higher biochemical activities at the soil depths of 0–10 cm than at the soil depth of 10–20 cm (Table 4) indicated the presence of enough aeration particularly during the summer season and rooting which together can increase microbial activities and transformations of organic matter (Tokarz and Urban, 2015). On the other hand, the highest dehydrogenase activity confirmed the significance of oxidoreductases under anaerobic soil conditions (Salazar et al., 2011; Wolinska and Stepniewska, 2012). Furthermore, the Corg, microbial biomass C and N of the present study were considerably lower than that reported for a rewetted peatland of Trebel valley, northern Germany (Baum et al., 2003). Similarly, the acid phosphatase activity in the current study was less than that of the Trebel valley by 3 to 4-folds. Such a great variation in enzyme activity can be attributed to seasonal and site-specific effects rewetting degraded peatland. Dehydrogenases are intracellular enzymes with indicator value for the soil microbial activity, but also for fine root activity (Zhang et al., 2010). The discrepancy of high dehydrogenase activity but low protease and acid phosphatase activities at both peat depths (0–10 and 10–20 cm) can be attributed to low aeration, since the activities of these enzymes are favored in aerobic soil conditions (Kang et al., 2005; Reddy and DeLaune, 2008; Romanowicz et al., 2015).
Correlations Among Soil Properties
The significant positive correction between soil microbial biomass C and N (Table 5) proved the well-established facts of their strong association. Similarly, the significant positive correlation between microbial biomass C and acid phosphatase activity, and microbial biomass C and β-glucosidase activity indicated that SOM and hydrology regulate the microbial biomass and enzyme activity in peat soils (Groffman et al., 1996). However, none of the content of plant available nutrients was correlated with the microbial biomass and enzyme activity, which can be attributed to less decomposition of peats because of high gravimetric water content at sampling (Table 1). The significant positive correlation of plant available P with the plant available Mg and Mn could be attributed to the pH and gravimetric water content that influenced the plant availability of these nutrient elements in the same direction.
The significant positive correlations among the SOM, Corg, total S, total N, total P and Phyp, and most plant available elements (Table 6) indicated the major source of the elements was the SOM in peat soil. However, the lack of significant correlation among microbial biomass C and Corg, microbial biomass N and total N (data not shown), can be explained by high variations between the concentration of microbial biomass and the concentration of Corg and total N. A previous study also reported that the linearity of Corg to microbial biomass C association was achieved when Corg was below 2.5% (Anderson and Domsch, 1989). However, the Corg concentration in the present study was about 14 times higher than the critical level of Corg (2.5%) to detect a significant correlation between Corg and Cmic. Furthermore, high concentration of dissolved organic carbon and permanent flooding can contribute to lack of significant correlation between microbial biomass C with Corg, and microbial biomass N with total N (Reddy and DeLaune, 2008).
Spatial Correlation
The nugget to sill ratio is a good indicator whether a given soil variable is strongly spatially correlated (<0.25), moderately spatially correlated (0.25–0.75) or weakly spatially correlated (>0.75) (Cambardella et al., 1994; Iqbal et al., 2005; Ruffo et al., 2005). Accordingly, most of the biochemical properties were not only strongly spatially correlated, but also the spatial correlation was apparent at the shortest ranges (Table 7 and Figure 4). The shortest range indicated a strong spatial variability of the soil variable under consideration. The highest spatial correlation particularly of the dehydrogenase activity was a good indicator of the overall microbial diversity in the rewetted peatland. Previous study also indicated that soil microbial activities showed strong spatial correlation below 0.25 m separation distance (Stark et al., 2004). This unequivocally indicated that a small-scale sampling is required to study biochemical properties in the rewetted degraded peatland. However, the lack of spatial correlation for the protease at the 0–10 cm soil depth and for the pH, microbial biomass C, and dehydrogenase activity at the depth of 10–20 cm can be attributed to the wet-dry cycles that could enhance variations from point to point in the rewetted degraded peatland. When a soil parameter lacks spatial correlation, reducing the sampling scale of the current study could exhibit spatial correlation (Cambardella et al., 1994) or a classic randomization block design could be used to handle the spatial variability (Kravchenko et al., 2006). The strong spatial correlation of most of the soil chemical properties could indicate the soil variables may be controlled by intrinsic soil variation (Cambardella and Karlen, 1999). Furthermore, extrinsic factors such as drainage, rewetting, historical land use and similar vegetation composition can contribute to strong spatial correlation. The vegetation composition is linked to the soil microbial colonization via rhizosphere effects and litter quality (Eisenhauer et al., 2010), and this is confirmed in our data set by the significant correlation with Nmic (Figure 5). The vegetation composition was assumed to represent a relative stable “summary” of the effects of multiple drivers, like the soil chemical properties, over time and, thus, a good predictor of the soil microbial community (Mitchell et al., 2010).
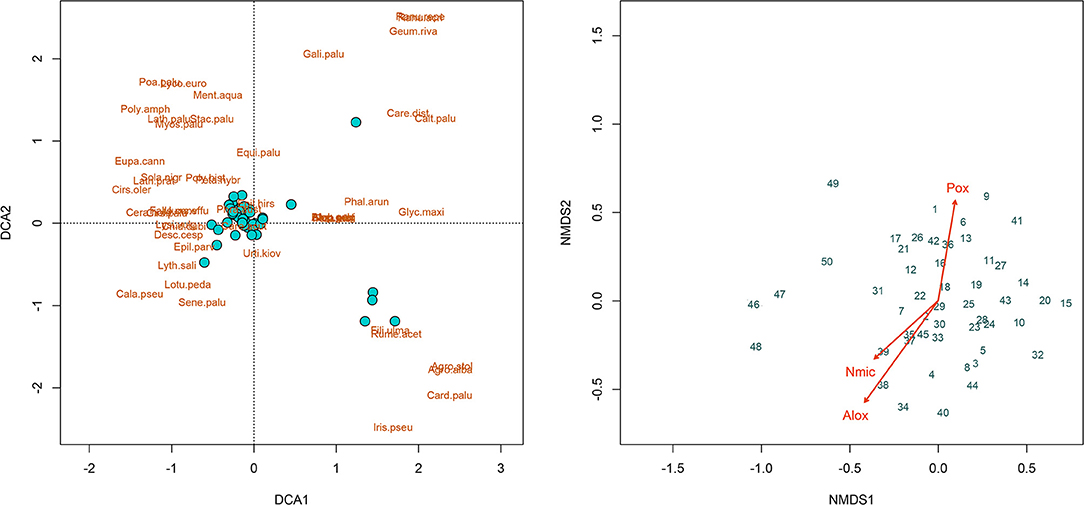
Figure 5. Ordination plots of the detrended correspondence analysis (DCA, left) and of the non-metric multidimensional scaling (NMDS, right), Numbers in the Figure stand for the number of sampling grid cells.
In conclusion, the combined use of the descriptive and geospatial spatial statistical analyses have paramount importance in disclosing the spatial variability pattern of soil chemical and biochemical properties in a rewetted degraded peatland at the small scale. Among 33 soil chemical and biochemical properties investigated in the present study, the CV of plant available nutrients were the highest. Similarly, soil biochemical activities were higher by many folds at the depth of 0–10 cm than 10–20 cm because of aeration during dry periods. Furthermore, about 88% of the soil chemical and biochemical properties were spatially correlated and 83% of the spatial correlation was strong at the ≤ 8 m range. The strong spatial correlation at such short range clearly indicated a small-scale spatial variability of the rewetted peatland. Those soil chemical and biochemical properties lacking spatial correlation were also spatially heterogeneously distributed because they varied from point to point. The main causes of such spatial variability can be attributed to slight variations in topography (Figure 1C) which are enhanced by peat degradation and subsidence. This essentially influence the soil moisture distribution and almost all biogeochemical processes that are related to moisture and redox conditions. Furthermore, direct anthropogenic influences like uneven distributions of formerly applied fertilizers have added to the spatial variability of the soil properties. Thus, small-scale sampling is required to understand the influence of rewetting degraded peatland on biogeochemistry and restoration processes thereby avoiding undesirable effects on environment.
Data Availability
All datasets generated for this study are included in the manuscript and/or the supplementary files.
Author Contributions
WN statistical data analysis and writing the manuscript. CB and AS design of the study and editing the manuscript. PL conception of the research and editing the manuscript. JM collected vegetation composition data, data analysis, and editing the manuscript.
Funding
The European Social Fund (ESF) and the Ministry of Education, Science, and Culture of Mecklenburg-Western Pomerania funded this work within the scope of the project WETSCAPES (ESF/14-BM-A55-0029/16-64160025).
Conflict of Interest Statement
The authors declare that the research was conducted in the absence of any commercial or financial relationships that could be construed as a potential conflict of interest.
Acknowledgments
The authors are grateful to Prof. R. Bill, University of Rostock, for his comments on the first draft of this manuscript and the technical assistances received from F. Beyer, W. Schomann, and M. Naumann.
References
Acosta-Martínez, V., and Tabatabai, M. A. (2000). Enzyme activities in a limed agricultural soil. Biol. Fert. Soils 31, 85–91. doi: 10.1007/s003740050628
Andersen, R., Francez, A.-J., and Rochefort, L. (2006). The physicochemical and microbial status of a restored bog in québec: identification of relevant criteria to monitor success. Soil Biol. Biochem. 38, 1375–1387. doi: 10.1016/j.soilbio.2005.10.012
Anderson, T., and Domsch, K. H. (1989). Ratios of microbial biomass carbon to total organic carbon in arable soils. Soil Biol. Biochem. 21, 471–479. doi: 10.1016/0038-0717(89)90117-X
Baldrian, P. (2014). Distribution of extracellular enzymes in soils: spatial heterogeneity and determining factors at various scales. Soil Sci. Soc. Am. J. 78, 11–18. doi: 10.2136/sssaj2013.04.0155dgs
Bantilan-Smith, M., Bruland, G. L., MacKenzie, R. A., Henry, A. R., and Ryder, C. R. (2009). A comparison of the vegetation and soils of natural, restored, and created coastal lowland wetlands in Hawai'i. Wetlands 29, 1023–1035. doi: 10.1672/08-127.1
Barrett, S. E., and Watmough, S. A. (2015). Factors controlling peat chemistry and vegetation composition in sudbury peatlands after 30 years of pollution emission reductions. Environ. Pollut. 206, 122–132. doi: 10.1016/j.envpol.2015.06.021
Baum, C., Leinweber, P., and Schlichting, A. (2003). Effects of chemical conditions in re-wetted peats on temporal variation in microbial biomass and acid phosphatase activity within the growing season. Appl. Soil Ecol. 22, 167–174. doi: 10.1016/S0929-1393(02)00129-4
Berry, J. K. (2005). Analyzing Geo-Spatial Resource Data: A Hands-on Case Study in Spatial Analysis and Data Mining. Denver, CO: University of University of Denver.
Boon, P. I., Virtue, P., and Nichols, P. D. (1996). Microbial consortia in wetland sediments: a biomarker analysis of the effects of hydrological regime, vegetation and season on benthic microorganisms. Mar. Freshwater Res. 47, 27–41. doi: 10.1071/MF9960027
Borga, P., Nilsson, M., and Tunlid, A. (1994). Bacterial communities in peat in relation to botanical composition as revealed by phospholipid fatty acid analysis. Soil Biol. Biochem. 26, 841–848. doi: 10.1016/0038-0717(94)90300-X
Brooks, R. P., Wardrop, D. H., Cole, C. A., and Campbell, D. A. (2005). Are we purveyors of wetland homogeneity? A model of degradation and restoration to improve wetland mitigation performance. Ecol. Eng. 24, 331–340. doi: 10.1016/j.ecoleng.2004.07.009
Bruland, G. L., Richardson, C. J., and Whalen, S. C. (2006). Spatial variability of denitrification potential and related soil properties in created, restored, and paired natural wetlands. Wetlands 26, 042–1056. doi: 10.1672/0277-5212(2006)26[1042:SVODPA]2.0.CO;2
Bubier, J. L., Bhatia, G., Moore, T. R., Roulet, N. T., and Lafleur, P. M. (2003). Spatial and temporal variability in growing-season net ecosystem carbon dioxide exchange at a large peatland in Ontario, Canada. Ecosystems 6, 353–367. doi: 10.1007/s10021-003-0125-0
Cambardella, C. A., and Karlen, D. L. (1999). Spatial analysis of soil fertility parameters. Precis. Agric. 1, 5–14. doi: 10.1023/A:1009925919134
Cambardella, C. A., Moorman, T. B., Novak, J. M., Parkin, T. B., Karlen, D. L., Turco, R. F., et al. (1994). Field-scale variability of soil properties in Central Iowa soils. Soil Sci. Soc. Am. J. 58, 1501–1511. doi: 10.2136/sssaj1994.03615995005800050033x
Courchesne, F., Cloutier-Hurteau, B., and Turmel, M.-C. (2008). Relevance of rhizosphere research to the ecological risk assessment of trace metals in soils. Hum. Ecol. Risk Assess. 14, 54–72. doi: 10.1080/10807030701790306
Couwenberg, J. (2009). “Methane emissions from peat soils,” in August 2009 produced for the UN-FCCC meetings in Bonn, Germany. Ede: Greifswald University; Wetlands International. Available online at: www.wetlands.org
Dasselaar, A. D. P-V., Corre, W. J., Prieme, A., Klemedtsson, A. K., Weslien, P., Stein, A., et al. (1998). Spatial variability of methane, nitrous oxide, and carbon dioxide emissions from drained grasslands. Soil Sci. Soc. Am. J. 62, 810–817. doi: 10.2136/sssaj1998.03615995006200030039x
Dick, D. A., and Gilliam, F. S. (2007). Spatial heterogeneity and dependence of soils and herbaceous plant communities in adjacent seasonal wetland and pasture sites. Wetlands 27, 951–963. doi: 10.1672/0277-5212(2007)27[951:SHADOS]2.0.CO;2
Dick, W. A., and Tabatabai, M. A. (1977). An alkaline oxidation method for determination of total phosphorus in soils. Soil Sci. Soc. Am. J. 41, 511–514. doi: 10.2136/sssaj1977.03615995004100030015x
Dietrich, S. T., and MacKenzie, M. D. (2018). Comparing spatial heterogeneity of bioavailable nutrients and soil respiration in boreal sites recovering from natural and anthropogenic disturbance. Front. Environ. Sci. 6:126. doi: 10.3389/fenvs.2018.00126
Eisenhauer, N., Beßler, H., Engels, C., Gleixner, G., Habekost, M., Milcu, A., et al. (2010). Plant diversity effects on soil microorganisms support the singular hypothesis. Ecology 91, 485–496. doi: 10.1890/08-2338.1
Elzenga, J. T. M., and van Veen, H. (2010). “Waterlogging and Plant Nutrient Uptake,” in Waterlogging Signalling and Tolerance in Plants, eds S. Mancuso and S. Shabala (Berlin: Springer-Verlag, 23–35.
Emsens, W.-J., Aggenbach, C. J. S., Smolders, A. J. P., Zak, D., and van Diggelen, R. (2017). Restoration of endangered fen communities: the ambiguity of iron–phosphorus binding and phosphorus limitation. J. Appl. Ecol. 54, 1755–1764. doi: 10.1111/1365-2664.12915
Förster, J. (2009). Peatlands Restoration in Germany: a Potential Win-Win-Win Solution for Climate Protection, Biodiversity Conservation and Land Use. Ministerium für Landwirtschaft, Umwelt und Verbraucherschutz Mecklenburg-Vorpommern. Available online at: http://doc.teebweb.org/wp-content/uploads/2013/01/Peatlands-restoration-for-carbon-sequestration-Germany.pdf (accessed November 26, 2018).
Gallardo, A. (2003). Spatial variability of soil properties in a floodplain forest in northwest Spain. Ecosystems 6, 564–576. doi: 10.1007/s10021-003-0198-9
Görn, S., and Fischer, K. (2015). Measuring the efficiency of fen restoration on carabid beetles and vascular plants: a case study from north-eastern Germany. Restor. Ecol. 23, 413–420. doi: 10.1111/rec.12203
Groffman, P. M., Hanson, G., Kiviat, E., and Stevens, G. (1996). Variation in microbial biomass and activity in four different wetland types. Soil. Sci. Soc. Am. J. 60, 622–629. doi: 10.2136/sssaj1996.03615995006000020041x
Gutknecht, J. L. M., Goodman, R. M., and Balser, T. C. (2006). Linking soil process and microbial ecology in freshwater wetland ecosystems. Plant Soil 289, 17–34. doi: 10.1007/s11104-006-9105-4
Haapalehto, T. O., Vasander, H., Jauhiainen, S., Tahvanainen, T., and Kotiaho, J. S. (2011). The effects of peatland restoration on water-table depth, elemental concentrations and vegetation: 10 years of changes. Restor. Ecol. 19, 587–598. doi: 10.1111/j.1526-100X.2010.00704.x
Hanschke, T. (1996). Erfassung und bewertung der hydrologischen verhältnisse im niedermoor bei gragetopshof (Diploma Dissertation). University of Rostock, Rostock, Germany, 116.
Herzsprung, P., Osterloh, K., von Tümpling, W., Harir, M., Hertkorn, N., Schmitt-Kopplin, P., et al. (2017). Differences in DOM of rewetted and natural peatlands - Results from high-field FT-ICR-MS and bulk optical parameters. Sci. Total Environ. 586, 770–781. doi: 10.1016/j.scitotenv.2017.02.054
Höper, H. (2007). Freisetzung von Treibhausgasen aus deutschen Mooren. TELMA 37, 85–116. doi: 10.23689/fidgeo-3035
Höper, H., Augustin, J., Cagampan, J. P., Drösler, M., Lundin, L., Moors, E., et al. (2008). “Restoration of peatlands and greenhouse gas balances,” in Peatlands and Climate Change, ed M. Strack (Wageningen: International Peat Society, 182–210.
Hunt, R. J., Krabbenhoft, D. P., and Anderson, M. P. (1997). Assessing hydrogeochemical heterogeneity in natural and constructed wetlands. Biogeochemistry 39, 271–293. doi: 10.1023/A:1005889319205
Iqbal, J., Thomasson, J. A., Jenkins, J. N., Owens, P. R., and Whisler, F. D. (2005). Spatial variability analysis of soil physical properties of alluvial soils. Soil. Sci. Soc. Am. J. 69, 1–14. doi: 10.2136/sssaj2004.0154
IUSS Working Group WRB (2015). World Reference Base for Soil Resources 2014, update 2015. International soil classification system for naming soils and creating legends for soil maps. World Soil Resources Reports No. 106. Rome: FAO.
Jenerette, G. D., and Wu, J. (2004). Interactions of ecosystem processes with spatial heterogeneity in the puzzle of nitrogen limitation. OIKOS 107, 273–282. doi: 10.1111/j.0030-1299.2004.13325.x
Jenkinson, D. S. (1988). “Determination of microbial biomass carbon and nitrogen in soil,” in Advances in Nitrogen Cycling in Agricultural Ecosystems, ed J. R., Wilson (Wallingford: CAB International, 368–386.
Joergensen, R. G. (1995). The fumigation extraction method to estimate soil microbial biomass: extraction with 0.01 M CaCl2. Agrobiol. Res. 48, 319–324.
Joosten, H. (1997). European mires: a preliminary status report. Int. Mire Conserv. Group Members Newslett. 3, 10–13.
Joosten, H., and Clarke, D. (2002). Wise Use of Mires and Peatlands -Background and Principles Including a Framework for Decision-Making. Saarijärvi: International Mire Conservation Group and International Peat Society.
Joosten, H., Tanneberger, F., and Moen, A. (2017). Mires and Peatlands of Europe: Status, Distribution and Conservation. Stuttgart: Schweizerbart Science Publishers.
Kang, H., Kim, S., Fenner, N., and Freeman, C. (2005). Shifts of enzymes activities in wetlands exposed to elevated CO2. Sci. Total Environ. 337, 207–2012. doi: 10.1016/j.scitotenv.2004.06.015
Karki, S., Elsgaard, L., Kandel, T. P., and Lærke, P. E. (2016). Carbon balance of rewetted and drained peat soils used for biomass production: a mesocosm study. GCB Bioenergy 8, 969–980. doi: 10.1111/gcbb.12334
Kercher, S. M., and Zedler, J. B. (2004). Multiple disturbances accelerate invasion of reed canary grass (Phalaris arundianaceae L.) in a mesocosm study. Oecologia 138, 455–464. doi: 10.1007/s00442-003-1453-7
Klironomos, J. N., McCune, J., Hart, M., and Neville, J. (1999). Designing belowground field experiments with the help of semi-variance and power analyses. Appl. Soil Ecol. 12, 227–238. doi: 10.1016/S0929-1393(99)00014-1
Kravchenko, A. N., Robertson, G. P., Snap, S. S., and Smucker, A. J. M. (2006). Using information about spatial variability to improve estimates of total soil carbon. Agron. J. 98, 823–829. doi: 10.2134/agronj2005.0305
Krohn, J., Lozanovska, I., Kuzyakov, Y., Parvin, S., and Dorodnikov, M. (2017). CH4 and CO2 production below two contrasting peatland micro-relief forms: an inhibitor and δ13C study. Sci. Total Environ. 586, 142–151. doi: 10.1016/j.scitotenv.2017.01.192
Krüger, J. P., Leifeld, J., Glatzel, S., Szidat, S., and Alewell, C. (2015). Biogeochemical indicators of peatland degradation – a case study of a temperate bog in northern Germany. Biogeosciences 12, 2861–2871. doi: 10.5194/bg-12-2861-2015
Kumar, S. (2015). Estimating spatial distribution of soil organic carbon for the Midwestern United States using historical database. Chemosphere 127, 49–57. doi: 10.1016/j.chemosphere.2014.12.027
Kumar, S., Lal, R., and Liu, D. S. (2012). A geographically weighted regression kriging approach for mapping soil organic carbon stock. Geoderma 189–190, 627–634. doi: 10.1016/j.geoderma.2012.05.022
Ladd, J. N., and Buttler, H. A. (1972). Short-term assays of soil proteolytic enzyme activities using proteins and dipeptide derivates as substrates. Soil Biol. Biochem. 4, 19–30. doi: 10.1016/0038-0717(72)90038-7
Lamers, L. P. M., Vile, M. A., Grootjans, A. P., Acreman, M. C., Diggelen, R., Evans, M. G., et al. (2015). Ecological restoration of rich fens in Europe and North America: from trial and error to an evidence-based approach. Biol. Rev. 90, 182–203. doi: 10.1111/brv.12102
Landry, J., and Rochefort, L. (2012). The Drainage of Peatlands: Impacts and Rewetting Techniques. Available online at: http://www.gret-perg.ulaval.ca/uploads/tx_centrerecherche/Drainage_guide_Web_03.pdf (assessed on January 16, 2019).
Larkin, D. J. (2016). “Wetland Heterogeneity,” in Wetland Book, eds C. M. Finlayson, M. Everard, K. Irvine, R. J. McInnes, B. A. Middleton, A. A. van Dam, and N. C. Davidson (Heidelberg: Springer).
Litaor, M. I., Reichmann, O., Belzer, M., Auerswald, K., Nishri, A., and Shenker, M. (2003). Spatial analysis of phosphorus sorption capacity in a semiarid altered wetland. J. Environ. Qual. 32, 335–343. doi: 10.2134/jeq2003.0335
Liu, Y., Guo, L., Jiang, Q., Zhang, H., and Chen, Y. (2015). Comparing geospatial techniques to predict SOC stocks. Soil Tillage Res. 148, 46–58. doi: 10.1016/j.still.2014.12.002
Marton, J. M., Chowdhury, R. R., and Craft, C. B. (2015). A comparison of the spatial variability of denitrification and related soil properties in restored and natural depression wetlands in Indiana, USA. Int. J. Biodiv. Sci. Ecosyst. Services Manag. 11, 36–45. doi: 10.1080/21513732.2014.950981
Mentzer, J. L., Goodman, R., and Balser, T. C. (2006). Microbial seasonal response to hydrologic and fertilization treatments in a simulated wet prairie. Plant Soil 284, 85–100. doi: 10.1007/s11104-006-0032-1
Mitchell, R. J., Hester, A. J., Campbell, C. D., Chapman, S. J., Cameron, C. M., Hewison, R. L., et al. (2010). Is vegetation composition or soil chemistry the best predictor of the soil microbial community? Plant Soil 333, 417–430. doi: 10.1007/s11104-010-0357-7
Nair, V. D. (2014). Soil phosphorus saturation ratio for risk assessment in land use systems. Front. Environ. Sci. 2:6. doi: 10.3389/fenvs.2014.00006
Nair, V. D., and Reddy, K. R. (2013). “Phosphorus sorption and desorption in wetland soils,” in Methods in Biogeochemistry of Wetlands. SSSA Book Series, no. 10., eds R. D. DeLaune, K. R. Reddy, C. J. Richardson, and J. P. Megonigal (Madison, WI: Soil Science Society of America, 667–681.
Nkheloane, T., Olaleye, A. O., and Mating, R. (2012). Spatial heterogeneity of soil physic-chemical properties in contrasting wetland soils in two agro-ecological zones of Lesotho. Soil Res. 50, 579–589. doi: 10.1071/SR12145
Oksanen, J., Blanchet, F. G., Kindt, R., Legendre, P., Minchin, P. R., O'Hara, R. B., et al. (2017). Vegan (2000): Community Ecology Package. R package version 2.4-4. Available online at: https://www.scirp.org/-(S(i43dyn45teexjx455qlt3d2q))/reference/ReferencesPapers.aspx?ReferenceID = 2134091 (accessed March 06, 2019).
Reddy, K. R., and DeLaune, R. D. (2008). Biogeochemistry of Wetlands:-Science and Applications. New York, NY: Taylor and Francis Group.
Romanowicz, K. J., Kane, E. S., Potvin, L. R., Daniels, A. L., Kolka, R. K., and Lilleskov, E. A. (2015). Understanding drivers of peatland extracellular enzyme activity in the PEATcosm experiment: mixed evidence for enzymic latch hypothesis. Soil Plant 397, 371–386. doi: 10.1007/s11104-015-2746-4
Rossi, R. E., Mulla, D. J., Journel, A. G., and Franz, E. H. (1992). Geostatistical tools for modeling and interpreting ecological spatial dependence. Ecol. Monogr. 62, 277–314. doi: 10.2307/2937096
Ruffo, M. L., Bollero, G. A., and Bullock, D. G. (2005). “Spatial variability of the Illinois soil nitrogen test: implications for soil sampling,“ in Precision Agriculture 05, ed J. V. Stafford (Wageningen: Wageningen Academic Publishers, 751–757.
Salazar, S., Sánchez, L. E., Alvare, J., Valverde, A., Galindo, P., Igual, J. M., et al. (2011). Correlation among soil enzyme activities under different forest system management practices. Ecol. Eng. 37, 1123–1131. doi: 10.1016/j.ecoleng.2011.02.007
Schlichting, A., Leinweber, P., Meissner, R., and Altermann, M. (2002). Sequentially extracted phosphorus fractions in peat derived soils. J. Plant Nutr. Soil. Sci. 165, 290–298. doi: 10.1002/1522-2624(200206)165:3<290::AID-JPLN290>3.0.CO;2-A
Schwertmann, U. (1964). Differenzierung der eisenoxide des bodens durch extraktion mit ammoniumoxalat- Lbsung. Z. Pflanzenern. Dffng. Bodenk. 105, 194–202. doi: 10.1002/jpln.3591050303
Soil Survey Staff (1999). Soil taxonomy: A Basic System of Soil Classification for Making and Interpreting Soil Surveys, 2nd Edn. Washington, DC: Natural Resources Conservation Service. U.S. Department of Agriculture Handbook.
Stark, C. H. E., Condron, L. M., Stewart, A., Di, H. J., and O'Callaghan, M. (2004). Small-scale spatial variability of selected soil biological properties. Soil Biol. Biochem. 36, 601–608. doi: 10.1016/j.soilbio.2003.12.005
Štursová, M., Bárta, J., Šantručková, H., and Baldrian, P. (2016). Small-scale spatial heterogeneity of ecosystem properties, microbial community composition and microbial activities in a temperate mountain forest soil. FEMS Microbiol. Ecol. 92:fiw185. doi: 10.1093/femsec/fiw185
Tabatabai, M. A. (1994). “Soil enzymes,” in Methods of Soil Analysis. Part 2. Microbiological and Biochemical Properties, eds P. S. Bottomley, J. S. Angle, and R.W. Weaver (Madison, WI: Soil Science Society of America, 778–833.
Tokarz, E., and Urban, D. (2015). Soil redox potential and its impact on microorganisms and plants of wetlands. J. Ecol. Eng. 16, 20–30. doi: 10.12911/22998993/2801
Truu, M., Juhanson, J., and Truu, J. (2009). Microbial biomass, activity and community composition in constructed wetlands. Sci. Total Environ. 407, 3958–3971. doi: 10.1016/j.scitotenv.2008.11.036
Ulanowski, T. A., and Branfireun, B. A. (2013). Small-scale variability in peatland pore-water biogeochemistry, Hudson Bay Lowland, Canada. Sci. Total Environ. 454–455, 211–218. doi: 10.1016/j.scitotenv.2013.02.087
Vance, E. D., Brookes, P. C., and Jenkinson, D. S. (1987). An extraction method for measuring soil microbial biomass C. Soil Biol. Biochem. 19, 703–707. doi: 10.1016/0038-0717(87)90052-6
Waddington, J. M., and Roulet, N. T. (1996). Atmosphere-wetland carbon exchange: scale dependency of CO2 and CH4 exchange on the developmental topography of a peatland. Global Biogeochem. Cycles 10, 233–245. doi: 10.1029/95GB03871
Wang, K., Zhang, C., and Li, W. (2013). Predictive mapping of soil total nitrogen at a regional scale: a comparison between geographically weighted regression and cokriging. Appl. Geogr. 42, 73–85. doi: 10.1016/j.apgeog.2013.04.002
Whiting, G. J., and Chanton, J. P. (2001). Greenhouse carbon balance of wetlands: methane emission versus carbon sequestration. Telus 53B, 521–542. doi: 10.3402/tellusb.v53i5.16628
Wiedermann, M. M., Kane, E. S., Potvin, L. R., and Lilleskov, E. A. (2017). Interactive plant functional group and water table effects on decomposition and extracellular enzyme activity in Sphagnum peatlands. Soil Biol. Biochem.108, 1–8. doi: 10.1016/j.soilbio.2017.01.008
Wolinska, A., and Stepniewska, Z. (2012). Dehydrogenase activity in the soil environment. IntechOpen. doi: 10.5772/48294
Wuenscher, R., Unterfrauner, H., Peticzka, R., and Zehetner, F. (2015). A comparison of 14 soil phosphorus extraction methods applied to 50 agricultural soils from Central Europe. Plant Soil Environ. 61, 86–96. doi: 10.17221/932/2014-PSE
Yang, F., Tiana, J., Fang, H., Gao, Y., Zhang, X., Yu, G., et al. (2018). Spatial heterogeneity of microbial community and enzyme activities in a broad-leaved Korean pine mixed forest. Eur. J. Soil Biol. 88, 65–72. doi: 10.1016/j.ejsobi.2018.07.001
Zak, D., Gelbrecht, J., Wagner, C., and Steinberg, C. E. W. (2008). Evaluation of the phosphorus mobilization potential in re-wetted fens by an improved sequential chemical extraction procedure. Eur. J.Soil Sci. 59, 1191–1201. doi: 10.1111/j.1365-2389.2008.01081.x
Zerbe, S., Steffenhagen, P., Parakenings, K., Timmermann, T., Frick, A., Gelbrecht, J., et al. (2013). Restoration success regarding ecosystem services after 10 years of rewetting peatlands in NE Germany. Environ. Manage. 51, 1194–1209. doi: 10.1007/s00267-013-0048-2
Keywords: biochemical properties, oxalate extractable soil nutrients, soil variability, spatial correlation, nugget
Citation: Negassa W, Baum C, Schlichting A, Müller J and Leinweber P (2019) Small-Scale Spatial Variability of Soil Chemical and Biochemical Properties in a Rewetted Degraded Peatland. Front. Environ. Sci. 7:116. doi: 10.3389/fenvs.2019.00116
Received: 10 April 2019; Accepted: 08 July 2019;
Published: 19 July 2019.
Edited by:
Fereidoun Rezanezhad, University of Waterloo, CanadaCopyright © 2019 Negassa, Baum, Schlichting, Müller and Leinweber. This is an open-access article distributed under the terms of the Creative Commons Attribution License (CC BY). The use, distribution or reproduction in other forums is permitted, provided the original author(s) and the copyright owner(s) are credited and that the original publication in this journal is cited, in accordance with accepted academic practice. No use, distribution or reproduction is permitted which does not comply with these terms.
*Correspondence: Wakene Negassa, wakene.chewaka@uni-rostock.de