A Revised Cross-Section Database for Gas Retrieval in the UV-Visible-Near IR Range, Applied to the GOMOS Retrieval Algorithm AerGOM
 Christine Bingen*
  Charles Robert
  Christian Hermans Filip Vanhellemont Nina Mateshvili Emmanuel Dekemper Didier Fussen
- The Royal Belgian Institute for Space Aeronomy (BIRA-IASB), Brussels, Belgium
In this paper, we present the revision of the cross-section database used for the retrieval of aerosol and gas species from remote sensing measurements by the GOMOS instrument onboard ENVISAT. The absorption cross-section spectra concern ozone, nitrogen dioxide and nitrogen trioxide, for which improved datasets have been published since the implementation of the original GOMOS cross-section database in preparation of the ENVISAT mission. We evaluate the molecular absorption cross-section spectra currently available for O3, NO2 and NO3, and we present and discuss our selection of datasets and the set-up of the revised absorption cross-section database, with the focus on these three gases. The objective is to provide an optimal characterization of their absorption spectrum over the UV-visible-near IR range used by AerGOM, a retrieval algorithm that was designed to optimize the retrieval of aerosol species from GOMOS measurements. Despite its application to the specific case of GOMOS, it is the aim of this work to cover a more general scope than this particular mission, and to provide an evaluation applicable to any other case of remote sensing experiment covering the UV to near IR range, possibly with a high spectral resolution.
1. Introduction
With the development of atmospheric remote sensing, the need for an increasingly precise characterization of the spectral absorption features in the UV-visible-near IR for atmospheric trace gases has grown. Spectrometers used in satellite experiments provide measurements at a finer resolution over a broad spectral range, often covering extended spectral bands instead of a set of individual wavelengths in past missions. Therefore, the availability of very accurate ancillary data is indispensable to derive the high-quality atmospheric records needed by the atmospheric and climate communities to correctly monitor, model, and forecast the dynamics, photochemistry, and radiative evolution of the atmosphere, and to provide reliable information to citizens and decision makers. In order to address these increasingly strong requirements, dedicated laboratory measurements have been performed, bringing to light new temperature or pressure effects in some cases, thanks to the use of more sensitive instruments and techniques.
Amongst these efforts (Burrows et al., 1998, 1999), measured a set of laboratory reference spectra for the GOME experiment. Measures were carried out at atmospheric pressure for difference mixtures. GOME onboard ERS-1 (1991–2000) was equipped with four spectrometers covering the range 231–794 nm with a spectral resolution varying from 0.20 to 0.33 nm, and the authors measured NO2 and O3 laboratory spectra at atmospheric pressure in the range 202–293 K over the GOME spectral range. Voigt et al. (2001) and Voigt et al. (2002) further contributed to these efforts by publishing more accurate reference spectra for the O3 and NO2 absorption cross-section to better address the retrieval of GOME onboard ERS-2 (1995–2011). In the case of NO2, they observed and characterized a pressure-broadening of spectral lines at all temperatures. The same approach was used in preparation of the SCIAMACHY mission onboard ENVISAT (2002–2012): Bogumil et al. (2003) measured molecular absorption spectra for the most important atmospheric trace gases (11 gases including O3 and NO2) at different dilutions and pressures relevant for tropospheric and stratospheric measurements (0.1 to 1,000 hPa), using the pre-flight model of SCIAMACHY. The spectra measured in the laboratory are medium-resolution spectra covering the SCIAMACHY range for temperatures between 203 and 293 K. Going beyond the availability of this extended absorption cross-section database at medium resolution, Serdyuchenko et al. (2014) noted the lack of consistent and consolidated data on O3 cross-sections. In order to improve the ability to compare measurements from different instruments, they published an extended dataset of O3 absorption cross-sections spanning the UV-visible-Near IR range over a wide temperature range (193–293 K) and with a high spectral resolution of 0.02 to 0.24 nm. For NO2, several detailed studies about temperature and pressure effects relevant for atmospheric remote sensing were published (see e.g., Vandaele et al., 2003). More details on these measurements are given later in the paper.
Taking advantage of more recent results published on the spectroscopic characterization of atmospheric trace gases, we propose here an overview of the revision of the database of trace gas molecular absorption cross-section spectra set up before launch for the GOMOS experiment. The aim is to improve the retrieval of trace gases (O3, NO2, NO3) and aerosols from this experiment. In sections 2, we present the GOMOS instrument and the specific aspects of stellar occultation. Section 3 gives a short overview of the GOMOS retrieval approaches, with an emphasis on the AerGOM retrieval algorithm and its characteristics. From this case, we justify why more accurate trace gas absorption cross-section spectra appear necessary to improve the quality of the retrieval. Section 4 presents the revision of the trace-gas cross-section database for all three gases, giving in each case an overview of the most important datasets and their main features, and discussing the selection of the most pertinent spectra for the revised cross-section dataset. Finally, we apply our new cross-section database to the case of GOMOS and provide some illustration of the results.
2. Stellar Occultation by the GOMOS Instrument
From 2002 and 2012, the Global Ozone Monitoring by Occultation of Stars (GOMOS) experiment onboard ENVISAT measured the atmospheric composition by observing about 300 setting stars with various values of magnitude and temperature (Bertaux et al., 2010). The instrument was equipped with a set of spectrometers covering the UV-visible-near IR between 248 and 954 nm. Their main spectral characteristics are presented in Table 1.
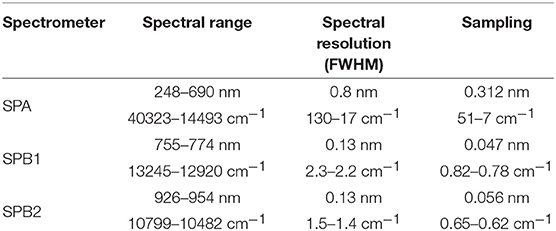
Table 1. GOMOS instrument characteristics. Values are expressed in wavelength and wavenumber units to ease further comparisons.
Amongst other advantages, the use of stellar occultation enables a much larger observation rate (about 30 to 40 occultations per orbit, reduced to ~20–30 occultations per orbit after an important failure in 2005) with respect to solar occultation allowing only 2 measurements per orbit (one sunrise and one sunset). However, the advantage of this high data rate is mitigated by the weakness of the measured signal resulting in a reduced signal-to-noise ratio, that makes the retrieval challenging, especially in the case of weak stars. Another interesting specificity of stellar occultation is that it provides the opportunity to observe the night-time atmosphere. This feature is of particular interest for the study of atmospheric photochemistry, providing complementary information with respect to measurements by instruments based on solar observation techniques.
3. Trace Gas and Aerosol Retrieval From GOMOS
Historically, an inversion algorithm (Instrument Processor Facility, IPF) was developed for the retrieval of the main atmospheric trace gases (O3, NO2, NO3) and for aerosols (Kyrölä et al., 2010b). The GOMOS instrument measures the star radiance that passes through the Earth's atmosphere at different values of the wavelength λ and tangent altitude z. These measurements can be converted to star transmittance spectra by normalization with out-of-atmosphere star radiance measurements carried out at ~120 km. The contribution of the different species to the transmittance is expressed by the Beer-Lambert's law:
where, the slant optical thickness τ results from the absorption and scattering of light by all species encountered along the optical path corresponding to the tangent altitude z, denoted by opath(z):
The retrieval consists of an inversion of Equation (2) measured at all tangent altitudes during one occultation to local expressions of all gas densities (nair, nO3, nNO2, nNO3) and of the aerosol extinction βaero. The aerosol retrieval requires knowledge about the aerosol composition that influences the refraction index and scattering properties of aerosols, and an accurate knowledge of the gas absorption cross-sections σO3, σNO2, σNO3), what is the subject of the present paper. More rigourously, it will appear in the following that σNO2 and σNO3 also present a second-order dependence in the pressure, that potentially has to be taken into account.
A detailed description of the retrieval algorithms can be found in Kyrölä et al. (2010b) and Vanhellemont et al. (2016). Without going into any detail, the inversion scheme was split in a spectral inversion (to retrieve the slant column of each target atmospheric compound), followed by a vertical inversion (to retrieve vertical profiles from the slant column), and the methodology was adapted by following different strategies depending on the target species.
In order to alleviate the problem of residual scintillation, NO2 and NO3 were first retrieved using a DOAS-like (Differential Optical Absorption Spectroscopy) approach applied on the star signal after calibration and correction of all refractive effects. In a following step, a non-linear Levenberg-Marquardt fit was used to retrieve O3 and aerosols. The aerosol extinction coefficient was parameterized using a spectral model based on a simple quadratic function of the wavelength. Furthermore, in order to avoid large biases obtained in the retrieval of the air density, this quantity was derived from meteorological records provided by the European Center for Medium-term Weather Forecast (ECMWF). All details about the IPF retrieval algorithm can be found in Kyrölä et al. (2012).
The molecular absorption cross-sections of O3, NO2, and NO3 needed for the spectral retrieval were provided by a dedicated cross-section data bank called “GOMOS DB” in the following, and set up using the best knowledge at that time (Kyrölä and Simon, 1996; Oikarinen et al., 2000). A linear interpolation was applied to the available absorption cross-section for each species in order to provide spectra at every temperatures between 200 and 300 K in steps of 10 K, and constant values of the spectra were assumed from available data when the temperature dependence was unknown. Ozone spectra spanned the whole GOMOS spectral range and were provided with a sampling resolution of 0.05 nm for SPA, and 0.1 nm for SPB1 and B2. NO2 spectra covered the spectral range of SPA and SPB1 with a sampling of 0.05 nm, and NO3 spectra were limited to the SPA spectral range and given every 0.05 nm as well.
Although the IPF approach could successfully provide time series of O3, NO2, and NO3 observations (Renard et al., 2008; Kyrölä et al., 2010a), the outcome in terms of aerosols was more disappointing: single profile retrievals were not of very good quality, marred by scintillation contamination at all wavelengths out of the 500 nm spectral region (Vanhellemont et al., 2005, 2010). For this reason, an alternative algorithm called AerGOM was developed to improve the aerosol retrieval Vanhellemont et al. (2016). The main new features of AerGOM are:
• An extension of the spectral range considered for the retrieval toward selected pixels of SPB where the influence of the O2 A band and H2O is minimal. This provides an improved description of the spectral dependence with respect to IPF that only made use of SPA for the 3 considered trace gases and aerosols;
• A revision of the Rayleigh cross-section used to describe the contribution of the neutral air density in Equation (2). A new expression is used, based on the exact theoretical approach by Bodhaine et al. (1999).
• The use of a revised spectral model for the aerosol extinction coefficient based on a more physical expression of the spectral dependence;
• The simultaneous retrieval of all trace gases and aerosols, in order to better take into account the dependencies between the response of each atmospheric species. This more homogeneous approach simplifies the retrieval and the uncertainty characterization through the use of the full covariance matrix. The forward model including all gas and aerosol dependences based in Equation (2) is fitted to the measurements by Levenberg-Marquardt optimization applied over the whole considered spectral range. A Tikhonov regularization scheme is used to stabilize the solution of the inversion problem.
All details about AerGOM can be found in Vanhellemont et al. (2016).
As a last step to complete the revision of the retrieval algorithm, an update of the GOMOS cross-section database was appropriate to improve the gas retrieval. In particular, in order to enable the non-linear optimization taking all species into account at every wavelengths, it is critical to know absorption cross-section spectra with the best accuracy possible over the whole GOMOS spectral range. Furthermore, in order to correctly describe the total extinction of all atmospheric constituents, absorption cross-section spectra should be available at the highest resolution possible.
The objectives pursued by the revision of the GOMOS cross-section database are thus:
• To extend the spectral range of the absorption cross-spectra for each gas to the whole GOMOS spectral range;
• To select cross-section datasets presenting a satisfactory accuracy, and a good agreement with previous dataset proven by detailed intercomparisons published in the literature;
• To consider the highest spectral resolution possible in order to resolve correctly spectral structures. The resolution of every trace gas absorption spectra should be higher than the GOMOS spectral range whenever possible;
• To take advantage of more recent and improved laboratory measurements at extended temperature and pressure ranges to cover whenever possible all atmospheric conditions of interest;
• To optimize the quality of the resulting spectra in terms of accuracy, absence of discontinuity between concatenated datasets.
It must be noted that aerosols also contribute significantly to the total extinction at all wavelengths. The importance of this contribution depends on the aerosol load and the size distribution of the particle population. Also the aerosol composition plays a role, since it determines the aerosol refraction index. The relative importance of all constituents depends obviously on the altitude. But in all cases, the quality of the trace gas retrieval goes hand in hand with the accuracy of the spectral dependence found for aerosols. In turn, this aerosol spectral dependence determines the performance of the size distribution retrieval by inversion of the aerosol extinction. All these reasons reinforce the fact that the choice of cross-sections spectra in all spectral regions has to be optimal.
4. Revision of the Trace Gas Cross-Section Database
4.1. Ozone
Ozone, which is a particularly important trace gas in the Earth's atmosphere due to its ability to protect the biosphere of the UV radiation and to its role as greenhouse gas, was the primary target gas for GOMOS. The GOMOS SPA covers a large part of the Hartley bands (200–300 nm, covered down to 248 nm by GOMOS) and the Huggins bands (315–350 nm), as well as the Chappuis bands (400–650 nm). The GOMOS SPB1, which was designed for the retrieval of the O2 A band (769–758 nm) (Bertaux et al., 2010) also covers the ozone Wulf bands (759–768 nm).
Many authors contributed to the measurement of O3 absorption cross-section spectra (Orphal, 2003). The Spectral Atlas of Gaseous Molecules of the Max-Planck Institute for Chemistry proposes a large set of O3 spectra (Keller-Rudek et al., 2013). The HITRAN database also proposes O3 data at 6 different temperatures, but only over the range 245–342 nm, which leaves the largest part of the GOMOS spectrum uncovered. Therefore, we will not consider this dataset.
Two datasets present an extended spectral coverage including the whole GOMOS spectral range, and have been considered here: cross-sections measured by Bogumil et al. (2003) and referenced as “Bogumil03,” and the more recent dataset published by Serdyuchenko et al. (2014) and referenced as “Serdyuchenko14.”
Other datasets are able to cover a large spectral range: Burrows et al. (1999) used several dilutions and five temperatures (202, 221, 241, 273, 293 K) for their measurements in the framework of the GOME/ERS-1 mission (spectral range 231–794 nm), and obtained a total uncertainty of about 3.6%. Voigt et al. (2001) covers the range 235–850 nm and proposes spectra at five temperatures (203, 223, 246, 280, and 293 K) with a resolution of 5 cm−1 (0.027 at 230 and 0.36 at 850 nm). The uncertainty is about 3 to 6%. This last dataset was used to implement the O3 absorption cross-section spectra in GOMOS DB. However, since these datasets do not cover the entire GOMOS spectral range, we did not select them for the revision of our cross-section database.
Table 2 gives an overview of the two datasets considered in the present work. Bogumil03 consists of absorption spectra measured for different trace gases including O3 over the 230–2380 nm spectral range at five temperatures relevant for the troposphere and stratosphere (203, 223, 243, 273, and 293 K). The spectral resolution varies between 0.24 and 1.438 nm depending on the spectral channel. The uncertainty found by the authors is lower than 2.1% for all values of the cross-section larger than 10−23 cm2 molec−1.
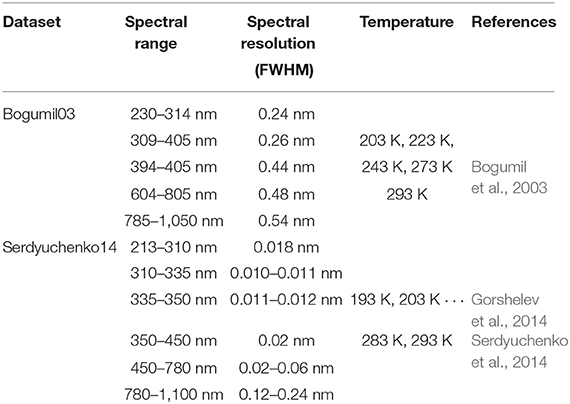
Table 2. Datasets considered for the ozone absorption cross-section spectrum, and their characteristics. The datasets are restricted to the spectral range relevant for GOMOS.
Serdyuchenko14 was measured at 11 temperatures from 193 to 293K by steps of 10 K over the spectral range 213–1100 nm. The spectral resolution was 0.02 to 0.06 nm in the UV-visible range (1 cm−1 or 2 cm−1 in wavenumber units, depending on the spectral region), and 0.12 to 0.24 nm in the near-IR (2 cm−1 in wavenumber units). The total uncertainty was about of 2 to 3% for most of the spectral regions, although it could reach more than 20% for measurements at very low optical density (for λ ≥ 780 nm) (Gorshelev et al., 2014). A detailed intercomparison between Serdyuchenko14 and other datasets, including Bogumil03, is presented by the authors (Gorshelev et al., 2014; Serdyuchenko et al., 2014).
Figure 1 shows a comparison between the O3 cross-section provided by GOMOS DB and Bogumil03 (Figures 1A,B), and by GOMOS DB and Serdyuchenko14 (Figures 1C,D), respectively. A first obvious observation is that GOMOS DB provides the convolution of the O3 cross-section at the GOMOS resolution. Due to this difference in spectral resolution, important discrepancies between GOMOS DB and the two other datasets are found between 350 and 400 nm, and above 700 nm, two spectral regions of particular importance for the retrieval of other gases such as NO2, NO3, O2 (A-band), and H2O. In particular, the GOMOS DB O3 spectrum is systematically too high in the SPB1 and SPB2 spectral range, which has a significant impact on the accuracy of the retrieval of species with weaker signatures. Such a systematic bias could potentially affect the retrieval of aerosols, characterized by a smooth spectral behavior.
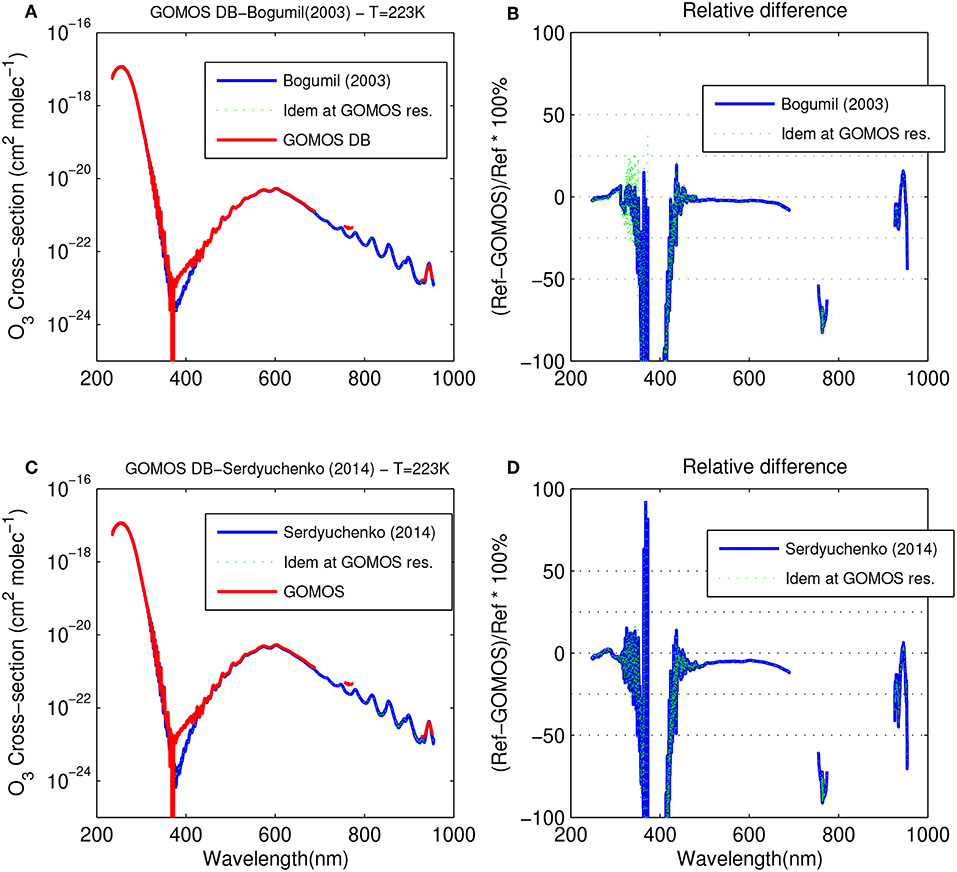
Figure 1. Comparison of the O3 GOMOS DB spectra with spectra from (A) Bogumil03, and (C) Serdyuchenko14, at a temperature of 223 K. (B,D) show the corresponding relative differences. GOMOS DB spectra have been linearly interpolated in temperature, and in the case of (B,D), at the wavelength of the reference spectrum.
The temperature dependence of the O3 absorption cross-section is illustrated in Figure 2, at four different wavelengths: 380, 450, 623, and 662 nm. These wavelengths are interesting because they lie in spectral regions where important features from different trace gases possibly overlap. It is thus particularly important disposing of accurate spectra in the spectral regions around these values, and analyzing the performances of GOMOS DB with respect to other datasets helps to assess what kind of improvement can be expected from the revision of the cross-section database.
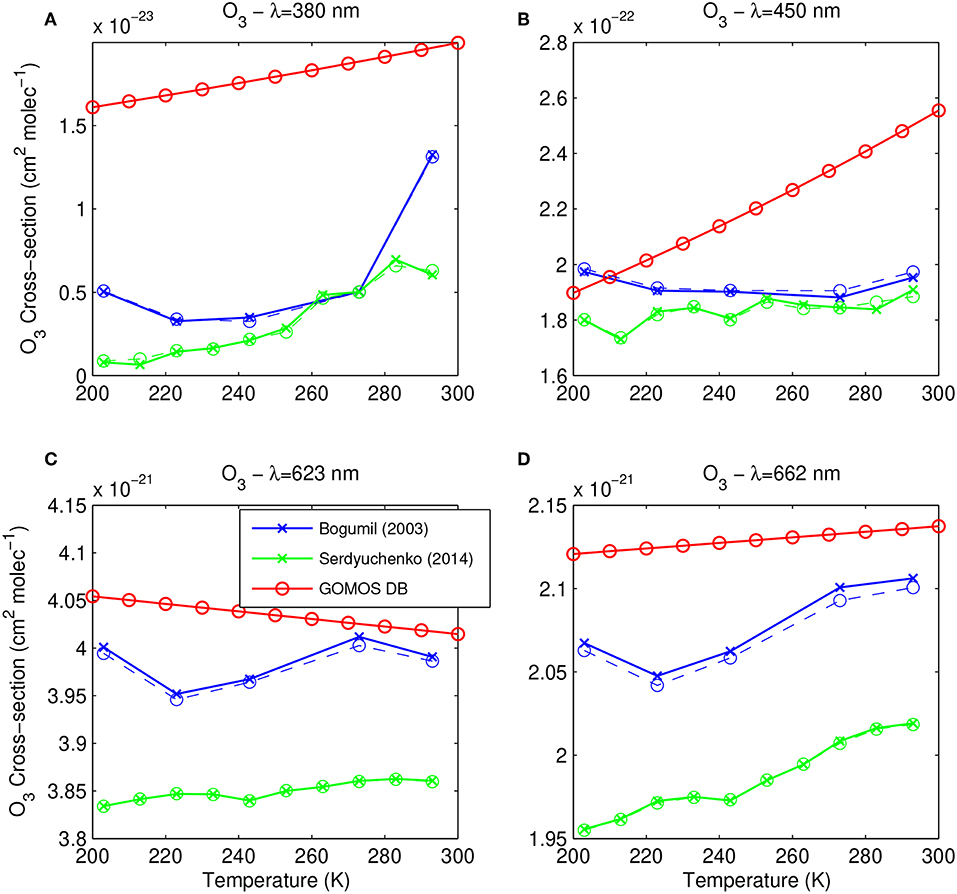
Figure 2. Temperature dependence of the O3 spectra from Bogumil03 (blue), Serdyuchenko14 (green), and GOMOS DB (red) at (A) λ = 380 nm, (B) λ = 450 nm, (C) λ = 623 nm, and (D) λ = 662 nm. Corresponding spectra of Bogumil03 and Serdyiuchenko14 at GOMOS resolution are plotted in dashed line. Crosses (high resolution) and circles (low resolution) indicate the values provided in the datasets.
The 380 nm wavelength is close to O3 cross-section minimum (about 3·10−24 to 10−23 cm2 molec−1 depending on the temperature) reached by the O3 cross-section between the Huggings bands and the Chappuis band. In this spectral region, O3 potentially competes with NO2 whose absorption cross-section reaches values higher than 5 10−19 cm2 molec−1 between about 348 nm and more than 450 nm (see section 4.2). The NO2 cross-section is thus equally high at 380 and 450 nm while the O3 cross-section is about 2 orders of magnitude higher at this wavelength than at 380 nm. Although our knowledge of the NO3 absorption cross-section below 400 nm is limited to very sparse measurements (Sander, 1986), the contribution of NO3 to the total extinction is expected to be negligible at 380 nm, and very small at 450 nm where the cross-section is about 3 10−19 cm2 molec−1, taking into account the expected concentration at the altitude of interest (up to 10−7 cm−3 encountered in the 35–45 km altitude range) with respect to O3 (up to 6 1012 cm−3 in the ozone layer Kyrölä et al., 2010a).
The situation is different at 623 nm where the NO3 spectrum present a large peak (σ ~ 1.7 10−17 cm2 molec−1). At this wavelengths and taking into account typical ranges of atmospheric concentrations for the different species, all contributions (O3, NO2, and NO3) can possibly contribute significantly to the total extinction. Finally, the NO3 absorption cross-section spectrum shows a peak as well at 662 nm (σ~2.7 10−17 cm2 molec−1). This peak is of importance for NO3 retrieval, but the NO3 contribution to extinction around this wavelength is competing with NO2 while O3 shows a much smaller contribution (about 2 10−21 cm2 molec−1).
At 380 nm (Figure 2A), while Bogumil03 and Serdyuchenko14 agree within a factor of two in most cases, GOMOS DB is overestimated by about a factor of 4 to 10. The temperature dependence was further based on measurements taken at two different temperatures and linearly interpolated, resulting in a non-optimal description of the temperature behavior with respect to Bogumil03 and Serdyuchenko14.
The temperature dependence of the O3 absorption cross-section at 450 nm (Figure 2B) shows an agreement between Bogumil03 and Serdyuchenko14 within 10% at most temperatures, while the GOMOS DB temperature behavior looks less realistic and GOMOS DB values exceed both other dataset by up to about a factor 3 at the highest temperatures. Such temperature range can potentially be found in the higher stratosphere above 45 km. This effect is thus not expected to affect the retrieval of O3 at the level of the ozone layer.
In the last two illustrations (at wavelengths λ = 623 and 662 nm, Figures 2C,D), all datasets agree within 5% at all temperatures. At these wavelengths of importance for the determination of the NO3 concentration, GOMOS DB is systematically too high, resulting in an underestimation of the NO3 concentration with respect to a retrieval making use of the new cross-sections.
From this analysis and the investigation of the different datasets, we came to the following conclusions:
• Both Bogumil03 and Serdyuchenko14 are able to improve the temperature range and the spectral extend of GOMOS DB.
• The agreement between Bogumil03 and Serdyuchenko14 is better than the agreement between GOMOS DB and any of these datasets.
• Serdyuchenko14 compares in a satisfactorily way with other datasets.
• Serdyuchenko14 was measured with an improved experimental set-up.
• The spectral resolution for Serdyuchenko14 is in all cases higher than the resolution of the GOMOS spectrometers at the corresponding wavelengths.
• Serdyuchenko14 covers the widest temperature range with the largest amount of temperature values.
Therefore, we conclude that the best choice is to use the Serdyuchenko14 dataset for the characterization of the O3 absorption cross-section in the aerosol and trace gases retrieval from measurements by an instrument such as GOMOS. The same conclusion is valid in all cases of atmospheric conditions and for the whole altitude range. The possibility to use datasets measured with the same experimental set-up for all spectral and temperature cases is particularly suitable for the coherence of the gas spectral characterization.
4.2. Nitrogen Dioxide
Nitrogen dioxide is, in the stratosphere, a key-compound of the catalytic cycle of photochemical destruction of ozone. After sunrise, NO2 is produced by photolysis of N2O5, and reaches rapidly an equilibrium, through several competing reactions, with NO. During night-time, N2O5 gradually recovers by recombination of NO2 and NO3, giving rise to a diurnal cycle whose features depend on factors such as parameters influencing the illumination (length of the day, solar zenith angle, etc.) and the altitude (Brasseur et al., 1999). Due to the rapid variation of NO2 at sunset and sunrise, solar occultation instruments cannot observe this species at equilibrium. On the other hand, stellar occultation measurements performed during night-time are particularly well-suited for the observation of this species, making NO2 an important target species for the GOMOS experiment (Hauchecorne et al., 2005; Kyrölä et al., 2010a).
Several datasets of NO2 cross-section spectra have been published. Table 3 shows an overview of NO2 datasets (Vandaele et al., 2003; Keller-Rudek et al., 2013). This list is limited to datasets covering at least a large part of the GOMOS spectral range.
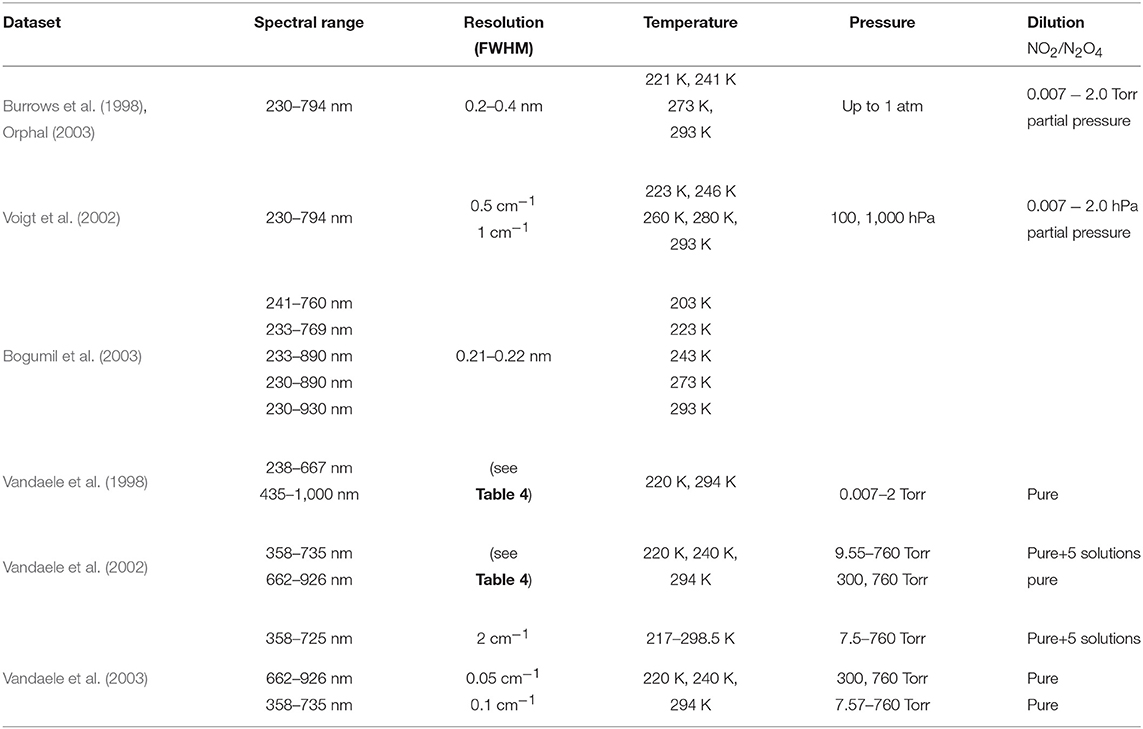
Table 3. Datasets considered for the NO2 absorption cross-section spectrum, and their characteristics. The datasets are restricted to the spectral range relevant for GOMOS.
Burrows et al. (1998) whose experimental conditions are the same as for O3, used several dilutions and obtained an overall experimental uncertainty of about 4%. Similarly, Voigt et al. (2002) used the same spectral range and spectral resolution as for O3, at five temperature values (223, 246, 269, 280, and 293 K) and pressure values of 100 and 1,000 hPa. The spectral resolution was 0.5 cm−1 and 1 cm−1 above and below 425 nm, respectively. They estimated the accuracy of their measurements to be <6% at 223 K and <4% at 293 K. At the same temperature values as for their O3 measurements, Bogumil et al. (2003) found total experimental uncertainties on the NO2 cross-section spectra of about 3.2% at 293K, and 3.4% at lower temperatures. Finally, an extended set of NO2 measurements was carried out by the spectroscopy group at BIRA-IASB, of which an overview is proposed in Table 4. Following Oikarinen et al. (2000), NO2 cross-section spectra in GOMOS DB consist on a composite dataset based on Mérienne et al. (1995), Coquart et al. (1995), Harwood and Jones (1994), Vandaele et al. (1998), and Burrows et al. (1998).
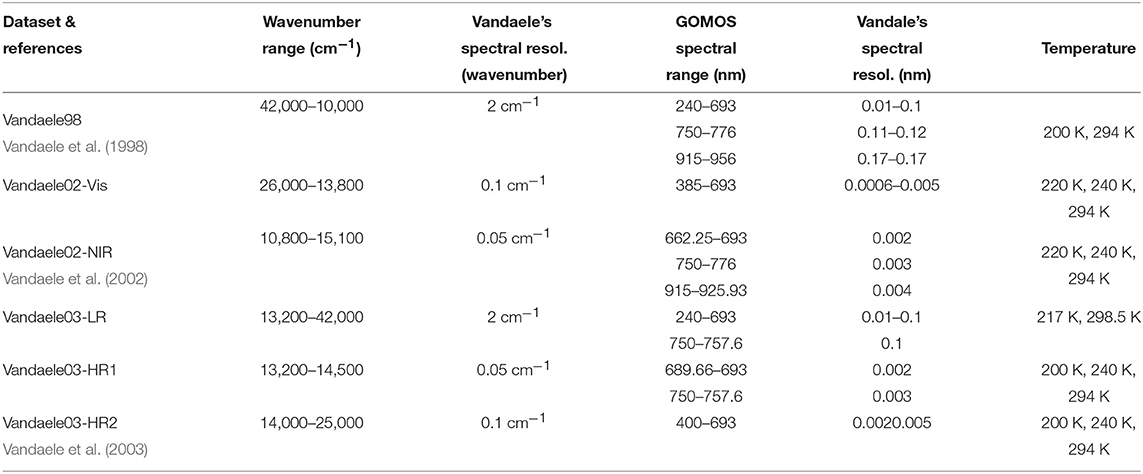
Table 4. Spectral range and resolution in cm−1 of the different datasets of NO2 absorption cross-section spectra published by Vandaele et al., and corresponding resolution in nm at the range of the different GOMOS spectrometers.
Taking into account the large GOMOS spectral range, the datasets published by Vandaele et al. (1998), Vandaele et al. (2002), and Vandaele et al. (2003) are the most suited for this study, for the following reasons:
• They cover the whole GOMOS spectral range, although for the smallest wavelengths (below 384 nm) and the highest wavelengths (above 725 nm), only spectra with a smaller resolution than the GOMOS instrument (but still high compared to the other available datasets) and at less temperature values (2 values instead of 3) are available.
• Detailed comparisons of these datasets with other published datasets tend to confirm their good accuracy (Vandaele et al., 2002; Orphal, 2003).
• The only alternative providing similar completeness in terms of temperature and spectral range is Voigt et al. (2002). This dataset provides a more limited spectral range (250–800 nm) which is enough as far as only GOMOS spectrometers A and B1 are used, but not enough if SPB2 is added, which is needed to retrieve the water vapor concentration. Furthermore, Vandaele et al. (2002) and Orphal (2002) find a larger disagreement between Vandaele et al. (2002) and Voigt et al. (2002) than with several other previous datasets, interpreted as probably due to differences in the experimental method and calibration aspects, as well as the lower spectral resolution used by Voigt et al. (2002), resulting in a poor observation of pressure effects.
For all these reasons, the datasets provided by Vandaele et al. have been selected as reference for the new cross-section database. These datasets include the different records provided at medium and high spectral resolutions detailed in Table 4 (Vandaele et al., 1998, 2002, 2003). It has to be noted that while spectra from Vandaele et al. (1998) and Vandaele et al. (2002) are direct measurements of the absorption cross-section spectra, Vandaele et al. (2003) presents simulated spectra derived from a large number of previously published NO2 cross-section spectra, in different (medium and high) resolutions. Furthermore, Vandaele98 is the dataset still recommended by HITRAN in its version 2016.
4.2.1. Resolution Aspects
Although the spectral range of the three datasets provided by Vandaele et al. largely overlap, the spectral resolution differs in each of them. Vandaele98 is the cross-section spectrum with the lowest resolution at 2 cm−1. Spectra were measured at two different temperatures, 220 and 294 K. Vandaele02 was measured with an improved spectral resolution of 0.1cm−1 at three different temperatures (220, 240, and 294 K). Finally, Vandaele03 is a unified synthetic dataset derived from many previous measurements, taking into account temperature and pressure effects. Two spectra are provided in this dataset: one medium-resolution spectrum (2 cm−1), called Vandaele03-LR in the following, and a high-resolution spectrum with a spectral resolution of 0.1 cm−1 in the range 689.7–757.6 nm (13,200–14,500 cm−1), and of 0.05 cm−1 in the range 400–689.7 nm (14,000–25,000 cm−1), the last one being a subset of Vandaele02. This high-resolution spectrum is called Vandaele-HR in the following.
The corresponding values of the spectral resolution in wavelength scale are given for the different GOMOS spectrometers in Table 4, for the various datasets.
4.2.2. Temperature Effects
Temperature effects affecting the shape or the magnitude of molecular absorption cross-section spectra have been described using different kinds of models, based on linear, quadratic or double quadratic functions (Orphal, 2003). However, Orphal (2003) could not find significant differences between the results of calculation using the different models. Consequently, Vandaele et al. (2003) prefer using a linear dependence for its simplicity:
and Vandaele03 provides the NO2 absorption cross-section σNO2 at wavelength λ and temperature T as the cross-section at the reference temperature T = 273 K, and the linear temperature dependence α(λ) expressed in cm2/molec and cm2/(molec.K), respectively. The temperature dependence can also be modeled, in the case of Vandaele98 and Vandaele02, using the spectra provided at different temperatures in these datasets.
4.2.3. Pressure Effects
Besides temperature effects, important pressure effects were observed in the visible part of the spectrum at all considered temperatures (Harder et al., 1997; Vandaele et al., 1998; Voigt et al., 2002). Vandaele et al. (1998) also described such effects in some absorption bands in the 500–833 nm spectral range. These effects consist in a broadening of the spectral peaks (Vandaele et al., 2003), a smoothing of the spectral structures and a decrease of the peak amplitude when increasing the pressure (Vandaele et al., 2002). They are only visible in high-resolution spectra such as Vandaele02 and Vandaele03. Figure 3 shows an illustration of the pressure effects observed by Vandaele et al. (2002) at 240 K, using different dilutions at different pressures.
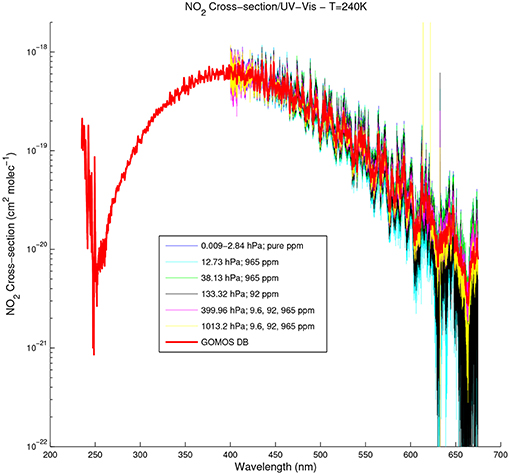
Figure 3. NO2 absorption cross-section between 245 and 695 nm at 240 K, observed by Vandaele et al. (2002) at different pressures. The NO2 absorption cross-section spectrum from GOMOS DB is plotted in red for comparison.
Furthermore, Vandaele et al. (2003) observed that the pressure broadening effect was itself temperature-dependent, and modeled the broadening of a spectral line at wavenumber using a Lorentzian profile:
where ν is the wavenumber and the pressure broadening parameter, γL (half-width at half-maximum, HWHM) is expressed as a function of T and of the pressure P by:
with T0 = 296 K. Based on data from Vandaele et al. (2002) and Vandaele et al. (2003) found values of the γL parameter equal to:
To take pressure effects into account, the NO2 cross-section should be convolved with the broadening function given by Equation (4) using the broadening parameter γL expressed by Equation (6). However, in practice, several aspects have to be considered:
• The temperature- and pressure-dependent correction has to be estimated at each altitude. This can be solved by using a look-up table.
• Following Nyquist's criteria, pressure effects are only significant if the value of 2γL is not too small with respect to the spectral resolution of the NO2 absorption cross-section spectrum (defined as a full width at half maximum, FWHM).
• Similarly, if 2γL is small with respect to the spectral resolution of the GOMOS instrument, pressure effects are blurred and do not influence the NO2 spectrum significantly.
The value of γL was computed at a set of pressure ranges relevant for remote sensing experiments. Table 5 shows an overview of the results in the case of a spectral resolution of 2 cm−1 (as for Vandaele98 and Vandaele03, low resolution spectrum in the range 238–758 nm), 0.1 cm−1 (as for Vandaele02 and Vandaele03, high resolution spectrum in the range 358–725 nm), and 0.05 cm−1 (as for Vandaele03, high resolution spectrum in the range 667–758 nm). It appears that significant pressure broadening is expected in a wide range of temperature and pressure values in the cross-section spectra as reported in Table 5. Obviously, this kind of broadening can only be observed if the resolution of the instrument is sufficient. In the specific case of GOMOS, comparing the range of the pressure broadening at FWHM (= 2γL) to typical spectral resolution of the different GOMOS spectrometers (see Table 1) leads to the conclusion that it is very unlikely that the effect of pressure broadening is visible in GOMOS measurements.
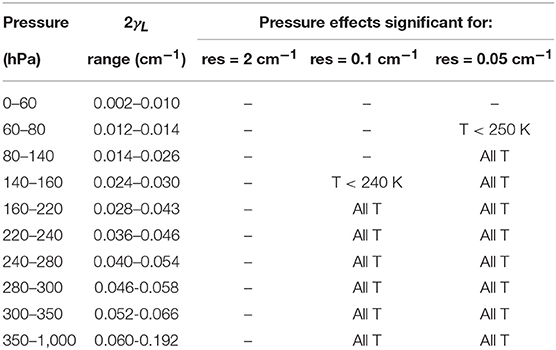
Table 5. Overview of typical values of the pressure broadening parameter γL and of temperature (T) in the range [220, 294 K] for which pressure effects have to be considered, in the case of NO2 absorption cross-section at a resolution of 2, 0.1, and 0.05 cm−1.
4.2.4. Selection of NO2 Absorption Cross-Section Spectra for GOMOS Retrieval
Taking into account all aspects discussed before, a selection of datasets is made for the revised GOMOS database.
From Table 1, it appears that a spectral resolution of 2 cm−1 is sufficient for GOMOS SPA (248–693 nm). This spectral resolution is provided by Vandaele98 and Vandaele03-LR. Since the simulated spectrum Vandaele03-LR is expected to be less affected by experimental noise due to the averaging of many experimental measurements, this dataset is preferred. The linear temperature dependence is applied as provided in the dataset provided by the BIRA-IASB spectroscopy website (http://spectrolab.aeronomie.be/index.htm, referred to as “Spectrolab” in the following). Below 200 K and above 294 K, the value of σNO2 is set at its value at T = 200 K and T = 294 K, respectively. However, no pressure effect is considered since the spectral resolution of GOMOS SPA is too coarse to resolve any expected spectral broadening in this spectral range. The cross-section is provided on the SPA range extended by at least 0.8 nm (i.e., to 247.2–693.8 nm) to allow for the degradation at the resolution of the instrument (0.8 nm for SPA) of the modeled extinction over the whole GOMOS spectral range.
For the spectral range of GOMOS SPB1 (750–776 nm, with a spectral resolution of 0.13 nm), spectra with a minimum resolution of 0.05 cm−1 have to be considered. These data are provided by the Vandaele02-NIR for which spectra are available for pure NO2 and for several dilutions. In a first version, we used Vandaele02 in the near-IR for pure NO2 in the dataset provided by Spectrolab at 220, 240, and 294 K. Figure 4 shows this spectrum at 220 K, compared to Vandaele98 and to the absorption cross-section spectrum provided by GOMOS DB at the same temperature.
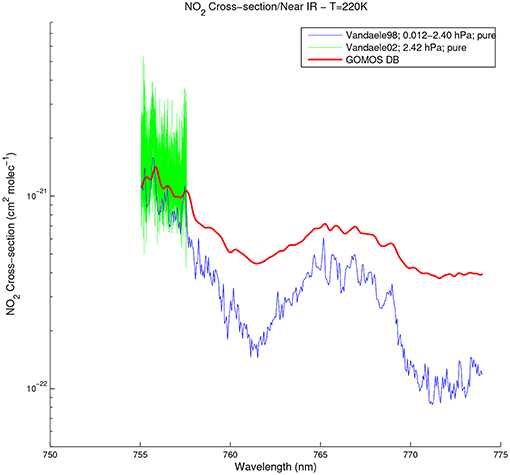
Figure 4. NO2 absorption cross-section spectra between 750 and 776 nm at 220 K, observed by Vandaele et al. (1998) at 0.5 Torr (blue), and Vandaele et al. (2002) in the case of pure NO2 (green). The absorption cross-section provided by GOMOS DB at the same temperature is shown in red for comparison.
However, no data are available above 757.78 nm for this spectrum. Hence, in order to avoid any discontinuity due to the concatenation of two different datasets, we opted for the use of the spectrum provided by the Spectral Atlas of Gaseous Molecules of the Max-Planck Institute for Chemistry (Keller-Rudek et al., 2013) at 294 K for dilution 1 (see Vandaele et al., 2002 for more details), covering the whole spectrum of SPB1. For the temperature dependence which is not provided for dilution 1, we compute a linear dependence by linear regression from Vandaele02 in the near-IR at 220, 240, and 294 K, up to 757.78 nm. At higher wavelengths, the temperature dependence is computed from Vandaele98 provided at 200 and 294 K. As before, values of σNO2 at 220 and 294 K are used below temperatures of 200 K and above 294 K, respectively. The spectrum at dilution 1 is given at a pressure of 300 Torr (≃ 400 hPa, corresponding to ~ 7.5 km). As discussed above, a broadening of spectral lines can be expected at higher pressures, but the width of the broadening function (6) to be convolved is significantly smaller than the GOMOS spectral sampling, so that no convolution is performed in this case. As in the case of SPA, the cross-section spectrum is provided on the SPB1 spectral range extended by at least 0.13 nm (i.e., 749.87–776.13 nm) to allow the degradation of the modeled extinction at the resolution of GOMOS (0.13 nm for SPB1).
Finally, GOMOS SPB2 requires the use of cross-section spectra at the highest spectral resolution. In the range 915–926 nm, Vandaele02-NIR provides a sufficient resolution with respect to SPB2. The temperature dependence can be calculated from the spectra at 220, 240, and 294 K, as well as pressure effects. Furthermore, there is no NO2 cross-section spectrum at present with a spectral resolution at least equal to the SPB2 resolution in the spectral range 926–956 nm. The only cross-section spectrum covering the whole SPB2 spectral range is Vandaele98. In order to avoid discontinuities in the spectra, we may consider to use this dataset over the whole spectrum SPB2: this choice has to be made when SPB2 will be used effectively. It is provided at 220 and 294 K, so that a linear temperature dependence can be derived. The extension of the cross-section beyond the limits of the experimental ranges occurs as previously: values at 220 and 294 K are considered below 200 K and above 294 K, respectively, and the cross-section is provided over a spectral range extended by at least 0.13 nm (i.e., 914.87–956.13 nm). No pressure effect can be observed in this medium resolution spectrum.
4.3. Nitrogen Trioxide
GOMOS is of particular interest in the observation of NO3. This compound is formed from NO2 and O3, a reaction that doesn't require the presence of light. NO3 is photolyzed very fast during daytime and its concentration becomes rapidly several orders of magnitude lower than during night-time. As a consequence, NO3 is practically unobservable during daytime, but can be observed during night-time, when it can also recombine with NO2 to form N2O5 (Coffey, 1996; Brasseur et al., 1999). As for NO2, since GOMOS performs night-time stellar occultations, it can measure NO3 night-time abundances and provides thus a unique occasion of routine measurements of the night-time evolution of the concentration of NO3 (Bertaux et al., 2010; Kyrölä et al., 2010a).
Table 6 gives an overview of the main available NO3 absorption cross-section spectra. All these datasets can be found in the MPIC Spectral atlas of gaseous molecules. Sander (1986) measured NO3 absorption cross-section spectra in the range 220–700 nm at 230 and 298 K, using two different experimental methods. He found overall experimental uncertainties of about 15% for both methods. The most detailed study of temperature effects was proposes by Yokelson et al. (1994) who measured NO3 cross-section spectra at four temperatures in the range 440–694 nm, with a total experimental uncertainty of about 5-10%. Orphal et al. (2003) measured the NO3 absorption cross-section at 294 K between 476 and 794 nm. They estimated the experimental uncertainty to be <3% in the spectral region around the 662 nm peak where it is limited by the strong contribution of O3 in the Chappuis bands, and even better far from this region, where the O3 cross-section is weaker.
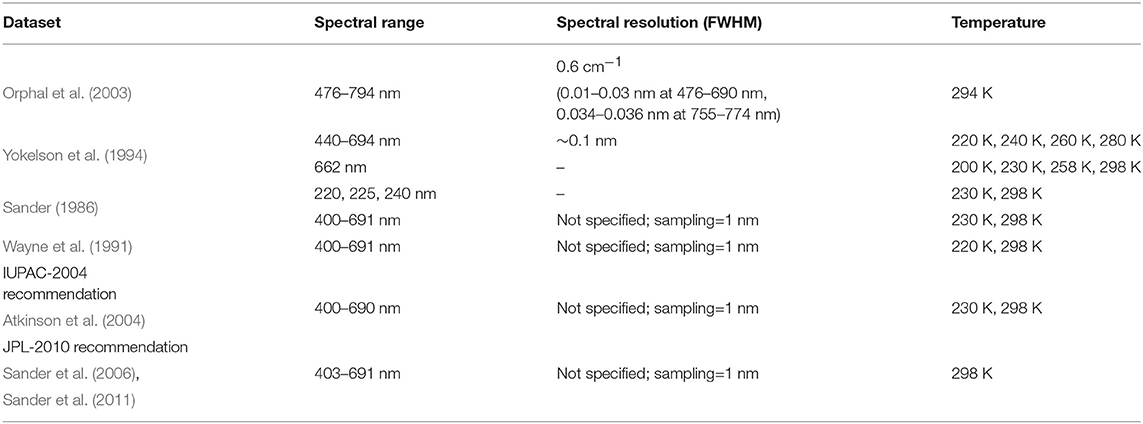
Table 6. Datasets considered for the NO3 absorption cross-section spectrum, and their characteristics.
No less than 5 datasets in Table 6 concern the spectral range 400–650 nm. However, it appeared that (Wayne et al., 1991), the IUPAC-2004 recommendation (Atkinson et al., 2004), and the JPL-2010 recommendation (Sander et al., 2006, 2011) are based on Sander (1986), and show consequently the same coarse spectral sampling (1 nm) with respect to GOMOS. The only independent datasets are thus (Sander, 1986; Yokelson et al., 1994; Orphal et al., 2003). Since recommendations mainly aim at finding a way to fill gaps in the datasets at the time they were written, we prefer not to use them for the revision of the GOMOS cross-section database, and we only use them for the purpose of comparisons.
For NO3, GOMOS DB is based on Sander (1986) between 400 and 599 nm, and on JPL recommendations from 1987 between 600 and 704 nm (Oikarinen et al., 2000).
Figure 5 shows the NO3 spectrum between 478 and 690 nm as provided by Orphal et al. (2003) at 294 K, as well as corresponding values provided by GOMOS DB. Beside a very dense set of narrow spectral lines below about 510 nm, evolving toward larger spectral structures, the NO3 spectrum shows high and large peaks around 589, 623 nm, and mainly 662 nm, a spectral region of particular importance for the detection of NO3 that was investigated by several authors into more details. In particular, Orphal et al. (2003) proposed an expression of the temperature dependence between 200 and 298 K based on a new interpretation of the temperature dependence of the population of the electronic ground state. The authors expected the uncertainty on this theoretical expression to be less than the error on experimental data which are often about 4%.
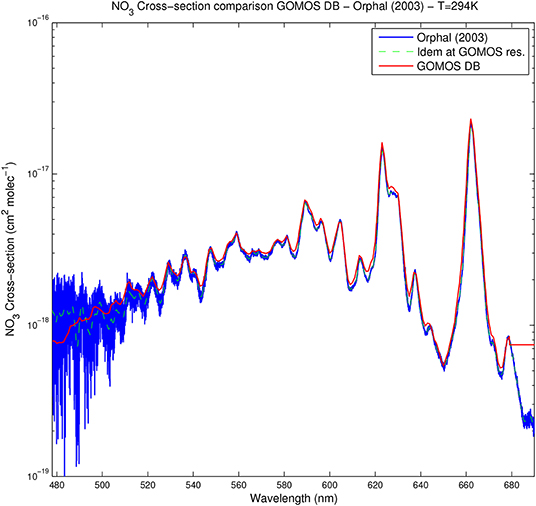
Figure 5. NO3 absorption cross-section between 478 and 690 nm at 294 K. Shown are the spectra provided by Orphal et al. (2003) (blue), Orphal et al. (2003) degraded at GOMOS resolution (dashed green), and the GOMOS cross-section database (red).
Contrarily to the case of O3 and NO2, the different datasets are not able to cover the entire GOMOS spectral range, nor large parts of it. For those reasons, we also considered, in the case of NO3, datasets dedicated to limited spectral regions of interest. Due to the sparcity of the available records, more datasets have to be combined for the characterization of the NO3 absorption cross-section over the GOMOS spectral range than in the case of O3 and NO2. Such transition may require some care to avoid artifacts due to discontinuities in the absorption cross-section spectrum, by omission of the spectral channels very close to the boundary between datasets.
4.3.1. NO3 Absorption Cross-Section Spectra Around the Peak at 662 nm
Figure 6 shows the spectral region 650–675 nm surrounding the spectral peak at 662 nm, as measured by Orphal et al. (2003) at 294 K, interpolated at this temperature from Yokelson et al. (1994), and by GOMOS DB. All spectra take very similar values at the peak wavelength, and are also in agreement within the error bar with values suggested at 662 nm by other authors: 2.5 10−17 cm2 molec−1 at 220 K by Wayne et al. (1991), 2.3 10−17 cm2 molec−1 by the JPL recommendations (see Table 6) at 298 K, and 2.1 10−17 cm2 molec−1 at 298 K by Wayne et al. (1991) and the IUPAC 2004 recommendation (Atkinson et al., 2004). This last value is particularly close to Orphal's one (2.11 10−17 cm2 molec−1 at 294 K).
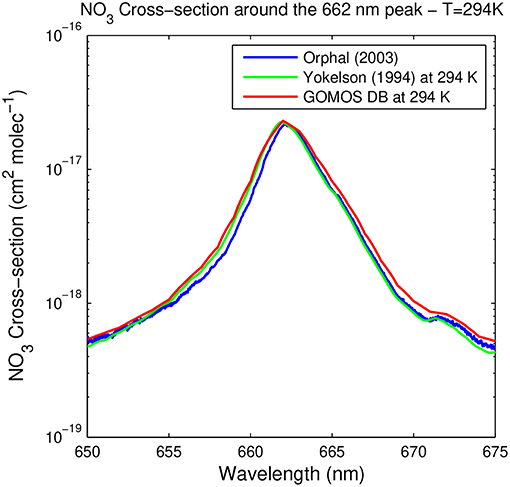
Figure 6. NO3 absorption cross-section around the peak at 662 nm, as provided by Orphal et al. (2003) (blue), the GOMOS cross-section database (red), and Yokelson et al. (1994) (green).
Figure 7 shows the same spectral region, but plotted as a function of temperature between 200 K and 300 K, at the 662 nm spectral peak (upper panel) and at several wavelengths close to the peak (lower panel). All spectra, in this case have been degraded at GOMOS resolution, what slightly increases the differences between the three datasets with respect to the same plot at the original resolution of each dataset. Orphal's cross-sections at temperatures other than 294 K are calculated using the expression of temperature dependence provided by Orphal et al. (2003). At 655 nm, the agreement is particularly good between temperature dependences between the 3 datasets above 230 K. Below 230 K, GOMOS DB doesn't provide any temperature dependence. Cross-sections from Yokelson et al. (1994) have very similar values at 200 and 240 K, which is a weaker temperature dependence than the one calculated using (Orphal et al., 2003). These authors assume that their theoretical formula probably gives more accurate results than experimentally determined dependences. At 662 nm, the agreement between (Orphal et al., 2003) and (Yokelson et al., 1994) is particularly good (Orphal et al., 2003). From Figure 7, the agreement seems less satisfactory at 660 and 665 nm, but it has to be taken into account that these wavelengths are at the edge of the 662 nm peak where higher discrepancies are expected, as seen in Figure 6. This figure also shows a particularly good agreement between (Orphal et al., 2003) and (Yokelson et al., 1994).
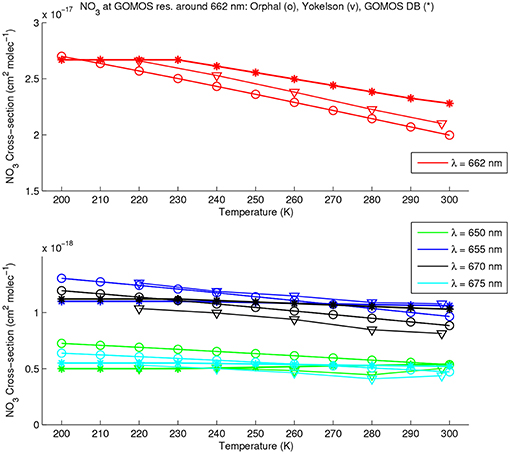
Figure 7. Temperature dependence of the NO3 absorption cross-section around the peak at 662 nm, as provided by Orphal et al. (2003) (circles), Yokelson et al. (1994) (triangles), and GOMOS DB (stars). All spectra are considered at GOMOS spectral resolution. The color code used for the different wavelengths covering the range 650–675 nm, is given in the legend.
At 660 nm, GOMOS DB does not provide the temperature dependence below 240 K and can thus be improved, although the temperature dependence in the range 240–300 K is in agreement for GOMOS DB (Yokelson et al., 1994; Orphal et al., 2003), within the error bars.
Elsewhere at wavelengths further from the peak maximum, the temperature dependence is much lower, and values agree satisfactorily for all datasets.
4.3.2. NO3 Absorption Cross-Section Spectra in the Range 400–650 nm
Figure 8 shows the NO3 absorption cross-section spectrum between 400 and 500 nm, as provided by the different authors. In this range, data are available from Orphal et al. (2003) down to 476 nm with a very good resolution (see Table 6), but only at 294 K. Cross-section data published by Yokelson et al. (1994) are available at 4 different temperatures with a resolution of 0.2 nm, higher than the one of the GOMOS SPA down to 440 nm. The other considered datasets are given with a lower sampling rate of 1 nm, and are thus not selected for the revision of the GOMOS cross-section database in this spectral range.
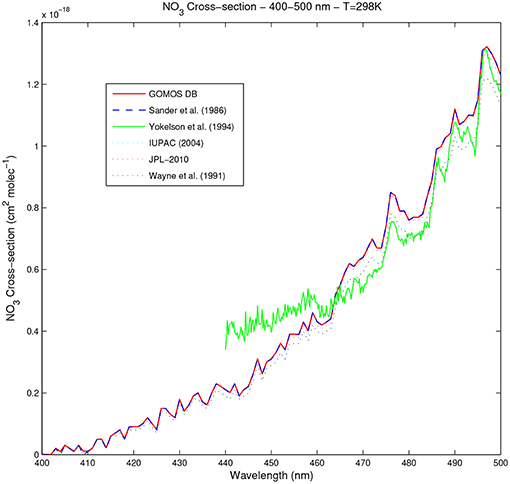
Figure 8. NO3 absorption cross-section in the spectral range 400–500 nm at 298 K for all available datasets.
The most striking feature in Figure 8 is a divergence of Yokelson et al. (1994) with respect to the other datasets, occurring below ~465 to 470 nm, depending on the temperature.
The temperature dependence of all datasets was investigated at different wavelengths, and Figure 9 shows an example of dependence at 460 nm. Yokelson et al. (1994) shows a much greater variability than previous measurements (e.g., Sander, 1986) resolving better the temperature dependence through measurements at intermediate temperatures. Comparing GOMOS DB and Sander (1986) temperature dependence (from measurements at 230 and 298 K) with (Yokelson et al., 1994) (deriving values at 230 K by interpolation between the measurements at 220 and 240 K) gives varying agreement. While the temperature dependence is very similar between both datasets at 460, 490 and 500 nm, the agreement decreases at lower wavelength, reaching ~60% at 230 K and 440 nm. At 470 nm, GOMOS DB and Sander show a increasing temperature dependence, contrary to Yokelson et al. (1994) (not shown). Below 440 nm, no comparison of the temperature dependence is possible since all available datasets are based on Sander (1986).
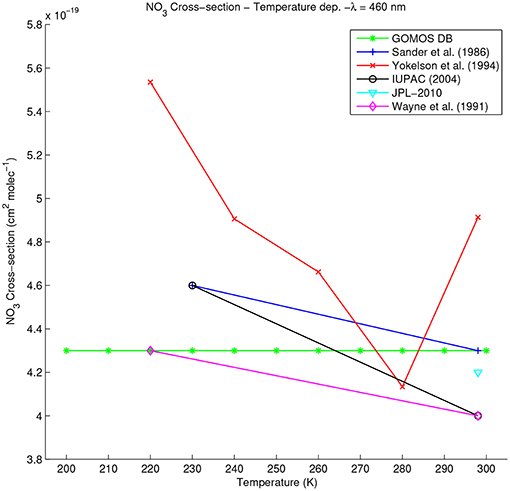
Figure 9. Temperature dependence of the NO3 absorption cross-section at 460 nm for all available datasets.
4.3.3. NO3 Absorption Cross-Section Spectra in the Range 220–260 nm
Below 400 nm, the only data available for the NO3 absorption cross-section are measurements by Sander (1986) using two different experimental methods. Estimates of σNO3 were measured by the flash photolysis method at 230 K (225nm), 250 K (225 nm), and 298 K (220, 225, 2235, and 240 nm), and upper limits of σNO3 were measured at 220, 225, 240, and 260 nm by the discharge flow-titration method at 298 K (Sander, 1986). With this last method, a small but unknown contribution is expected to come from the absorbance from NO2 formation.
4.3.4. Selection of NO3 Absorption Cross-Section Spectra for GOMOS Retrieval
Taking into account all investigations described above, the following choices were made for the revision of the NO3 absorption cross-section.
As for O3 and NO2, the increment of ~0.05 nm used in GOMOS DB is replaced by the varying increments used in the original datsets, in order to keep the highest resolution possible. Taking into account the temperature range covered by all available datasets, the temperature range considered in the revised database is 200 to 298 K, with reference data at 200, 210, ···, 290 K, and 298 K. Below 200 K and above 298 K, the values of σNO3 are set to its values at 200 and 298 K, respectively.
Below 400 nm, in view of the very sparse and uncertain character of the available data measured by Sander (1986), we finally chose not to consider these data and to use the constant value of σNO3 at 400 nm.
Between 400 and 440 nm, several datasets are available, all based on Sander (1986) given at 230 and 298 K. We use (Sander, 1986) with a linear interpolation in temperature in the range 230–298 K. Below 230 K, the value at σNO3 at 230 K is considered.
The situation is more complex between 440 and 476 nm where the highest resolution is provided by Yokelson et al. (1994) which measured the absorption cross-section spectrum at 4 temperatures. On the other hand, the divergence of the spectrum below 470 nm with respect to the other datasets (Figure 8) imposed to choose between two possible approaches. In a first high resolution approach, Yokelson's data are used, with linear interpolation at all temperatures between 220 and 298 K. Below 220 K, Yokelson's spectrum at 220 K is used and no temperature dependence is considered. In this case, a discontinuity is unavoidable at 400 nm, at the junction between Sander and Yokelson datasets. Another low resolution approach is to apply the temperature dependence provided by Yokelson et al. (1994) to Sander's spectrum, with normalization of the spectrum at 298 K using Sander's values. The final resolution is that of Sander (1986). Below 220 K, fixed values calculated at 220 K are considered. In order to avoid any artifact related to the discontinuity at 470 nm in the high resolution approach, we opted for the low resolution approach.
Between 476 and 650 nm, and 675 to 694 nm, high resolution spectra are available at 294 K (Orphal et al., 2003), but no temperature dependence is provided by these authors. On the other hand, Yokelson et al. (1994) propose a high resolution spectrum (although with lower resolution than Orphal et al., 2003) at 5 temperatures up to 691 nm. In this spectral range, we apply the temperature dependence from Yokelson et al. (1994) to Orphal et al. (2003), with normalization at Orphal' values at 294 K and a linear interpolation at Orphal's wavelengths, so that the final resolution is the one of Orphal et al. (2003) (see Table 6). In the range 200–220 K and 476–694 nm where no temperature is provided by Yokelson et al. (1994), σNO3 is set to its value at 220 K. Out of Yokelson's range, the temperature dependence is unknown and values provided by Orphal et al. (2003) are used at all temperatures. The same choice is imposed above 694 nm where only Orphal et al., 2003 is available at 294 K.
Finally, a high-resolution spectrum is available in the range 650–675 nm surrounding the absorption peak at 662 nm: Orphal et al. (2003) provide a spectrum at 294 K and a formula for the calculation of the temperature dependence between 200 and 298 K. This model is expected to be more accurate than experimental values by the authors, and we use this dataset at original spectral resolution (see Table 6) at all temperatures in this spectral range.
Overall, the selected dataset covers the spectral range of GOMOS spectrometers A and B1, but no data are available for SPB2 where the absorption cross-section used at 794 nm (the highest wavelength for which σNO3 is available) is considered as the best choice.
In all cases, it may happen that some negative values occur in the provided datasets. These negative values for a positive defined quantity are not necessarily problematic since they have to be considered with their uncertainty. Taking into account the fact that their absolute value is generally very low, all negative values of any absorption cross-section are set to zero, in order to avoid numerical problems during the inversion by AerGOM.
5. Implementation of the Revised Cross-Section Database in AerGOM
With the new cross-sections, we can now build up the forward model that is to be compared to the measurements. Starting from an initial guess of the different vertical gas density profiles nair,0(z), nO3,0(z), nNO2,0(z) and nNO3,0(z), we can deduce the corresponding gas extinction profile at each vertical level zi corresponding to the tangent altitude of a measurement:
In Equation (7), the cross-section dependence on zi expresses the actual dependence on the local atmospheric conditions (temperature and possibly pressure). We make the usual assumption that the composition and atmospheric conditions are constant in horizontal layers corresponding to each tangent altitude zi (the main hypothesis of the so-called onion-pealing method used for occultation retrieval). From the gas extinction βgas, forw(λ, zi) and a guess of the aerosol extinction βaero, forw(λ, zi), we can obtain the optical thickness given by Equation (2), τλ, forw(zi), at each tangent altitude zi. Therefore, we have to take into account the geometry of the Earth reference ellipsoid and the refractive bending of the light in the atmosphere. To do so, considering horizontal layers around each tangent altitude zj, we give an appropriate weight to the contribution of every horizontal layer situated between the ith layer and the top of the atmosphere (TOA):
with G(i, j) the path length along opath(zi) passing through the horizontal atmospheric layer around tangent altitude zj.
Equation (8) provides, using Beer-Lambert's law (1), an expression of the irradiance I(λ, i) at the entrance of the instrument, measured along the optical path corresponding to tangent altitude zi. However, the spectral response of the instrument has to be taken into account to model the measurement. For a light source (a star in the case of GOMOS) with emission spectrum I0(λ), the measured irradiance corresponding to the tangent altitude zi is:
where stands for the convolution between the incoming irradiance and the line spread function LSF(λ) of the instrument. Here, we suppose I0(λ) constant, but more rigourously, we have to take into account scintillation and chromatic effects taking place during the duration of the measurement (Sofieva et al., 2009). LSF(λ) can be modeled by a Gaussian function with a FWHM equal to the spectrometer resolution provided in Table 1. Rigorously, the expression (9) has to be recalculated for every tangent altitude and at all iteration of the non-linear optimization process. However, in spectral regions where the cross-section spectrum of all considered species changes slowly with respect to LSF(λ), Equation (9) can be simplified as
In such a case, the convolution can be applied directly on the cross-section spectra once and for all, significantly reducing the computing time of the processing. While such an approach seems to be sufficient when only SPA is used, the inclusion of other spectral contributions with pronounced spectral features (e.g., water vapor in the near-IR range), has to be considered much more cautiously.
Figures 10, 11 show examples of the forward model showing the transmittance calculated from Equations (1, 7–10) and computed from vertical gas density and aerosol extinction profiles retrieved from a GOMOS occultation that was measured on August 23rd, 2007 at latitude 32°S and longitude 102°E. Figure 10 shows that the use of the revised cross-section database leads, in this particular case, to differences in the estimate of the transmittance up to about 100% at the level of the O3 Huggins bands at some altitudes, and up to 8% in the 550–700 nm spectral range, of importance for the retrieval of NO2 and NO3.
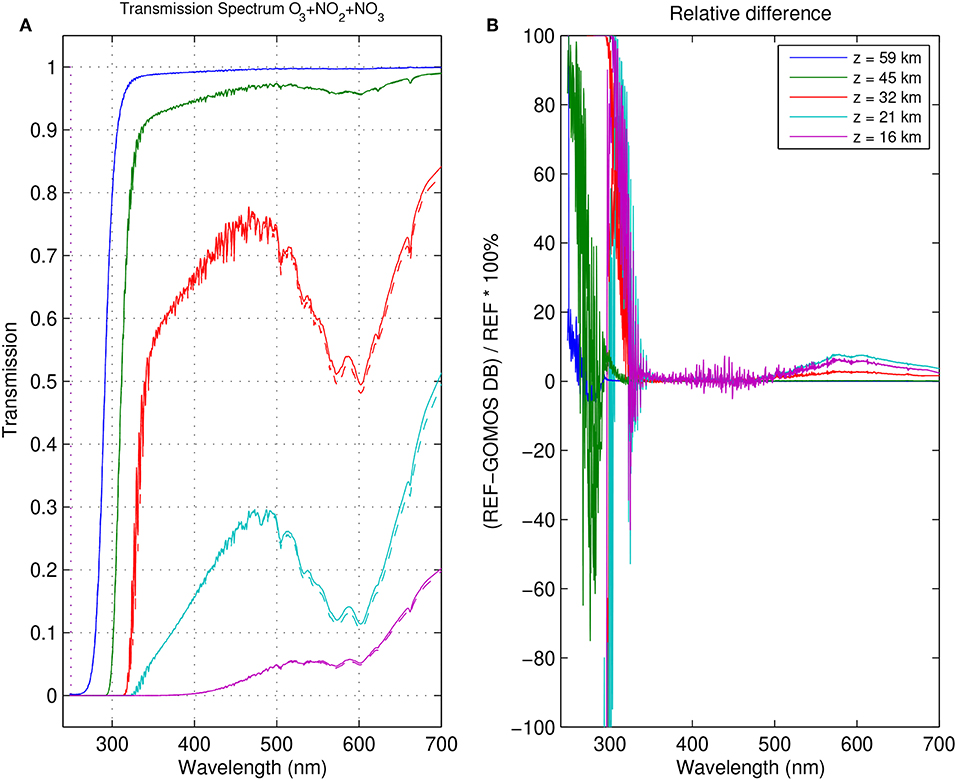
Figure 10. (A) Forward model transmittance constructed from the gas and aerosol profiles corresponding to the total transmittance at different altitudes for the GOMOS occultation measured on August 23rd, 2007 at latitude 32°S and longitude 102°E. Atmospheric conditions considered for the calculation of the local absorption/scattering cross-sections are taken from the meteorological fields provided in the GOMOS data product. Figure shows the model built with the revised cross-section database (solid) and GOMOS DB (dashed). The spectral range corresponds to the GOMOS spectrometer SPA. (B) Relative difference between the forward models computer with the revised cross-section database and with GOMOS DB.
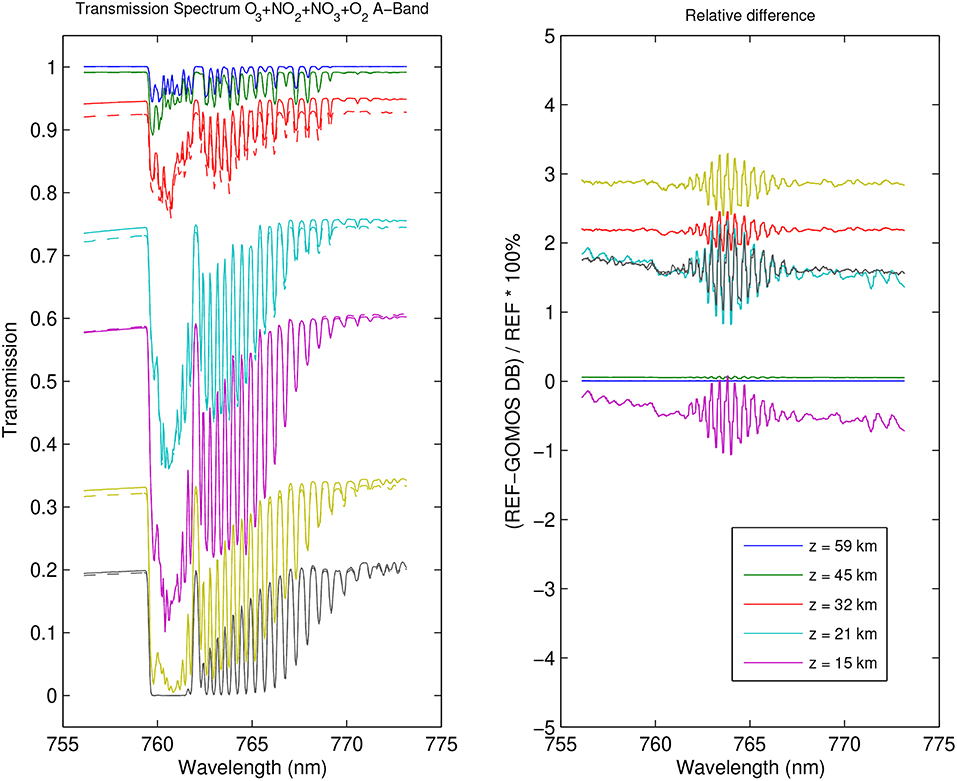
Figure 11. Same as Figure 10, for a spectral range corresponding to the GOMOS spectrometer SPB1. The O2 A-band contribution has been taken into account.
For the computation of the forward model in the near IR (Figure 11), the important contribution from to the O2 A-band has been added. The O2 density was derived from the air density assuming a O2 content of 20.95%. The O2 A-band cross-sections used here are provided by the HITRAN cross-section database (Gordon et al., 2017). In this case, the relative difference between the transmittance computed from the old and the revised cross-section spectra is about a few percent, in a spectral region where O2 dominates the influence of atmospheric gases.
6. Conclusions
After investigation of O3, NO2, and NO3 absorption cross-section spectra covering at least a large part of the GOMOS spectral range, we have proposed a new set of reference cross-section datasets covering the temperature range 200–300 K for use in AerGOM, an alternative inversion algorithm for the retrieval of atmospheric species from GOMOS, optimized for aerosol retrieval.
While the former GOMOS cross-section database (GOMOS DB) presented large gaps with respect to the spectral range of GOMOS, we were able to find adequate data sources in most of the cases, with a resolution higher than the GOMOS resolution. A notable exception is the spectrum covered by GOMOS SPB2, for which no cross-section spectra could be found for NO3. We improve nevertheless the status with respect to GOMOS DB, where no data were available for this species for SPB1 as well. If expressions of the temperature dependence are not available for all spectral regions and all species, the characterization of this dependence is still better than in GOMOS DB. In particular, the temperature dependence of the 662 nm peak in the NO3 cross-section spectrum is well-characterized, whereas it was unavailable in GOMOS DB.
In the case of O3, we use a single consistent dataset (Serdyuchenko14) covering all needs in terms of temperature and spectral range, spectral resolution. We find that GOMOS DB is biased high in most cases with respect to this new dataset. It is also the case for NO2 in the spectral range of SPB1. Although pressure effects are observed in most spectral regions in the case of NO2, we found that it is not necessary to take them into account in our case due to the coarse spectral resolution of the GOMOS instrument. However, it might be necessary to consider them with other instruments with a higher spectral resolution, i.e., a spectral resolution at least equal to 2 γL.
While the aerosol retrieval by AerGOM has been published yet (Robert et al., 2016; Vanhellemont et al., 2016), a detailed analysis has been done on how to improve the gas retrieval by AerGOM, using the new cross-section database. This will be the subject of a future publication.
Although this work was undertaken to improve the retrieval of gas and aerosols for the GOMOS experiment, the analysis presented here has a broader scope and should provide useful recommendations for the use of molecular absorption cross-sections in the gas retrieval from any other instrument measuring in the UV-visible-near IR range.
Furthermore, this work could be further improved if new laboratory measurements are published in the future, improving the quality of available cross-section spectra. In particular, the publication of high resolution NO3 measurements over a wider temperature and spectral range should be beneficial for the performance of the cross-section database. Also, it would be useful to fill the lack of absorption cross-section at sufficient spectral resolution for NO2 in the spectral range of the SPB2 spectrometer, and the absence of NO3 cross-section measurements in the same spectral range.
Data Availability
The high-resolution cross-sections for O3 were provided by the MPI-Mainz UV-VIS Spectral Atlas of Gaseous Molecules of Atmospheric Interest (http://www.uv-vis-spectral-atlas-mainz.org) and were used at this resolution without any further processing. The high-resolution cross-sections for NO2 and NO3 used in the new GOMOS cross-section database are available in the repository https://doi.org/10.18758/71021045.
Author Contributions
CB and CH investigated the available cross-section datasets and developed the revised cross-section database. CB and CR implemented and tested the new cross-section database on the aerosol and gas retrieval using AerGOM. FV and NM are the main developers of the AerGOM retrieval algorithm. ED reviewed the paper, and DF brought his expertise related to the GOMOS experiment.
Funding
This work was supported by the European Space Agency as part of the Aerosol_cci project (ESA Contract No. 4000109874/14/I-NB), and as part of the EXPANSION project in the framework of a Living Planet Fellowship (ESA/ESRIN/Contract No. 4000116512/16/I-NB). Supporting work for the development of GOMOS datasets was performed in the framework of MIMOSA-5, a Marie Curie Career Integration Grant within the 7th European Community Framework Programme under Grant Agreement No. 293560. The AerGOM project was financed by the European Space Agency (Contract No. 22022/OP/I-OL). The GOMOS activities benefitted from the financial aid of the Belgian Federal Science Policy (BELSPO).
Conflict of Interest Statement
The authors declare that the research was conducted in the absence of any commercial or financial relationships that could be construed as a potential conflict of interest.
Acknowledgments
Original absorption cross-section data were provided by the MPI-Mainz UV/VIS Spectral Atlas of Gaseous Molecules of Atmospheric Interest (http://www.uv-vis-spectral-atlas-mainz.org) and by the BIRA-IASB spectroscopy website (http://spectrolab.aeronomie.be/index.htm). The authors thank Dr. Johannes Orphal and Dr. Ann-Carine Vandaele for their support and for the very fruitful discussions.
References
Atkinson, R., Baulch, D., Cox, R., Crowley, J., Hampson, R., Hynes, R., et al. (2004). Evaluated kinetic and photochemical data for atmospheric chemistry: volume I - gas phase reactions of Ox, HOx, NOx and SOx species. Atmos. Chem. Phys. 4, 1461–1738. doi: 10.5194/acp-4-1461-2004
Bertaux, J. L., Kyrölä, E., Fussen, D., Hauchecorne, A., Dalaudier, F., Sofieva, V., et al. (2010). Global ozone monitoring by occultation of stars: an overview of GOMOS measurements on ENVISAT. Atmos. Chem. Phys. 10, 12091–12148. doi: 10.5194/acp-10-12091-2010
Bodhaine, B. A., Wood, N. B., Dutton, E., and Slusser, J. R. (1999). On rayleigh optical depth calculations. J. Atmos. Ocean. Tech. 16, 1854–1861.
Bogumil, K., Orphal, J., Homann, T., Voigt, S., Spietz, P., Fleischmann, O. C., et al. (2003). Measurements of molecular absorption spectra with the SCIAMACHY pre-flight model: instrument characterization and reference data for atmospheric remote-sensing in the 230-2380 nm region. J. Photochem. Photobiol. A 157, 167–184. doi: 10.1016/S1010-6030(03)00062-5
Brasseur, G. P., Orlando, J. J., and Tyndall, G. S. (eds.). (1999). Atmospheric Chemistry and Global Change. New York, NY: Oxford University Press.
Burrows, J. P., Dehn, A., Deters, B., Himmelmann, S., Richter, A., Voigt, S., et al. (1998). Atmospheric remote-sensing reference data from GOME: Part 1. Temperature-dependent absorption cross-sections of NO2 in the 231-794 nm range. J. Quant. Spectrosc. Radiat. Transfer 60, 1025–1031. doi: 10.1016/S0022-4073(97)00197-0
Burrows, J. P., Richter, A., Dehn, A., Deters, B., Voigt, S. H. S., and Orphal, J. (1999). Atmospheric remote-sensing reference data from GOME: part 2. Temperature-dependent absorption cross-sections of O3 in the 231-794 nm range. J. Quant. Spectrosc. Radiat. Transfer 61, 509–517.
Coffey, M. T. (1996). Observations of the impact of volcanic activity on stratospheric chemistry. J. Geophys. Res. 101, 6767–6780.
Coquart, B., Jenouvrier, A., and Mérienne, M. F. (1995). The NO2 absorption spectrum, Part II, Absorption cross-sections at low temperatures in the 400-500 nm region. J. Atmos. Chem 21, 251–261.
Gordon, I. E., Rothman, L. S., Hill, C., Kochanov, R. V., Tan, Y., Bernath, P. F., et al. (2017). The HITRAN2016 molecular spectroscopic database. J. Quant. Spectrosc. Radiat. Transfer. 203, 3–69. doi: 10.1016/j.jqsrt.2017.06.038
Gorshelev, V., Serdyuchenko, A., Weber, M., Chehade, W., and Burrows, J. P. (2014). High spectral resolution ozone absorption cross-sections - Part 1: Measurements, data analysis and comparison with previous measurements around 293k. Atmos. Meas. Tech. 7, 609–624. doi: 10.5194/amt-7-609-2014
Harder, J. W., Brault, J. W., Johnson, P. V., and Mount, G. H. (1997). Temperature dependent NO2 cross sections at high spectral resolution. J. Geophys. Res. 102, 3861–3879.
Harwood, M. H., and Jones, R. L. (1994). Temperature dependent ultraviolet-visible absorption cross-sections of NO2 and N2O4 : low-temperature measurements of the equilibrium constant for 2 NO2 - N2O4. J. of Geophys. Res. 99, 22955–22964.
Hauchecorne, A., Bertaux, J. L., Dalaudier, F., Cot, C., Lebrun, J.-C., Bekki, S., et al. (2005). First simultaneous global measurements of nighttime stratospheric NO2 and NO3 observed by Global Ozone Monitoring by occultation of Stars (GOMOS)/Envisat in 2003. J. Geophys. Res. 110, 12091–12148. doi: 10.1029/2004JD005711
Keller-Rudek, H., Moortgat, G. K., Sander, R., and Sörensen, R. (2013). The MPI-Mainz UV/VIS spectral atlas of gaseous molecules of atmospheric interest. Earth Syst. Sci. Data 5, 365–373. doi: 10.5194/essd-5-365-2013
Kyrölä, E., Blanot, L., Tamminen, J., Bertaux, J. L., Hauchecorne, A., Dalaudier, F., et al. (2012). GOMOS Algorithm Theoretical Basis Document. GOM-FMI-TN-040, version 3.0, 5 december 2012, ESA.
Kyrölä, E., and Simon, P. (1996). Cross Section Data Bank Content and Structure. PO-TN-FMI-GM-010, ESA.
Kyrölä, E., Tamminen, J., Sofieva, V., Bertaux, J. L., Hauchecorne, A., Dalaudier, F., et al. (2010a). GOMOS O3, NO2, and NO3 observations in 2002-2008. Atmos. Chem. Phys. 10, 7723–7738. doi: 10.5194/acp-10-7723-2010
Kyrölä, E., Tamminen, J., Sofieva, V., Bertaux, J. L., Hauchenorne, A., Fussen, F. D. D., et al. (2010b). Retrieval of atmospheric parameters from GOMOS data. Atmos. Chem. Phys. 10, 11881–11903. doi: 10.5194/acp-10-11881-2010
Mérienne, M. F., Jenouvrier, A., and Coquart, B. (1995). The NO2 absorption spectrum, Part I, Absorption cross-sections at ambient temperature in the 300-500 nm region. J. Atmos. Chem. 20, 281–297. doi: 10.1007/BF00694498
Oikarinen, L., Kyrölä, E., and Simon, P. (2000). Gomos Prototype High Priority Study: Cross Sections. PO-TN-FMI-GM-015, update of issue 1.1 by C. Bingen, D. Fussen, and L. Oikarinen, November 2000, ESA.
Orphal, J. (2002). A critical Review of the Absorption Cross-Section of O3 and NO2 in the 240-790 nm Region. part 2. Nitrogen Dioxide. Technical note MO-TN-ESA-GO-0302, 15 march 2002, ESA.
Orphal, J. (2003). A critical review of the absorption cross-section of O3 and NO2 in the ultraviolet and visible. J. Photochem. Photobiol. A 157, 185–209. doi: 10.1016/S1010-6030(03)00061-3
Orphal, J., Fellows, C. E., and Flaud, P.-M. (2003). The visible absorption spectrum of NO3 measured by high-resolution Fourier transform spectroscopy. J. Geophys. Res. 108:4077. doi: 10.1029/2002JD002489
Renard, J.-B., Berthet, G., Brogniez, C., Catoire, V., Fussen, D., Goutail, F., et al. (2008). Validation of GOMOS-Envisat vertical profiles of O3, NO2, NO3, and aerosol extinction using balloon-borne instruments and analysis of the retrievals. J. Geophys. Res. 113:A02302. doi: 10.1029/2007JA012345
Robert, C. E., Bingen, C., Vanhellemont, F., Mateshvili, N., Dekemper, E., Tétard, C., et al. (2016). AerGOM, an improved algorithm for stratospheric aerosol extinction retrieval from GOMOS observations - Part 2: Intercomparisons. Atmos. Meas. Tech. 9, 4701–4718. doi: 10.5194/amt-9-4701-2016
Sander, S. P. (1986). Temperature dependence of the NO3 absorption spectrum. J. Phys. Chem. 90, 4135–4142. doi: 10.1021/j100408a060
Sander, S. P., Abbatt, J., Barker, J. R., Burkholder, J. B., Friedl, R. R., Golden, D. M., et al. (2011). Chemical Kinetics and Photochemical Data for Use in Atmospheric Studies. Evaluation Number 17. Pasadena: JPL Publication 10-6; Jet Propulsion Laboratory.
Sander, S. P., Friedl, R., Golden, D., Kurylo, M., Moortgat, G., Keller-Rudek, H., et al. (2006). Chemical Kinetics and Photochemical Data for Use in Atmospheric Studies. Evaluation Number 15. Pasadena: JPL Publication 06-2; Jet Propulsion Laboratory.
Serdyuchenko, A., Gorshelev, V., Weber, M., Chehade, W., and Burrows, J. P. (2014). High spectral resolution ozone absorption cross-sections - Part 2: Temperature dependence. Atmos. Meas. Tech. 7, 625–636. doi: 10.5194/amt-7-625-2014
Sofieva, V., Kan, V., Dalaudier, F., Kyrölä, E., Tamminen, J., Sofieva, V., et al. (2009). Influence of scintillation on quality of ozone monitoring by gomos. Atmos. Chem. Phys. 9, 9197–9207. doi: 10.5194/acp-9-9197-2009
Vandaele, A. C., Hermans, C., Fally, S., Carleer, M., Colin, R., Mérienne, M.-F., et al. (2002). High-resolution Fourier transform measurement of the NO2 visible and near-infrared absorption cross sections: temperature and pressure effects. J. Geophys. Res. 107, ACH 3-1-ACH 3-12. doi: 10.1029/2001JD000971
Vandaele, A. C., Hermans, C., Fally, S., Carleer, M., Mérienne, M.-F., Jenouvrier, A., et al. (2003). Absorption cross-sections of NO2: simulation of temperature and pressure effects. J. Quant. Spectrosc. Radiat. Transfer 76, 373–391. doi: 10.1016/S0022-4073(02)00064-X
Vandaele, A. C., Hermans, C., Simon, P. C., Carleer, M., Colin, R., Fally, S., et al. (1998). Measurements of the NO2 absorption cross-section from 42,000 cm−1 to 10,000 cm−1 (238-1000 nm) at 220k and 294k. J. Quant. Spectrosc. Radiat. Transfer 59, 171–184.
Vanhellemont, F., Fussen, D., Bingen, C., Kyrölä, E., Tamminen, J., Sofieva, V., et al. (2005). A 2003 stratospheric aerosol extinction and PSC climatology from GOMOS measurements on Envisat. Atmos. Chem. Phys. 5, 2413–2417. doi: 10.5194/acp-5-2413-2005
Vanhellemont, F., Fussen, D., Mateshvili, N., Tétard, C., Bingen, C., Dekemper, E., et al. (2010). Optical extinction by upper tropospheric/stratospheric aerosols and clouds: GOMOS observations for the period 2002-2008. Atmos. Chem. Phys. 10, 7997–8009. doi: 10.5194/acp-10-7997-2010
Vanhellemont, F., Mateshvili, N., Blanot, L., Robert, C. E., Bingen, C., Sofieva, V., et al. (2016). AerGOM, an improved algorithm for stratospheric aerosol extinction retrieval from GOMOS observations - Part 1: algorithm description. Atmos. Meas. Tech. 9, 4687–4700. doi: 10.5194/amt-9-4687-2016
Voigt, S., Orphal, J., Bogumil, K., and Burrows, J. P. (2001). The temperature dependence (203-293k) of the absorption cross-sections of O3 in the 230-850 nm region measured by Fourier-transform spectroscopy. J. Photochem. Photobiol. A 143, 1–9. doi: 10.1016/S1010-6030(01)00480-4
Voigt, S., Orphal, J., and Burrows, J. P. (2002). The temperature and pressure dependence of the absorption cross-sections of NO2 in the 250-800 nm region measured by Fourier-transform spectroscopy. J. Photochem. Photobiol. A 149, 1–7. doi: 10.1016/S1010-6030(01)00650-5
Wayne, R., Barnes, I., Burrows, J., Canosa-Mas, C., Hjorth, J., Bras, G. L., et al. (1991). The nitrate radical: Physics, chemistry, and the atmosphere. Atmos. Environ. 25A, 1–203.
Keywords: absorption cross-section, aerosol scattering, GOMOS, trace gas retrieval, aerosol retrieval, spectral inversion, remote sensing
Citation: Bingen C, Robert C, Hermans C, Vanhellemont F, Mateshvili N, Dekemper E and Fussen D (2019) A Revised Cross-Section Database for Gas Retrieval in the UV-Visible-Near IR Range, Applied to the GOMOS Retrieval Algorithm AerGOM. Front. Environ. Sci. 7:118. doi: 10.3389/fenvs.2019.00118
Received: 28 February 2019; Accepted: 11 July 2019;
Published: 27 August 2019.
Edited by:
Linlu Mei, University of Bremen, GermanyReviewed by:
Irina Alexandrovna Mironova, Saint Petersburg State University, RussiaAlexander Kokhanovsky, Vitrociset, Germany
Copyright © 2019 Bingen, Robert, Hermans, Vanhellemont, Mateshvili, Dekemper and Fussen. This is an open-access article distributed under the terms of the Creative Commons Attribution License (CC BY). The use, distribution or reproduction in other forums is permitted, provided the original author(s) and the copyright owner(s) are credited and that the original publication in this journal is cited, in accordance with accepted academic practice. No use, distribution or reproduction is permitted which does not comply with these terms.
*Correspondence: Christine Bingen, christine.bingen@aeronomie.be